The Changes that Autumn Brings

by Brook Lenker, Executive Director, FracTracker Alliance

FracTracker Alliance Logo

New Logo

FracTracker continues to evolve to meet the growing demands of a nation – and world – confronted with unconventional gas and oil drilling and the accompanying challenges. The summer of 2012 has been a busy one, and while it’s officially ended, it heralded several new beginnings for FracTracker.org.

FracTracker has incorporated and filed for nonprofit status with the Internal Revenue Service.  The organization’s name is the FracTracker Alliance. The word alliance was chosen because it illustrates that we are ‘allied’ in a ceaseless quest with others to obtain, analyze, map, and share insightful and objective information relating to every facet of shale gas activity.  While we appreciate the strong foundation that the University of Pittsburgh provided us, we’re now an independent entity and hope to thrive in service of a public that can benefit from the resources we provide. This change wouldn’t have been possible without the cooperation and affirmation of the Community Foundation for the Alleghenies who is our administrative host or, for the legal junkies, our supported organization. Nor would it have been achievable without the faith and financial support of the Heinz Endowments, an ongoing champion of FracTracker.

A strong organization needs a strong Board of Directors, and we have a winning lineup. John Dawes, Executive Director of the Foundation for Pennsylvania Watersheds, serves as our President. Mike Kane, President of the Community Foundation for the Alleghenies is our first Treasurer. From the gas fields of Colorado, we’ve recruited Judy Jordan to be Secretary, a private consultant with a wealth of experience on shale gas issues and non-profit management. (Update: May 1, 2013 – Judy Jordan no longer serves on our Board of Directors.) Two accomplished researchers, Dr. Ben Stout of Wheeling Jesuit University in West Virginia and Dr. Sara Wylie of Northeastern University in Boston add additional expertise to the inaugural board. Last, but not least, Caren Glotfelty, Director of the Environment Program for the Heinz Endowments, shares her pervasive wisdom as an ex-officio board member.

Accompanying the new board is a new staff – well, sort of. Matt Kelso and Samantha Malone, two stalwarts of FracTracker operations at the University of Pittsburgh have officially moved to the FracTracker Alliance. We’re lucky to have them. Matt is the Manager of Data and Technology, while Sam serves as the Manager of Science and Communications. Karen Edelstein, our multi-skilled liaison representing FracTracker on a contractual basis in New York is now our part-time Program Coordinator in the empire state.  To the west, talented Ted Auch, a soil scientist from Cleveland, joins the team on October 1 as our Program Coordinator in Ohio. I have the pleasure of working with all of them in my capacity as Executive Director. Of course, we all need a place to work, so we have four offices – in Camp Hill, PA; Pittsburgh, PA; Ithaca, NY; and, Warren, OH – from which to serve you.

Our expanding presence outside of Pennsylvania is largely attributable to two new funding partners. The George Gund Foundation and Park Foundation are supporting our activities in Ohio and New York, respectively, and we are very appreciative.

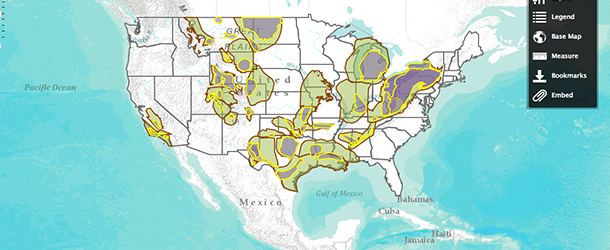
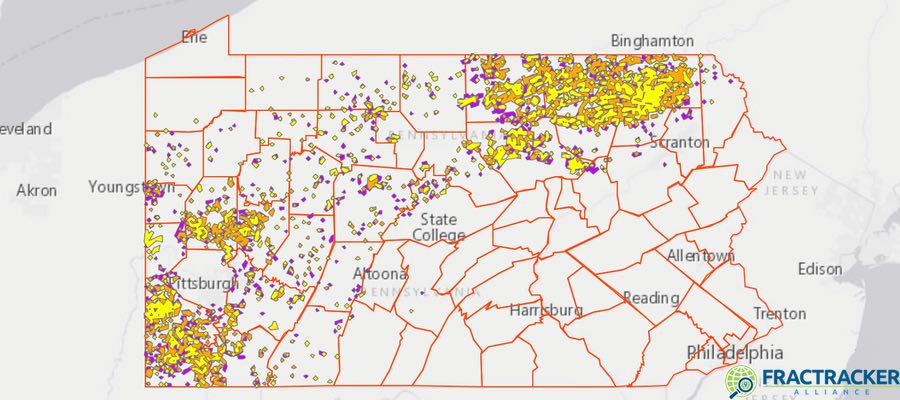
We’re also very excited about the new mapping platform built on Esri technology and described more completely in this separate story. Amongst other benefits, the mapping tool will simplify visualization of the most commonly requested data, initially for Pennsylvania and adjacent states, and eventually other shale gas basins. I think you’re really going to like it!

So autumn has ushered in many changes at FracTracker, but rather than cooling down, things are warming up. Perhaps it is the pace of the work or just the good feeling one gets from collaborating with great people and brave, committed organizations day-to-day. Whatever the cause, know that FracTracker – now FracTracker Alliance – is ramping up capacity to be a more timely and powerful resource… for you.

Unveiling FracMapper, FracTracker’s new mapping system!

Transition to FracMapper

These are exciting times for those of us at FracTracker – now officially the FracTracker Alliance. One of the many changes that we have been working on over the last few months is a new mapping utility for website visitors who want an easy-to-use point and click tool – what we are affectionately calling FracMapper.

FracMapper runs on an Esri-based platform called ArcGIS Online. As those in the GIS world may know, Esri is the largest company in the world that specializes in helping people make maps with GIS technologies. You don’t need to be registered to use FracMapper, although we do highly encourage you to sign up for our monthly e-newsletter, which keeps recipients up-to-date with FracTracker news and information about shale gas.

There are a lot intuitive features available on the new tool as of today’s launch. See the list below for just a few of them. We are also in the process of developing a few more features, including the ability to store and share the data behind the maps. All of this is coming to you this fall as we slowly phase out our existing data/mapping platform (Data.FracTracker.org).

Current FracMapper Features

  • Maps by state: PA, WV, OH, NY, etc. and US-wide
  • Layers as available by state (permits, violations, drilled wells, etc)
  • Search by location
  • Save a location and return to it later
  • Choose which layers you want to show on the map
  • View/hide the legend
  • Zoom or pan the map
  • Variety of base maps available
  • Click on a point or area for more information
  • Read text and brief metadata in the “About” section
  • Scale bar
  • Distance, area, and location measurement tools
  • File downloads
    • Shape file (polygon/lines)
    • CSV – comma-separated values files (points)
  • And many more…

Features in Development

  • Map exporting and printing (added February 2013)
  • Data search (e.g. by permit number)
  • Sticky notes
  • Clip and ship – Will allow for a targeted download of data from a self-designated an area of interest (e.g. Allegheny County)
  • Charting, including within the popup boxes
  • Data storage
  • Additional states, countries, and map layers

Don’t worry! The data focus of FracTracker.org is only going to grow with the implementation of FracMapper. We are designing the new platform to include the capacity to store and share your data. We are hoping to roll out that feature by spring 2013. Contact us with questions: Info@FracTracker.org.

[survey form below closed]

Approaching 10K Unconventional Wells in PA

Spatial Distribution of Unconventional Production in PA

In the first half of 2012, gas production from unconventional sources such as the Marcellus Shale was reported in 30 different counties in Pennsylvania, according to data downloaded from the Pennsylvania Department of Environmental Protection (PADEP) website on September 10, 2012. Of these, 19 counties had aggregated totals of at least one billion cubic feet (Bcf), lead by Bradford (235 Bcf); Susquehanna (189 Bcf); Lycoming (97 Bcf); Tioga (89 Bcf); Washington (79 Bcf); and Greene (74 Bcf). Here are the proportions of those 19 counties presented graphically:

We can also view the data spatially. To find out the production value of any county, please click the blue “i” tool, then any county shown in blue. Also added is the location of the top ten wells in the state in terms of natural gas production for the six month period:

On this view, the top wells are clustered so closely together that there appear to be only four. The top two producers are both operated by Citrus Energy in Meshoppen Bourough, a small town in Wyoming County with 563 residents as of the 2010 Census, and a total surface area of 0.7 square miles. The other eight wells on the list are operated by Cabot Oil and Gas in a handful of municipalities in Susquehanna County. Here is a closer look at the wells, with an additional layer of all unconventional drilled wells:

The wells in red are the same 10 wells, all within 10 miles of one another as the crow flies. The wells in black show the other unconventional drilled wells in the area as of late August. Obviously, this part of the state has been the focus of considerable attention by the operators active in the region.

2012 Health Effects of Shale Gas Extraction Conference

Archived

This article has been archived and is provided for reference purposes only.

Registration Open

Registration is now open for the 2012 Health Effects of Shale Gas Extraction Conference being hosted by the University of Pittsburgh Graduate School of Public Health on November 9, 2012 in Pittsburgh, PA. The process is entirely online this year. Click here to register through the PA Public Health Training Center’s (PAPHTC) website. Registrants must sign up for a user name and password through PAPHTC before registration can be completed.

Speakers

Confirmed speakers include:

  • Dan Bain, PhD — Assistant Professor, University of Pittsburgh, Department of Geology and Planetary Science
  • Michelle Bamberger, MS, DVM — Veterinarian, Vet Behavior Consults
  • David Brown, ScD — Environmental Health Consultant, Southwest Pennsylvania Environmental Health Project
  • Donald S. Burke, MD — Dean, University of Pittsburgh Graduate School of Public Health
  • Leonard Casson, PhD, PE, BCEE — Associate Professor/Academic Coordinator, Department of Civil and Environmental Engineering, Swanson School of Engineering; Secondary Appointment – Associate Professor, Department of Environmental and Occupational Health, Graduate School of Public Health
  • Jeffrey Dick, PhD — Associate Professor and Chair, Department of Geological and Environmental Sciences, Youngstown State University
  • Alexandra Hakala, PhD — Geochemist, National Energy Technology Laboratory, Geosciences Division, Office of Research and Development
  • Elaine Hill — Doctorate student, Department of Applied Economics and Management, Cornell University
  • Jill Kriesky, PhD — Senior Project Coordinator, University of Pittsburgh, Graduate School of Public Health, Environmental and Occupational Health Department, Center for Healthy Environments and Communities
  • Brook Lenker, MA — Director, FracTracker Alliance
  • Robert Oswald, PhD — Professor of Pharmacology, Department of Molecular Medicine, College of Veterinary Medicine, Cornell University
  • Radisav Vidic, PhD — Professor of Environmental Engineering, Civil and Environmental Engineering, University of Pittsburgh

Academic Posters

To support the educational and professional development of students and young professionals in this field, the University of Pittsburgh Graduate School of Public Health is offering 15-20 complimentary posterboard spaces for this year’s shale gas conference. The recipients will be selected by the conference coordinating committee, and each accepted applicant will present during both of the scheduled conference poster sessions on November 9th. Those selected to present their posters are also eligible for one of two monetary awards of $50, which will be presented at the conclusion of the day-long conference. More information

Learn more on the conference website: shalegas.pitt.edu

Pennsylvania Unconventional Waste Data

As we recently learned with unconventional production report, one never quite knows when Pennsylvania Department of Environmental Protection (PADEP) datasets are complete. According to the Post-Gazette, PADEP considers the reports to speak for themselves, and information is shared with the public without preamble or fanfare as it becomes available.  Therefore, we can’t know that self-reported data, in this case unconventional waste report, is ever truly complete.  Hopefully at this point, which is now several weeks after the reporting deadline, we can let the report speak what it will, expecting that further changes will be fairly minor in scope.

In addition to all of that, some oil and gas operators were apparently confused about the difference between gallons and 42 gallon barrels in the past, leading to wildly erroneous reports.  We’ll just have to hope that’s not the case.

First, let’s take a look a the amount of waste produced by type for unconventional wells between January and June of 2012:

And here is the same dataset, arranged to show disposal method (with the waste types grouped together for the sake of simplicity):

Here are the data arranged by operator:

Please note that not all wells that are present on the report are producing waste, or have even been drilled for that matter.  In fact, there is a column in the data where operators can explain why there is no waste being reported.  Here are those results, summarized:

This does not mean, however, that there are 7,994 wells producing waste.  In fact, there are only 5,651 instances of wells reporting at least some amount of one or more kinds of waste, a number roughly in line with the spud count.  This number was actually more than I had expected, since it is known that not all of the spudded (drilled) wells have been put into production, and that reported totals for drill cuttings are remarkable modest for a series of holes in the ground that are roughly between 5,000 and 8,500 feet deep.  The explanation, it turns out, is due to the architecture of the dataset, wherein each line of data is capable of handling only one type of waste, so that wells reporting multiple types of waste must appear more than once.  Therefore, there are not 9,038 wells, or even 5,651.  There are 3,922 unique wells on the report, as counted by the unique well API numbers.  For this reason, in the charts above, it is best to think of the “Wells” columns as “Instances” instead.

It is also probable that different operators report their waste in different ways.  For example, EQT and Chesapeake are both near the top of the list in the amount of barrels of liquid waste produced, but neither one reported any waste that was measured in tons (drill cuttings and flowback fracturing sand).  Without having seen their operations in the field, we must assume that the waste produced is fundamentally similar to that of other operators–perhaps they reported the waste content as a viscous fluid rather than filtering out some of the solids, as other operators seem to do.