Ancient Seas, Modern Ownership Concerns

By Karen Edelstein, NY Program Coordinator, FracTracker Alliance

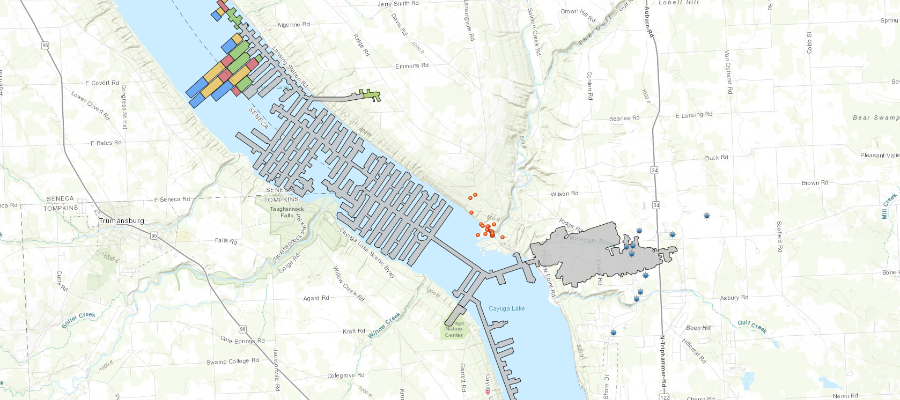
In the Finger Lakes Region of New York State, while the debate rages about underground storage of gas in abandoned salt solution mines near Seneca Lake, the story is quite different to the east at Cayuga Lake. Cayuga has a history of not just solution brine mining, but also extensive mining of solid rock salt. The map below shows the footprint of underground salt mining – room-and-pillar style 2300 feet below Cayuga Lake – by the multinational corporation, Cargill. Mineral rights beneath the lake are owned by New York State, but note that some of the mine also extends underneath privately owned land in the Town of Lansing.


Map of Lansing, NY Cargill Salt Mine. For a full-screen version of this map (including map legend), click here.

About this Map

The interactive map (above) shows the location and extent of the Cargill Salt mine in Lansing, NY. The boundaries of the mine were digitized from a map, Figure 2.3-2, entitled “Plan View of the Cayuga Mine Showing East and West Shoreline Benchmark Locations” from the Spectra Environmental Group, Latham, NY, circa 2004, and another planning document acquired. Here is one of the original maps, and a planning map showing expansion through 2003. An additional map from a Cargill mine expansion permit request, viewed at the DEC headquarters in Cortland, NY, shows additional requested development under residential areas in Lansing. This layer is shaded green.

Questions Abound

The dynamics around salt extraction, and other uses such as gas extraction, raise several questions.

Consider the stratigraphic column of rocks in New York State. The salt layer that is being mined by Cargill is the Salina Group, approximately 2300 feet below the surface. Salt is dug out mechanically, broken up by machinery and explosives to break up the solid layer. The Marcellus Shale (in Lansing) is above that salt layer–in the expanse of Middle Devonian Rocks, while the Utica Shale is below it–part of the Ordovician rock strata. In order to drill into the Marcellus Shale, one would not need to enter the salt layer, although the boundary of rock between the two strata might only be a few hundred feet thick. Reaching the Utica Shale would require piercing the salt layer. The Central New York region is crisscrossed by an abundance of vertical cracks and joints in the bedrock, some of which are thought to be hundreds to thousands of feet long, and may extend to “basement rock”, the ancient rock below the hundreds-of-millions year-old sedimentary layers such as the shale, sandstone, and salt.

Numerous plugged and abandoned salt wells from the days of solution mining–mid 1800s to mid 1900s– are located on and near Salt Point, the delta where Salmon Creek meets Cayuga Lake. As the map shows, the rock salt mining extent is near to, but not in contact with, these old brine wells. The underground shape of the solution wells is not entirely understood, and may be variable due to different rates of dissolution of halite during the extraction process. The rock salt is mined out as a solid, not a a saturated salt liquid that would have then gone through an evaporation process in a giant kiln. Were rock salt extraction to occur too close to the old solution wells and a wall breached, flooding in the current Cargill mine could result.

This would obviously not be good.

(Nor, for that matter, would have been the prospect of storing spent nuclear fuel in the abandoned brine wells, something that was being considered in the mid-1970s. In a 3-volume study of the geology of the Salina Basin (spanning a d-state area), the conclusion made by the Stone and Webster Engineering Corporation1,  consultant to the US Department of Energy, was that no salt mining sites in the Finger Lakes region were appropriate  for nuclear fuel storage without further study of the area’s extensive, but under-studied, faulting patterns.)

What are the implications of other sorts of mineral extraction, in this part of the Finger Lakes Region?

Yours or Mine?

The extent of Cargill’s mining under residential portions of the Town of Lansing provokes several questions. For example, if Cargill has long-term access to these subsurface mineral rights, property owners do not control the land beneath their homes. This is not altogether uncommon in areas of mineral – or oil and gas – extraction. Can that land be leased for gas drilling?

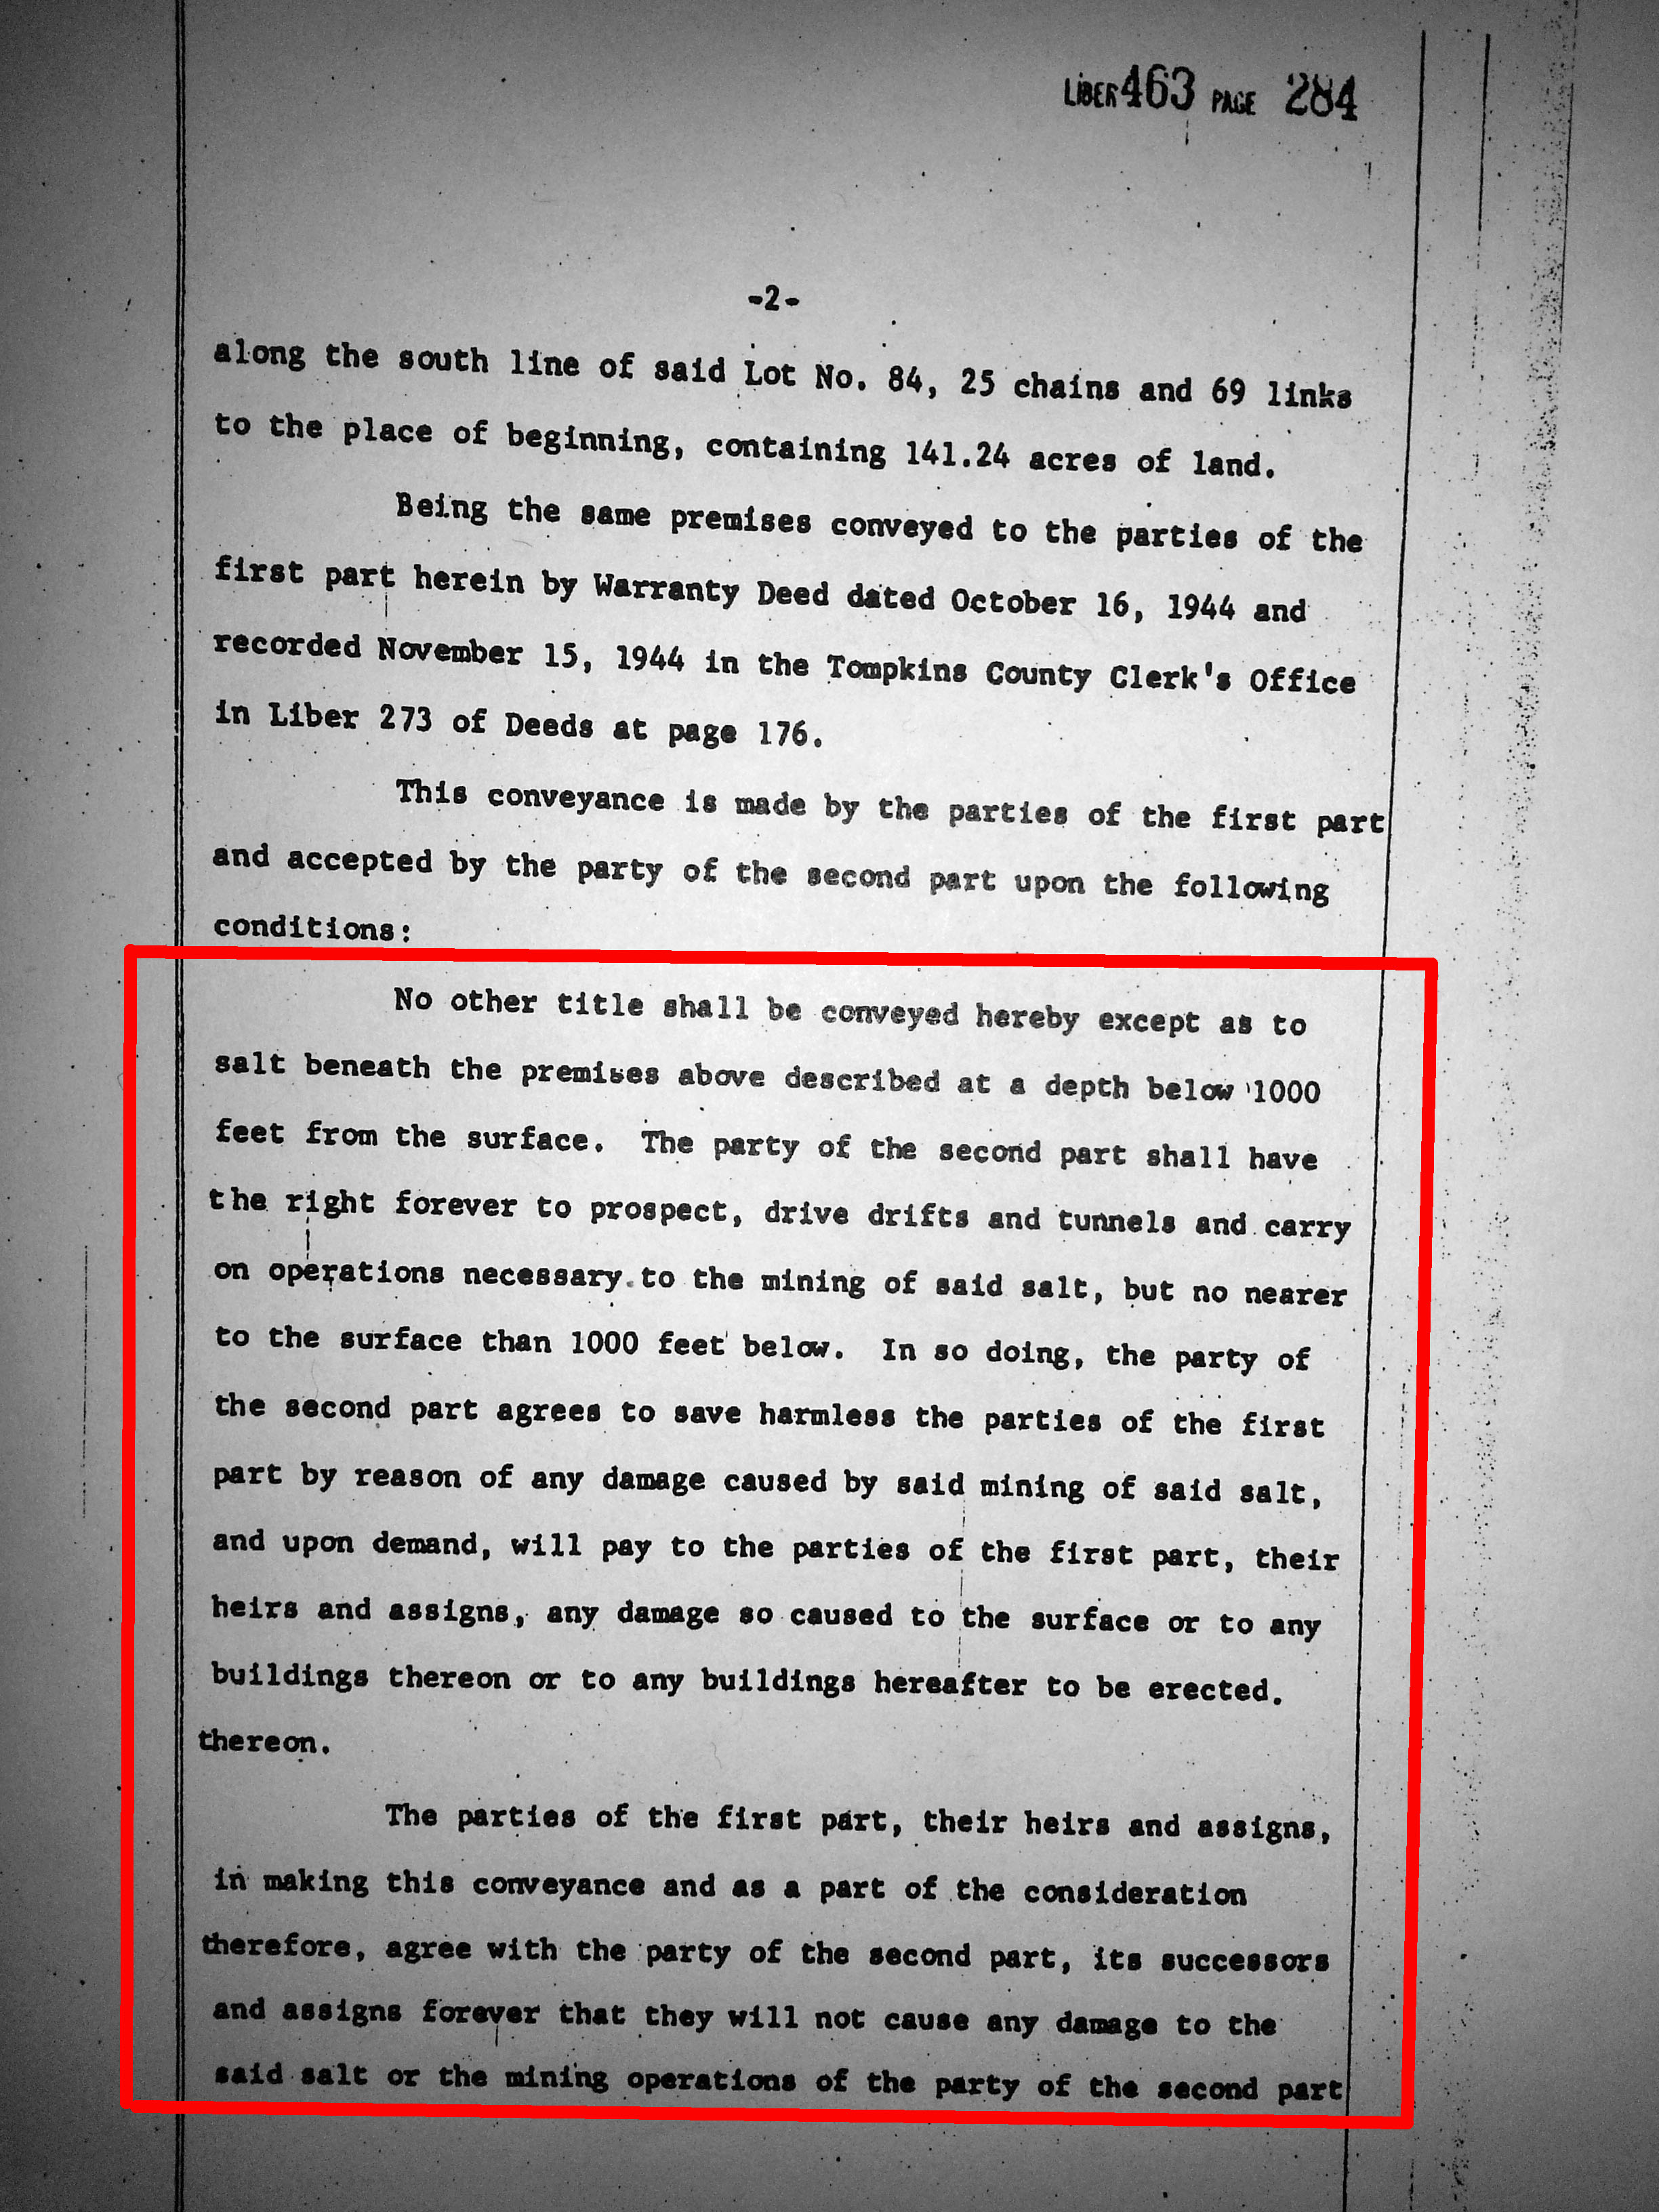
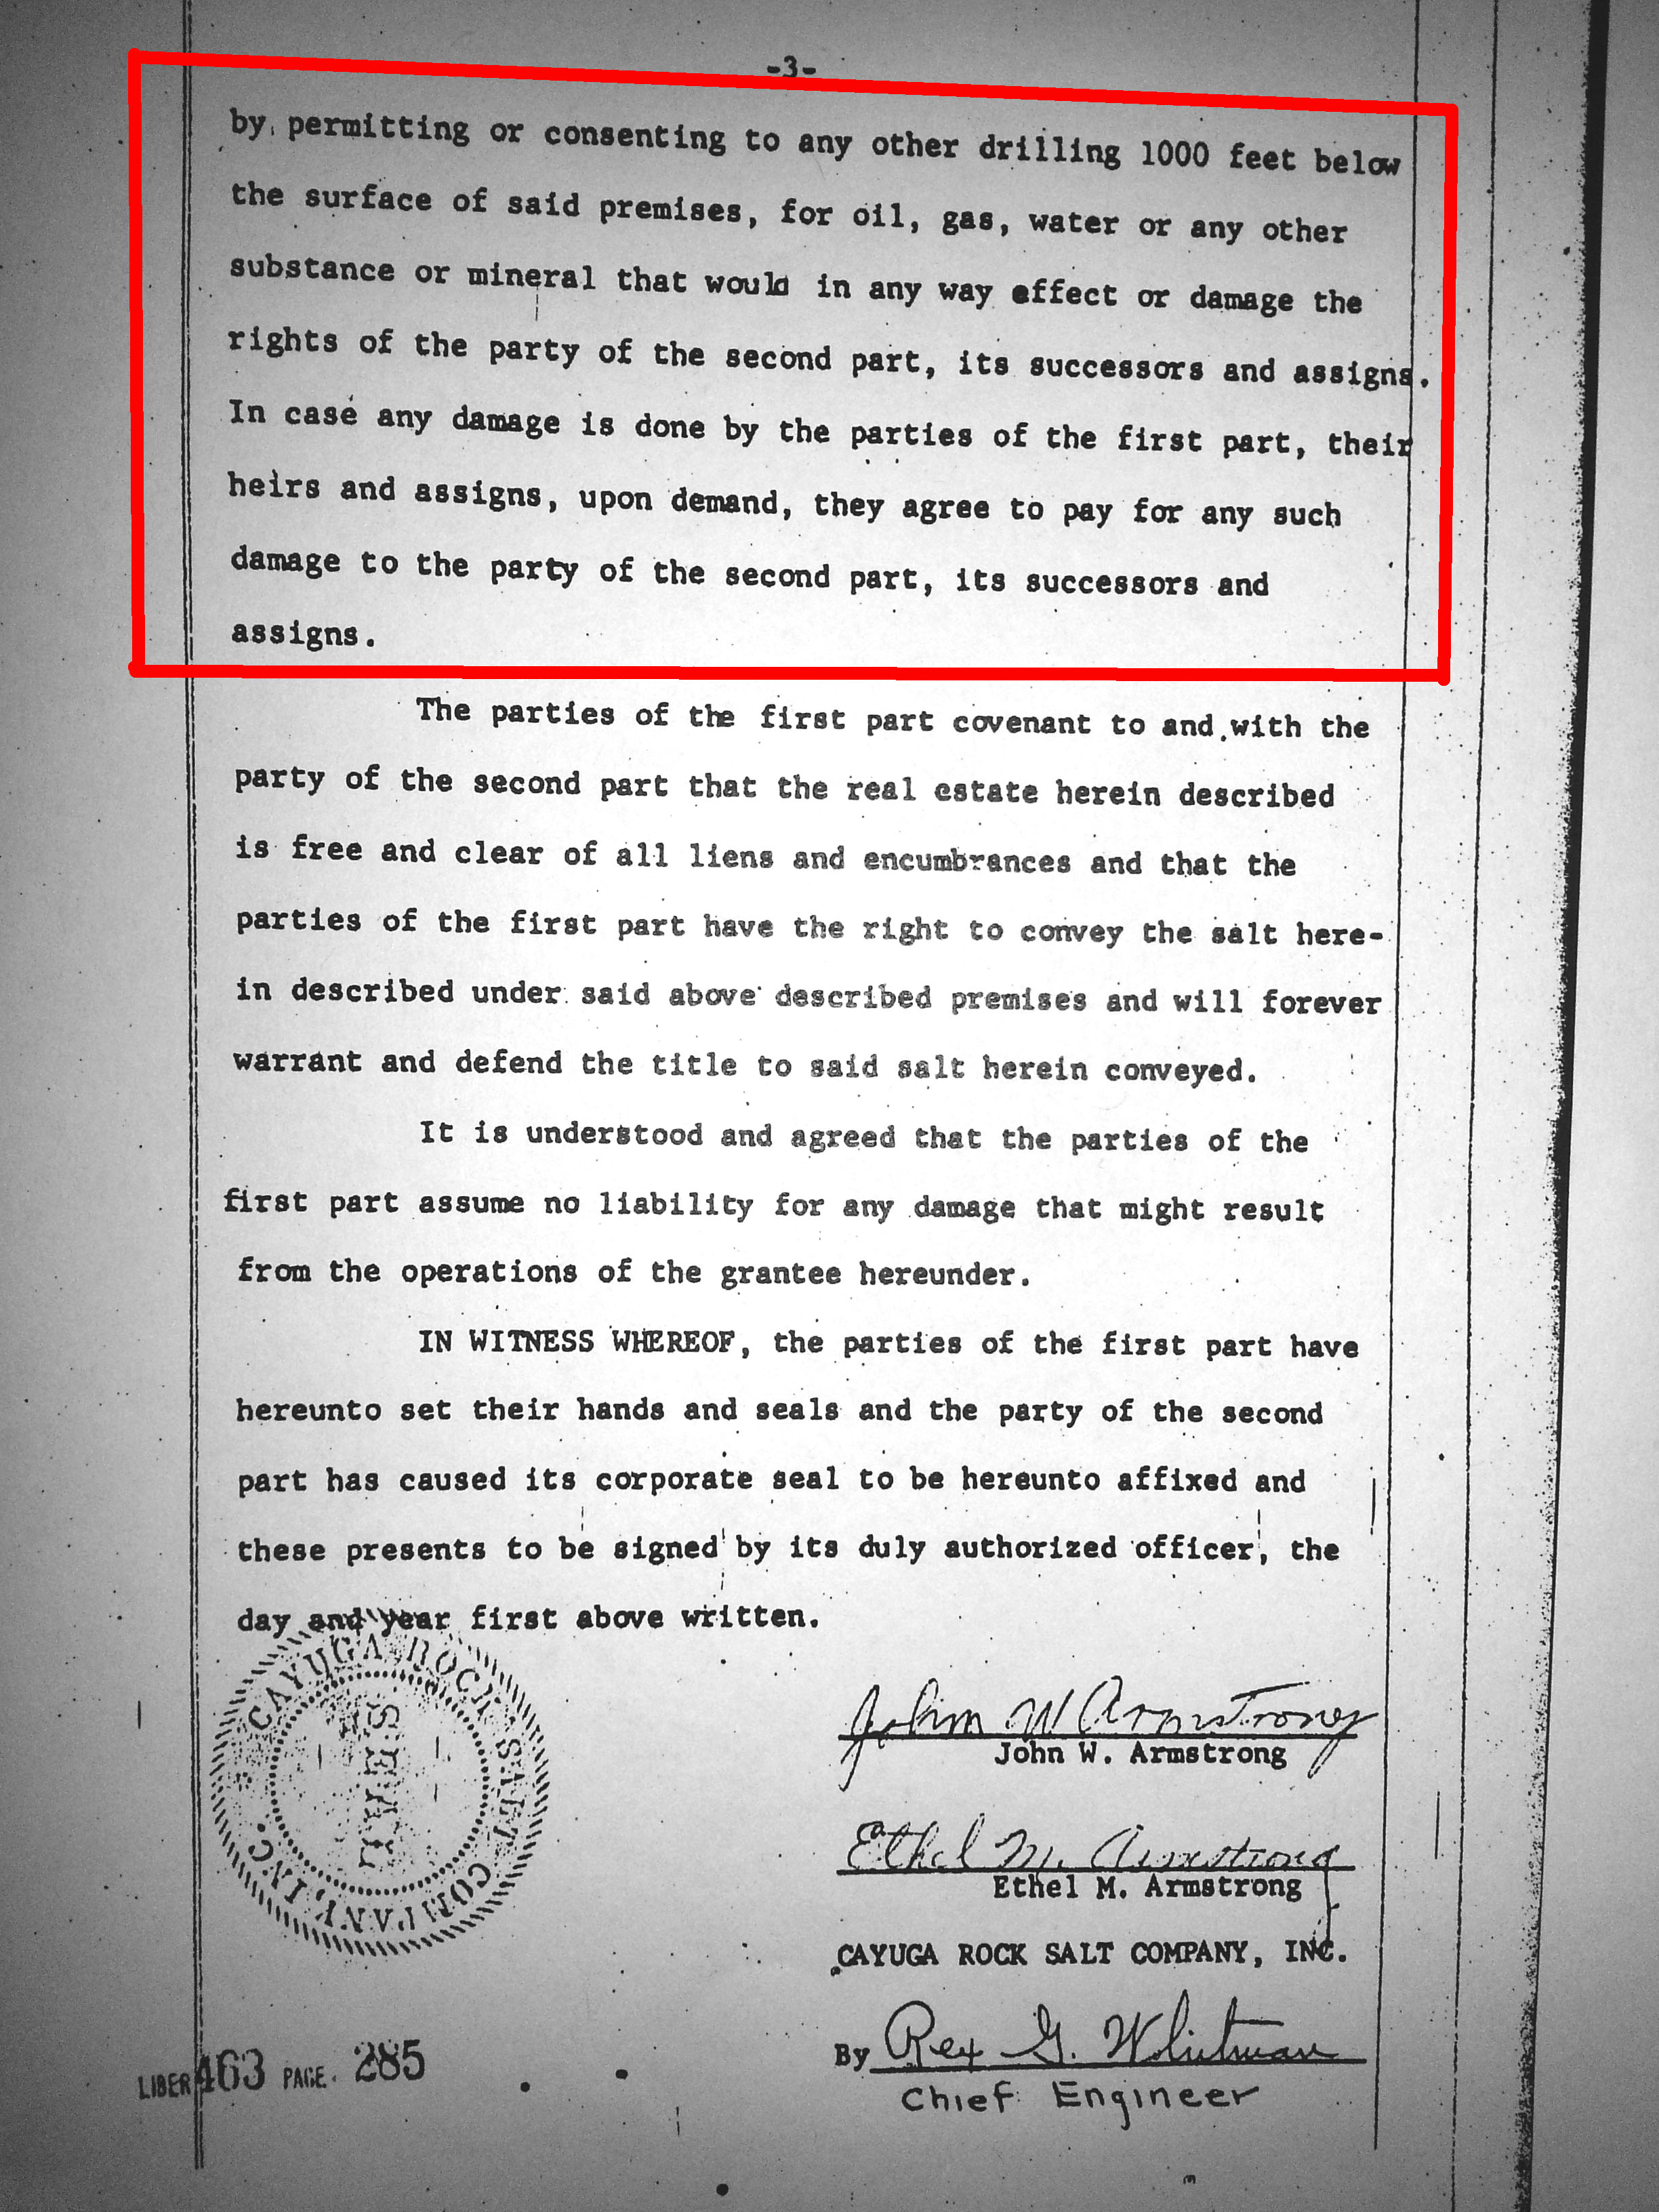
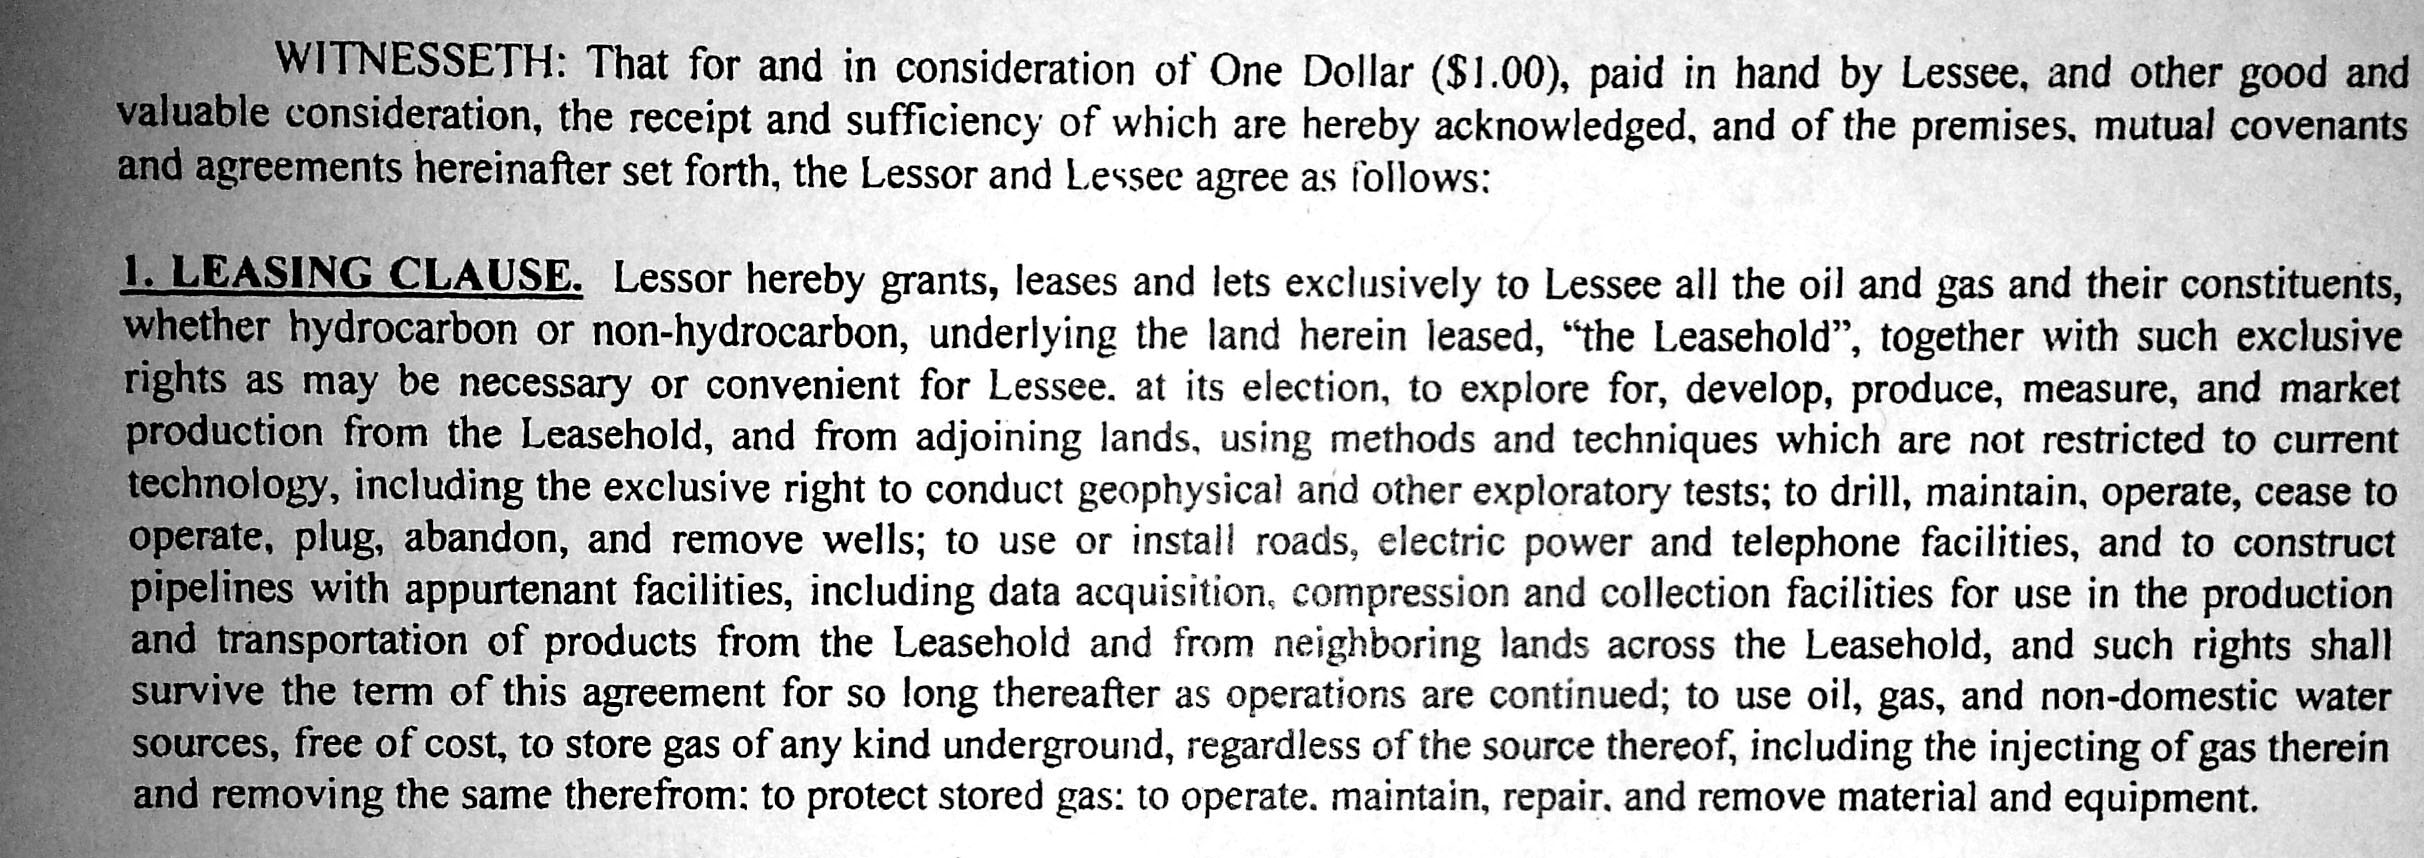
It was revealing to look more closely at records of expired oil and gas leases in the area. During this process, we discovered that within the area that is “claimed” by Cargill for subsurface mineral extraction, numerous surface owners had also leased the gas rights beneath their property (see blue starburst markers on the map)2, even if the property deeds explicitly, for example,  indicated that the property owner “will not cause any damage to the said salt or mining operations [of the party of the second part] by permitting or consenting to any other drilling 1000 feet below the the surface of said premises, for oil, gas, water or any other substance or mineral..” (Tompkins County Clerk, Liber 463, p.284-5).  Here are links to page 2 and 3 of the deed, and the very comprehensive leasing clause of one of these oil and gas leases that permits a wide variety of gas-extraction related activity–both on the surface, and below ground.

Four of the ten leases were on property held by the Town of Lansing itself, and one other was on property owned by a local elected official. While all of these leases expired in 2012, and were never, in fact, drilled (due to the de facto moratorium on HVHF gas extraction in New York), the mash-up of these datasets raises important questions about our permitting structure. The implications of two separate entities claiming overlapping subsurface rights spotlights many questions regarding the oversight and regulation of potentially conflicting uses. Of particular concern are the risks posed by migration of gas through joints and fissures in the bedrock that are further weakened by hydraulic fracturing – and the potential for methane explosions3 in salt mines, whether or not a well shaft penetrates the salt gallery.

For more details on operations at Cargill’s Lansing mine, see this article from The Lansing Star, September 2012: Lansing Down Under: A Look at the Cargill Salt Mine.

References

  1. Regional Geology of the Salina Basin, Report of the Geologic Project Manager
    Volumes 1 and 2, Phase I, August 1977-January 1978, and Volume 3 Update, October 1979. Prepared by Stone and Webster Engineering Corporation for the Office of Nuclear Waste Isolation, Battelle Memorial Institute, Project Management Division, US Department of Energy.
  2. Map of Gas Leases in Tompkins County
  3. Cargill Incorporated Belle Isle Salt Mine Explosion (1979)

Western States: Please Abandon the PLSS!

By Matt Kelso, Manager of Data and Technology

Increasingly, the FracTracker Alliance is asked about oil and gas extraction on a national scale. To that end, we are in the process of developing a national dataset of oil and gas wells. Since the data is curated at the state level, it is a challenge to get consistent data formatting from state to state. However, most states at least have the decency to release their location data in decimal degree (DD), that familiar format of latitude and longitude values where users of the data don’t need to calculate the location using three different columns of degrees, minutes, and seconds (DMS).

For example, a DMS point of 45°12’16.4″N, 95°55’12.5″W could be written more tidily in DD as 45.204556, -96.920139. Two numbers, one discrete place on the globe (a random point in rural South Dakota, as it turns out).

Here is how that same location is properly designated using the Public Land Survey System:  “NW 14 T120N R51W Fifth Principal”

Public Land Survey System.  Image from National Atlas

Fig. 1 Public Land Survey System. Source: National Atlas

In English, that is the northwest quarter of Section 14, Township 120 North, Range 51 West Fifth Principal. If we wanted to, the quarter section could itself be split into four quarters, and each of those units could be split again, resulting in, for example the SE quarter of the NE quarter of the NW quarter of section 14, Township 120 North, Range 51 West Fifth Principal (See Fig. 1).

To the uninitiated, the PLSS is a needlessly complex system of describing locations in the American West that was devised by Thomas Jefferson to grid out the wild American frontier.  As such, it is not altogether surprising that it became the legal definition of place in many western states.

What is surprising is that the system is still in use, at least to the exclusion of other systems.  Many states release oil and gas data with multiple geographic systems, including the PLSS, State Plane, UTM, and decimal degrees.  This is an acceptable approach, as it caters to cartographers using technology ranging from the eighteenth through twenty-first centuries.

Accuracy Issues

My issue with the PLSS isn’t just that it is annoying. PLSS data are readily available, after all. Differing formats of the various data attributes can be worked out. However, there is inherently an accuracy issue with a system that uses a predefined area to define a point location. If you wanted to use it to describe an area such as a well pad, it is entirely possible that a typical drilling site might straddle four different sections, let alone quarter-quarter-quarter (QQQ) sections. For that matter, well pads could easily span multiple township and range designations, as well.

PLSS sections in New Mexico

Fig. 2 PLSS sections in New Mexico

Statewide shapefiles that are as detailed as sections are quite large, and are the most detailed data that most data sources offer. This means that the best we can usually do with well data published in PLSS is draw the well at the centroid, or geographical center-point of the section, which in theory is one square mile. Given that the hypotenuse of a square mile block is 1.44 miles, the distance from the centroid to any of the corners is 0.72 miles, or about 3,800 feet, which is the potential error for mapping using PLSS section centroids. While that lack of accuracy is unsatisfying for the FracTracker Alliance, the whole system is a potential nightmare for first responders, in an industry where serious things can go wrong.

In some states, the entire land areas were never even gridded out. New Mexico, for example, has Native American reservations and extensive lands grants that were issued when the region was under Spanish and Mexican control (Fig. 2).

On top of all of that, those square mile sections are not always square. These sections are based on field surveys that were mostly conducted in the 19th century. Walking straight lines in rough terrain isn’t actually all that easy, and in many cases, areas with ferrous deposits in the soil can interfere with the functionality of a magnetic compass.  If we take a closer look at the New Mexico sections map (Fig. 3 below), we can see that error is significant.

Moving Forward

Areas in green show PLSS Sections in North-Central New Mexico.  Areas in white were not gridded out as a part of the survey.

Fig. 3 Areas in green show PLSS Sections in North-Central New Mexico. Areas in white were not gridded out as a part of the survey.

Luckily, we live in an age where technology makes Thomas Jefferson’s valiant attempt at a coordinate system obsolete.  Decimal degree is a format that is well understood by GPS devices, Google Maps, sophisticated GIS software, and for the most part, the general public.  For mapping purposes, decimal degree is so easy to use and so widely established that other systems, especially the PLSS, come across as needlessly opaque.

This situation is not even analogous with the United States’ famous reluctance to embrace the metric system.  It takes some adjustment for people to start thinking in terms of kilograms and meters instead of pounds and feet. PLSS isn’t remotely intuitive as a coordinate system, even among those who use it all the time.  It’s time to abandon this as a way of conveying location.  I’d like to think that Thomas Jefferson, as a forward-thinking individual, would agree.


Portage County, OH Mountaineer Keystone Proposal

Ohio has seen its share of unconventional natural gas extraction in recent years. Now, the state is facing an influx of pipeline infrastructure to manage and distribute the extracted gas. In Portage County, OH, Mountaineer Keystone is of particular interest. FracTracker Alliance and Concerned Citizens Ohio have worked together to better understand the nature and extent of this activity.

Proposal Details

By Gwen Fischer and Trish Harness, Concerned Citizens Ohio, Portage County; Map by Ted Auch

Mt. Keystone will not invest in pipeline easements unless they believe their Return On Investment (ROI) will be great, so we expect them to drill intensively in the areas with many parcels leased and to link those parcels with pipelines wherever they have easements. They may also be seeking new pipeline easements.

Leases and easements are legal documents, and the details (how deep, placement, etc.) are critical to understanding what the industry is allowed to do on the land. Drilling companies don’t always go door to door to get a new lease. Door-to-door “landsmen” need only approach previously unleased properties. If the old lease was open-ended, a drilling company may be able to obtain a permit to drill a deeper well without negotiating new terms. If the lease was restrictive, the drilling company may need to negotiate to put a deep shale well pad or other “surface disturbance” changes not specified earlier. Without examining each lease individually, the map below cannot tell us what exactly is permitted, or where on the property. In addition, landowners should know that (depending on the terms of the lease) leases can be purchased without the owner’s knowledge. Thus, the owner may think they know the drilling company or the oil/gas production company they are dealing with, when in fact the ownership of the drilling or production well has changed.

Another item that the public should be aware of is that obtaining leases for mineral rights does not automatically grant rights for pipeline easements, but the leases could be written so as to allow for both drilling and pipelines.

The easements with Mt. Keystone are for water and waste flowback – but (given some pipeline easements we’ve seen with other companies) it is possible the pipelines could (will) be “re-purposed” for production from shale wells on the leased lands, once the wells are drilled. Even more open-ended options are possible.

About the Map

This map shows land parcels with publicly recorded mineral rights leases (for drilling) and Right of Way (ROW) easements for pipelines registered under Mountaineer Keystone’s name. No other company that might hold easements or leases is included. The map was created using public records, available on the Portage County Recorder’s and the Portage County Auditor’s websites. We utilized the raw and updated Portage County parcel shapefile and identified parcels using dummy variables with -1 identifying Mt. Keystone’s leases (825 parcels, 6,455 total acres, average 8 acres), 1 representing Mt. Keystone Right of Ways (ROWs) for pipelines (132 parcels, 2,837 total acres, average 22 acres), and 0 representing neither. Additionally, 14 of these parcels fall under those that have leases and ROWs (353 acres, average 25 acres)**.

Click on the arrows in the upper right hand corner of the map for the legend and to view the map fullscreen.

Well information comes from ODNR (Ohio Department of Natural Resources) data on their website . All of Portage county was checked for leases or easements, and this represents all of the townships and about half of the actual leases.
New mineral rights leases are parcels where a high volume, horizontal shale (HVHS) production well may be drilled, or the horizontal “laterals”may be drilled under the land. The three existing HVHS wells and their laterals are shown. ROW easements are for pipelines. A few parcels have both easements and leased mineral rights. Since permits for future wells have not yet been applied for, we cannot know exactly where on any parcel a well pad or the laterals will be drilled. Properties with leases for wells already drilled are included. Without examining individual easements, we cannot know exactly where on a parcel pipelines will be laid.

** Recently we added 103 parcels from Geauga County parcels that Mountaineer Keystone purchased from Excalibur Oil within the proposed ROW. These parcels total 1,843 acres with a range of 0.45 to 117 acres and a mean of 18 acres to date.

Oil Drilling’s Impact on ND Communities

By Thomas DiPaolo, 2013 GIS Intern, FracTracker Alliance

ND Shale Viewer

ND Shale Viewer

Out of North Dakota’s 53 counties, 19 are responsible for producing the oil and natural gas that has brought the state so much prosperity and attention. It’s the latest get-rich-quick scheme, and one that works better than that name would suggest: drive to North Dakota, work in the oil fields for six months, and go home with enough money to find something more permanent. This means that some of the quiet towns overlying the Bakken formation are exploding in size, and many of their new residents lack any connection to these communities when they’re off duty. In the past, similar population booms have been tied to a corresponding increase in crime rates and drug usage, and FracTracker Alliance has examined the available data to find out how much life has changed in North Dakota since the oil started to flow.

Housing Availability

There’s a reason why the you have to drive to North Dakota if you want to stay in the black, and it helps if you’ve got a comfortable car.

Perhaps the biggest problem here, perhaps a cause of others, is that there is simply not enough housing for everyone who wants to work in North Dakota. Trailer parks pack every available inch of space for families from out of state prepared to settle in, becoming themselves towns in miniature, and one of the benefits to consider when working for one oil drilling company over another is to find out which ones are constructing dedicated worker housing and amenities. Familiarity doesn’t fail to breed contempt; demand for living space is so high, in fact, that families who have lived in these towns their whole lives are being forced out as rent prices rise without end. Meanwhile, many have taken to simply sleeping in their cars, and tensions have grown as stores forbid them from parking overnight in their lots.

Crime

With the number of people moving into the state to work in the oil fields, or in industries that support them, North Dakota’s population reached 699,628 in 2012, a jump from the 642,200 people of 2000. More people, of course, means greater effort required to keep the peace – The number of law enforcement officers accordingly jumped from 967 in 2000 to 1,253 in 2012. At first glance, one might think that did the job, since the crime rate fell from 2,203 index crimes1 reported per 100,000 people to 2,122 per 100,000 people, and the number of arrests per officer stayed constant (3.1 in 2000, 3.0 in 2012). That conclusion doesn’t hold up well when you look at how crime has fluctuated within the oil-producing counties.2 The population there has risen to 183,940 people, from just 167,515 people in 2000, and it currently employs 379 law enforcement officers, up from 250 officers. In 2000 the crime rate was already in excess of the state average at 1,582 index crimes reported per 100,000 people and 8.3 arrests per law enforcement officer. By 2012, those figures reached 1,629 crimes per 100,000 people and 12.8 arrests per officer. With only a quarter of the state’s population, the crime rate is three-quarters of the state average. This upswell applies especially to violent crimes. Violent crime reports, numbered at 558 statewide in 2000, nearly tripled to 1,445 in 2012; in the oil counties, they more than tripled from 103 to 363 crimes reported. That number carries through in the crime rate figures; statewide, 206.5 violent crimes occurred per 100,000 people in 2012, while only 86.9 crimes were reported per 100,000 people in 2000; in the oil counties, 197.3 violent crimes were reported per 100,000 people in 2012, compared to only 61.5 violent crimes per 100,000 people in 2000. See Table 1 for a comparison of total and violent crimes between the year 2000 and the year 2012.

Table 1. Crime rates per 100,000 people in North Dakota (2000 vs. 2012)

Total Index Crimes Violent Crimes
Statewide Oil Counties Statewide Oil Counties
2000 2,203 1,582 86.9 61.5
2012 2,122 1,629 206.5 197.3

Where the line blurs is in addressing property crime. Until 2009, there had been a steady decline in the rate of property crime. Since then, however, it has been increasing every year, even if the 2012 figures are still beneath those of 2000. Statewide, the number of property crimes hovered at 13,592 reported crimes in 2000 and 13,402 in 2012, while in the oil counties they rose slightly from 2,547 property crimes in 2000 to 2,634 crimes in 2012. At the same time, the property crime rates fell both statewide (2,116 crimes per 100,000 people to 1,916 per 100,000 people) and in the oil counties (1,529 crimes per 100,000 people to 1,486 per 1000,000 people).

Prostitution

When you have that many single young men together, as so many of the oil field workers are, a market inevitably springs up for very particular crimes. Prostitution stings consume a greater quantity of police time than ever before, with some ND counties reporting their first prostitution arrests ever. In many cases, the suspects in these cases demonstrate a similar attitude to the oil workers they court: stay for a brief period (typically days rather than months), make enough money to support themselves, and keep going out of town. Officers often say that these cases are risky, as they require enough evidence to prove the intent of both parties to exchange money for sex. Without an undercover officer to carry out a sting, many cases could be accused of discrimination, especially in cases where race may be an issue. In other situations, sting operations have provided evidence of drug activity in addition to prostitution.

Drug Use

Juvenile Alcohol Use

In addition to the oil boom, North Dakota has the uncomfortable claim of being one of the nation’s leaders when it comes to binge drinking. It’s notable then to see that, while juvenile3 alcohol use has fallen drastically across the board, juveniles are developing more permissive attitudes towards alcohol use. Between 2000 and 2011, the number of juveniles who reported using alcohol within the previous month fell from 18,000 to 7,000, and it fell from 11,000 to 4,000 juveniles in regards to binge drinking4 on a weekly basis. At the same time, the number of juveniles showing signs of alcohol dependence or abuse fell from 6,000 to 2,000, and those described as needing but not receiving treatment for alcohol abuse fell from 5,000 to 2,000. Yet only 17,000 juveniles reported perceiving great risk from said binge drinking in 2011, where 22,000 had reported perceiving great risk in 2000. Why are more juveniles rejecting personal alcohol use while becoming less concerned with others’ usage?

Adult Drug & Alcohol Use

Whatever the reason, adult alcohol usage has demonstrated the opposite trend: more people are drinking but fewer enjoy it. Between 2000 and 2011, the number of adults using alcohol monthly rose from 286,000 to 320,000, and those binge drinking weekly rose from 144,000 to 165,000. The number of adults perceiving great risk from weekly binge drinking also rose from 173,000 to 183,000, but the number with signs of alcohol dependence or abuse rose from 33,000 to 47,000. Interestingly, the number of adults described as needing but not receiving treatment for alcohol use has barely changed in this time; 46,000 adults were characterized this way in 2000, as opposed to 45,000 of them in 2011.

Smoking and Marijuana Use

The one trend shared between both juveniles and adults is a steady increase in the number of people expressing permissive attitudes towards the use of marijuana. In 2000, 4,000 juveniles and 13,000 adults reported using marijuana within the previous month; by 2011, only 2,000 juveniles reported using marijuana within the previous month, but the number of adults doing so had jumped to 23,000. At that time, only 17,000 juveniles and 171,000 adults reported perceiving great risk from the use of marijuana on a monthly basis, down from 25,000 and 213,000 respectively in 2000. These figures come at a time when other forms of smoking are becoming less popular across the U.S. In 2000 in ND, 16,000 juveniles were using tobacco products on a monthly basis, and 13,000 were using cigarettes specifically; those numbers had fallen to 6,000 and 5,000 juveniles respectively by 2000. Even among adults there were small declines over this time period: 154,000 adults were using tobacco monthly in 2011 as opposed to 161,000 in 2000, and 121,000 adults as opposed to 128,000 were using cigarettes. And while the number of juveniles perceiving great risk from pack-a-day smoking fell from 38,000 to 32,000 between 2000 and 2011, while 346,000 adults perceived great risk from it in 2011, as opposed to 315,000 in 2000.


Footnotes

  1. According to the Crime and Homicide Reports of the North Dakota Attorney General’s office, index crimes are reported to the National Uniform Crime Reporting program managed by the Federal Bureau of Investigation in order to broadly describe the level of criminal activity around the country. They are divided into two categories, violent and property-related. The violent index crimes tracked by North Dakota are murder and non-negligent manslaughter, forcible rape, robbery, and aggravated assault. The property index crimes tracked by the state are burglary, larceny and theft, and motor vehicle theft.
  2. The North Dakota Association of Oil and Gas Producing Counties lists the following counties as its members: Adams, Billings, Bottineau, Bowman, Burke, Divide, Dunn, Golden Valley, Hettinger, McHenry, McKenzie, McLean, Mercer, Mountrail, Renville, Slope, Stark, Ward, and Williams.
  3. The National Surveys on Drug Use and Health define a “juvenile” as any person between the ages of 12 and 17 years, and an adult as any person aged 18 years or older.
  4. The National Surveys on Drug Use and Health define “binge drinking” as consuming five or more alcoholic beverages in one sitting.

Ohio Production and Injection Well Firms Map

Our latest Ohio-focused map shows the many companies involved in directional drilling in the state and the contact information for these firms.

Layer Descriptions

1. UNIVERSAL WELL SERVICES

Universal Well Services Inc. is a major firm involved in all manner of directional drilling services with an office in Wooster, OH, one in Allen, KY, six in Pennsylvania, six in Texas, and one in West Virginia

2. LLC & MLP’s

This is an inventory of 410 Ohio directional drilling affiliated LLC and MLP firms and contact information. Seventy-eight percent of these firms are domiciled in Ohio. The other primary states that house these firms are Pennsylvania (22), Texas (23), and West Virginia (9). The Economist wrote of these types of firms:

The move away from the C corporation began in earnest in 1975. Wyoming, that vibrant business hub, adopted a new entity structure, the limited-liability company (LLC). Imported from Panama, it provided the tax treatment of a partnership while preserving the corporate protection from individual liability for company debts and litigation. Other states followed in adopting the model. Businesses were quick to see the advantages. The various new types of firm that have risen in the wake of the LLC… make similar use of partnership structures. They have tended to be industry- or sector-specific, at least to begin with. The energy business has a lot of MLPs not only because it needs capital but because it is an easy place to set them up: since 1987, tax law has allowed “mineral or natural resource” companies to operate as listed partnerships, while withholding that privilege from others. But as with other pass-through structures, the constraints are being lowered and circumvented.

3. DRILLING FIRMS

This is an inventory of 393 Ohio Department of Natural Resources permitted directional and injection drilling firms with single locations and their contact information. Seventy-six percent of these firms are domiciled in Ohio with the other primary states of incorporation being Pennsylvania (15), Texas (14), Michigan (11), and West Virginia (9). Only 3 of these firms listed in the Ohio RBDMS Microsoft Access Database contained correct contact information or addresses. According to ODNR staff – and primary FOIA contact:

… it looks like the [active drillers] list [doesn’t contain] much information on the companies in general…We have mailing information for the operating companies, but a lot of the time they subcontract out to get their drillers. We do not require the information of the drillers they contract.

4. ADDITIONAL DRILLERS

This is an inventory of the 40 known locations for six firms permitted to drill in Ohio. The same lack of contact and address data for these firms were true for this data. The primary firms are Butch’s Rathole and Nomac Drilling Corporation. Given that the ODNR RBDMS does not indicate the actual location from which these companies migrated into the Ohio shale industry we decided to include all known locations for these firms.

5. CANADIAN FIRMS

This is an inventory of the 14 known locations for the 5 Canadian drilling firms permitted in Ohio. The primary firm is Savannah Drilling, which is composed of 10 locations across Alberta and Saskatchewan.

6. AMERICAN SUPPORTING CO.

This is an inventory of 1,837 Ohio energy firms operating in the Utica and Marcellus shale or servicing it in a secondary or tertiary fashion. Seventy-five percent (1,386) of these firms are domiciled in Ohio with secondary hotspots in Texas (76), West Virginia (65), Pennsylvania (49), Michigan (34), Colorado (27), Illinois (22), Oklahoma (21), California (16), New York and New Jersey (27), Kentucky (14).

7. ADDITIONAL SUPPORTING CO.

This shows an inventory of 10 Ohio energy firms operating in the Utica and Marcellus shale or servicing it in a secondary or tertiary fashion extracted from the ODNR RBDMS that did not contain locational or contact information.

8. CANADIAN SUPPORTING CO.

This is an inventory of 5 (1 company Mar Oil Company was not found) Canadian energy firms operating in the Utica and Marcellus shale or servicing it in a secondary or tertiary fashion.

9. BRINE HAULERS

This is an inventory of 505 ODNR permitted brine haulers active in the transport and disposal of hydraulic fracturing waste either via injection or waste landfill disposal. Seventy-six percent of these firms are domiciled in Ohio with the primary cities being Zanesville (18), Cambridge, Wooster, and Millersburg (12 each), Canton and Marietta (11 each), Columbus (9), Jefferson (9), Logan (8), and North Canton and Newark (7 each). Pennsylvania and West Virginia are home to 84 and 32 brine haulers, respectively.