Geopolitics, Shale Gas, and Pipelines
By Ted Auch, OH Program Coordinator, FracTracker Alliance
The “Why?”
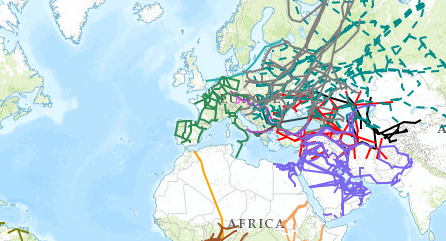
Recently, the US has proposed to ship American shale gas abroad to buffer Europe’s 15-30% reliance on Russian gas imports in the face of the annexation of Crimea by Russia – and parallel 80% increases in LNG prices paid by Eastern Europeans to Russia’s Gazprom. The FracTracker map below illustrates all proposed and existing hydrocarbon pipelines across South America, Africa, Europe, the Persian Gulf, and Asia/Russia1. Creating such a map seems the least we could do given that this conflict has been called the “worst crisis with the West since the end of the Cold War.” The situation in Crimea is a chronic crisis; folks like Oxford University’s Jonathan Stern have suggested:
- Ukraine owes Gazprom $2 billion for already delivered hydrocarbons,
- Russia can easily turn their supplies to Japan which will pay a premium relative to what they are getting from the European Union, and
- The duration of European oil and gas contracts with Gazprom, which extend 15-35 years, can’t be broken (Einhorn, 2014; Henderson and Stern, 2014).
The rhetoric framing here in the US has been lead by – and regurgitated by media outlets such as NPR who suggested “Putin Could Send Europe Scrambling For Energy Sources” – the likes of the Council on Foreign Relations Richard Haass and the Brookings Institution’s Bruce Jones. Both of these entities have the ears of congress domestically and global decision makers at gatherings such as the World Economic Forum in Davos, Switzerland (Gwertzman, 2014; Wade and Rascoe, 2014).
Stepping up hydrocarbon and extraction technologies is not universally espoused:
This is not an immediate-term solution. It’s not even an intermediate-term solution. – Paul Bledsoe, German Marshal Fund, in The New York Times
Fracking is unlikely to reduce gas prices to the extent its proponents desire. – London School of Economics (LSE) (Krauss, 2014; McDonnell, 2014)
Originally, shale gas production was proposed as a way for the US to become “energy independent,” but the dogma has rapidly and in a coordinated fashion shifted to the export of shale gas itself and the technology used to get it out of the ground. This rhetoric is now the focus not just of Washington, DC think tanks but academics (Bordoff, 2014) .

Figure 1a) Global CO2 Per Capita Emissions (Tons) Vs Per Capita Gross Domestic Product (GDP) (US $)
The above regions are ripe for – or currently experiencing – significant political uprisings from the Niger Delta and Venezuela to the percolating anger associated with increasing economic stratification and political elite disconnect in countries like Saudi Arabia, Libya, Yemen, Pakistan, Mediterranean Africa writ large, Sudan, and Oman2. Often this discontent is emanating out of citizens’ concerns as to where oil revenues are going and how often the hydrocarbon largesse is concentrated in a handful of political elites and/or oligarchs (Nossiter, 2014). The EIA estimates Russia and China sit atop an estimated 107 billion barrels of shale oil and 1,400 TCF of shale gas. Much of this resource will be required if they are to continue > 2-5% Gross Domestic Product (GDP) growth. The remainder they will undoubtedly use as a cudgel to deflect the west’s suggestions and/or demands within their borders or their “near abroad.” In the case of Russia, the “near abroad” generally refers to the eight former Communist pliable nations – and are incidentally home to nontrivial shale oil and gas reserves – that act as a physical and ideological buffer between them and NATO/European Union states. In an effort to combat the asymmetric hydrocarbon supply and demand issues and secure access to the sizable shale reserves in eastern Europe, the European Union continues to push the European Neighborhood Policy meant to create a “ring of friends”3 – with Ukraine just the latest significant test and the only successes being Tunisia and Moldova (Charlemagne, 2014). With respect to China, their “near abroad” nations include shale oil and gas rich nations like Indonesia, Thailand, Myanmar, Cambodia, and Vietnam, along with ex-Soviet region Central Asian countries which provide China with 80% of its natural gas needs. However, the east-west tug of war has come down to the willingness of the east to offer larger instant loans, cheaper gas, and labor/technology needed to develop pipeline networks. The nexus between these two eastern giants is the proposed – and recently agreed upon – $400 billion Sino-Russian energy cooperation natural gas and oil pipeline. This proposal will stretch across heretofore relatively undisturbed and isolated communities and the ecosystems they have evolved with across the Eurasian Steppe and Siberia (Einhorn, 2014).

Figure 1b) Global CO2 Per Capita Emissions (Tons) Vs Oil Consumption Per Day (Barrels) across 204 countries
The fomenting anger and geopolitical combativeness that result from these conditions put the global hydrocarbon transport network at risk. Analogies to R.A. Radford’s The Economic Organization of a P.O.W. Camp can be made here, where the economy that Mr. Radford created flourished until the input stream from the Red Cross stopped. It was at this time that the economy collapsed due to its singular reliance on one input source. Similar analogies exist across emerging, P5+1, and frontier markets worldwide, with many countries largely dependent upon hydrocarbon imports or exports to stoke GDP. Such imports, along with oil consumption, account for 98% of per country CO2 emissions (Table 1 below, Figure 1a-b). Revolution or even temporary and targeted political instability will fuel the type of hydrocarbon transport/production disruption that will produce the kind of jump condition described by Mr. Radford. A jump condition occurs in situations when suitable hydrocarbon stocks/flows are lost, pipelines are turned off, and alternative transport channels are deemed too perilous. Such a crisis is one that no industrialized or industrializing nation is prepared to manage, making the 2007-08 Financial Crisis look and feel like child’s play. Thus, many private and state actors are proposing new and expanded hydrocarbon pipeline networks to reduce reliance on single-large networks emanating from or traveling through volatile regions. Proposals range from the large Nabucco pipeline proposal connecting Asia and Europe or the Nord Stream AG Baltic Sea Gas Pipeline to small regional or inter-state proposals in Africa, the Persian Gulf, and Eastern Europe.
The “When?”
With this map, which was initiated in January 2014, we have attempted to accurately quantify as many existing and proposed pipeline routes as possible in Europe, Africa, South America, Asia, and the Persian Gulf. We will be updating this map periodically, and it should be noted that all layers are predetermined aggregations of regional pipelines. Given the recent EIA global shale oil and gas estimates, it is only a matter of time before: a) European nations like Germany, Ukraine, Poland, and Romania begin to explore shale gas extraction in the name of “energy independence,” and b) Argentina hands over the proverbial keys to its 16.2-22.5 billion barrels of oil in the Vaca Muerta shale basin to the likes of Shell or Repsol-YPF (Canty, 2011; Gonzalez and Cancel, 2013; Romero and Krauss, 2013; Staff, 2013). This conversation will be accompanied by additional pipeline proposals for inter- and intra-region transport, all of which we will incorporate into this map on a quarterly basis. If you know of proposals that are not currently shown on the map, please let us know.
Table 1. Major Worldwide Flows of Oil (Thousand Barrels Per Day).
|
Country |
Production (a) |
Consumption (b) |
(b)/(a) |
Export |
Import |
|
Saudi Arabia |
11726 |
2861 |
24 |
8865 |
|
|
United States |
11105 |
18490 |
167 |
7386 |
|
|
Russia |
10397 |
3195 |
31 |
7201 |
|
|
China |
4372 |
10277 |
235 |
5904 |
|
|
Canada |
3856 |
2281 |
59 |
1576 |
|
|
Iran |
3589 |
1709 |
48 |
1880 |
|
|
UAE |
3213 |
618 |
19 |
2595 |
|
|
Iraq |
2987 |
752 |
25 |
2235 |
|
|
Mexico |
2936 |
2144 |
73 |
||
|
Kuwait |
2797 |
383 |
14 |
2414 |
|
|
Brazil |
2652 |
2807 |
106 |
||
|
Nigeria |
2524 |
270 |
11 |
2254 |
|
|
Venezuela |
2489 |
777 |
31 |
1712 |
|
|
Norway |
1902 |
218 |
12 |
1684 |
|
|
Algeria |
1875 |
328 |
18 |
1547 |
|
|
Japan |
4726 |
4591 |
|||
|
India |
3622 |
2632 |
|||
|
Germany |
2388 |
2219 |
|||
|
South Korea |
2301 |
2240 |
|||
|
France |
1740 |
1668 |
|||
|
Indonesia |
1590 |
616 |
|||
|
United Kingdom |
1503 |
||||
|
Angola |
1738 |
||||
|
Qatar |
1389 |
||||
|
Kazakhstan |
1355 |
||||
|
Libya |
|||||
|
Singapore |
1360 |
||||
|
Spain |
1260 |
||||
|
Italy |
1198 |
||||
|
Taiwan |
1058 |
||||
|
Netherlands |
949 |
||||
|
Turkey |
614 |
||||
|
Belgium |
607 |
† Compiled from U.S. Energy Information Administration World Overview (http://www.eia.gov/countries/)
References
Bordoff, J., 2014. Adding Fuel to the Fire: How the American shale gas boom can weaken Russia’s hand in Ukraine, Foreign Policy Magazine, Washington, DC.
Canty, D., 2011. Repsol hails largest ever 927 million bbl oil find, ArabianOilandGas.com. ITP Business Portal.
Charlemagne, 2014. How to be good neighbours: Ukraine is the biggest test of the EU’s policy towards countries on its borderlands, The Economist, London, UK.
Einhorn, B., 2014. How the Ukraine Crisis Could Help Clear Beijing’s Smog, Bloomberg Businessweek. Bloomberg LP, New York, NY.
Gonzalez, P., Cancel, D., 2013. Shell to Triple Argentine Shale Spending as Winds Change, Bloomberg Magazine. Bloomberg LP, New York, NY.
Gwertzman, B., 2014. How to respond to Ukraine’s Crisis, Council on Foreign Relations, Washington, DC.
Henderson, J., Stern, J., 2014. The Potential Impact on Asia Gas Markets of Russia’s Eastern Gas Strategy, Oxford Energy Comment. The Oxford Institute for Energy Studies, Oxford, UK, p. 13.
Klein, N., 2008. The Shock Doctrine: The Rise of Disaster Capitalism. Picador.
Klein, N., 2014. Why US Fracking Companies Are Licking Their Lips Over Ukraine: From climate change to Crimea, the natural gas industry is supreme at exploiting crisis for private gain – what I call the shock doctrine, The Guardian, London, UK.
Krauss, C., 2014. U.S. Gas Tantalizes Europe, but It’s Not a Quick Fix, The New York Times, New York, NY.
McDonnell, A., 2014. Fracking is unlikely to reduce gas prices to the extent its proponents desire, The London School of Economics and Political Science – British Politics and Policy. The London School of Economics, London, UK.
Nossiter, A., 2014. Nigerians Ask Why Oil Funds Are Missing, The New York Times, New York, NY.
Romero, S., Krauss, C., 2013. An Odd Alliance in Patagonia, The New York Times, New York, NY.
Staff, 2013. Argentina’s YPF: Swallowed Pride, The Economist, London, UK.
Wade, T., Rascoe, A., 2014. Global gas trade may soften foreign policy of Russia, China, Reuters, New York, NY.
Footnotes
[1] Last month we wrote about a similar North American Pipeline Proposal map.
[2] The EIA estimates Mediterranean Africa contains 5,772 TCF of estimated wet shale natural gas and 1,373,770 million barrels of oil, the Former Soviet Union 4,738 TCF and 310,567 million barrels, and South America 2,465 TCF and 643,864 million barrels 73% of which is in Brazil and Argentina’s Vaca Muerta.
[3] According to The Economist “The Europeans should also rethink the neighbourhood policy, which lumps together disparate countries merely because they happen to be nearby. In the south it may have to devise a wider concept of its interests stretching out to the Sahel, the Horn of Africa and the Middle East. Here Europe has no real friends, lots of acquaintances and not a few enemies. To the east it needs better ways of helping those who want to move closer to the EU.”
Injection wells are another by-product of fracking; not to mention the huge amounts of water destroyed. Terms such as ‘injected into geological formations for permanent storage’ are becoming common place. I wonder at the intelligence behind such idiocy; study the history of the Earth (even briefly) and it is obvious that there is no such thing as permanent geological formations, This Earth is continuously changing. What are our goals? Are we striving to destroy our air quality, to destroy the purity of our water, to contaminate the Earth beyond repair? Maybe we humans should back up and realize we are as ants in the big picture and this Earth can do without us!
Fracking can bring earthquakes, health problems, pollution, land contamination, animal die offs, and displace people… Fracking also could start world war 3.