Threats to Ohio’s Water Security
Ohio waterways face headwinds in the form of hydraulic fracturing water demand and waste disposal
By Ted Auch, PhD – Great Lakes Program Coordinator, and Elliott Kurtz, GIS Intern and University of Michigan Graduate Student
In just 44 of its 88 counties, Ohio houses 1,134 wells – including those producing oil and natural gas and Class II injection wells into which the industry’s waste is disposed. Last month we wrote about Ohio’s disturbing fracking waste disposal trend and the disproportionate influence of neighboring states. (Prior to that Ariel Conn at Virginia Tech outlined the relationship between Class II Injection Wells and induced seismicity on FracTracker.) This time around, we are digging deeper into how water demand is related to Class II disposal trends.
Ohio’s Utica oil and gas wells are using 7 million gallons of freshwater – or 2.4-2.8 million more than the average well cited by the US EPA.1 Below we explore the inter-county differences of the water used in these oil and gas wells, and how demand compares to residential water demand and wastewater production.
Please refer to Table 1 at the end of this article regarding the following findings.
Utica Shale Freshwater Demand
Data indicate that there may be serious threats to Ohio’s water security on the horizon due to the oil and gas industry.
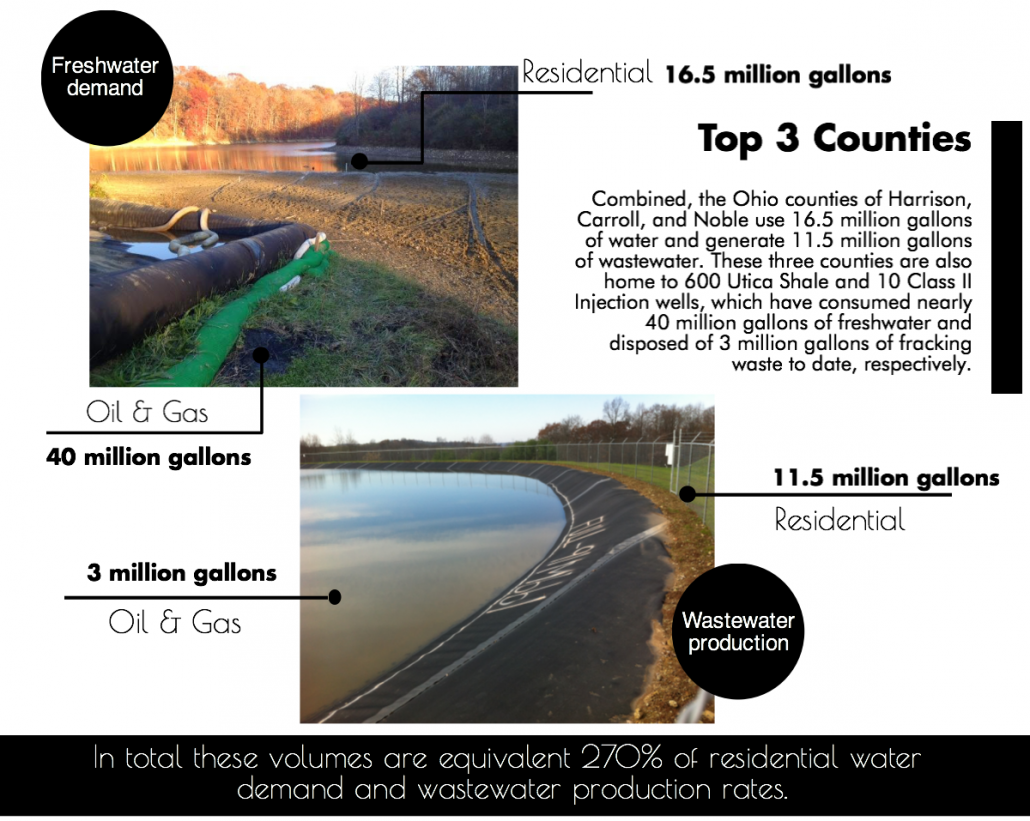
The counties of Guernsey and Monroe are next up with water demand and waste water generation at rates of 14.6 and 10.3 million gallons per year. However, the 11.4 million gallons of freshwater demand and fracking waste produced by these two counties 114 Utica and Class II wells still accounts for roughly 81% of residential water demand.
The wells within the six-county region including Meigs, Washington, Athens, and Belmont along the Ohio River use 73 million gallons of water and generate 51 million gallons of wastewater per year, while the hydraulic fracturing industry’s water-use footprint ranges between 48 and 17% of residential demand in Coshocton and Athens, respectively. Class II Injection well disposal accounts for a lion’s share of this footprint in all but Belmont County, with injection well activities equaling 77 to 100% of the industry’s water footprint (see Figure 1 for county locations and water stress).
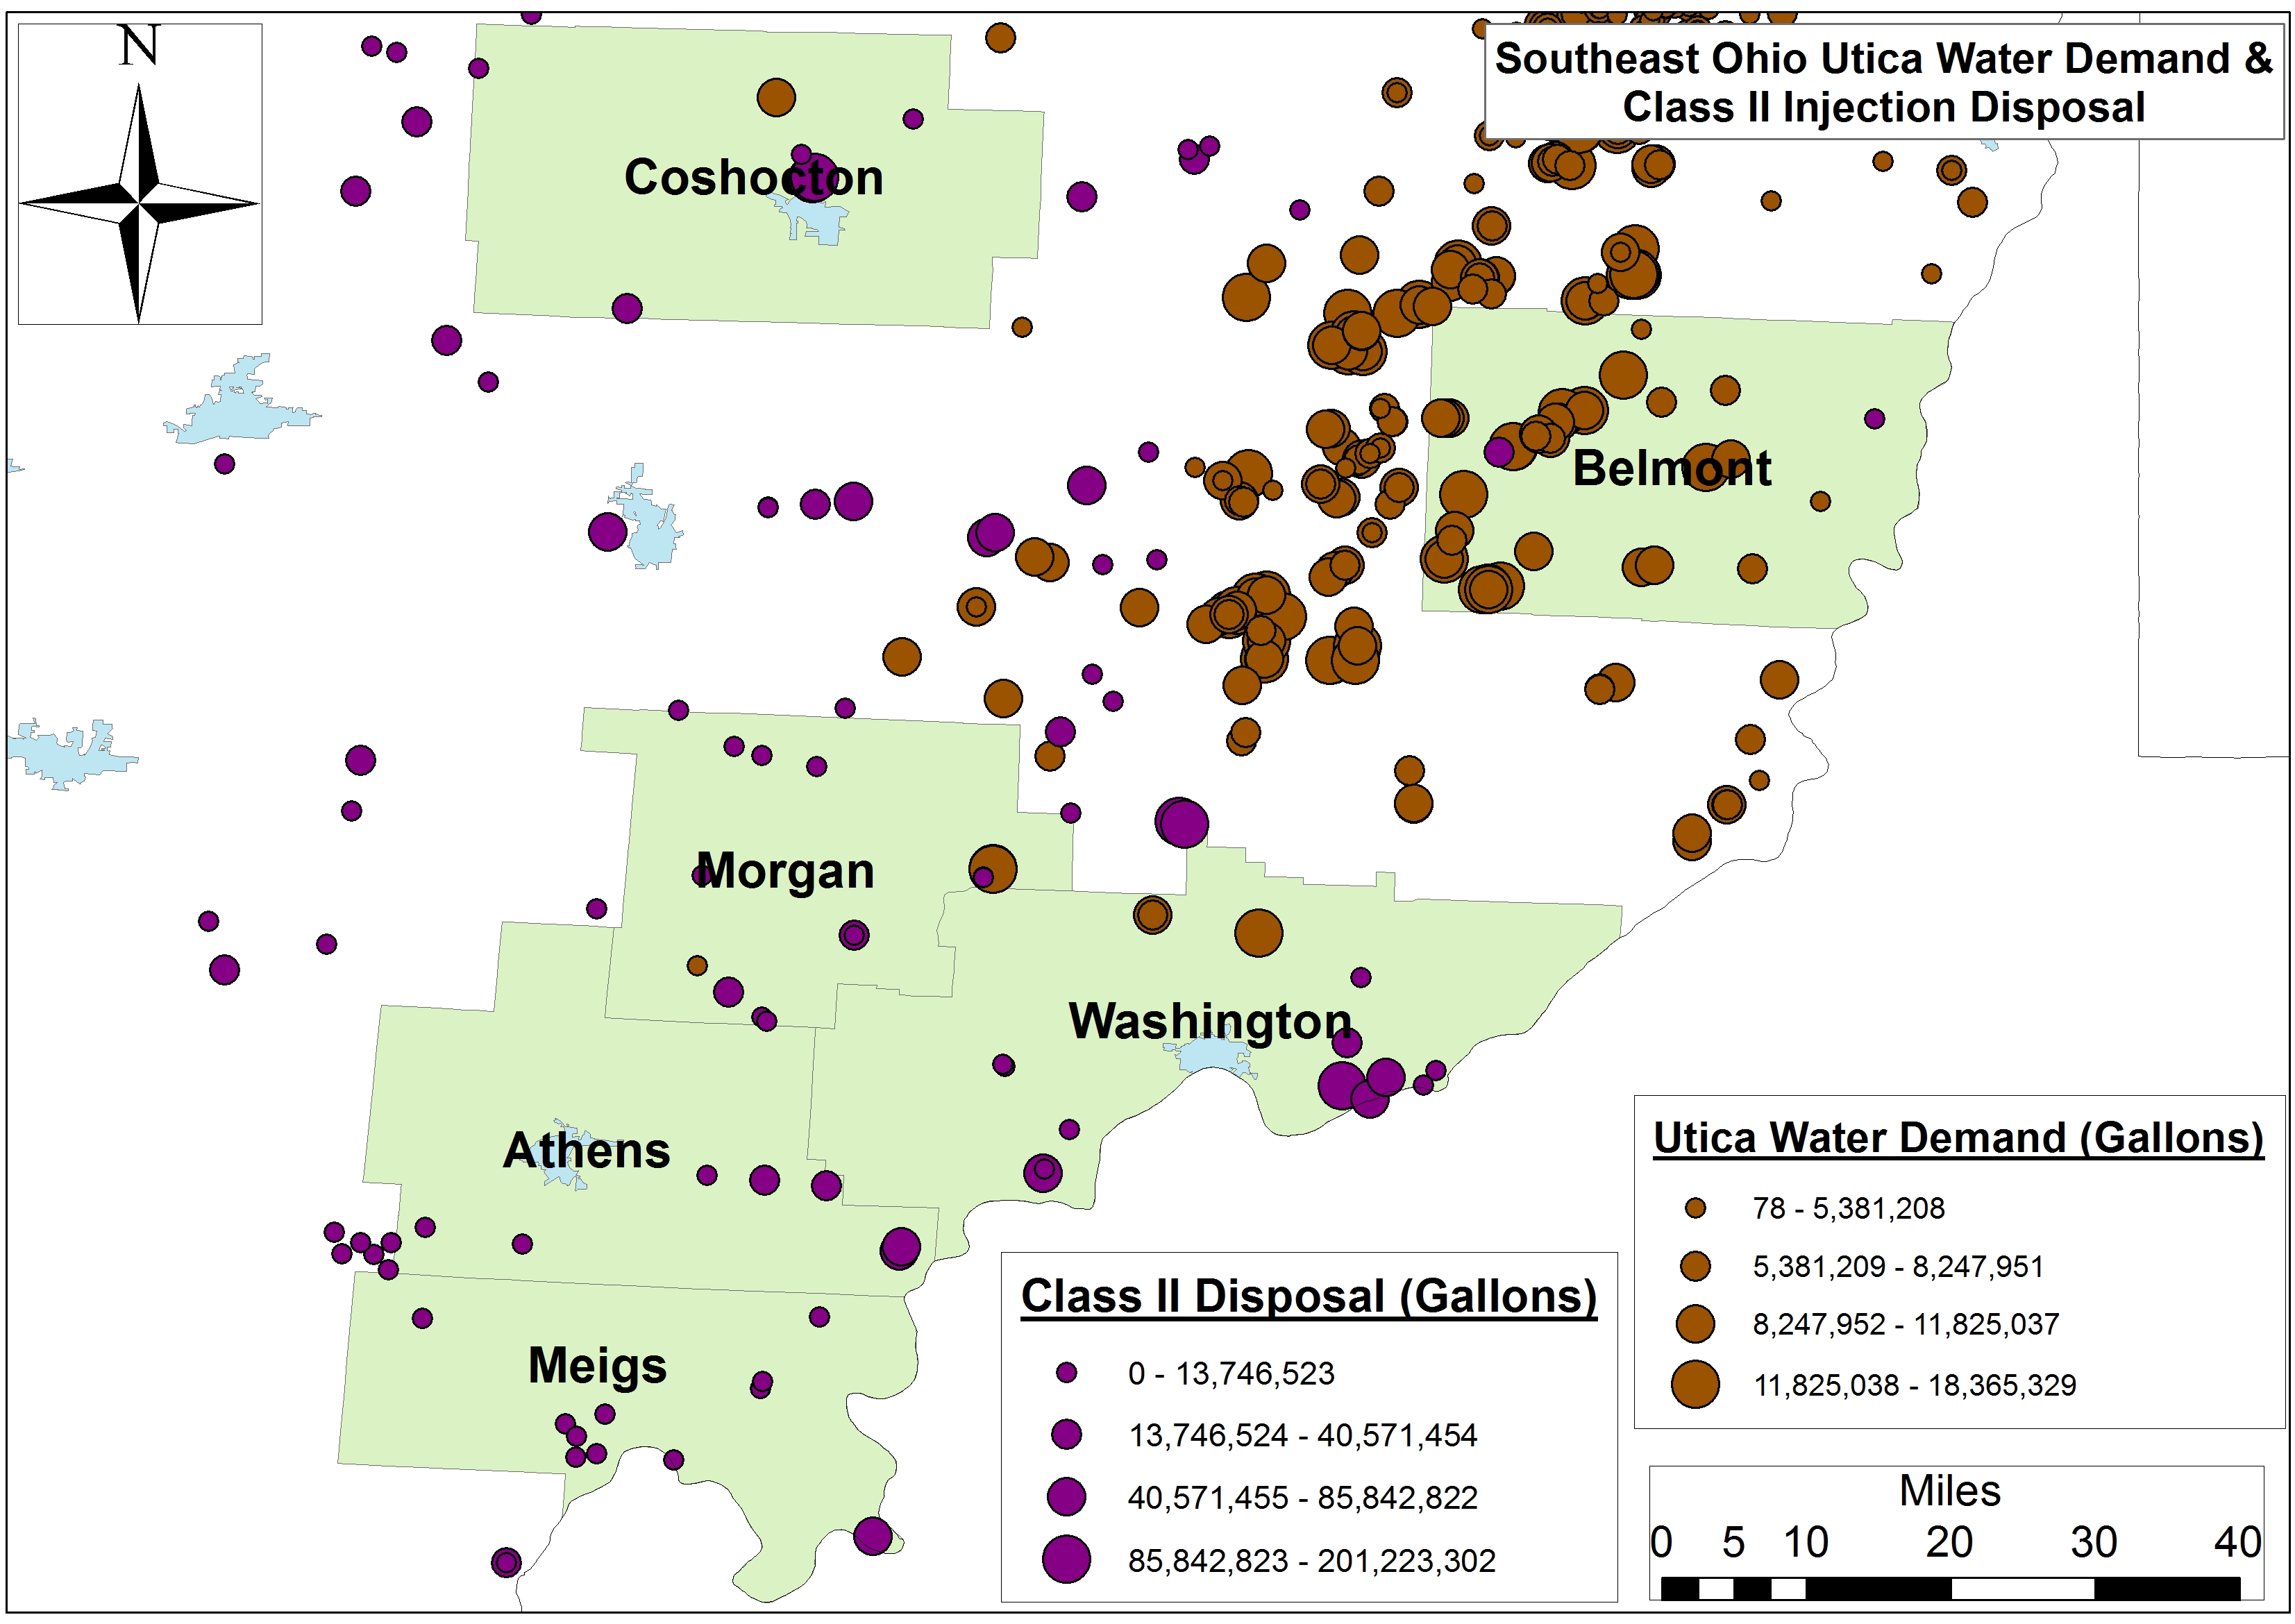
Figure 1. Primary Southeast Ohio counties experiencing Utica Shale and Class II water stress
The next eight-county cohort is spread across the state from the border of Pennsylvania and the Ohio River to interior Appalachia and Central Ohio. Residential water demand there equals 428 million gallons, while the eight county’s 92 Utica and 90 Class II wells have accounted for 15 million gallons of water demand and disposal. Again the injection well component of the industry accounts for 5.8% of the their 7.7% footprint relative to residential demand. The range is nearly 10% in Vinton and 5.3% in Jefferson County.
The next cohort includes twelve counties that essentially surround Ohio’s Utica Shale region from Stark and Mahoning in the Northeast to Pickaway, Hocking, and Gallia along the southwestern perimeter of “the play.” These counties’ residents consume 405 million gallons of water and generate 329 million gallons of wastewater annually. Meanwhile the industry’s 69 Class II wells account for 53 million gallons – a 2.8% water footprint.
Finally, the 11 counties with the smallest Utica/Class II footprint are not suprisingly located along Lake Erie, as well as the Michigan and Indiana border, with water demand and wastewater production equalling nearly 117 billion gallons per year. Meanwhile the region’s 3 Utica and 18 Class II wells have utilized 59 million gallons. These figures equate to a water footprint of roughly 00.15%, more aligned with the 1% of total annual water use and consumption for the hydraulic fracturing industry cited by the US EPA this past June.
Future Concerns and Projections
Industry will see their share of the region’s hydrology increase in the coming months and years given that injection well volumes and Utica Shale demand is increasing by 1.04 million gallons and 405-410 million gallons per quarter per well, respectively. The number of people living in these 42 counties is declining by 0.6% per year, however, 1.4% in the 10 counties that have seen the highest percentage of their water resources allocated to Utica and Class II operations. Additionally, hydraulic fracturing permitting is increasing by 14% each year.2
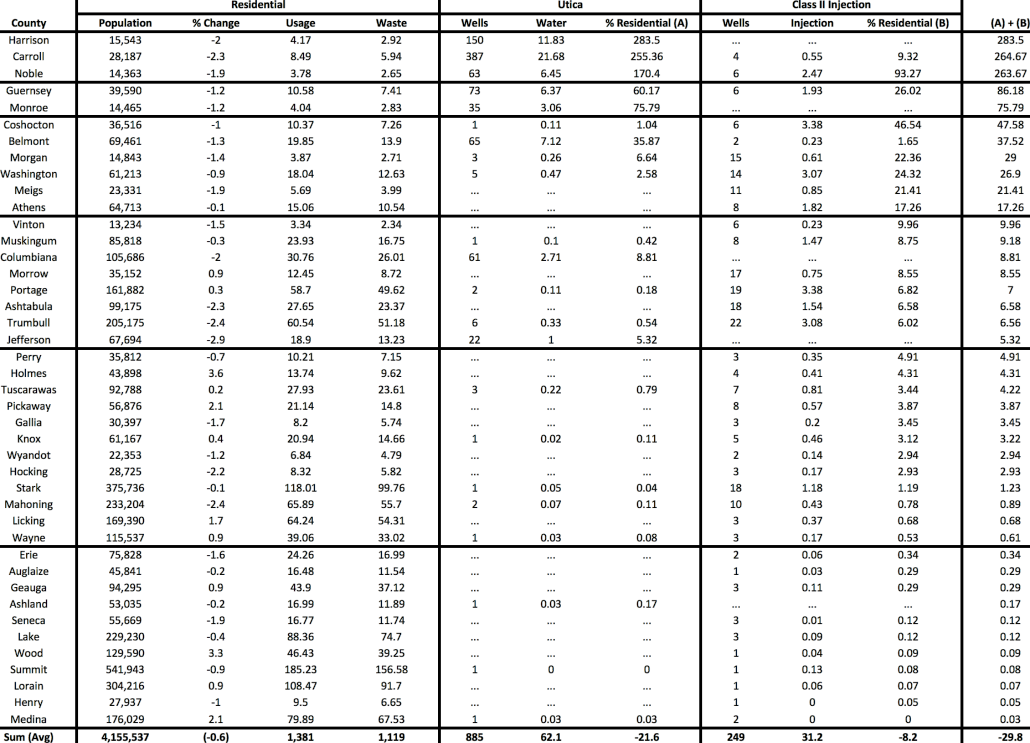
Table 1. Residential, Utica Shale, and Class II Injection well water footprint across forty-two Ohio Counties (Note: All volumes are in millions of gallons)
Footnotes & Resources
1. In their recent “Assessment of the Potential Impacts of Hydraulic Fracturing for Oil and Gas on Drinking Water Resources” (Note: Ohio’s hydraulically fractured wells are using 6% reused water vs. the 18% cited by the EPA).
2. Auch, W E, McClaugherty, C, Gallemore, C, Berghoff, D, Genshock, E, Kurtz, E, & Jurjus, R. (2015). Ramification of current and future production, resource utilization, and land-use change in the Ohio Utica Shale Basin. Paper presented at the National Environmental Monitoring Conference, Chicago, IL.
Saturday night into Sunday morning- 2 a.m. i smelled what i thought was the sewer plant ‘s released , uncontrolled gases- I called a trustee in Madison township-2 a.m.- to complain that i had to close my windows because the odor was so intense.
Sunday night- [now] 11 p.m. i felt a quaking under foot in my bathroom. I found a well very close to us on your website- I realize the smell yesterday was methane, which the plant might release by accident , but instead it’s obviously a fracked site- fracking taking place by our airport- on knights parkway after being banned -a few years ago-from the towns “dump” [close by]
-In Cleveland, years ago, methane releases from town dump was constantly burned at the top of the dump’s chimney
stack-i thought methane could be gathered as an alternate fuel as it is in Europe-
Ted, yesterday we visited the Portland region of Great Bend southeast corner of Meigs Co> we took video footage of one particular site with 6 permits for Mills Hunter . One other site showed 2 permits for the same company . there were other sites we could see and some we could not. Are you sure there are only 11 class 2 injection wells in Meigs Co.? Are they sneaking new permits past us or what? bob
Great question Bob we only have data for 11 Class II wells in Meigs (i.e., only 11 that have received fracking waste as of Q1/Q2/2015) but you are correct that several permits are being permitted each month so staying ahead of the Class II network is difficult but we will work to incorporate all recent wells into our next analysis along these lines.
Thanks for excellent feedback