By Brook Lenker, Executive Director, FracTracker Alliance
Frac sand mining is a growing threat to the agricultural landscapes of the upper Midwest and a health risk to those who live near the mines. With a general slowdown in the oil and gas industry, sand mining may seem a lessening concern in the universe of extraction impacts, but a recent visit to Wisconsin during Earth Week suggested otherwise.
Frac Sand Mining Presentations
Dr. Auch presenting in Wisconsin on frac sand mining issues
I joined my colleague, Dr. Ted Auch, on an informative cross-state tour that started in Milwaukee. We were presenters at the Great Lakes Water Conservation Conference where representatives from breweries around the region and across the country came together to discuss their most precious commodity: clean and abundant water. Extraction affects both the quantity and quality of water – and our insights opened many eyes. Businesses like microbreweries with a focus on sustainability and a strong environmental ethic recognize the urgency and benefit of the renewable energy transformation.
From Milwaukee, we headed west to Madison and the University of Wisconsin where Caitlin Williamson of the Wisconsin Chapter of the Society for Conservation Biology organized the first of two forums entitled “Sifting the Future: The Ecological, Agricultural, and Health Effects of Frac Sand Mining in Wisconsin.” We were joined by Kimberlee Wright of Midwest Environmental Advocates to address an engaged audience of 35 people from the campus and greater community. Thanks to Wisconsin Eye, a public affairs network, the entire program was videotaped.
Brook Lenker presenting at Sifting the Future event in Wisconsin
A long drive to Eau Claire revealed rolling farmland, wooded hills, and prodigious wetlands home to waterfowl and the largest cranberry industry in the nation. At the Plaza Hotel, we met Cheryl Miller of the Save the Hills Alliance, the grantor enabling us to study the regional footprint of sand mining, and Pat Popple, advocate extraordinaire and our host for the second “Sifting the Future” event. The good folks at Public Lab were also in town to facilitate citizen monitoring of silica dust from the mining process, including a free workshop and training that weekend.
The evening program attracted 50 people from as far away as Iowa and Minnesota. Their interest in and knowledge of sand mining issues was impressive, and many were heavily involved in fighting local mines. Dr. Crispin Pierce spoke of his research about airborne particulates around frac sand operations, complementing both FracTracker presentations – mine emphasizing the broad array of environmental and public health perils related to oil and gas extraction and Ted’s examining the scale and scope of sand mining, demand for proppant, and the toll of the industry on agricultural productivity, forests and the carbon cycle.
Mining Photos
During the five day trip, sand mines were visited and documented, their incongruent and expanding presence marring the countryside. Some of them can be seen in this photo gallery:
On Earth Day, while driving east to return to Milwaukee, Sandhill cranes, a timeless symbol of the Wisconsin wild, poked the rich prairie soils searching for food. Joined by Autumn Sabo, a botanist and researcher who assisted our Wisconsin work, we detoured to the nearby Aldo Leopold Center visiting the simple shack that inspired Mr. Leopold to write Sand County Almanac. Considering the reason for my travel, the irony was thick. Ecological consciousness has come a long way, but more evangelism is sorely needed.
Aldo Leopold Center, Wisconsin
https://www.fractracker.org/a5ej20sjfwe/wp-content/uploads/2016/05/WITour-Feature.jpg400900Guest Authorhttps://www.fractracker.org/a5ej20sjfwe/wp-content/uploads/2021/04/2021-FracTracker-logo-horizontal.pngGuest Author2016-05-05 15:36:252020-03-11 17:07:10Earth Week in Wisconsin
By Brook Lenker, Executive Director, FracTracker Alliance
The understanding of fracking’s harms has grown dramatically in the last decade, especially since FracTracker’s formation in 2010. Across the country and around the world, environmental and human health impacts of oil and gas development have been well documented. Every day brings new cause for concern.
During this same period, scientific and public awareness about the consequences and causation of climate change has accelerated and we watch with trepidation as profound changes grip our planet. Atmospheric carbon dioxide levels have eclipsed 400 ppm. Temperature records are repeatedly broken. Weather extremes have become routine.
These tragic realities aren’t acceptable. Nationally and internationally, hundreds – if not thousands – of organizations are working on these issues and speaking out for transparency, accountability, and progress. Progress means informed populations, responsible policies, and an aggressive shift to renewable energy while embracing efficiency. Great things are happening. The future demands boldness.
FracTracker has always been a data-driven resource for all – to educate, empower, and catalyze positive change. The Alliance in our name underscores that we are an ally with the multitudes in that quest, but the weight of the times requires us to revisit our mission statement (below) and sharpen our message to better convey what we do and why we do it. A new logo and tagline reinforce our pronouncement.
FracTracker Alliance studies, maps, and communicates the risks of oil and gas development to protect the planet and support the renewable energy transformation.
So, welcome to the freshened words and appearance of the FracTracker Alliance. We’re the same trusted organization but striving to be bolder, to make a bigger difference for us all. The future is now.
If you have questions about these organizational changes, please email us at info@fractracker.org, or call +1 202-630-6426.
https://www.fractracker.org/a5ej20sjfwe/wp-content/uploads/2016/05/NewLogo-Feature.png400900Guest Authorhttps://www.fractracker.org/a5ej20sjfwe/wp-content/uploads/2021/04/2021-FracTracker-logo-horizontal.pngGuest Author2016-05-02 13:18:192020-03-05 13:15:26Welcome to FracTracker Alliance 2.0
Emissions from Refineries and other Sources By Kyle Ferrar, Western Program Coordinator & Kirk Jalbert, Manager of Community Based Research & Engagement
Key Takeaways
Refineries and petrochemical industry in the Bay Area’s refinery corridor are responsible for the majority of the risk-driving point source emissions in this region.
The Chevron Richmond refinery has the largest refining capacity and emits the most hazardous air pollutants (HAPs).
The Tesoro refinery in Martinez and the Shell refinery in Martinez emit the most HAPs per barrel of oil (based on refining capacity).
The Valero refinery in Benicia, the Tesoro refinery in Martinez, and the Shell refinery in Martinez emit the most criteria air pollutants (CAPs).
If refineries increase their capacity and process more crude, the emissions of these various pollutants will invariably increase.
New emissions rules need to prioritize ambient air quality and hold the Air District and elected officials accountable for policies that increase risk.
Overview of the Bay Area’s Refinery Corridor
The Bay Area Air Quality Management District is revising the rules for facilities that emit a variety of hazardous pollutants into the air. The current draft of the new rules could actually increase the amount polluters are allowed to emit. The communities at risk are speaking out to support policies that would reduce the amount of air pollutants rather than increase the limits. In support of these communities, the FracTracker Alliance has focused on analyzing the sources of air pollutants in the region. The East Bay Oil Refinery Corridor is located along the North Shore of the East Bay, stretching from Richmond, CA east to Antioch, CA. The region has been named a “sacrifice zone” for the heavy concentration of petrochemical industrial sites. In addition to the five refineries along the north coast, these communities host a variety of other heavy industries and waste sites. The locations of these facilities have been mapped previously by the FracTracker Alliance, here. In the report we found that people of color, specifically African Americans, are disproportionately represented in the community demographics. Novel results indicate that Hispanic students may be disproportionately impacted by the presence of the petrochemical industry. In this post, we continue the analysis of risk in the region by providing an analysis of the contributions to air pollution from these facilities.
Regulations
Refineries and other sources of air pollution are regulated by the U.S. EPA’s Clean Air Act (CAA). The CAA regulates two classes of pollutants:
Criteria air pollutants (CAPs) – including sulfur dioxide, oxides of nitrogen, carbon monoxide, and particulate matter; and
Hazardous air pollutants (HAPs), which includes a list of 594 carcinogenic and non-carcinogenic chemicals that pose a risk to those exposed.
In addition, California regulates green-house-gas (GHG) emissions, and refineries are the second largest industrial source of GHGs. These regulations get applied when facilities need to obtain a permit for a new source of air pollution, or if a facility is making a structural change that could significantly affect emissions. Facilities are required to use “Maximum Available Control Technology” as it relates to industry best practices to control emissions. With these existing engineering controls, refinery emissions are released into the air from the multiple sources/processes shown below in Figure 1. Notice that a large amount of emissions are simply from “Leaks.”
Figure 1. Breakdown of emissions from petroleum refineries (US EPA, 2011)
The new rules drafted by the BAAQMD to regulate emissions from the East Bay Oil Refinery Corridor would not cap emissions at any level. The current proposal outlines limits on emissions per barrel, promoting efficiency rather than focusing on emissions reductions. Air quality in the refinery corridor could be improved only if this approach was proposed in conjunction with emission limits or reductions. But as the currently proposed rules stand, emissions could actually increase. Enforcement procedures for infractions are also limited. If a refinery’s emissions violate the per barrel standards, the refinery has a whole 3 years to address the violation. Also, these new rules come at a time when refineries are moving to increase the volume of crude coming in from other regions, such as Canada’s tar sands and the Bakken Shale. These regions produce much lower “quality” crude oil, with much higher emissions. This all amounts to more air pollution rather than less.
Community and environmental activist groups such as the Communities for a Better Environment (CBE) and the Bay Area Refinery Corridor Coalition have raised specific issues with the proposed rules as they stand. First, they allow for increase emissions when Air District data forecasts increasing refinery emissions, despite declining local and domestic fuels demand. Refining the lower quality crude is more energy intensive, which also results in increased emissions. In order to offset the increased emissions, CBE reports that refineries can just increase total refining production to decrease per barrel averages. This would in affect increase emissions to meet regulatory requirements. In addition, transporting the crude via new shipping routes would put additional communities at elevated risk of railway accidents (CBE, 2015).
Ambient Air Quality
Air quality in the Bay Area has been continuously improving over the last few decades, but these refinery communities are still at a significantly higher risk of dying from heart disease and strokes. The largest disparity is felt by the African-American populations. Data for Richmond, CA shows they are 1.5 times more likely to die from these diseases than the Contra Costa county average (Casanova, Diemoz, Lifshay, McKetney, 2010). Emissions reductions not only favor the local communities such as the refinery corridor that are most impacted, but also all of the downwind communities, specifically the Central Valley. The Air District’s 2012 report of PM provides a summary of these trends. PM is an important because it is “the air pollutant that causes by far the greatest harm to public health in the bay area. It is a useful indices because there is a linear correlation between increasing ambient concentrations and mortality. Figure 2 shows the progress the Bay Area has made, overall. This graph is based on regional monitors and not those in the refinery communities, where improvements have not been as drastic. In Figure 3 below, the graph shows major pollutant drivers of seven health risks and how health impacts have been reduced over this time period. What we see from the bar graph, is that non-diesel anthropogenic point sources of PM contribute the most to risk for the majority of health endpoints considered. Across the entire bay area, refineries account for 6% of all PM (BAAQMD, 2012).
An overview of other chemicals associated with the petrochemical industry in ambient air and their resulting health effects are outlined in tables 1-3 below. This is by no means a comprehensive list, but these are chemicals of primary concern, specific to petroleum refinery emissions, and are known risk drivers for the region.
Figure 2. Measurements of PM, averaged across the entire bay area, over time – showing an overall improvement in air quality.
Figure 3. Contribution of different species of air pollution to health impacts. The analysis is specific to the bay area and compares health risks estimates from the past (1980s) to estimates in 2012.
Table 1. Health impacts from criteria air pollutants
Criteria Air Pollutants
Compound
Health Effect
Sulfur Dioxide (SO2) and Oxides of Nitrogen (NOx)
Array of adverse respiratory effects, airway inflammation in healthy people, increased respiratory symptoms in people with asthma
Carbon Monoxide (CO)
Harmful health effects associated with the reduction of oxygen delivery to the body’s organs (heart and brain) and tissues
Particulate Matter
Increased respiratory symptoms, irritation of the airways, coughing, or difficulty breathing, decreased lung function; aggravated asthma; development of chronic bronchitis; irregular heartbeat; nonfatal heart attacks; and premature death in people with heart or lung disease
Table 2. Health impacts from hazardous air pollutants known to be emitted from petroleum refineries
Hazardous Air Pollutants
Compound
Acute
Chronic
Benzene, Toluene, Ethylbenzene, Xylenes
Neurological effects, Irritation of the eye, skin and respiratory tract
Blood disorders (reduced number of red blood cells and aplastic anemia), cancer.
1,3-Butadiene
Irritation of the eyes, throat and respiratory tract
Cardiovascular effects, leukemia, cancer
Naphthalene
Hemolytic anemia, damage to the liver, neurological effects
Cataracts, damage to the retina, hemolytic anemia, cancer
PAHs
Skin disorders, depression of the immune system
Skin disorders (dermatitis, photosensitization), depression of the immune system, damage to the respiratory tract, cataracts, cancer
Table 3. Health impacts from other pollutants emitted from petroleum refineries
Other Pollutants
Compound
Mechanism
Health Effect
Volatile Organic Compounds (VOC)
Combine with NOx in sunlight to create ozone
Significantly reduce lung function and induce respiratory inflammation in normal. Healthy people during periods of moderate exercise, symptoms include chest pain, coughing, nausea, and pulmonary congestion
Compounds with high global warming potential contribute to climate change
Increase in average temperatures, higher levels of ground-level ozone, increased drought, harm to water resources, ecosystems and wildlife, health risk to sensitive populations
North Coast Emissions
With these gains in ambient air quality it is hard to fathom why regulators would consider allowing refineries to increase emissions inventories. For this analysis, the focus was to map and compare emissions inventories from numerous industrial sites, with a particular focus on the petroleum refineries.
Current refinery capacities as of 2014 are shown in Figure 4, below. The Richmond Chevron has the largest refining capacity in the region, by far. Refining capacity is the maximum amount of crude oil the refinery is allowed to refine, according to their permit. Refining capacity numbers are used in place of actual refined crude volumes for this analysis, because actual crude volumes are considered proprietary information and are not published by the California Energy Commission (CEC).
The Richmond refinery has a raw crude (atmospheric crude is the technical term) refinement capacity over twice as large as the Phillips 66 San Francisco Refinery, and almost 40% larger than the Tesoro (Golden Eagle) refinery, which is the second largest in the region. According to the newly proposed rules, this would allow the Richmond refinery to emit the most pollutants.
The raw total emissions data is shown in Figure 5. The Phillips 66 refinery in Rodeo contributes the least to ambient air quality degradation. The Chevron Richmond refinery processes 40 – 100% more than the four other refineries, and emits 10 – 570% more than the other refiners. This large difference in capacity and emissions means that Chevron Richmond is more efficient than some, but much less efficient than others. To understand the efficiency differences between the refineries, the total HAPs emissions were adjusted by the refining capacity, shown below in Figure 6. With this data we can rank the refining efficiency specifically for HAPs emissions, based on facility capacity. The Tesoro refinery in Martinez and the Shell refinery in Martinez emit the most HAPs per barrel oil (based on refining capacity). From highest emitter to lowest emitter per barrel of crude, the facilities can be ranked:
Tesoro Refining & Marketing Co LLC (Golden Eagle Refinery in Martinez)
Shell Oil Products (Martinez Refinery)
Chevron Products Co Richmond Refinery
Valero Refining Co – California Benicia Refinery
Phillips 66 San Francisco Refinery (Rodeo Refinery)
Figure 4. Operating capacity of refineries. The bars show the maximum amount of crude the refineries are allowed to process daily, in barrels (1 barrel = 42 gallons).
Figure 5. Total amount of HAPs emissions from East Bay refineries
Figure 6. Relative HAPs emitted from each refinery adjusted by the crude capacity
These refineries along with the other industrial sites in the region have been mapped below in Figure 7. The data has been displayed to show the HAPs emissions from these facilities. The amounts of emissions are shown with graduated circles. The larger the circle, the higher the emissions. The cumulative summation of HAPs is a good value for comparing between facilities with diverse emission inventories (the list of all species of emitted pollutants), but different HAP chemicals have very different effects, both in magnitude and in health impacts. Different chemicals will affect different body systems, as described above in Tables 1-3 above. We have therefore incorporated individual chemical data into the map as well (Figure 7, below). The data displayed shows the total sum of HAPs emitted (in lbs/year) from petrochemical industrial facilities in the region. Explore the map to see emission sources for a selection of important pollutants. Smaller industrial sites/sources have been left out of the map.
Figure 7. Map of the East Bay’s Refinery Corridor with emissions data
View Map Fullscreen | How Our Maps Work
If you open the map into its own page, you can toggle between individual chemical emissions from these facilities. Use the layers tab to change the chemicals displayed. For more information on the individual chemicals, continue reading below.
This unique selection of pollutants was chosen by identifying the highest health risk drivers in the region. They are known to increase both cancer and non-cancer risk for residents in the bay area. The graphs that follow show the emissions inventories reported by each refinery. The refineries are organized on the X –axis according to increasing refining capacity, as they are in Figure 4, above.
Analysis of the graphs show that the Richmond Chevron facility is a largely responsible for 1,2,4-trimethylbenzene, naphthalene, hydrogen cyanide, PAH’s, vanadium, lead and nickel compounds. The Tesoro refinery is mostly responsible for almost all of the 1,3-butadiene, and most responsible for hydrogen sulfide and VOCs. Shell is mostly responsible for the ethylbenzene, much of the mercury and sulfur dioxide emissions, and the most VOCs. Valero in Benicia is responsible for much of the 1,2,4-trimethylbenzene, all BTEX compounds, the most nickel compounds, and the most oxides of nitrogen. And finally, the Phillips 66 refinery in Rodeo with the lowest operating capacity also had the lowest emissions in almost every case except lead, which was very large compared to all refineries except Chevron Richmond. The Valero refinery in Benicia, the Tesoro refinery in Martinez, and the Shell refinery in Martinez emit the most criteria air pollutants (CAPs), including PM2.5 (particulate matter with a diameter less than 2.5 um), sulfur dioxide, and oxides of nitrogen.
Figure 8 – 22. Emissions totals of various air pollutants from East Bay refineries
Marine Terminals
Emissions from marine terminals are also a significant source of HAPs and particulate matter. In the map in Figure 7, the marine terminals are shown with yellow markers. Their relative contributions of total hazardous pollutants are much less than the refineries and other sources, but when we look at specific risk drivers, such as 1,3-butadiene and benzene, we find that their contributions are quite sizable. Marine terminals are also a key component for the refineries looking to access more low-grade crude. Increasing the refining capacity of the refinery will also increase the emissions from the terminals.
The Tesoro Golden Eagle Refinery in Martinez, CA was recently approved for a 30-year lease on a new marine terminal. The new terminal will allow Tesoro to switch to processing lower-cost, lower-quality crude oil from California, Bakken crude, and Canadian tar sands. When crude is transported via ocean liner, besides the issue of air pollution there is the additional risk of an ocean spill. Tom Griffith, Martinez resident and co-founder of the Martinez Environmental Group and founding member of the Bay Area Refinery Corridor Coalition recently summed up the threat, saying:
When you take a close look at what is going on in the marine oil terminals along the refinery corridor from Richmond to Stockton, it’s chilling to imagine what could happen if a huge oil tanker carrying tar sands crude crashed in the Bay! (Earthjustice, 2015)
Incidents
Figure 23. Fires at Chevron Richmond Refinery 2012. Photo by John Sebastian Russo for the SF Chronicle
Like oil spills from tankers, there are other risks of industrial accidents for refineries that need to be considered. Accidents or incidents may occur that result in a sudden, large release of air pollution. Looking at the emissions data, the Richmond Chevron refinery with the largest production capacity may seem to be an efficient station compared to the other refineries. However, an explosion and large fire in 2012 there sent 15,000 community members to local hospitals with respiratory distress. The SF Chronicle’s coverage of the story can be found here. (Fire shown in photo right.) The incident resulted from pipes corroding and failing, and the facility failing to make the decision to shut down the process. The resulting plume of smoke is shown in the cover photo of this article. Other major explosions and fires have occurred in the recent past, as well, including a flaring incident in 2014, a fire in 2007, and two other explosion and fire events in 1999 and 1989.
Of course these events are not unique to the Chevron refinery. The Tesoro Golden Eagle refinery has a reputation of being the most dangerous refinery in the country for occupational hazards, and has one of the worst track records of violations.
Conclusions
If refineries increase their capacity and process more crude, the emissions of these various pollutants will invariably increase. Increased emissions elevate risk for surrounding communities, and in the bay area these communities already bare a disparate burden. Additionally, many of the pollutants will be transported with the prevailing wind that blows from the coast up the river delta and into the central valley. In FracTracker’s recent analysis of impacted communities in the refinery corridor, maps of air quality showed that the refinery communities are some of the most impacted in the entire bay area.
What we find in this report is that the refineries and petrochemical industry in the refinery corridor are responsible for the majority of the risk-driving emissions in this region. When the risk and total emissions are averaged for the entire Bay Area, the risk outcomes are much less than for those living in the communities hosting the industries. New emissions rules should prioritize contributions of emissions to ambient air pollution loads. The biggest issue with using a “per barrel” emissions limit is that it prioritizes the refining capacity rather than mitigating the existing health impacts. These types of policy decisions deal directly with risk management. The Air Management District must decide what amount of cancer and disease are acceptable to keep the refineries in the communities. An upper limit on emissions makes it easier to set a risk limit, an upper bound for health impacts. The upper limit also holds the Air Management District and elected officials accountable for their policy decisions.
BAAQMD. 2012. Summary of PM Report. Bay Area Air Quality Management District. Accessed 4/15/16.
** Feature image of the Richmond Chevron Refinery courtesy of D.H. Parks
https://www.fractracker.org/a5ej20sjfwe/wp-content/uploads/2016/04/Chevron_2012_Cover.jpg400900Kyle Ferrar, MPHhttps://www.fractracker.org/a5ej20sjfwe/wp-content/uploads/2021/04/2021-FracTracker-logo-horizontal.pngKyle Ferrar, MPH2016-04-29 14:33:532020-03-13 08:40:32Air Pollution in the Bay Area’s Refinery Corridor
By Sierra Shamer, Visiting Scholar, FracTracker Alliance
OurLongmont.org sign supporting the city’s ban on fracking
In 2012, citizens of Longmont, Colorado voted to increase setback distances of oil and gas infrastructure from occupied buildings. As well pads and storage facilities crept closer to homes, schools, and playgrounds, concerns of air, water, and noise pollution steadily grew. These regulations to protect public health and safety in Longmont culminated in an outright ban of hydraulic fracturing / directional drilling within their boundary. This prompted the state regulatory agency, the Colorado Oil and Gas Conservation Commission (COGCC) to sue the town, arguing that only the state has the power to regulate energy development. While the suit was dropped, the ban was overruled in 2014 in the Boulder District Court, determining that the city did not have the authority to prohibit what is permitted throughout the state. The city motioned for a Stay Pending Appeal and it was granted by the court – the ban on fracking in Longmont will stay in effect until the case is settled.
In response to these local challenges of oil and gas expansion, the COGCC passed new setback rules. However, with loopholes, exceptions, and an increasing awareness of public health and safety threats, Coloradans have continued to demand increased and enforced setback distances. This article highlights the issue of setback regulations in Colorado, featuring a map of Weld County that exemplifies the statewide expansion of fracking wells into communities.
Colorado Setbacks Regulation
The COGCC passed new setback rules for oil and gas facilities in February of 2013 with a stated purpose of decreasing the “potential adverse health and safety risks to the public and the environment, including spills, odors, noise, dust, and lighting.” Prior rules permitted drilling within 150 feet of occupied buildings in a rural area and within 350 feet in an urban area. A COGCC report in October 2013 stated that 600 oil and gas locations were located within 500 feet of occupied buildings, 26% of the total. The new regulations increased the minimum setback distance to 500 feet, adding a 350-foot setback from outdoor recreational areas such as playgrounds or sports fields, and a 1,000-foot setback from high occupancy building such as schools or hospitals. It also included 1,000-foot buffer distances from these outdoor areas and buildings within which facilities are permitted but require increased on-site mitigation to prevent air, noise, and water pollution. These rules took effect on August 1, 2013.
Setback Success?
Colorado’s setback rules have been criticized by organizations, activists, landowners, and researchers who argue that the loopholes and exemptions allowed by the COGCC make the rules ineffective, and even if they were enforced, the modest increase in setback distance would not adequately protect citizens from negative impacts. Exceptions to the rules, shown in the table below, are included the regulations and are available for the majority of setback distances identified, allowing oil and gas facilities to continue development in close proximity to communities. The Western Resource Advocates, a conservation organization in Colorado, identifies two commonplace built-in exceptions to the 500-foot minimum setback rule: the “Beware Thy Neighbor” exception, allows surface landowners the ability to allow wells within setback distances, and the “Expansion Exception,” which allows active well pads the ability to expand even if they are within the new setback distances. If exceptions are granted, the facility must include additional mitigation measures to lessen air and noise pollution and safeguard against potential spills due to the proximity of communities.
Source: COGCC
In 2015, the University of Denver and the Sierra Club conducted a review of compliance with these setback regulations, finding that 181 permits approved after the rules were enacted lacked legally required information. These permits will result in 951 wells, 1221 oil and condensate tanks, and 932 separators throughout the state, concentrated in counties like Garfield, La Plata, and Weld that have the most widespread oil and gas development. This review identified that in Weld County, permits for 798 wells, 1140 tanks, and 800 separators lacked critical information the COGCC required.
In February of this year, a study published in Environmental Health Perspectives evaluated the adequacy of setbacks in Pennsylvania, Texas, and Colorado. The researchers concluded that the current s setbacks are insufficient to protect public health and safety, leaving communities vulnerable. Further, they claim while that there is no defined setback that will ensure the safety of a population, all three states should adopt larger setbacks distances and increased mitigation measures.
Continued Demands
Armed with health and safety information, evidence of COGCC lack of enforcement, and the lived experiences of Coloradans, communities and groups are organizing around ballot initiatives. These initiatives would become part of the state constitution, and would to increase setback distances and secure the ability of local governments to determine where development occurs within their boundaries. Unlike the internal rules and regulations determined by the COGCC, these additions to the state constitution would offer no exceptions.
The Western Colorado Congress (WCC) a group that organizes communities around threats to environmental and public health, advocated in 2013 for 1,000-foot setbacks from homes and 1,500-foot setbacks from schools. They continue to push for increased distances and support ballot initiatives that allow local governmental control of oil and gas development. Current ballot initiatives, created by Coloradans Resisting Extreme Energy Development (CREED) demand local government control of oil and gas infrastructure and 2,500-foot setbacks from homes, schools, outdoor recreation areas, and sources of drinking water. This setback distance is based on a Colorado health study, concluding that people living with a half-mile of wells had an increased risk of illness than those further away.
Weld County: A Closer Look
Weld County has experienced dramatic oil and gas development, with increasing infrastructure permitted closer and closer to residents’ homes and communities. Currently, there are over 12,200 directional wells in Weld County and over 35,300 wells in total. The map below uses data accessed from the COGGC on April 7th, 2016 and address points data from Weld County. The address points are located within the center of homes, and while setbacks distances are measured from the center of the well pad to the nearest wall of the building, the address points still demonstrate the proximity and danger of encroaching infrastructure. The map identifies directional wells permitted within the designated setback of 500 feet and the buffer zone of 1,000 feet and pending directional wells within proposed 1,000 and 2,500-foot setbacks. Address points within these setbacks are identified, and if you select the Directional Lines layer, the underground directional well lines become visible.
The state, the COGCC, and the industry oppose these initiatives, arguing that it will hinder the economic development of Colorado and threaten state control of regulation. Industry advocates have claimed that a 2,500-foot setback would eliminate 87% of new operations in Weld County. This strong opposition often results in such initiatives being dropped or voted out, a reality that occurred earlier this month when two of three initiatives relating to oil and gas were voted down the state house of representatives.
Currently, 48% of addresses (around 53,700) in Weld County are within 2,500 feet of at least one directional well, and 9% are within 1,000 feet. Since August 2013, 16 directional wells have been permitted within 500 feet of buildings, and 207 have been permitted within 1,000 feet. Regarding new operations in Weld County, of the 379 pending directional wells, 319 of them are within 2,500 feet of homes – around 84% – slightly less than the industry claimed, but close. However, is important to note that many pending wells are planned on existing well pads, constructed prior to the new rules, and can be given exceptions. Additionally, the technology of directional drilling allows greater flexibility. When viewing the directional lines on the map, it is clear that wells can be drilled in any direction from a well pad, suggesting that companies could place surface wells further away from homes and still access the underground resource.
Moving Forward With Setbacks
Demands for protection from oil and gas encroachment are steadily increasing. The group, Coloradans Against Fracking, a large coalition of organizations, has endorsed the 2016 ballot initiatives put forward by CREED. It is clear that the state can accept continuous challenges to oil and gas development, particularly if rules and regulations are neglected at the expense of public health and safety.
Feature image by Western Colorado Congress (WCC).
https://www.fractracker.org/a5ej20sjfwe/wp-content/uploads/2016/04/Setbacks-Shamer-Feature.jpg400900FracTracker Alliancehttps://www.fractracker.org/a5ej20sjfwe/wp-content/uploads/2021/04/2021-FracTracker-logo-horizontal.pngFracTracker Alliance2016-04-26 12:02:072020-03-12 17:30:05Colorado Setbacks, One Step Forward?
Kyle Ferrar, Western Program Coordinator & Kirk Jalbert, Manager of Community-Based Research & Engagement
Key Takeaways
Communities living along the North Coast of the East Bay region in California are the most impacted by the presence of the petrochemical industry in their communities.
Emissions from these facilities disproportionately degrade air quality in this corridor region putting residents at an elevated risk of cancer and other health impacts.
People of color are more likely to live near the refineries and are therefore disproportionately affected.
Refinery Corridor Introduction
The North Coast of California’s East Bay region hosts a variety of heavy industries, including petroleum refineries, multiple power plants and stations, chemical manufacturing plants, and hazardous waste treatment and disposal facilities. Nationwide, the majority of petroleum refineries are located in heavily industrialized areas or near crude oil sources. The north coast region is unique. Access to shipping channels and the location being central to the raw crude product from North Dakota and Canada to the North, and California’s central valley oil fields to the south has resulted in the development of a concentrated petrochemical infrastructure within the largely residential Bay Area. The region’s petrochemical development includes seven fossil fuel utility power stations that produce a total of 4,283 MW, five major oil refineries operated by Chevron, Phillips 66, Shell Martinez, Tesoro, and Valero, and 4 major chemical manufacturers operated by Shell, General Chemical, DOW, and Hasa Inc. This unequal presence has earned the region the title, “refinery corridor” as well as “sacrifice zone” as described by the Bay Area Refinery Corridor Coalition.
The hazardous emissions from refineries and other industrial sites are known to degrade local air quality. It is therefore important to identify and characterize the communities that are affected, as well as identify where sensitive populations are located. The communities living near these facilities are therefore at an elevated risk of exposure to a variety of chemical emissions. In this particular North Coast region, the high density of these industrial point sources of air pollution drives the risk of resultant health impacts. According to the U.S.EPA, people of color are twice as likely to live near refineries throughout the U.S. This analysis by FracTracker will consider the community demographics and other sensitive receptors near refineries along the north coast corridor.
In the map below (Figure 1) U.S. EPA risk data in CalEnviroscreen is mapped for the region of concern. The map shows the risk resulting specifically from industrial point sources. Risk along the North Coast is elevated significantly. Risk factors calculated for the region show that these communities are elevated above the average. The locations of industrial sites are also mapped, with specific focus on the boundaries or fencelines of petrochemical sites. Additional hazardous sites that represent the industrial footprint in the region have been added to the map including sites registered with Toxic Release Inventory (TRI) permits as well as Superfund and otherComprehensive Environmental Response, Compensation, and Liability Act (CERCLA) sites. The Toxmap TRI sites are facilities that require a permit to emit hazardous air pollutants. The superfund and other CERCLA sites are locations where a historical footprint of industry has resulted in contamination. The sites are typically abandoned or uncontrolled hazardous waste sites that are part of register for tax-funded clean-ups.
Figure 1. Interactive map of risk in the East Bay’s North Coast refinery corridor
Oil refineries in particular are unique sources of air emissions. There are 150 large domestic refineries throughout the United States. They are shown in the map in Figure 2 below. The majority (90%) of the refined products from these refineries are fuels; motor vehicle gasoline accounts for 40%. The refinery sites have hundreds of stacks, or point sources, and they emit a wide variety of pollutants, as outlined by the U.S. EPA:
Criteria Air Pollutants (CAPs)
Sulfur Dioxide (SO2)
Nitrogen Oxides (NOx)
Carbon Monoxide (CO)
Particulate Matter (PM)
Volatile Organic Compounds (VOCs)
Hazardous Air Pollutants (HAPs)
Carcinogens, including benzene, naphthalene, 1,3-butadiene, PAH
Non-carcinogenic HAP, including HF and HCN
Persistent bioaccumulative HAP, including mercury and nickel
Greenhouse Gases (GHG)
Hydrogen Sulfide (H2S)
Figure 2. Map of North American Petroleum Refineries
Disparate health impacts are therefore a known burden for these Bay Area communities. The region includes the cities of Richmond, Pinole, Hercules, Rodeo, Crockett, Port Costa, Benicia, Martinez, Mt. View, Pacheco, Vine Hill, Clyde, Concord, Bay Point, Antioch, and Oakley. In addition to preserving the ecological system health of this intercostal region is also important for both the ecological biodiversity of the marsh as well as commercial and recreational purposes. These wetlands provide a buffer, able to absorb rising waters and abate flooding.
The Bay Area Air Quality Management District’s (BAAQMD) Cumulative Impacts report identified areas where air pollution’s health impacts are relatively high in the San Francisco Bay Area. The report is does not limit their analysis to the North Coast, but shows that these regions with the most impacts are also the most vulnerable due to income, education level, and race and ethnicity. The report shows that there is a clear correlation between socio-economic disadvantages and racial minorities and the impacted communities. Figure 3 shows the regions identified by the BAAQMD as having the highest pollution indices.
Analysis
This analysis by FracTracker focuses specifically on the north shore of the East Bay region. Like the BAAQMD report, National Air toxic Assessment (NATA) data to identify census tracts with elevated risk. Specifically, elevated cancer and non-cancer risk from point sources emitting hazardous air pollutants (HAPs) as regulated by the U.S. EPA were used. CalEnviroScreen 2.0 data layers were also incorporated, specifically the U.S. EPA’s Risk Screening Environmental Indicators (RSEI) data. RSEI uses toxic release inventory (TRI) data, emission locations and weather to model how chemicals spread in the air (in 810m-square grid units), and combines air concentrations with toxicity factors.
The census tracts that were identified as disproportionately impacted by air quality are shown in the map below (Figure 4). The demographics data for these census tracts are presented in the tables below. Demographics were taken from the U.S. census bureau’s 2010 Census Summary File 1 Demographic Profile (DP1). The census tracts shapefiles were downloaded from here.
Figure 4. Interactive Map of Petrochemical Sites and Neighboring Communities in the East Bays North Coast Industrial Corridor
Buffers were created at 1,000 ft; 2,000 ft; and 3,000 ft buffers from petrochemical sites. These distances were developed as part of a hazard screening protocol by researchers at the California Air Resources Board (ARB) to assess environmental justice impacts. The distances are based on environmental justice literature, ARB land use guidelines, and state data on environmental disamenities (Sadd et al. 2011). A demographical profile was summarized for the population living within a distance of 3,000 feet, and for the census tracts identified as impacted by local point sources in this region. The analysis is summarized in Table 1 below. Additional data on the socioeconomic status of the census tracts is found in Table 2.
Based on the increased percentage of minorities and indicators of economic hardship shows that the region within the buffers and the impacted census tracts host a disproportionate percentage of vulnerable populations. Of particular note is 30% increase in Non-white individuals compared to the rest of the state. We see in Table 2 that this is disparity is specifically for Black or African American communities, with an over 150% increase compared to the total state population. The number of households reported to be in poverty in the last 12 months of 2014 and those households receiving economic support via EBT are also elevated in this region. Additional GIS analysis shows that 7 healthcare facilities, 7 residential elderly care facilities, 32 licensed daycares, and 17 schools where a total of 10,474 students attended class in 2014. Of those students, 54.5% were Hispanic and over 84% identified as “Non-white.”
Table 1. Demographic Summaries of Race. Data within the 3,000 ft buffer of petrochemical sites was aggregated at the census block level.
Total Population
Non-White
Non-White (%ile)
Hispanic or Latino
Hispanic or Latino (%ile)
Impacted Census Tracts
387,446
212,307
0.548
138,660
0.358
3,000 ft. Buffer
77,345
41,696
0.539
30,335
0.392
State Total
37,253,956
–
0.424
–
0.376
Table 2. Additional Status Indicators taken from the 2010 census at the census tract level
Indicators (Census Tract data)
Impacted Count
Impacted Percentile
State Percentile
Children, Age under 5
27,854
0.072
0.068
Black or African American
60,624
0.156
0.062
Food Stamps (households)
–
0.1103
0.0874
Poverty (households)
–
0.1523
0.1453
Conclusion
The results of the refinery corridor analysis show that the communities living along the North Coast of the East Bay region are the most impacted by the presence of the petrochemical industry in their communities. Emissions from these facilities disproportionately degrade air quality in this corridor region putting residents at an elevated risk of cancer and other health impacts. The communities in this region are a mix of urban and single family homes with residential land zoning bordering directly on heavy industry zoning and land use. The concentration of industry in this regions places an unfair burden on these communities. While all of California benefits from the use of fossil fuels for transportation and hydrocarbon products such as plastics, the residents in this region bear the burden of elevated cancer and non-cancer health impacts.
Additionally, the community profile is such that residents have a slightly elevated sensitivity when compared to the rest of the state. The proportion of the population that is made up of more sensitive receptors is slightly increased. The region has suburban population densities and more children under the age of 5 than average. The number of people of color living in these communities is elevated compared to background (all of California). The largest disparity is for Black or African American residents. There are also a large number of schools located within 3,000 ft of at least one petrochemical site, where over half the students are Hispanic and the vast majority are students of color. Overall, people of color are disproportionately affected by the presence of the petrochemical industry in this region. Continued operation and any increases in production of the refineries in the East Bay disproportionately impact the disadvantaged and disenfranchised.
With this information, FracTracker will be elaborating on the work within these communities with additional analyses. Future work includes a more in depth look at emissions and drivers of risk on the region, mapping crude by rail terminals, and working with the community to investigate specific health endpoints. Check back soon.
https://www.fractracker.org/a5ej20sjfwe/wp-content/uploads/2016/03/chevron-refinery_cover.jpg400900Kyle Ferrar, MPHhttps://www.fractracker.org/a5ej20sjfwe/wp-content/uploads/2021/04/2021-FracTracker-logo-horizontal.pngKyle Ferrar, MPH2016-03-30 20:56:352020-03-12 17:30:45Petrochemical Industry Presence in East Bay CA’s North Coast Refinery Corridor
Ludington State Park, Sargent Sand’s Mine, and US Silica and Sylvania Minerals By Ted Auch, Great Lakes Program Coordinator
When it comes to high-volume hydraulic fracturing (HVHF), frac sand mining may be the most neglected aspect of the industry’s footprint. (HVHF demand on a per-well basis is increasing by 8% per year.)
To help fill this gap I decided to head out on the road to visit, photograph, and listen to the residents of this country’s primary frac sand communities. This multimedia perspective is part of our ongoing effort to map and quantify the effects of silica sand mining on communities, agriculture, wildlife, ecosystem services, and watersheds more broadly. Below is my follow up attempt to give The FracTracker Alliance community a sense of what residents are hearing, seeing, and saying about the silica sand mining industry writ large, through a tour of 7 sand mining communities – part 2. Read part 1.
Monroe County, MI
Monroe County, Michigan is approximately 22 miles south on I-75 from downtown Detroit with similar demographic differences to the Chicago-LaSalle County, IL comparison we made during the first part of this series. South Rockwood lies along the Northeastern edge of Monroe County and the Monroe-Wayne County border, and is consequently at the intersection of Detroit’s sprawl and rural Michigan.
Monroe County and nearly all of South Rockwood is underlain by one of the purest sandstone formations in North America. The Sylvanian Sandstone formation lies beneath 20% of Monroe County stretching from the aforementioned Wayne County border south-southwest to Lucas County, OH (Fig. 1). It is this formation that mining stalwarts such as US Silica and the appropriately named Sylvanian Minerals are mining for frac sands. Not only is the silica pure, but it is also extremely close to the surface. The region, conveniently, is situated at the crossroads of numerous rail lines capable of transporting the sand to shale plays in the east and North Dakota alike.
US Silica and Sylvanian Minerals are neighbors at the corner of Ready and Armstrong Roads in South Rockwood, with the former adjacent to I-75’s southbound lanes (Fig. 2). As of fall 2011, Sylvanian Minerals hadn’t even broken ground on its initial stab at mining frac sands. Presently the two firms have altered nearly 650 acres, or 40% of the community, with the potential to mine an additional 494 acres. These plans suggest that these two companies could collectively alter 72% of the community’s topography.
This domination of the landscape and commerce concerns many South Rockwood citizens including Sylvanian’s immediate neighbor Doug Wood, who has been the industry’s primary citizen watchdog over the last couple years (photo below).
Mr. Wood was generous enough to let us climb to the top of his barn to snap some photos of the mine. Mr. Wood witnessed the foundation of his home become compromised by the numerous blasting events down in Sylvanian’s mine, and only recently found out that the collective activity at the mines is going to force exit 26 off I-75 to be rerouted to Ready Road, converting this sleepy road into the primary entrance/exit for mine-related traffic. In addition, with the approval of Michigan’s Governor Rick Snyder, US Silica’s Telegraph Road Mine proposal has Mr. Wood and his neighbors worried about the safety of their families, the air pollution they inhale from the dust and potentially airborne silica, and the truck traffic related noise, which will all undoubtedly influence their health and quality of life.
The primary take-home message from this stop on my tour was that we have only seen the tip of the iceberg with respect to the potential of frac sand mining to literally and figuratively alter communities. Other affected areas such as South Rockwood could learn quite a bit from the likes of LaSalle County, IL residents Anna Mattes, Tom Skomski, and Ashley Williams.
On to the dunes of Western Michigan and Ludington State Park!
Ludington State Park and Sargent Sand’s Mine
After several days in Grand Rapids, I traveled to Ludington State Park in Michigan (see Fig 4 below), along with documentarian/drone pilot Tom Gunnels and Kent County Water Conservation’s Stephanie Mabie. Our destination was the camp of Linda and Ron Daul, the residents spearheading an effort to make Sargent Sand more accountable and transparent in its mining operations. There camp is also located within and adjacent to one of the most sensitive ecosystems in North America.
This is a documentary produced by Tom Gunnels and his Hive•Mind team that incorporated interviews and drone footage from our Ludington/Sargent Sand mine tour August, 2015.
Ms. Daul was kind enough to organize a tour of the mine, Ludington State Park, and northern hardwood forest for us, as well as journalist Aaron Selbig, who produced a piece on the tour for Interlochen Public Radio. The scenery sans the sand mining infrastructure, noise, and related truck traffic was beautiful in this little corner of Michigan roughly half way between Grand Rapids and Traverse City.
Michigan’s unique and threatened dune ecosystems – and associated Jack Pine (Pinus banksiana) “plains” or “barrens” ecosystem1 – comprise of 116 square miles of coastline along Lake Michigan. Unfortunately, they are simultaneously deprived of the fire regimes they require to regenerate, and are targets for the production of frac sands with Ludington State Park being the primary example. This makes the feasibility of reclaiming original plant communities dubious at best. (There have been mixed results associated with reclamation efforts, for example, at the former Rosy Mound Standard Sand Corporation’s mine 80 miles due south in Grand Haven, see Fig. 5.)
The largest obstacle to reclamation of sand mines along Lake Michigan is the inability of practitioners to document and replicate the many “microenvironments,” which as Peterson and Dersch pointed out:
…are the small environments created by differences in temperature, moisture, and light intensity within the sand dune ecosystem. Examination of these small environments is essential to a clear understanding of the ‘whole’ ecosystem. The diversity of organisms in sand dune areas is made possible by the variety of habitats found in relatively small areas. Any alteration of the dune which homogenizes the ecosystem will allow less diversity of plants and animals.
The Great Lakes dune complex requires perennial vegetation, wind, and sand for continued formation and stabilization with a complex – and specifically adapted – mosaic of lichens, fungi, mosses, grasses, wildflowers, shrubs, and trees arranged in a complicated and multi-layered manner across much of Western Michigan’s lakeshore. As Michigan’s DNR put it:
Without sand dune plants, the integrity and preservation of a stable dune complex cannot exist.
In combination with the Michigan Supreme Court’s constant fiddling of the intent and letter of mineral extraction law, namely the “very serious consequences” clause in House Bill 4746 (2011), you have the makings of a scenario that could eliminate upwards of 16 square miles of Michigan’s critical dunes in the coming years or 9-14% of the entire complex.2
In addition to Pitcher’s Thistle, systems – like those found along the western edge of Michigan – are home to more than 15 endemic, or nearly so, plant species such as:
Wormwood (Artemisia campestris, aka the source of Absinthe),
The early colonizer sea-rocket (Cakile edentula),
Clustered Broom-Rape (Orobanche fasciculata),
Harebell (Cakile edentula, at the edge of Sargent Sand’s Ludington mine), and
Hoary Puccoon (Lithospermum canescens), and the species most responsible for dune stabilization Marram Grass (Ammophila sp.).
Additionally, these dunes are critical to the life-cycles of more than 10 different species of birds, reptiles, and herbivores including the Eastern Hog-nosed Snake, Eastern Box Turtle, American Goldfinch, and everybody’s favorite, the White-Tailed Deer.
Table 1. Number of Threatened, Endangered, and Rare Plant Species within Western Michigan’s Dune Complex
Criteria
# of Species within Michigan’s Dune Complex
Michigan Threatened Species List
72
Michigan Endangered Species List
7
Michigan Rare Species List
3
Extinct
4
US Endangered Species List
1
US Threatened Species List
11
Modified from State of Michigan Department of Natural Resources, Geological Survey Division, 1979.
Finally, it is of importance to mention the final stage of dune succession are the beech-maple forests, which take an estimated 1,000 years to be achieved according to Jerry Olson (1958). With that said let’s take a look at some of the pictures and testimonial I gathered during my trip to The Great Lake(s) State…
The Photos
A. Sylvanian Minerals and US Silica, South Rockwood, Monroe County, MI from Doug Wood’s barn
Location where below photos were taken, showing the Sylvanian Minerals and US Silica Mine Complex, South Rockwood, Monroe County, MI
B. Ludington State Park and Sargent Sand’s Silica Sand Mine, Ludington, Mason County, MI
Ecosystems and Native Plants of Ludington State Park, Mason County, MI (16 images, 11 species)
Sargent Sand and Ludington State Park photography point-of-view and Tom Gunnel’s drone flight path
Ecosystems (8 images, 3 ecosystems within or adjacent to the mine)
C. Eastern Mine Point-Of-View
Active mine operations and reclaimed parcels (8 images)
D. Ludington State Park Point-Of-View
Overburden stockpile, haul roads, and grain separator (7 images)
E. Drone Screenshots Courtesy of documentarian Tom Gunnels at Hive•Mind
The cards are definitely stacked against you when there is a silica quarry right next door to your dream home/property. We toiled for years to green it up with trees and grass, a labor of love for our “place in the country”. I mean, what’s not to love about semi-truck traffic, air pollution, house tremors not to mention plummeting property values! Since South Rockwood village annexed the quarry in 2010, placing a quarry wall literally 300 feet from my home, we deal with noise of crushers, loaders, drilling for blasting, and blasting. All the while we are left to wonder what kind of garbage we are inhaling since there seems to be NO REGULATIONS, AIR MONITORING OR DUST CONTROL MEASURES AT ANY TIME!! And if that isn’t enough, the village wants to relocate the freeway ramps to our road for the quarry’s trucking convenience.
Al (Chip) Henning, Ludington, MI
Sargent Sand Company has owned this site since the 1920s. The Big Sable Dune Complex is roughly twice the size of Sleeping Bear Dunes National Lakeshore, and includes the Nordhouse Federal Wilderness. If Sargent completes their mining as projected over the next 30-40 years, the Ludington Dunes (about 40% of the Complex) will be 60-70% destroyed/mined/removed, sent primarily to Pennsylvania for hydraulic fracturing in the Marcellus Shale formation. Sargent has removed 10-15% of the Ludington Dunes, to date, and faces permit renewal in January 2016. My family owns several properties which abut Ludington State Park, whose lands surround the Sargent property narrowly on three sides. Our property lies 1200 feet from the Sargent operations at closest approach; aside from the unsustainable removal of the sands, the noise from Sargent’s 24-7-365 operations is frequently intolerable.
Linda Bergles Daul, Ludington, MI
Fracking sand is mined from ancient geological sand deposits, extremely rare across the globe. In Michigan, the Sargent Sand – Ludington (State Park) Site, on the west coastline of Lake Michigan, enjoys a controversial, grandfathered permit to mine irreplaceable sand in critical dunes for horizontal fracking application. When the Sargent Sand mine is operating, the peaceful retreat of Hamlin Lake might as well be a downtown Chicago construction site, sharing heavy truck traffic, air pollution and mine numbing noise with our Pure Michigan visitors. The beauty and majesty of Ludington State Park has enriched my life. The critical dunes are one of Michigan and LSP’s most spectacular natural features – they also are one of our most fragile! The dunes are a phenomenon unique to the State of Michigan and yet we allow permitted critical sand dune mining right next to LSP. Sargent sand expansion towards LSP resulting in the removal of 200 year-old stabilizing trees, dredging to create artificial lakes, disregard for wildlife and the critical dune ecosystem, should be addressed within LSP master plans. I would like to see a world-class, university associated educational program established at Ludington State Park, addressing dune ecosystems. The LSP master plan should deliberately study the impact of Sargent Sand Mining operation and propose a broader vision that will consolidate the park in a way that preserves its beauty for future generations. [Furthermore] The State of Michigan Sec. 35302 The legislature finds that: (a) The critical dune areas of this state are a unique, irreplaceable, economic, scientific, geological, scenic, botanical, educational, agricultural, and ecological benefits to the people of this state and to people from other states and countries who visit this resource. EXCEPT if the activity is involved in sand dune mining as defined in part 637.
Sargent Sands sand mining has been viewed as mainly negative in the Ludington-Mason County community. This company was “dormant” until hydraulic fracturing became somewhat popular. Most citizens and visitors do not like to see the dunes removed in this area so close to the Ludington State Park. Destruction of critical dune area and possible endangered plants are the main concerns. Other impacts to this community include the immense noise created by the mining for families with homes by the mine and all the trucks going through town to the freight trains. Another issue is the wear on the roads. Also mentioned to me was the time spent waiting at the train crossings because of the sand being transported to other areas via trains. I really haven’t heard any positive comments. My guess would be that the mining creates jobs for the truckers, train workers, and of course the employees of the company. As far as in the future there are rumors that Sargent Sands will continue to mine and then make the area a destination place with condos around the lake they created. This is turn will bring more traffic to the dunes, not a sustainable idea!
I really do “get it” in understanding that jobs are critically important for our State. Mouths are fed, bills are paid, colleges are attended. But the damage to Ludington left in Sargent Sands’ wake when it is done here someday will be permanent scars from the removal of Sand Dunes so rare and so beautiful, that I’m certain that we will all regret what we allowed to happen while on “our watch”. I believe that Ludington’s precious Sand Dunes are not really “ours”…to destroy or allow to be taken. They are timeless natural resources that we have simply been granted stewardship over by our own forefathers and mothers. Allow our children and great grandchildren the privilege of seeing and enjoying what we ourselves have been lucky enough to have seen and touched. “As a native Michigander and 13 year resident of Ludington, I can confidently tell anybody willing to listen that Sargent Sands is (at this very moment) irreversibly destroying one of Michigan’s last remaining precious and timeless natural resources. We… OWE IT to generations that follow us, the right to marvel at and enjoy what is one of this Country’s uniquely beautiful natural treasures… Ludington’s sand dunes. I ignorantly believed, at first, when Sargent Sands began mining sand again here that it would be something akin to raking one’s yard of leaves. When I had an opportunity to hike their mining operation’s perimeter, I witnessed what looks like strip-mining devastation. It’s saddens me that I was complicit (when I myself purchased some sand for my backyard from Sargent’s) but I am more frightened that our own DEQ (who should have known better) would have ever approved such disfiguring and permanent alteration to something so rarely seen in nature. I myself have marveled…at something that I believe only a few places on Earth possess…sand dunes so unique, so beautiful and so rarely seen (and…FREE to hike and to look at !) along a freshwater lake that happens to be what is increasingly being recognized as our Country’s lifeblood. In the Winter here when it snows, I often wonder how many people in other countries can even imagine what snow blowing in sand dunes looks like…the beautiful swirling mixture of sandy snow wrapping around dune grasses that stretch as far as the eyes can see –but now being trucked away. I ask our State, especially in light of Flint’s man made devastation, PLEASE do not allow this to continue when Sargent Sands’ permit expires in December of 2016. This sand mining destruction cannot be undone.
Additional Readings
Buckler, W.R., 1978. Dune Type Inventory and Barrier Dune Classification Study of Michigan’s Lake Michigan Shore, in: Resources, M.D.o.N. (Ed.). Michigan Department of Natural Resources, Lansing, MI.
Cowles, H.C., 1899. The Ecological Relationship of the Vegetation on the Sand Dunes of Lake Michigan. Botanical Gazette 27, 95-117, 167-202, 281-308, 361-391.
Cressey, G.B., 1928. The Indian sand Dunes and Shore Lines of the Lake Michigan Basin, The Geographic Society of Chicago Bulletin. The University of Chicago Press, Chicago, IL.
Daniel, G., 1977. Dune Country A Guide For Hikers and Naturalists. The Shallow Press Inc., Chicago, IL.
Dorr, J.A., Eschman, D.F., 1970. The Geology of Michigan. University of Michigan Press, Ann Arbor, MI.
Kelley, R.W., 1962. Sand Dunes, A Geologic Sketch, in: Conservation, M.D.o. (Ed.). Michigan Department of Natural Resources, Lansing, MI.
Koske, R.E., Sutton, J.C., Sheppard, B.R., Ecology of Endogone in Lake Huron Sand Dunes. Canadian Journal of Botany 53, 87-93.
Olson, J.S., 1958. Rates of succession and soil changes on Southern Lake Michigan sand dunes. Botanical Gazette 119, 125-170.
Peterson, J.M., Dersch, E., 1981. A Guide To Sand Dune and Coastal Ecosystem Functional Relationships, in: Service, M.C.E. (Ed.). Michigan Cooperative Extension Service, Lansing, MI.
Ranwell, D.S., 1972. Ecology of Salt Marshes and Sand Dunes. Chapman and Hall, London, UK.
Reinking, R.L., Gephart, D.G., 1978. Pattern of Revegetation of a Shoreline Dune Area, Allegan County, Michigan. The Michigan Academician 11.
Thompson, P.W., 1967. Vegetation and Common Plants of Sleeping Bear. Cranbrook Institute of Science, Bloomfield Hills, MI.
Footnotes for 7 Sand Mining Communities, 3 States, 5 Months – Part 2
Michigan’s DNR describes this ecosystem as having “always contained few large trees and little or no old growth. A forest where soils are dry and the vegetation sparse, it is called a barrens. A forest periodically swept by raging fires, only to spring back, fresh and revitalized. A forest which is amazingly productive and biologically diverse, providing homes for numerous plants and animals, many of them [endemic]. Today [we are]…seeking to extract its resources, enjoy its beauty, explore its secrets, and preserve its life. The jack pine forests can exist, only if we care.”
As Michigan State researchers pointed out the Michigan coastal dune ecosystem exists in small fragments along the Atlantic Coastal Plain but nowhere else in the world
By Sierra Shamer, Visiting Scholar, FracTracker Alliance
Historic 2013 flooding in the Colorado Front Range damaged homes, bridges, roads, and other infrastructure — including hundreds of oil and gas facilities. Companies shut down wells and scrambled to contain spills in their attempts to prevent extensive water contamination. Colorado has since adopted new regulations that require oil and gas companies to identify and secure all infrastructures located within floodplains. However, FEMA’s Flood Hazard maps, which the state uses to calculate flood risk, are largely incomplete, leaving only the industry accountable for reporting facilities that may be at risk in future flooding events. This article highlights the unknown flood contamination risk threatening the Front Range by oil and gas, and the featured map identifies known floodplain infrastructure.
Front Range Realities
Counties of the Colorado Front Range
The Colorado Front Range is the most populated region of the state, covering 17 counties and 7 cities including Boulder, Denver, and Colorado Springs. This region has experienced devastating flash flooding events throughout history, most notably the Big Thompson flood of 1976, which dumped 12-14 inches of rain along the Front Range in only 4-6 hours. The 2013 Colorado Front Range Flood brought almost 15 inches to the region, 9 of which falling within a period of 24 hours. A state of emergency was declared in the region and recovery projects continue to this day.
The Front Range region is not only one of the most populated in Colorado, it is also home to 40% of Colorado’s oil and gas wells. Oil and gas development occurs so rapidly that data reports on pending permits, active permits, and well locations are updated daily by the Colorado Oil and Gas Conservation Commission (COGCC). The damage to oil and gas facilities due to the 2013 floods prompted the COGCC to adopt Rule 603.h, requiring companies to identify proposed and current infrastructure within the floodplain and to create flood mitigation and response plans. On April 1st of this year, all companies with existing infrastructure must comply with Rule 603.h. With over 109,000 wells in the state, an incomplete FEMA database, and only 22 field inspectors, the COGCC has limited capacity to ensure these reports identify all infrastructure within the floodplain.
FEMA Floodplain Gaps
The Federal Emergency Management Agency (FEMA) maintains a national map of the 100-year floodplain for insurance determinations that are in the process of being digitized. These maps show the extent of flooding expected from rain events with a 1% chance of occurring in any given year. They are determined by a combination of topography, satellite imagery, and maps from local jurisdictions. However, in many portions of the western US, these mapped areas are incomplete, including large regions of Colorado. FEMA maps are also the primary floodplain data source used by industry and the by the COGCC. The map below shows the oil and gas infrastructure that is located within the known digital 100-year floodplain as of early February 2016. This map underrepresents the actual number of facilities within the floodplains due to incomplete FEMA data, but provides a clear visual of a widespread problem.
Although FEMA is routinely working to update their dataset, large regions with widespread extraction remain digitally unmapped. While there is accessible floodplain info for the companies to use to determine their status and for the COGCC to verify what the industry reports, the incomplete digitized FEMA data means there is no accessible or efficient way for the COGCC to know if there is infrastructure within a floodplain that hasn’t been reported. This means that more is at risk here than we can calculate. Weld County, a Front Range county and recipient of severe flooding in 2013, starkly exemplifies this reality. In the aftermath of the 2013 flood, Weld County became a disaster zone when 1,900 oil and gas wells were shut down, submerged completely by the rushing water, as thousands of gallons of oil drained out. Until January 2016, Weld County lacked digitally mapped floodplains, and currently only 16% of the river and stream network is available.
The table below lists the percentages of oil and gas infrastructure that exist in Weld County alone that can be calculated using this limited dataset. As of February of this year, 3,475 wells of 35,009 are within the known floodplain in Weld County. Of greater concern, 74% of pending permits statewide are in Weld County – 5% of those in the known floodplain – indicating either an underestimation of flood risk, a blatant disregard of it, or both.
Flooding in the Future
According to the CO Climate Change Vulnerability Study, the state expects a 2.5–5 degree Fahrenheit annual temperature increase by 2050. While this increase is likely to cause earlier spring runoff, more rain at lower elevations, and higher evaporation rates, it is unclear if annual precipitation will increase or decrease with rising temperatures. This uncertainty makes it difficult to know if increased flood risk is in the future. Current flood risk, however, is a known threat. The CO Department of Public Safety’s Flood Hazard Mitigation Plan calculates, based on historical events, that Colorado experiences a flood disaster once every five years. This means that each year, there is a 20% chance a major flood will occur. With incomplete data, limited oversight, and uncertain future trends, oil and gas flood contamination risk is incalculable – and on the Front Range, the majority of Colorado’s population, extractive industry, and environment are in danger.
Dealing with the Unknown
The unknown risks of climate change and known risks of historical flood trends emphasize that identifying oil and gas infrastructure in floodplains must be a high priority for the COGCC. These realities also put into question whether or not future infrastructures should be permitted within floodplains at all. In April, floodplain infrastructure will be identified by the industry and when these data are made available, a more accurate analysis of risk will me made.
Feature photo shows a flooded well and toppled oil storage tanks in Weld County, Colorado 2013 – by Rick Wilking/Reuters.
https://www.fractracker.org/a5ej20sjfwe/wp-content/uploads/2016/03/COFlood-Feature.jpg400900FracTracker Alliancehttps://www.fractracker.org/a5ej20sjfwe/wp-content/uploads/2021/04/2021-FracTracker-logo-horizontal.pngFracTracker Alliance2016-03-17 15:28:302020-03-11 17:09:25Oil and Gas Flood Contamination Risk Incalculable on CO Front Range
Who’s in charge here? By Kyle Ferrar, Western Program Coordinator
FracTracker Alliance recently worked with Clean Water Action to map an update to last year’s report* on the use of unlined, above ground oil and gas waste disposal pits, also known as sumps.
The new report identifies additional oil field wastewater pits and details how California regulators continue to allow these facilities to degrade groundwater, surface waters, and air quality. Other oil and gas production states do not permit or allow these type of operations due to the many documented cases of water contamination. A report published in 2011 identified unlined pits and other surface spills as the largest threat to groundwater quality. The sites are ultimately sacrifice zones, where the contamination from produced water and drilling mud solid wastes leaves a lasting fingerprint.
Central Coast & New Central Valley Pit Data
Figure 1. Central Coast wastewater pits
New data has been released by the Central Coast Regional Water Quality Control Board, identifying the locations of 44 active wastewater facilities and 5 inactive facilities in the California counties of Monterey, Santa Barbara, and San Luis Obispo. The number of pits at each facility is not disclosed, but satellite imagery shows multiple pits at some facilities. The locations of the majority of central coast pits are shown in the map in Figure 1, to the right.
In the web map below (Figure 2), the most updated data shows the number of pits at “active” facilities (those currently operating), shown in red and green, and inactive pits, shown in yellow and orange. The number of pits at each facility in the central valley are shown by the size of the graduated circles. Pit count data for the central coast facilities was not reported, therefore all facilities are shown with a small marker.
Figure 2. Interactive map of California oil field wastewater pits
Exploring the new central coast data shows that the operators with the most facilities include Greka Oil & Gas Inc. (14), E & B Natural Resources (10), ERG Operating Company, LLC (6), and Chevron (5). As shown in the table below, the majority of central coast pits are located in Santa Barbara County.
Table 1. Summaries by County
Site Counts by Activity and County
Facility Counts
Pit Counts
County
Active
Inactive
Active
Inactive
Santa Barbara
35
2
Unknown
Unknown
Monterey
9
0
Unknown
0
San Luis Obispo
0
3
0
Unknown
Kern
161
191
673
347
Fresno
8
5
31
14
Tulare
6
1
28
1
Kings
5
0
14
0
San Benito
0
4
0
5
Grand Total
224
206
746
367
Wastewater Pit Regulations
Way back in 1988, the U.S. EPA recognized that the federal regulations governing disposal practices of wastewater are inadequate to protect public health, but has yet to take action (NRDC 2015). There is little chance the U.S. EPA will enact regulations focused on pits. In certain cases, if wastewaters spill or are discharged to surface waters the operations will fall under the jurisdiction of the Clean Water Act and will require a National Pollutant Discharge Elimination System (NPDES) permit. Since the objective of the pit is to contain the wastewater to keep it away from surface waters, pits and the wastewater facilities in California that manage them do not require federal oversight. For now the responsibility to protect health and environment has been left to the states.
Most states have responded and have strict regulations for wastewater management. For the few states that allow unlined pits, the main use is storage of wastewater rather than as an dedicated method of disposal. The majority of high production states have banned or ended the use of unlined pits, including Texas, North Dakota, Pennsylvania, Ohio, and New Mexico, Texas (Heberger & Donnelly 2015). An effective liner will prevent percolation of wastewaters into groundwater. The goal of California oil field wastewater pits is quite the opposite.
For California, percolation is the goal and a viable disposal option.
Therefore other regulations that require monitoring of liquid levels in the pits are moot. In fact there is no evidence of regulation requiring spill reporting in California whatsoever (Kuwayama et al. 2015).
Numerous other extraction states throughout the country have phased out the use of open pits entirely, including those with liners due to the common occurrence of liner failures. The list includes those new players in the shale boom using hydraulic fracturing techniques such as North Dakota, Ohio, Pennsylvania, Wyoming, and Colorado. Rather than using the pits as storage, these states’ regulatory agencies favor instead the protections of closed systems of liquid storage. Wastewaters are stored in large tanks, often the same tanks used to store the fresh water used in the hydraulic fracturing process.
Because hydraulic fracturing in California uses much less water, it should be much easier to manage the flowback fluids and other wastewaters. According to the CCST report, 60% of the produced water from hydraulic fracturing operations was disposed to these unlined pits. Regardless of extraction technique, oil extraction in California produces 15 times the amount of wastewater. In total, an estimated 40% of all produced water was discharged to unlined “percolation” pits. As the 3rd largest oil producing state in the country, this equates to a massive waste stream of about 130 billion gallons/year (Grinberg 2014).
Regulatory Action
The facilities’ permits identify waste discharge requirements (WDRs) that allow for the discharge of oil field wastewater to the “ground surface, into natural drainage channels, or into unlined surface impoundments.” Using the Race Track Hill and Fee 34 Facilities as an example, the WDRS place criteria limits on total dissolved solids (TDS), chlorides, and boron. If you disregard all the other toxic constituents not monitored, the allowable concentration limits set for these three wastewater constituents would be reasonable for a discharge permit on the east coast, where a receiving body of water could provide the volume necessary for dilution. When the wastewater is applied directly to the ground or into a pit, the evaporative loss of water results in elevated concentrations of these contaminants.
Even with these very lax regulations, a number of facilities are in violation of the few restrictions required in their permits. Cease and desist orders have been several operators, most notably to Valley Water Management’s Race Track Hill and Fee 34 Facilities. According to the Regional Water Board documents, the Fee 34 disregarded salinity limitations and other regulations. As a result the Regional Water Board found soil and groundwater contamination that “threatens or creates a condition of pollution in surface and groundwater, and may result in the degradation of water quality.” Reports show that 6 domestic supply and 12 agricultural supply wells are located within 1 mile of the Fee 34 facility. At the Race Track Hill Facility the wastewater is continuously sprayed over several acre fields in a small watershed of the Cottonwood Creek. During a rain, the salt and boron loadings that have accumulated in the soil over the past 60 years of spraying can create increased salt and boron loading in the Kern River and groundwater. This would be a violation of the Clean Water Act (CVRWQCB 2015).
As shown in Table 2, below, the majority of facilities are currently operating without a permit whatsoever (61.2%). Of the 72 facilities that bothered to get permits, 32 (44.4%) received the permit prior to 1975, before the Tulare Basin Plan was implemented to preserve water quality. Of the 183 active facilities in the Central Valley, only 15 facilities have received Cease and Desist (11% of permitted) or Cleanup and Abatement Orders (6% of unpermitted). Only 3 of the 41 active Central Coast facilities operate with a permit (7.3%).
These types of WDR permits that allow pollutants to concentrate in the soil and the groundwater and degrade air quality. Chemicals that pose a public health risk are not being monitored. But at this point, these facilities are not only sites of legacy contamination, but growing threats to groundwater security. Operators say that closing the pits will mean certain doom for oil extraction in California, and recent letters from operators make pleas to DOGGR, that their very livelihood depends on using the pits as dumping grounds. The pits are the cheapest and least regulated mode of disposal.
Table 2. Facility Status Summaries
Facility Status
Activity
Permitted
Permitted; Cease & Desist Order
Unpermitted
Unpermitted; Cleanup & Abatement Order
Grand Total
Active
75
9
137
6
227
Inactive
20
2
184
3
209
Grand Total
92
11
321
9
433
New Mexico Case Study
Much like the groundwater impacts documented by California’s Central Valley Regional Water Quality Control Board, other states have been forced to deal with this issue. The difference is that other states have actually shut down the polluting facilities. In California, cease and desist orders have been met with criticism and pleas by operators, stating that the very livelihood of the oil and gas industry in California depends on wastewater disposal in pits. The same was said in other states such as New Mexico when these crude and antiquated practices were ended. Figure 3 below shows the locations of wastewater pits in New Mexico and the areas where groundwater was contaminated as a result of the pits.
The New Mexico oil and gas industry predicted in August 2008 that fewer drillers would sink wells in New Mexico, at least in part because of the new pit rule. Pro-industry (oil and gas) state representatives were concerned that new drilling techniques coupled with the pit rules could lead to an industry exodus from New Mexico, hoping that the Governor “would step in to help protect an important state revenue source.” But the state’s average rig count from June — when the pit rule took effect — through December 2008 was 7% higher than it was over the same period in the previous year. Development of oil and gas reserves is independent of such regulation. Read the FracTracker coverage of groundwater contamination in New Mexico, here!
Figure 3. Legacy map of cases where pits contaminated groundwater in New Mexico
https://www.fractracker.org/a5ej20sjfwe/wp-content/uploads/2015/10/Sumps_BrianvanderBrug_LATimes_Revised.jpg400900Kyle Ferrar, MPHhttps://www.fractracker.org/a5ej20sjfwe/wp-content/uploads/2021/04/2021-FracTracker-logo-horizontal.pngKyle Ferrar, MPH2016-03-09 14:39:482020-03-12 17:32:29More Oil Field Wastewater Pits Found in California!
Asserting that the proposed Palmetto Pipeline is essential to supply gas and diesel to the residents of south Georgia and northern Florida, Houston-based energy giant Kinder Morgan has found themselves in the crosshairs of yet another battle. Connecting to the existing Plantation Pipeline, the proposed $1 billion Palmetto Pipeline would run from Belton, SC to terminals in Augusta, SC; Richmond Hill, GA; and Jacksonville, FL, a distance of 360+ miles. Along that corridor currently, gasoline is delivered from inland terminals to ports via trucking companies rather than by pipeline.
In order for the pipeline to be built through Georgia, agreements for a pipeline right-of-way would need to be sealed with 396 private landowners, and the land owned by these private citizens constitutes 92% of the route of the pipeline through the state. According to Kinder Morgan, however, 80% of the pipeline would be build next to (although not within) existing rights-of way for powerlines, pipelines, railroads, and roadways.
Kinder Morgan asserts that the Palmetto Pipeline would create 28 permanent jobs in Georgia. However, opponents of the pipeline measure the flip-side of economic impacts, with more than 250 jobs lost for coastal Georgia truckers, port workers, and Merchant Marines, as a result of changing the transportation medium for the petroleum to pipeline from truck.
The proposed pipeline would carry 167,000 barrels a day of refined petroleum – crossing the Savannah River, four other major watersheds in Georgia (Ogeechee, Altamaha, Satilla, and St. Mary’s), the upper reaches of the Okefenokee watershed, and countless freshwater, tidal, and brackish wetlands. These aquatic and terrestrial ecosystems through which the pipeline would pass are home to diverse numbers of rare and endangered species, as well as sportfish and notable forest habitats. Much of the area is underlain by extensive karst rock deposits, and as such, is especially at risk for groundwater contamination.
Pipeline Push Back
Example of a 42-inch Pipeline Installation in WV
A fight against the pipeline is being waged between the public and Kinder Morgan. Opponents of the pipeline, such as the group “Push Back The Pipeline,” point out contradictions between Kinder Morgan’s rhetoric and the actual situation. For example, although the pipeline will run underground, protected from surface disturbance, should it rupture, the spilled petroleum could still have major impacts on coastal rivers that drain through wetlands, marshes, and into the Atlantic Ocean. Although 80% of landowners approached by Kinder Morgan for rights-of-way agreed to sign leases, it turns out that none of them were given the option not to sign. Kinder Morgan surveyors also trespassed on landowner property in the proposed right-of-way without any permission to be there. Kinder Morgan asserts that the pipeline will reduce reliance on foreign oil, when, in fact, the US is already a net exporter of petroleum products. Kinder Morgan also claims that the need for this oil will only increase, when statistics show that Georgia’s energy demands peaked in 2002, and have fallen 18% between 2005 and 2012 (data from eia.gov). Property owners along the proposed pipeline route are no strangers to spills, either. Kinder Morgan claims that pipelines are the safest method for transporting fuel. As recently as December 2014, however, Kinder Morgan’s Plantation Pipeline in Belton, SC – the location where Palmetto is proposed to start – spilled at least 360,000 gallons of fuel into the ground. Only half of the spilled fuel was recovered.
Opposition to the project is not following party lines. In May of 2015, Georgia’s Republican governor, Nathan Deal, vowed to fight the project in court. Similarly, the Georgia Department of Transportation rejected the proposal, stating that it was not in the public interest, and therefore, seizing the right-of-way by eminent domain was not an acceptable strategy for Kinder Morgan to pursue.
Another formidable opponent of the project is William S. Morris III, a powerful media magnate who owns newspapers in Jacksonville, Savannah, and Augusta and has been providing continual coverage of the controversy. Morris also owns more than 20,000 acres directly along the pipeline route, and could potentially lose an 11- mile corridor of land to eminent domain if the pipeline project is approved.
In late February 2016, a Georgia House subcommittee approved a moratorium on use of eminent domain on petroleum pipelines. Eminent domain would allow Kinder Morgan to take a 50-foot-wide strip of land for the pipeline right-of-way, whether or not the private citizens owning that land were in favor. The bill now moves on to a full committee. Georgia state law also requires that petroleum companies must prove a project meets guidelines of “public necessity” before eminent domain could ever move ahead.
Although Kinder Morgan hopes to see the pipeline built and in service by December 2017, critical components, such as a complete right-of-way, are far from finalized.
See the recent documentary created about the Palmetto Pipeline here:
https://www.fractracker.org/a5ej20sjfwe/wp-content/uploads/2016/03/Palmetto-Pipeline-Feature.jpg400900Karen Edelsteinhttps://www.fractracker.org/a5ej20sjfwe/wp-content/uploads/2021/04/2021-FracTracker-logo-horizontal.pngKaren Edelstein2016-03-04 15:47:472020-03-12 17:32:43Proposed Palmetto Pipeline: At what cost?
My interests include topics such as environmental justice, ecosystem services, watershed resilience, and landscape alteration(s). My work here at FracTracker focuses on the Food, Energy, and Water (FEW) nexus as it relates to hydraulic fracturing and related oil & gas activities/infrastructure with a focus on waste, watershed resilience and freshwater demand, and land-use change.
Previous Position and Organization
2011-2012 Vacant Land Repurposing (VLR) Postdoc, Cleveland Botanical Garden
2012- Present Adjunct Faculty, Cleveland State University, Teaching Intro Environmental Science and Geology, Soil Ecology
How did you first get involved working on oil and gas issues/fracking?
I had experienced the environmental and socioeconomic costs of fossil fuel extraction while I was a graduate student at Virginia Tech researching strip-mine/mountain top removal reclamation best practices as part of the Jim Burger’s Powell River Project. However, it wasn’t until I moved to Ohio in 2011 that I began to become aware of similar issues associated with high-volume hydraulic fracturing (HVHF). I began to notice that there are many parallels between the techniques and how they alter communities, the landscape, and watersheds. Thus, when I found out about the chance to join the FracTracker team here in Ohio I saw that it was an opportunity I could not pass up.
What is one of the most impactful projects that you have been involved in with FracTracker?
The projects I am most proud in my capacity here at FracTracker would be our research into the effects of HVHF freshwater demand on the resilience/security of the Muskingum River Watershed in eastern Ohio and our work shedding light on the effects of frac sand mining across several Midwestern states. The latter topic is poorly understood on many levels, and we hope that our work has/will highlight the gaps in understanding and potential research opportunities.
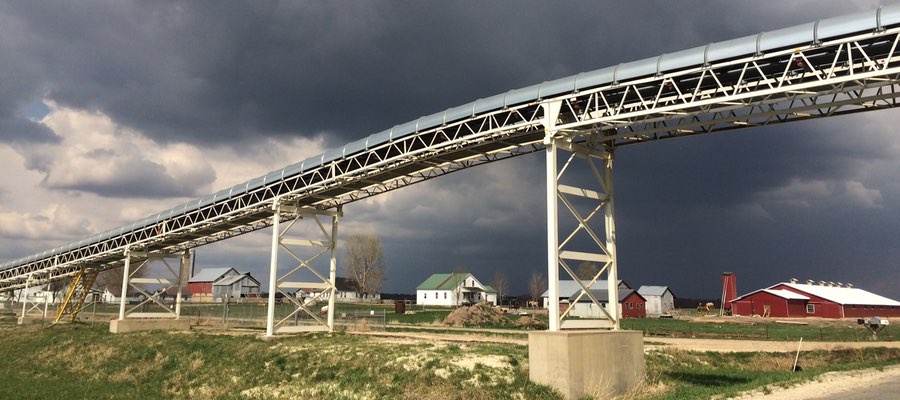
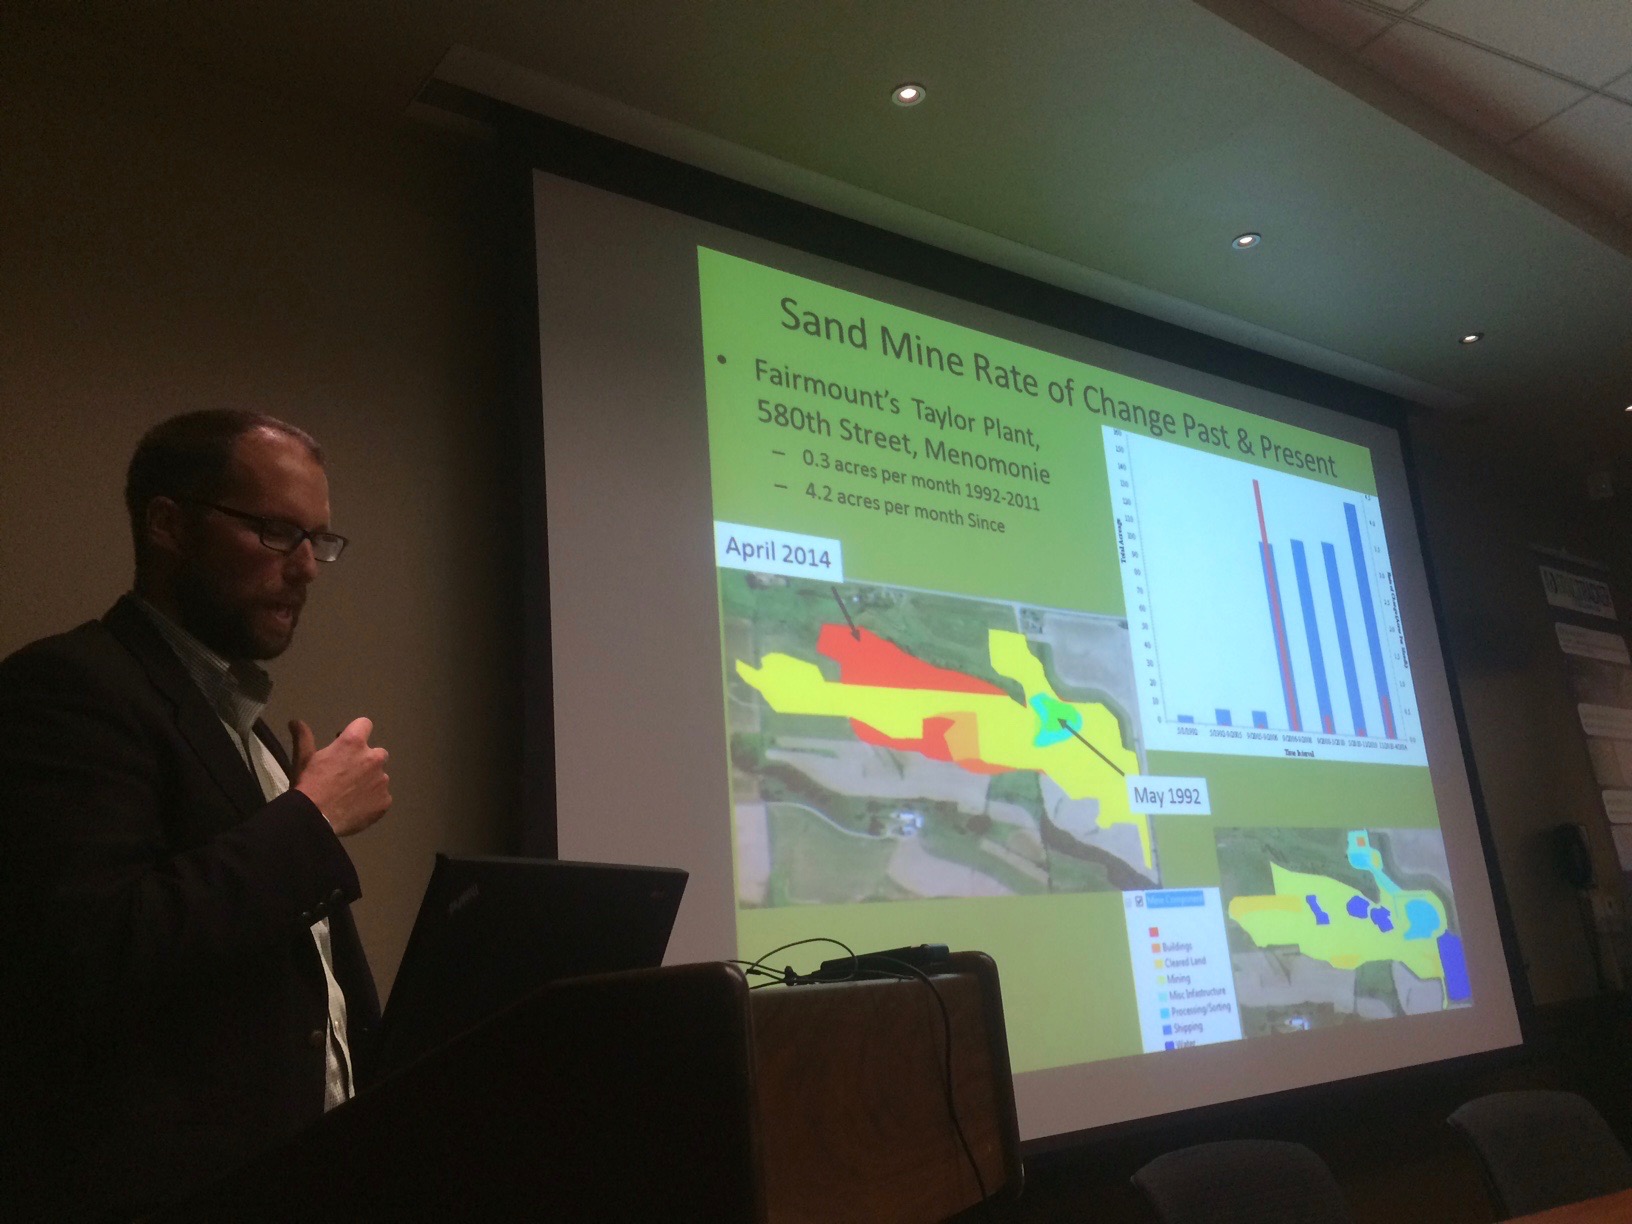
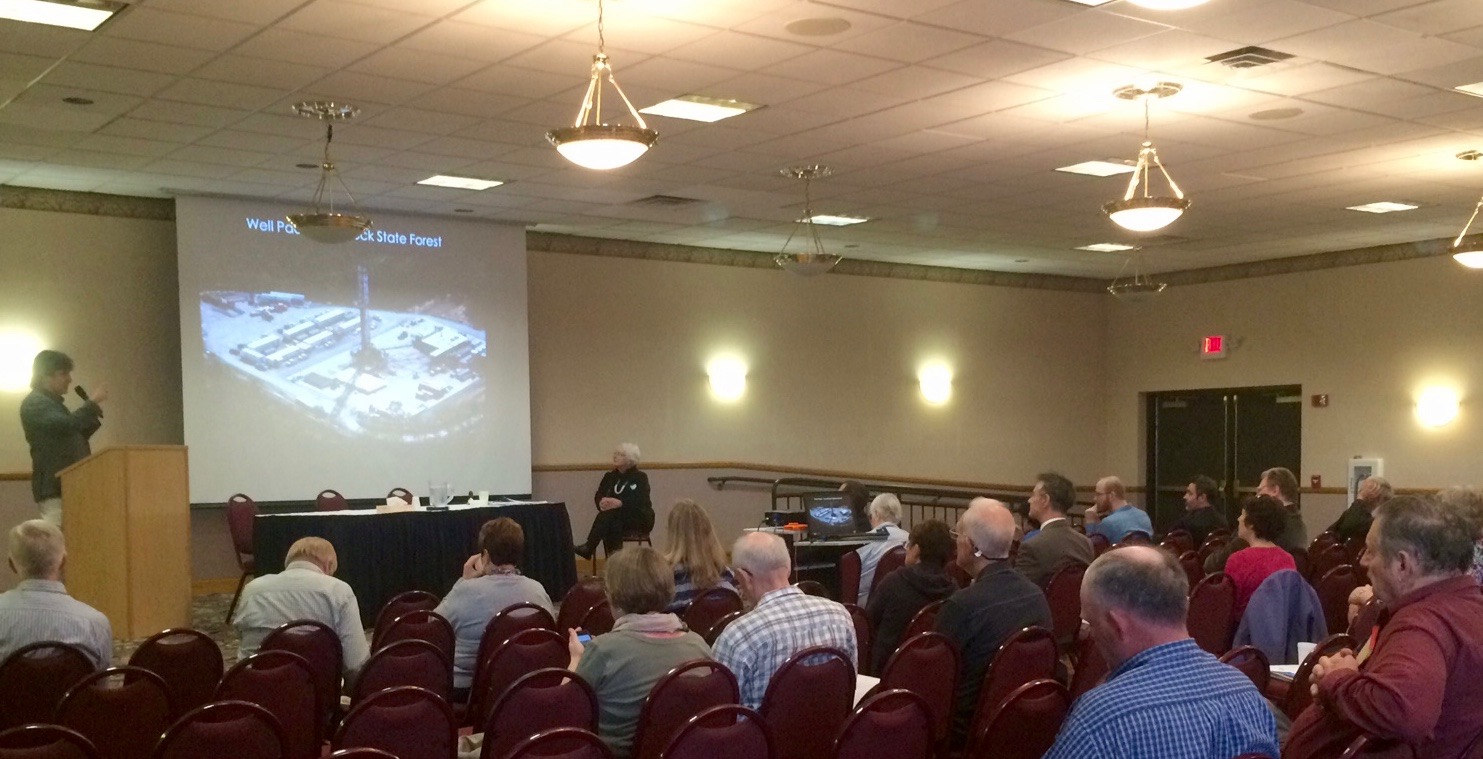


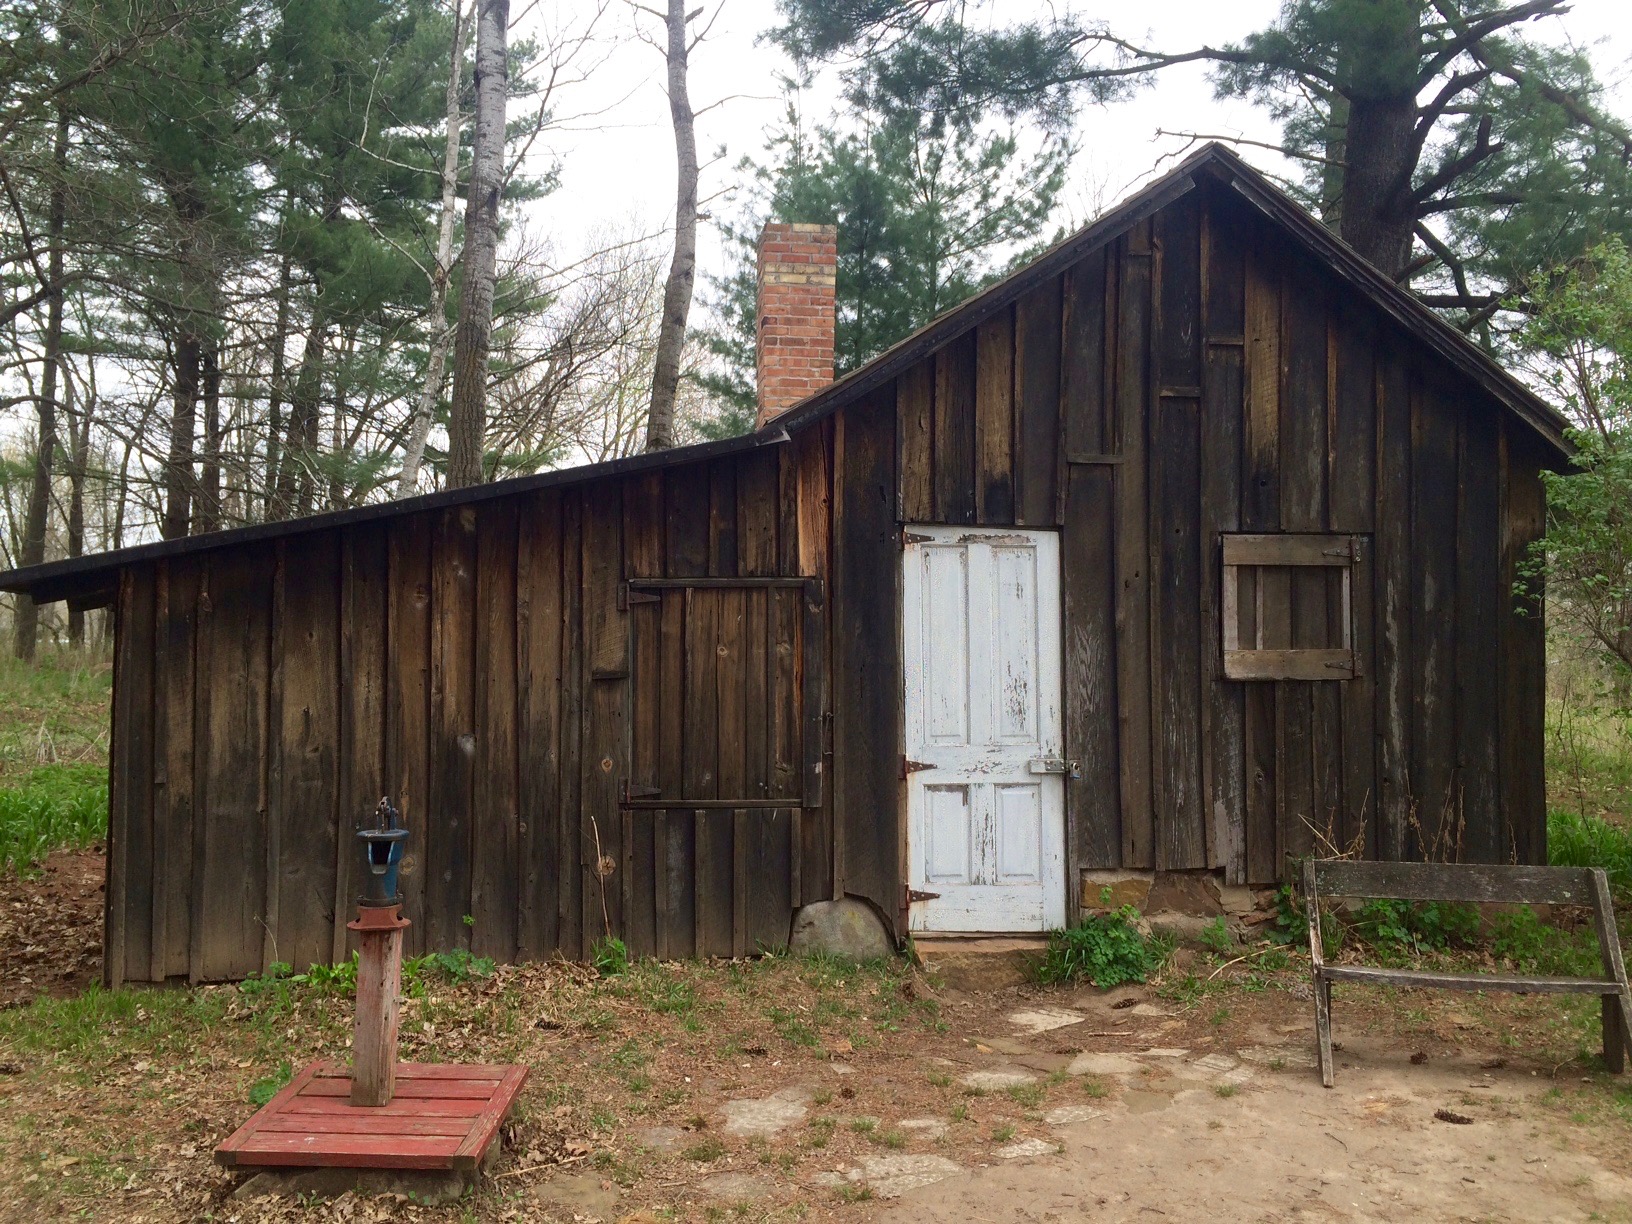
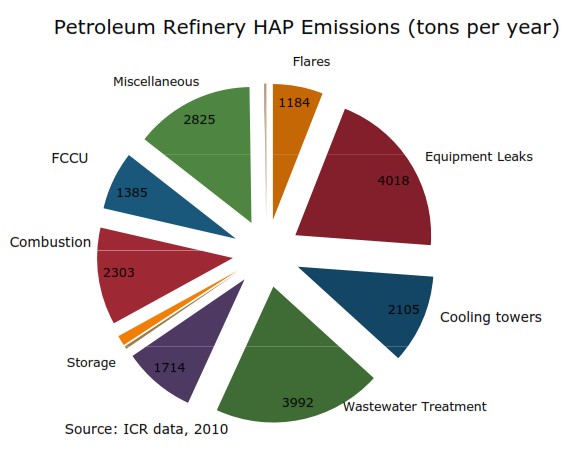
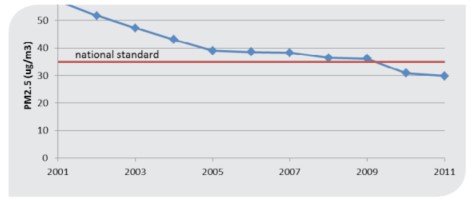
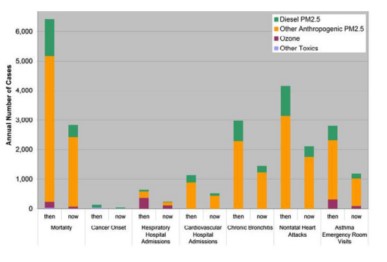
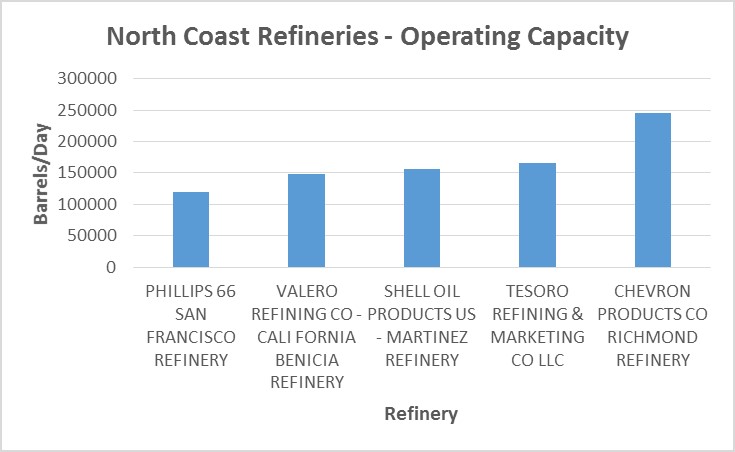
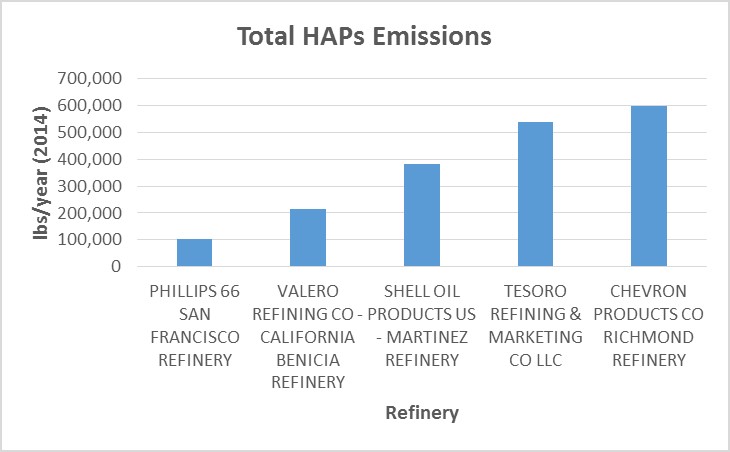
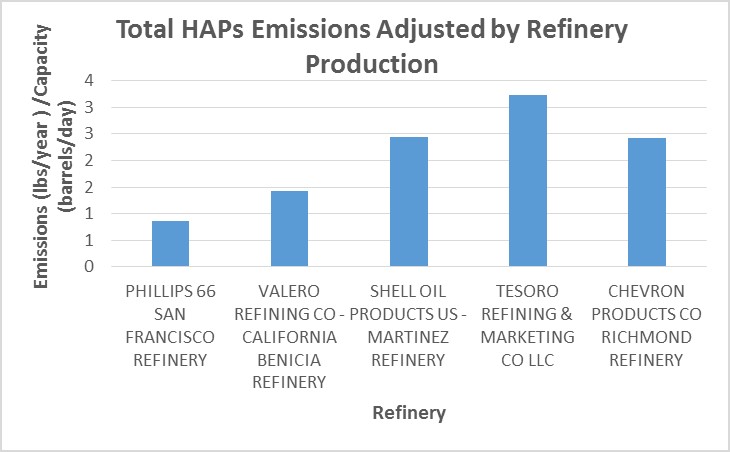
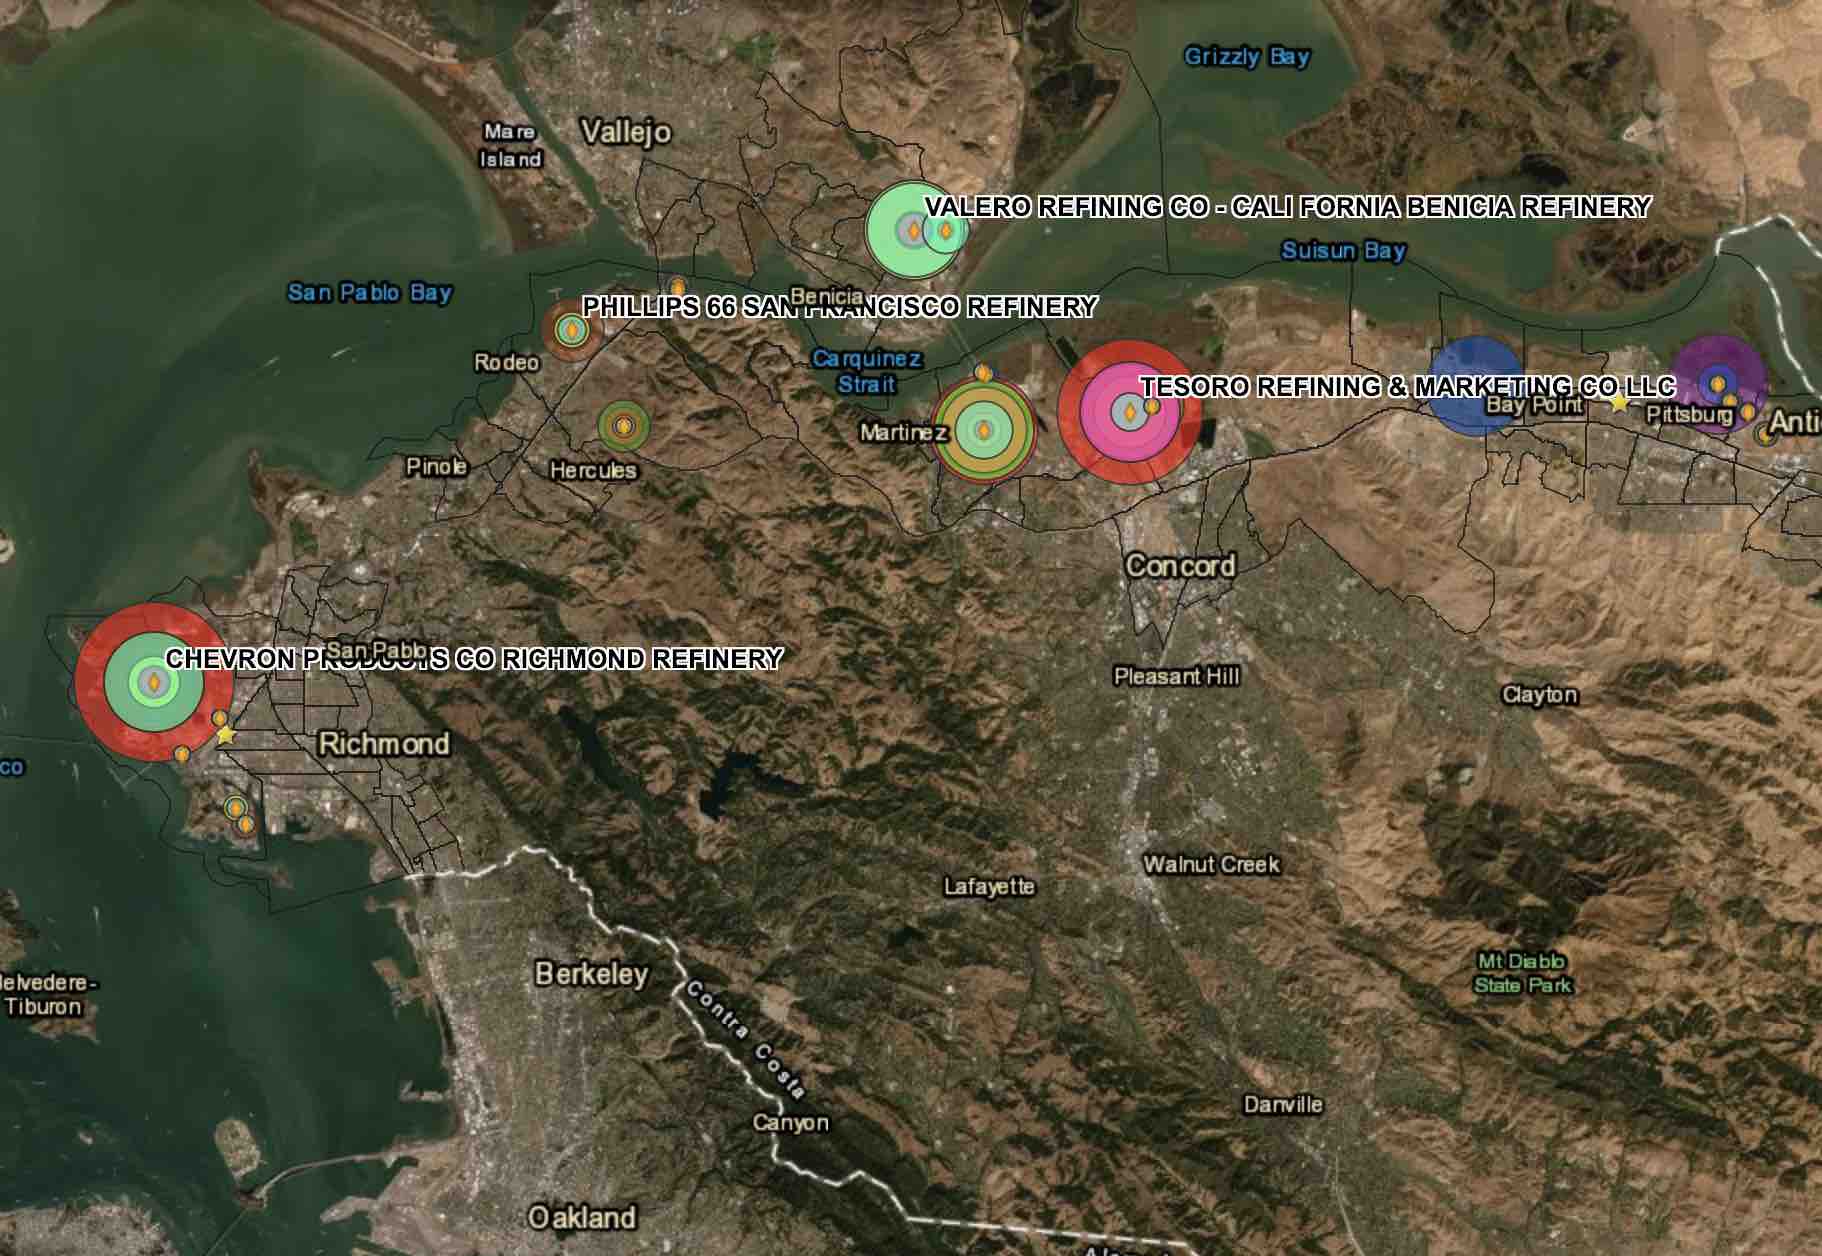


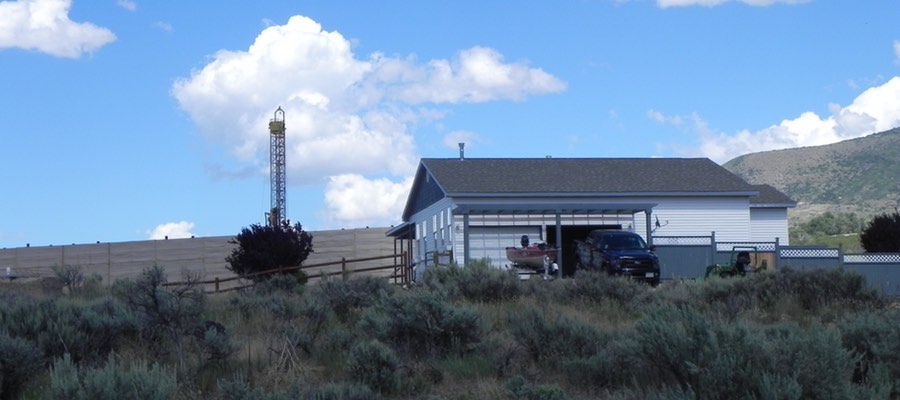
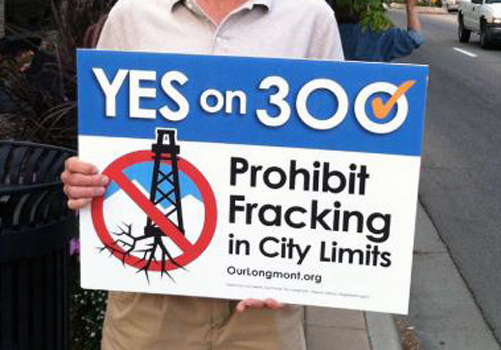
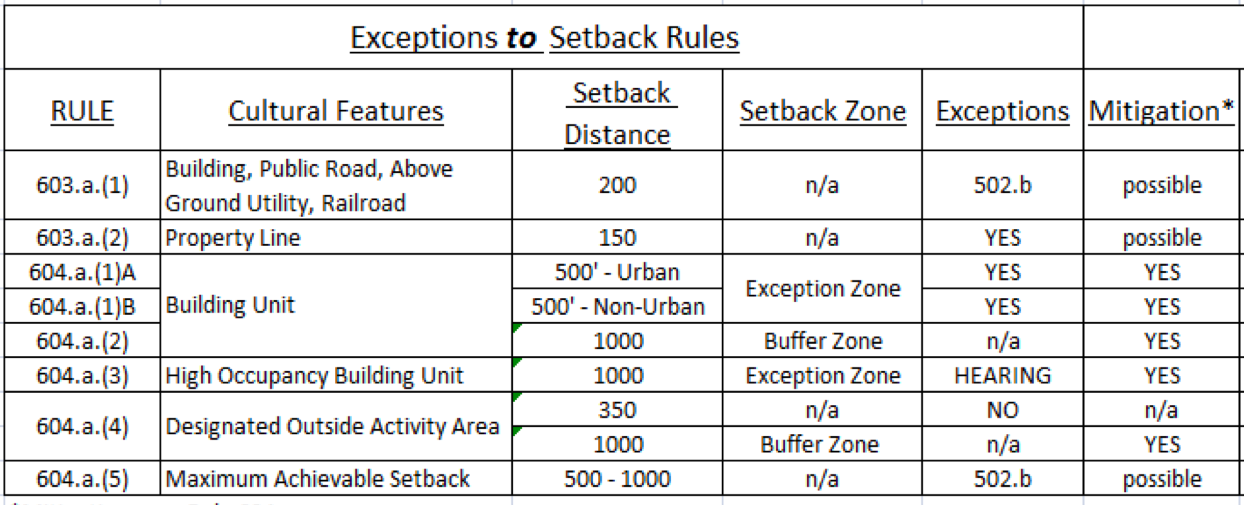
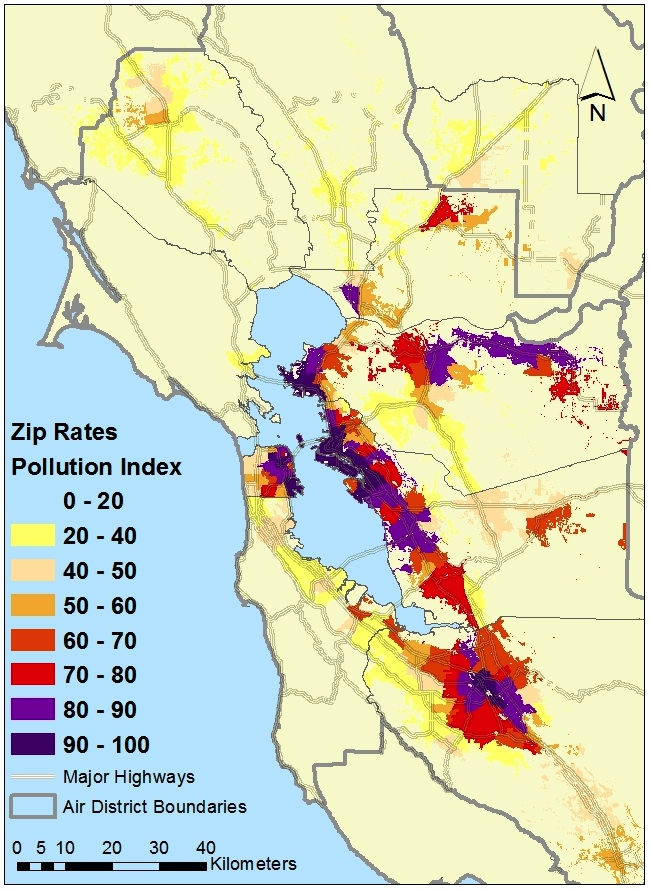
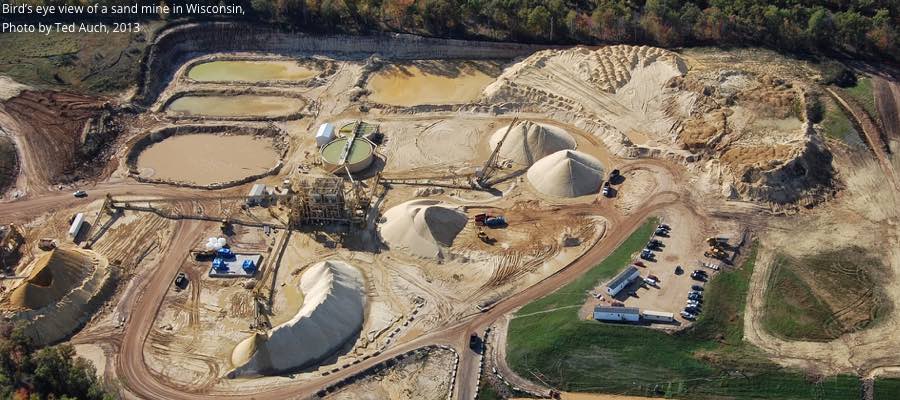
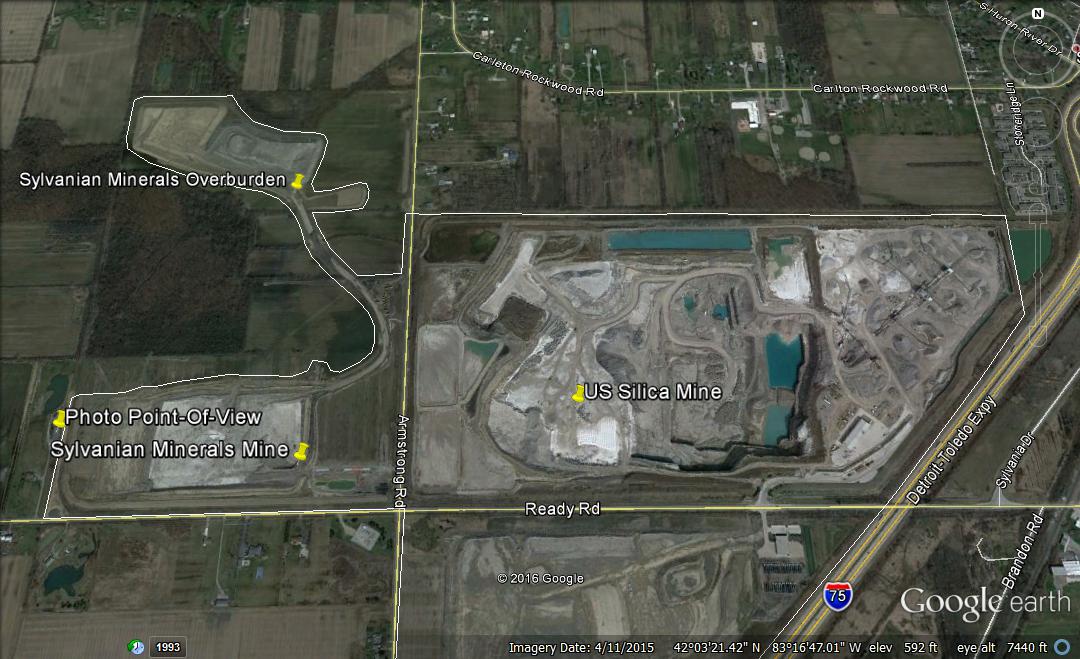
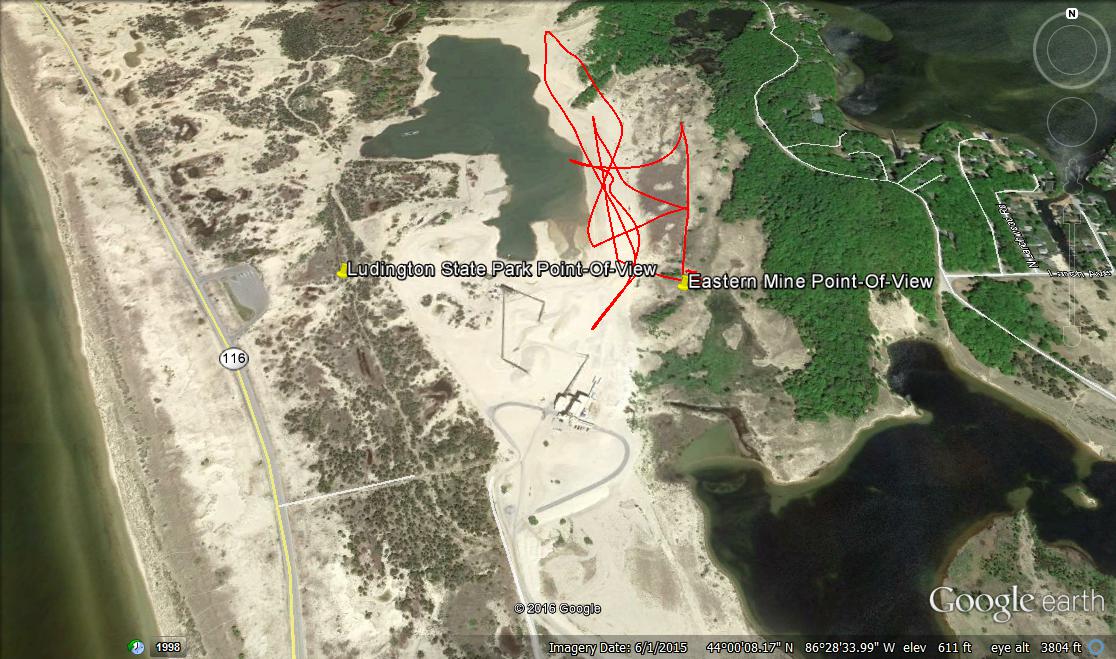
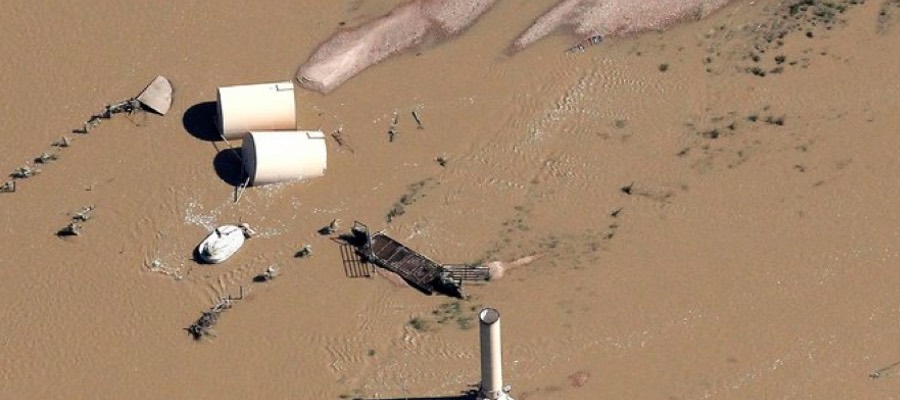
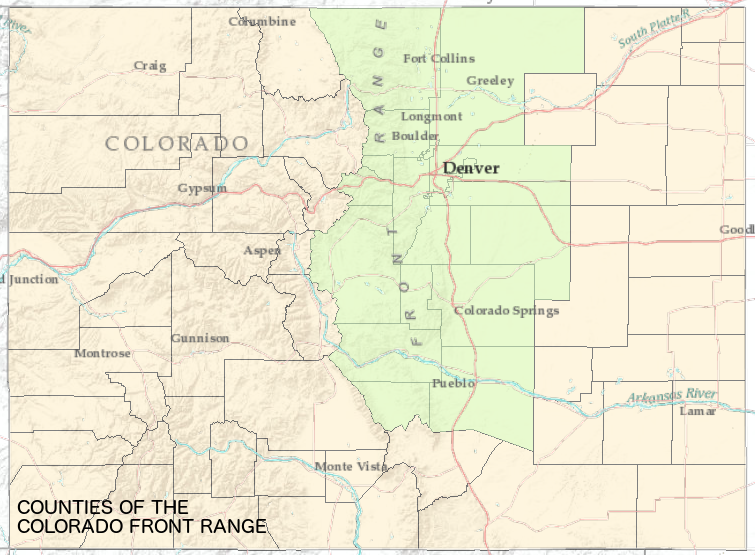
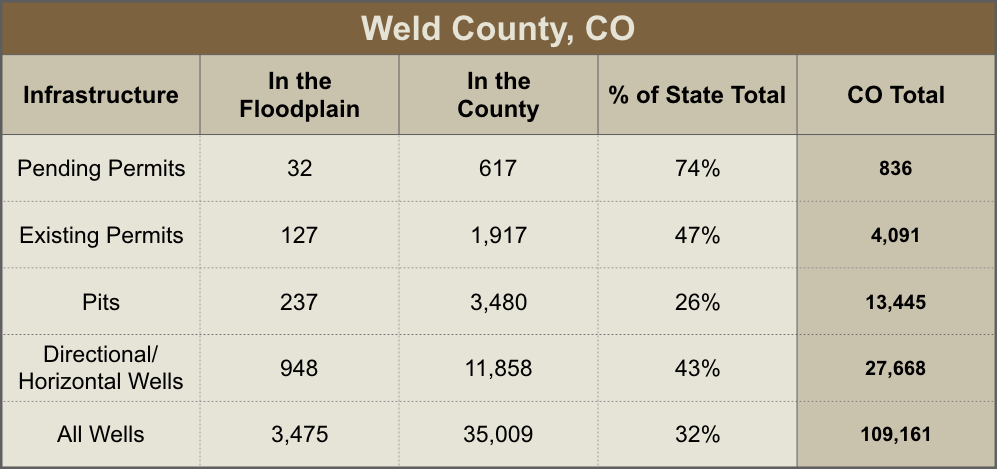
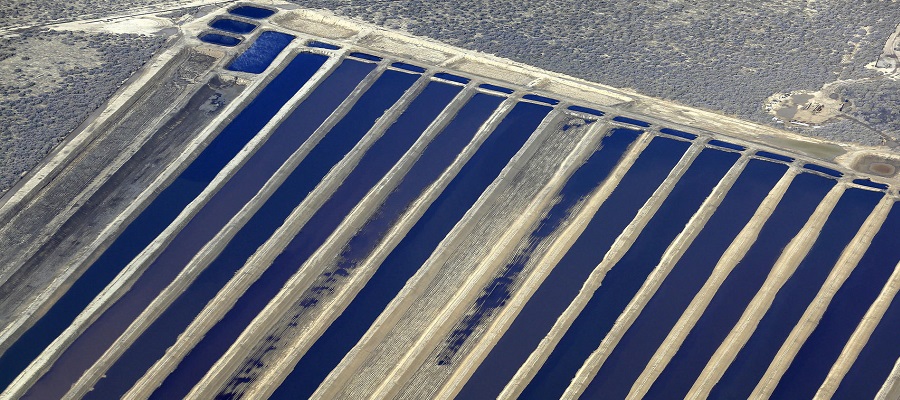
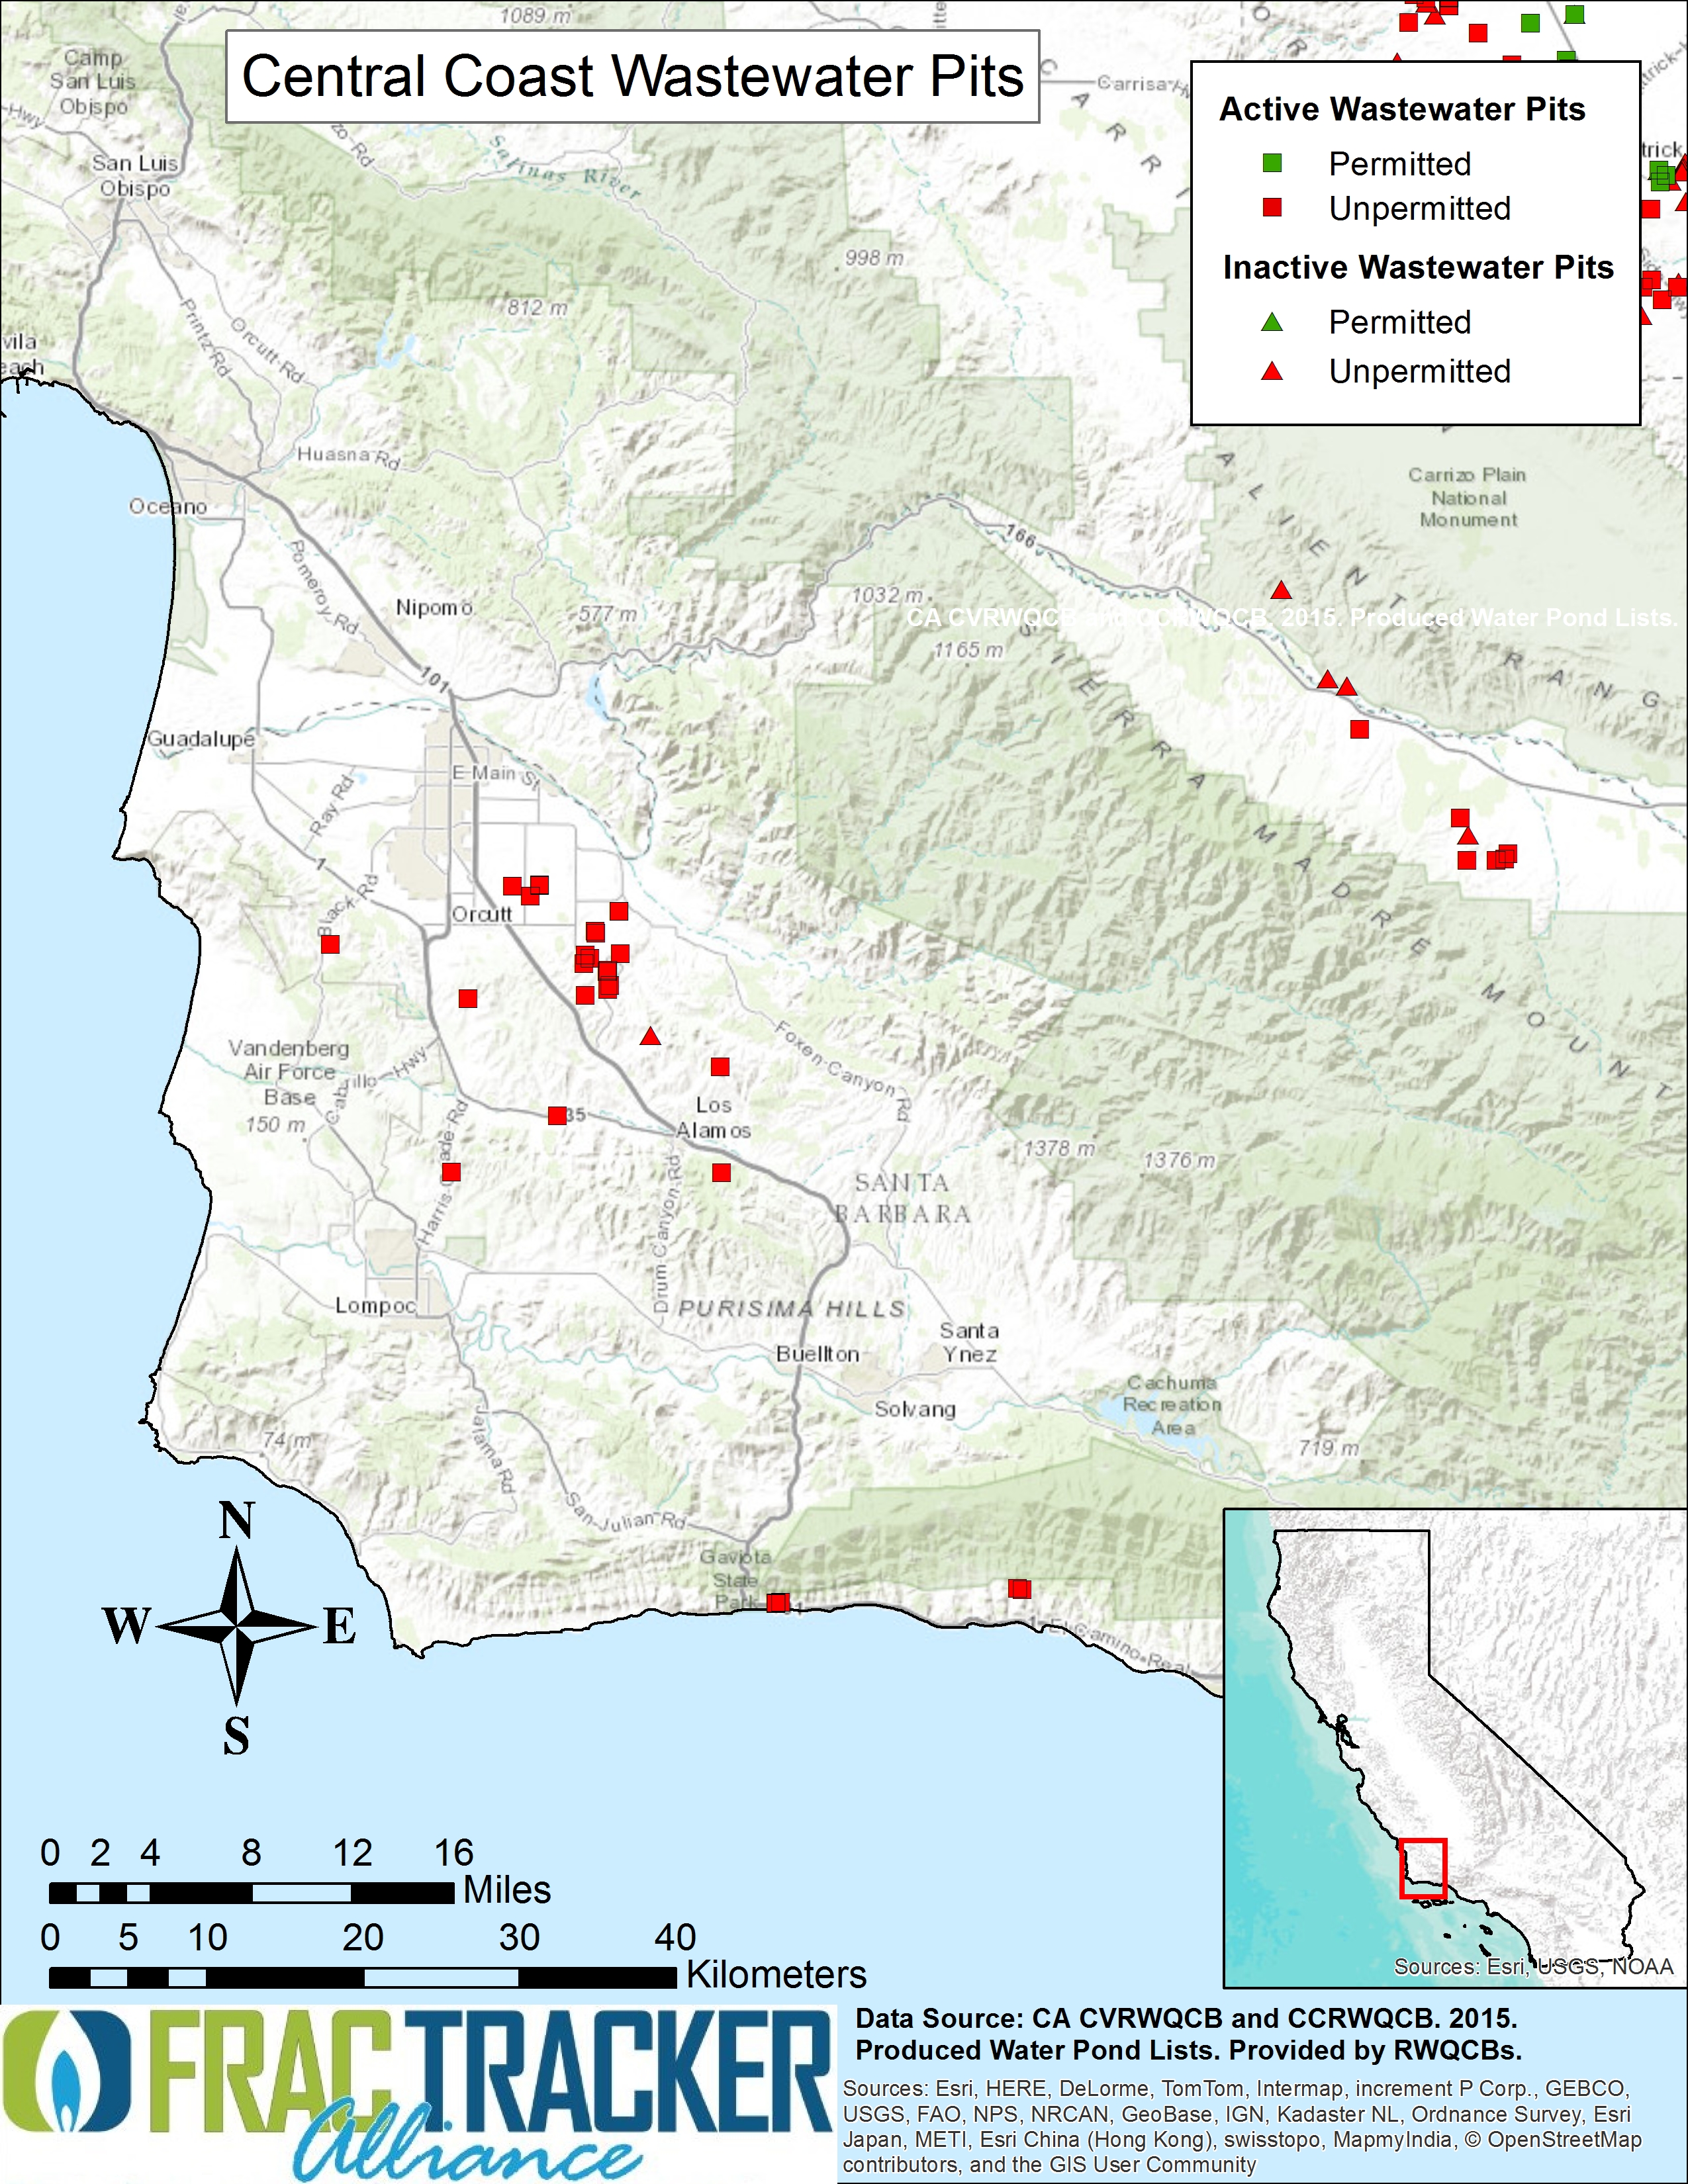
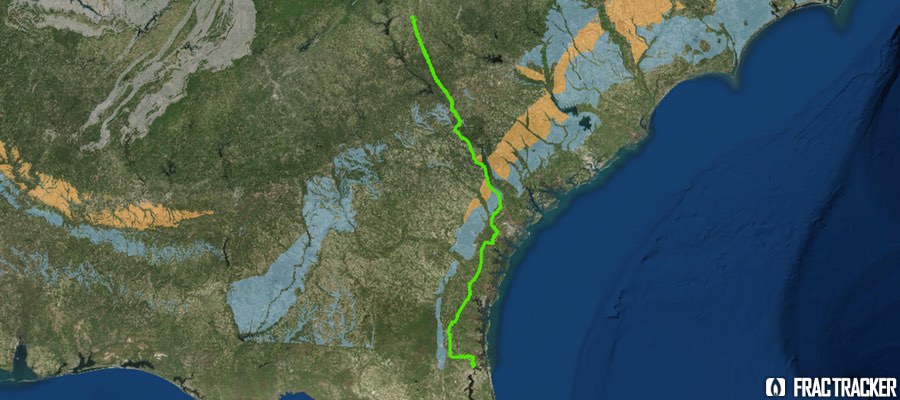
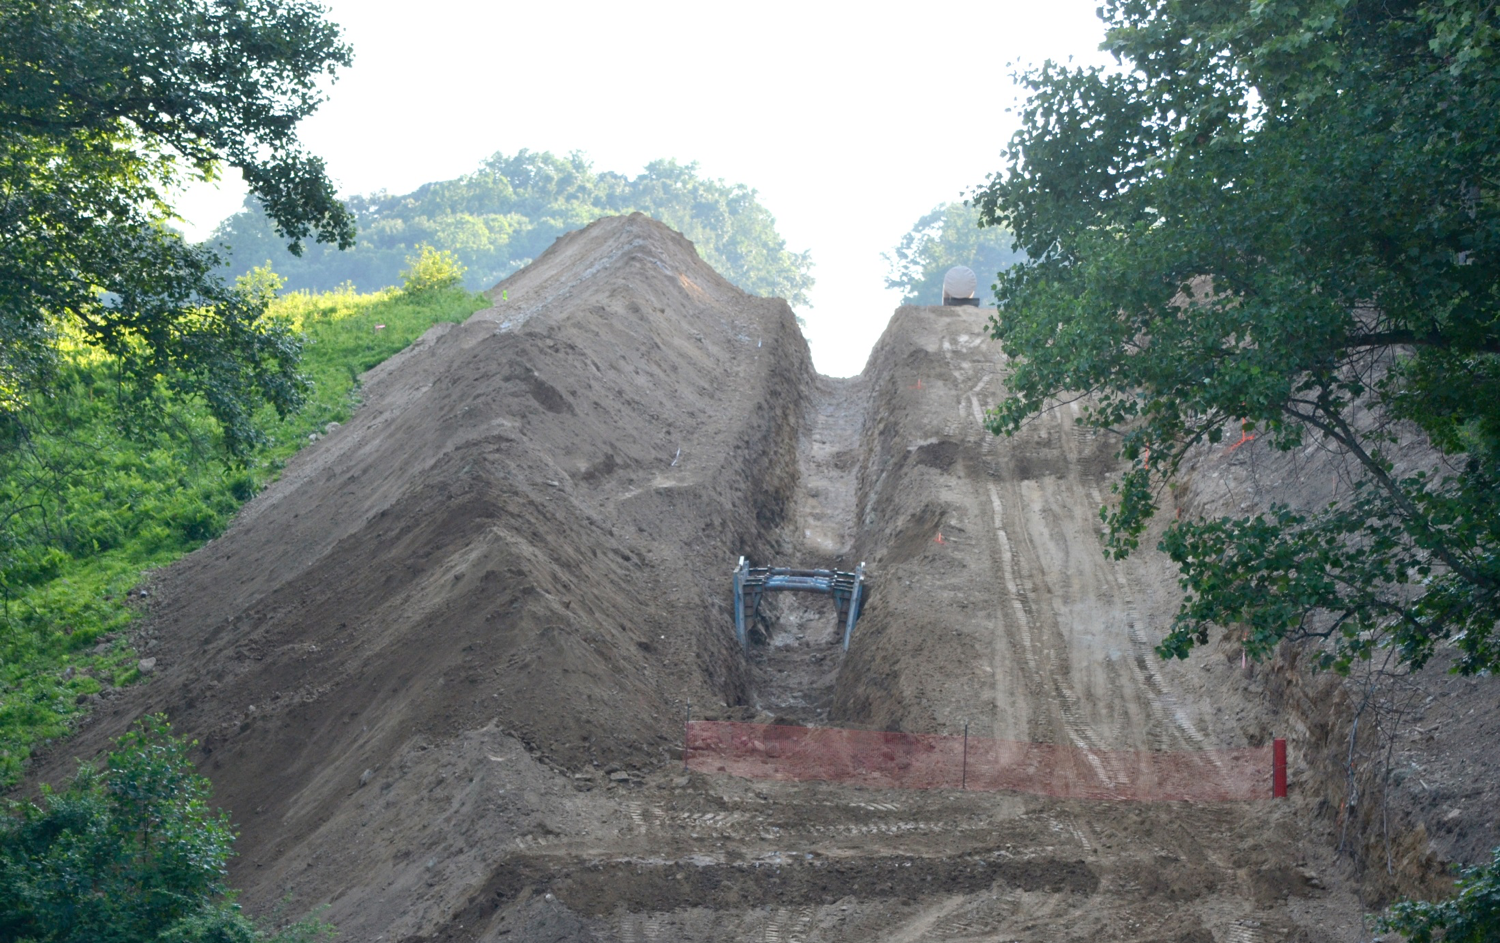

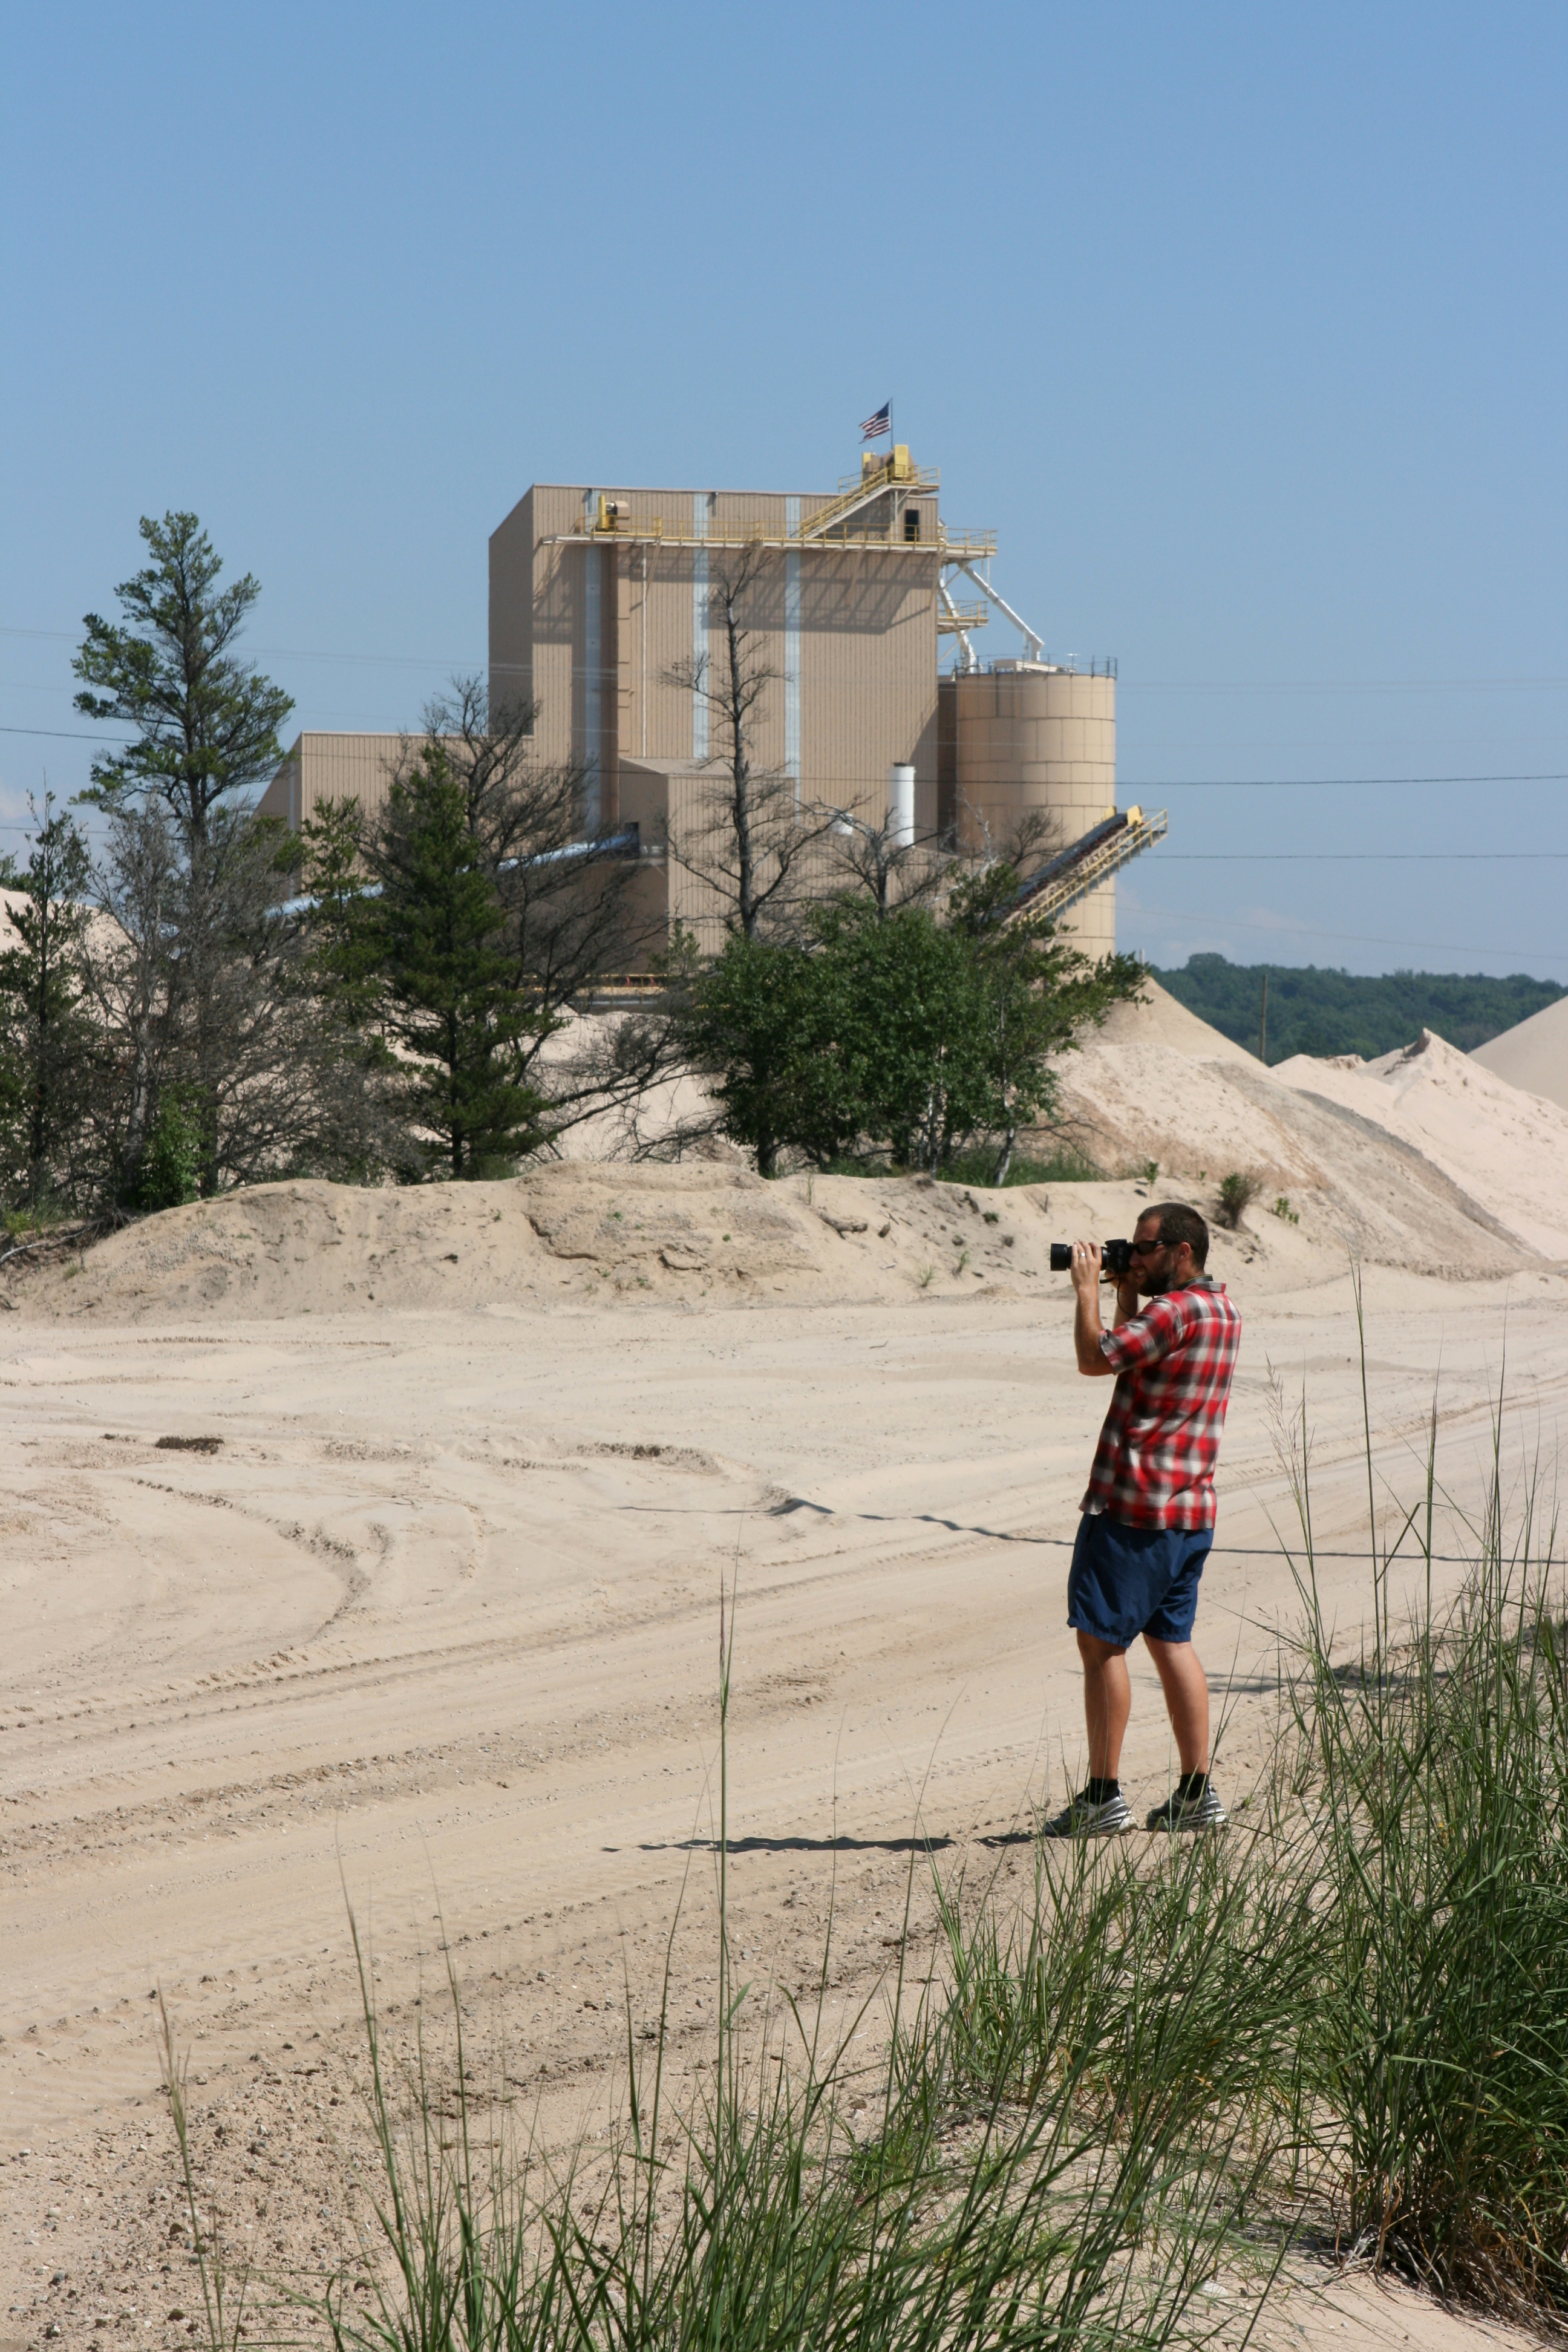
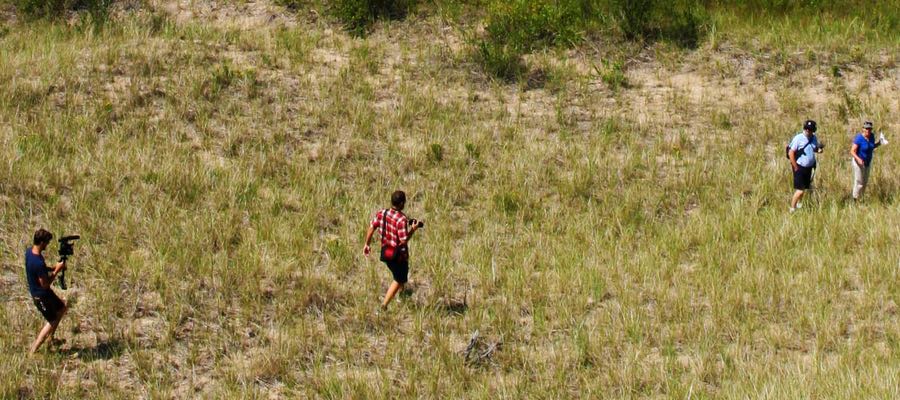
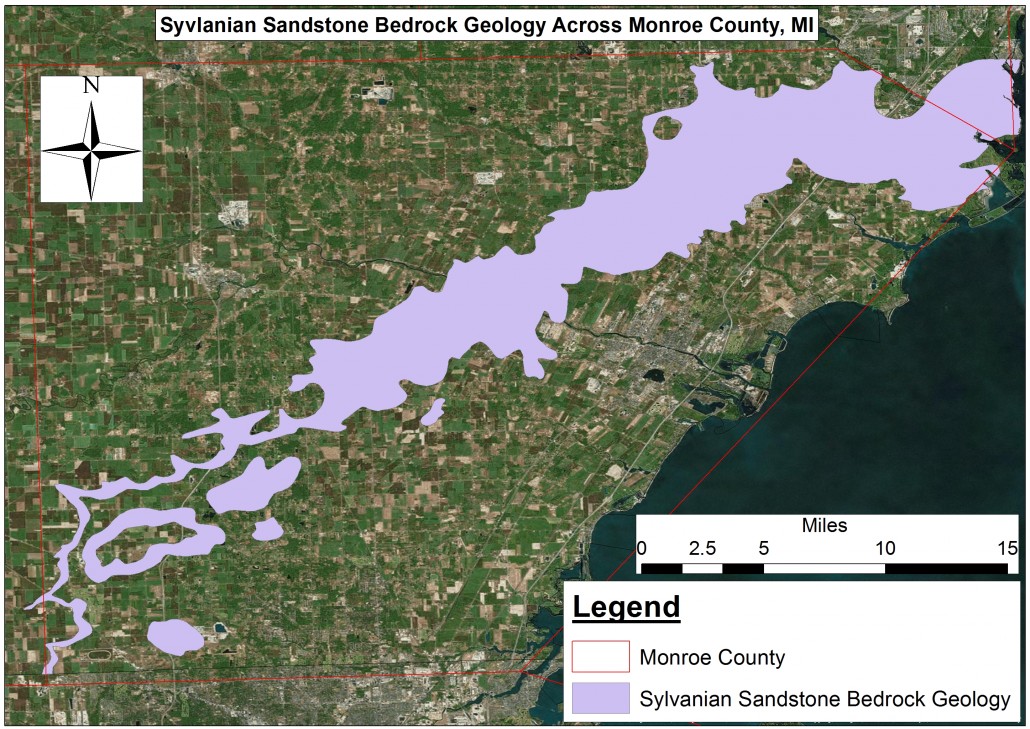
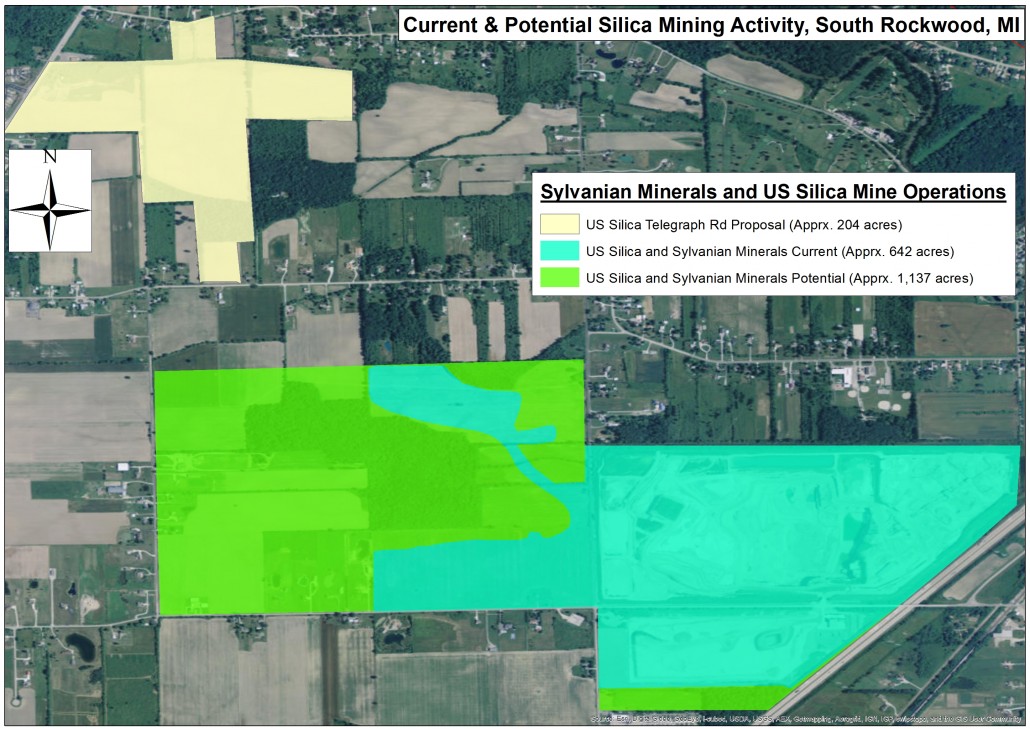
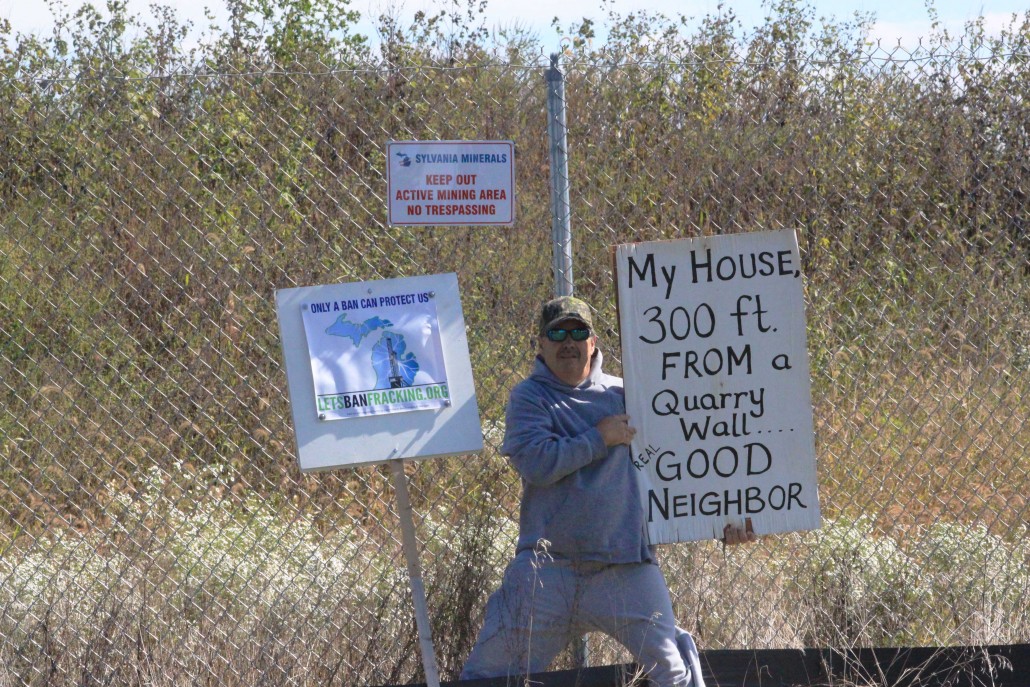
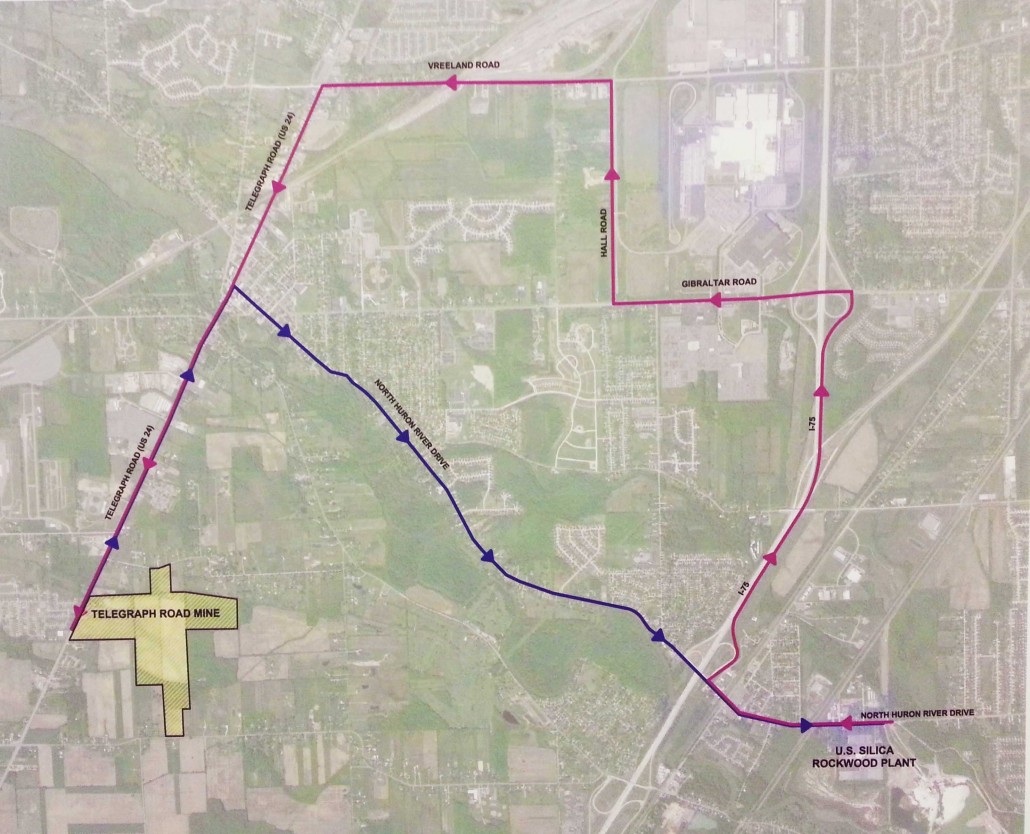
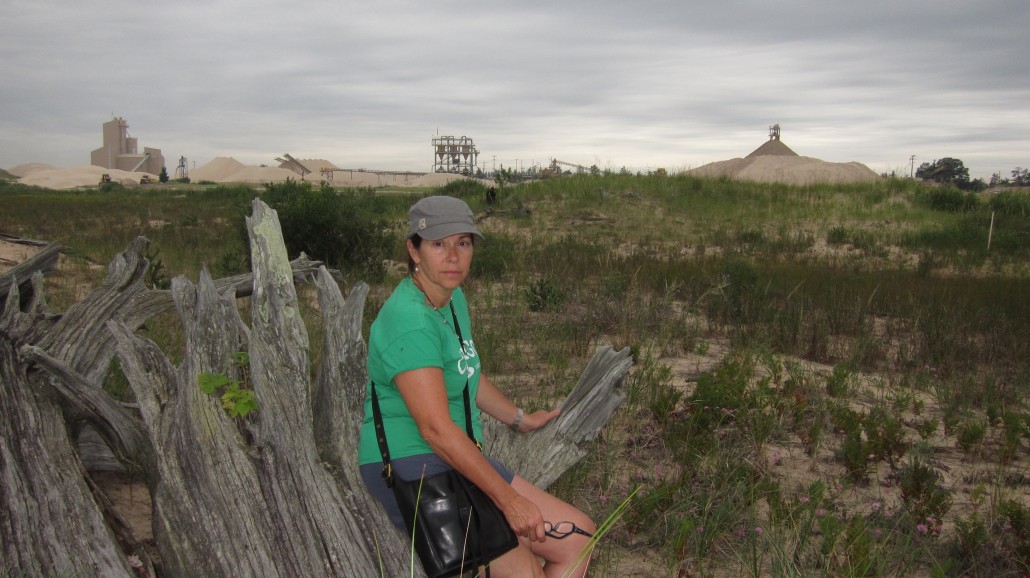
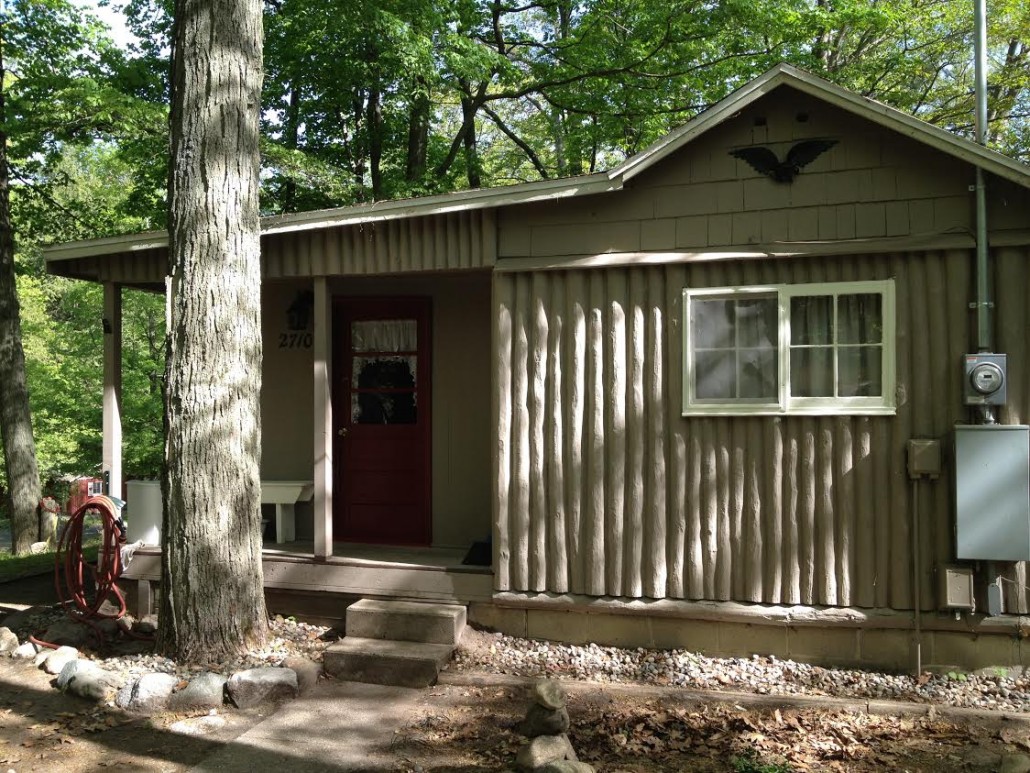
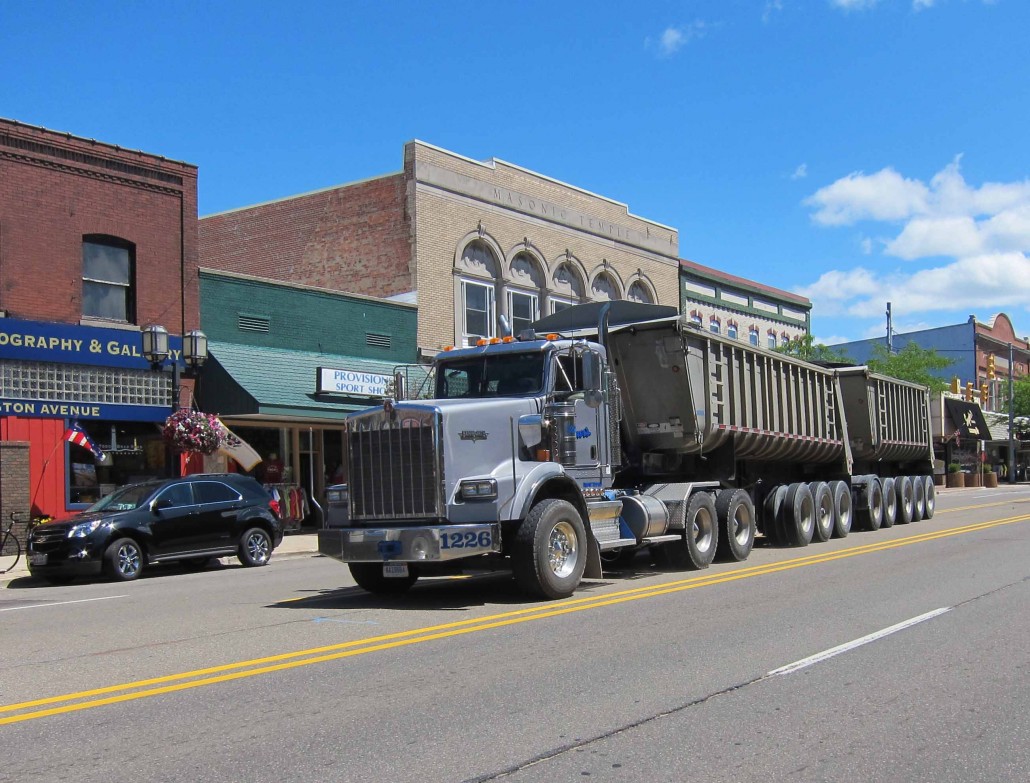
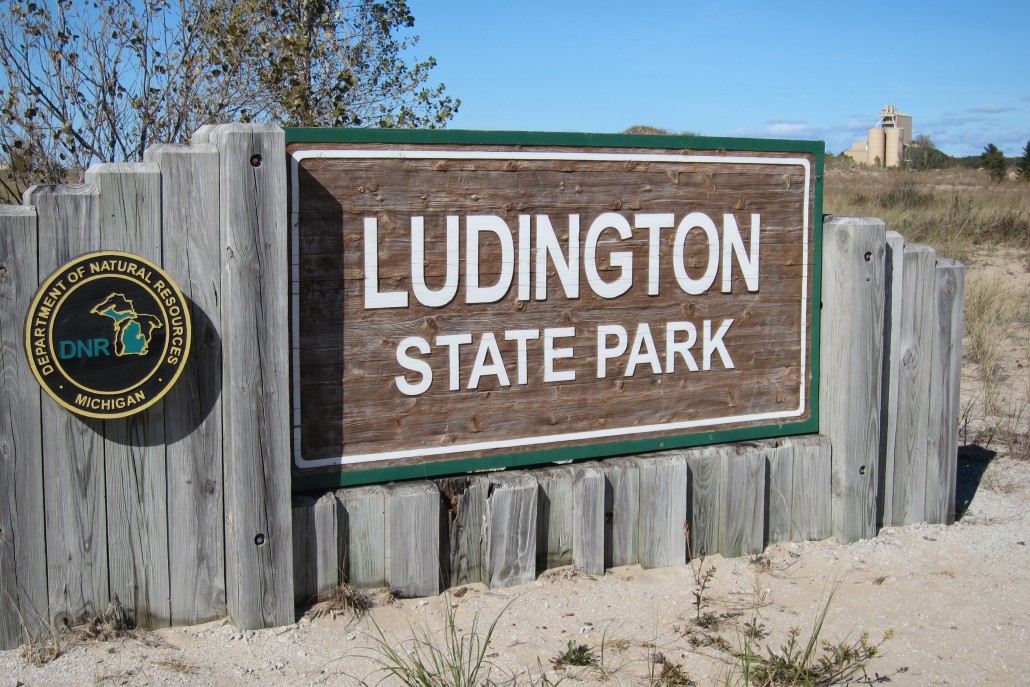
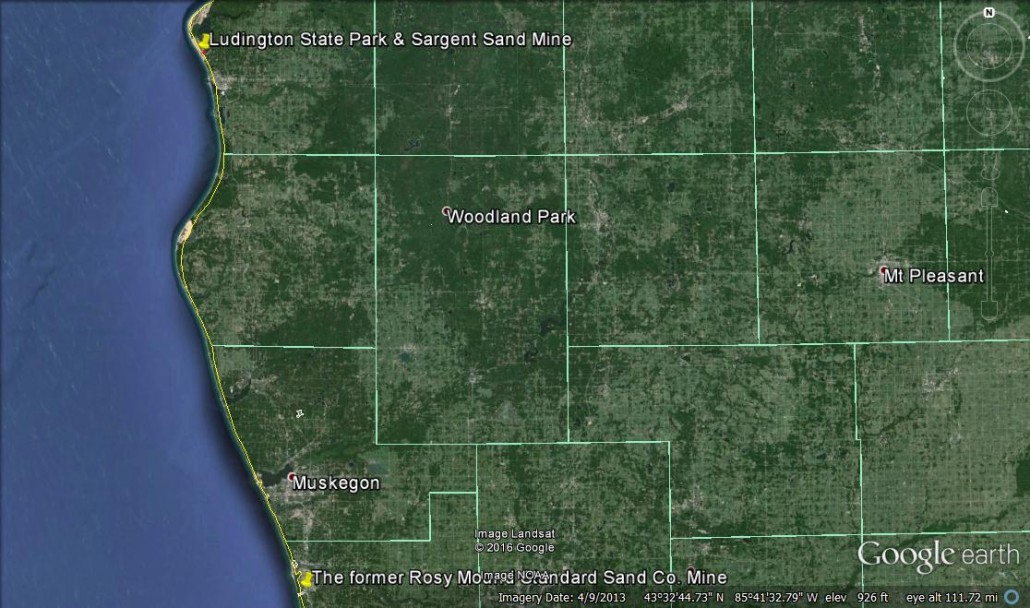
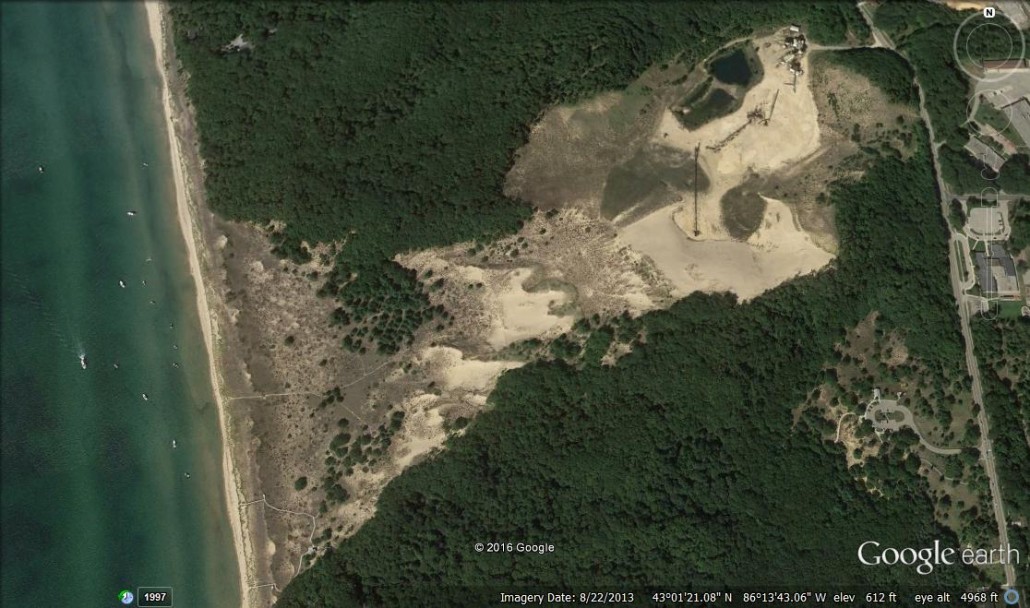
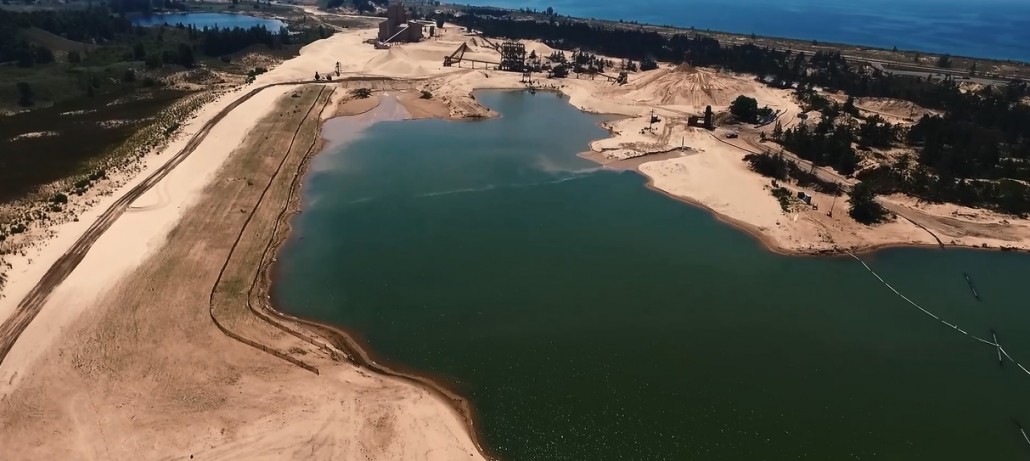
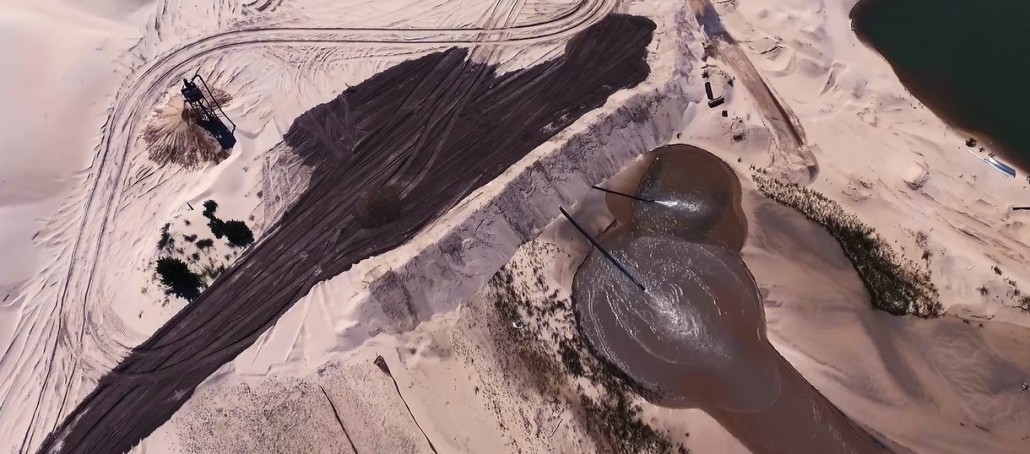
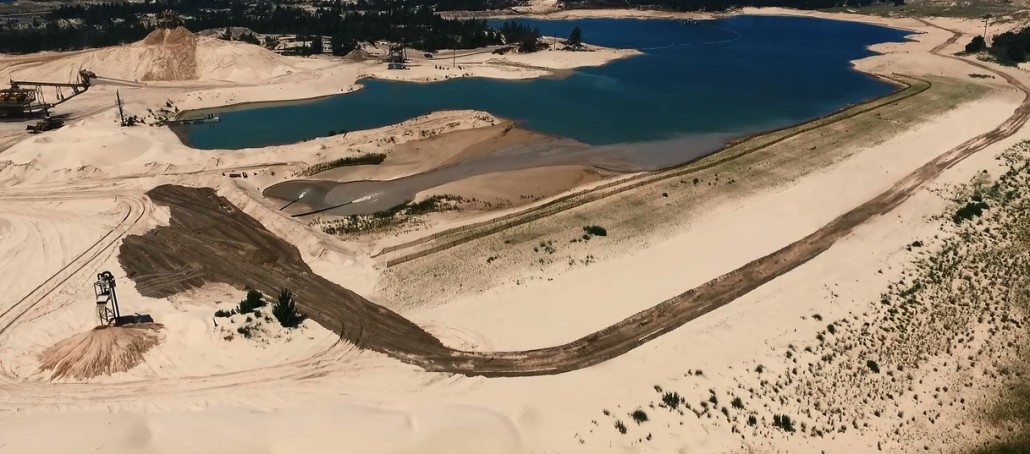