A Push For Pipelines
By Bill Hughes, WV Community Liaison
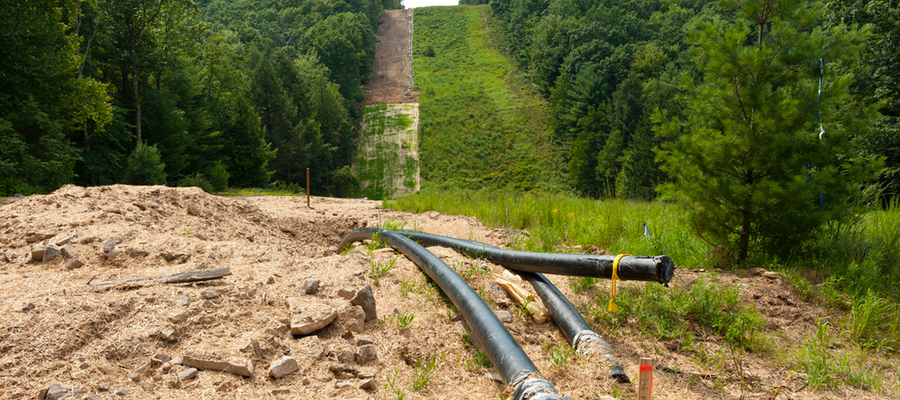
For anyone who even casually follows Marcellus and Utica shale gas exploration and production, such as in the active gas fields of West Virginia or Southwestern PA or Ohio, we know there are many concerns surrounding the natural gas production process. These issues range from air pollution, water consumption and contamination, to waste disposal. We know that, after all well the pad drilling and construction traffic are done, we must also have pipelines to get the gas to compressor stations, processing plants, and to markets in the Eastern United States (and likely Europe and Asia in the near future). Gas companies in Wetzel County, WV, and in neighboring tri-state counties, are convinced that building pipelines – really big pipelines – will be the silver bullet to achieving some semblance of stability and profitability.
Problems With Proposed Pipelines
One of the new, very large diameter (42”) proposed gas pipelines getting attention in the press is the Mountain Valley Pipeline, which will originate in the village of Mobley in eastern Wetzel County, WV and extend Southeast, through national forests and over the Appalachian Mountains into the state of Virginia. Even if the residents of Wetzel County and other natural gas fields are guinea pigs for experiments with hydraulic fracturing, we know how to build pipelines, don’t we? The equipment, knowledge, and skill sets needed for pipeline construction is readily available and commonly understood compared to high pressure horizontal drilling with large volumes of slick water. So, what could go wrong?
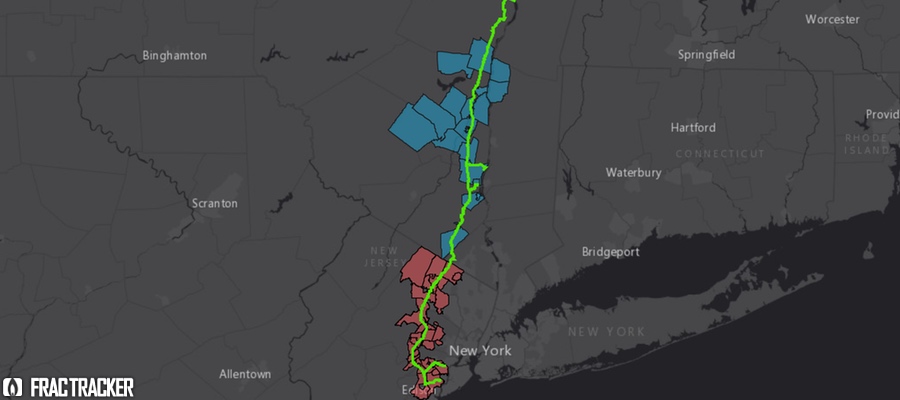
I can answer that question first hand from my hayfield in Wetzel County. Almost two years ago, EQT wanted to survey my property for a similar proposed pipeline – this one 30” in diameter, called the Ohio Valley Connector (OVC). The application for this project has now been filed with the Federal Energy Regulatory Commission (FERC). The below map shows a section of the OVC as proposed almost two years ago. The red outlined area is my property. The yellow line shows one proposed pathway of the 30” pipeline that would cross our land. Multiple routes were being explored at first. Were this version approved, it would have gone right through my hayfield and under our stream.
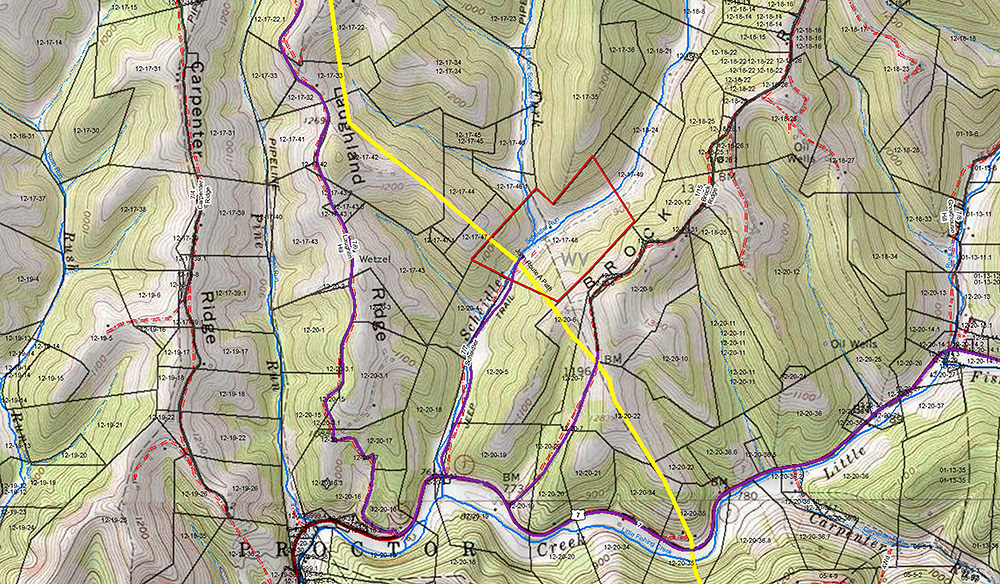
A section of the OVC as proposed almost two years ago. The red outlined area is my property. The yellow line shows one proposed pathway of the 30” pipeline that would cross our land.
Pipeline opponents express concern about habitat fragmentation, the crossing of pristine streams and rivers, erosion and sedimentation issues, spills, gas leaks, and possible explosions. These are all very valid concerns. But the potential for other logistical errors in the building process – from very simple to potentially serious ones – are also worth consideration. In this article I will use my recent personal experience as a detailed and documented example of how a professionally surveyed location on my property contained an error of almost one mile – over 4,000 feet – as part of a pipeline construction planning project. Yes, you read that right.
Part I: How Did We Get To This Point
Before we get to my story, I should review my first contact with EQT on this issue. In February of 2014, an EQT land agent asked me for permission to walk my property for preliminary evaluation of a route that would send their 30” high-pressure pipe through our land, from south to north.
It is important to keep in mind that almost every landowner in Wetzel County has been contacted by mail, phone or in person, by land agents promising cash with a verbal assurance that all will be well. The goal is to get a landowner’s signature on a loosely worded “right of way” (RoW) lease contract, with terms favorable to the gas company, and move on. Unfortunately, pipeline lease offers cannot be ignored. Not objecting or not questioning can sometime leave the landowner with fewer choices later. This is because many of the bigger interstate transmission lines are being proposed as FERC lines. When final approval is granted by FERC, these pipelines will have the legal power of eminent domain, where the property owner is forced to comply. Just filing a FERC application does not grant eminent domain in West Virginia, as it seems to in Virginia, but the potential for eminent domain gives land agents power over landowners.
I was not ready to give them surveying permission (to drive stakes or other permanent markers). Since a natural gas pipeline would affect all my neighbors, however, I agreed to allow a preliminary walk through my property and to hang surveyor ribbons in exchange for answering my questions about the project. For instance, one of my biggest concerns was the potential for significant habitat fragmentation, splitting up the forest and endangering wildlife habitat.
 There are many questions residents should consider when approached by land agent. A list of these questions can be found in the appendix below.
I never did get answers to most of my questions in the few e-mail exchanges and phone conversations with EQT. I never saw the surveyors either. They simply came and left their telltale colored ribbons. Later, at a public meeting an EQT representative said the closest they would run the pipe to any residence would be 37.5 feet. That number is correct. I asked twice. They said they had the right to run a pipeline that close to a residence but would do their best not to. The 37.5 feet is just one half of the permanent RoW of 75 feet, which was also only part of a 125 foot RoW requested for construction. A few months later, a very short e-mail said that the final pipeline route had changed and they would not be on my property. For a time we would enjoy some peace and quiet.
A Word On Surveyors
Most folks can relate to the work and responsibility of bookkeepers or Certified Public Accountants (CPAs). They measure and keep track of money. And their balance sheets and ledgers actually have to, well, BALANCE. Think of Surveyors as the CPAs of the land world. When they go up a big hill and down the other side, the keep track of every inch — they will not tolerate losing a few inches here and there. They truly are professionals, measuring and documenting everything with precision. Most of the surveyors I have spoken with are courteous and respectful. They are a credit to their profession. They are aware of the eminent domain threat and their surveying success depends on treating landowners with respect. They are good at what they do. However, as this article will show, their professional success and precision depends on whether or not they are given the correct route to survey.
Part II: Surveyor Stakes and Flags
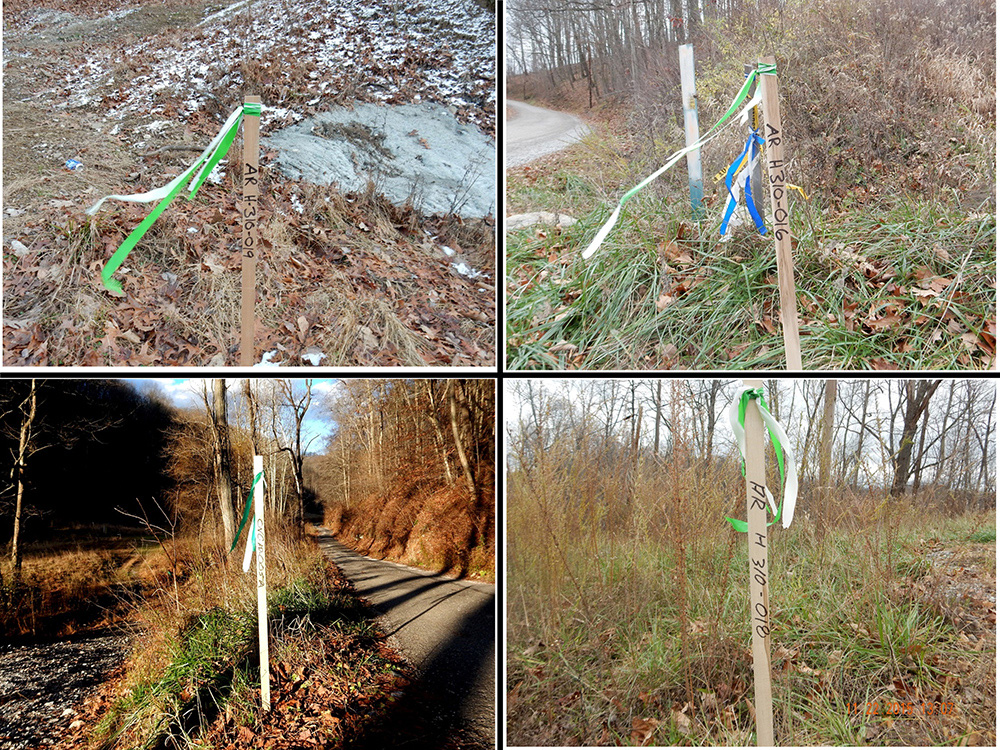
Over the next year we enjoyed peace and quiet with no more surveyors’ intrusions. However, in my regular travels throughout the natural gas fields here, countless signs of surveyor activity were visible. Even with the temporary slowdown in drilling, the proposed pipeline installations kept these surveyors busy. Assorted types of stakes and ribbons and markings are impossible to miss along our roads. I usually notice many of the newer surveyor’s flags and the normal wooden stakes used to mark out future well pads, access roads, compressor stations, and more recently pipelines. Given that survey markings are never taken down when no longer needed, the old ones sometimes hide the new ones.

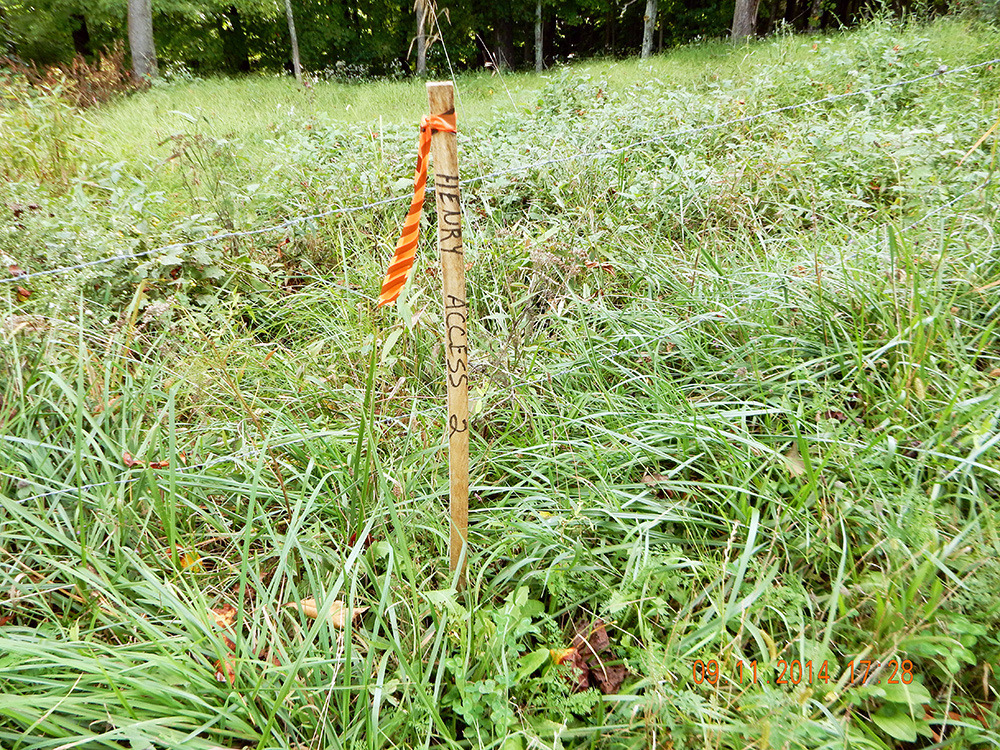
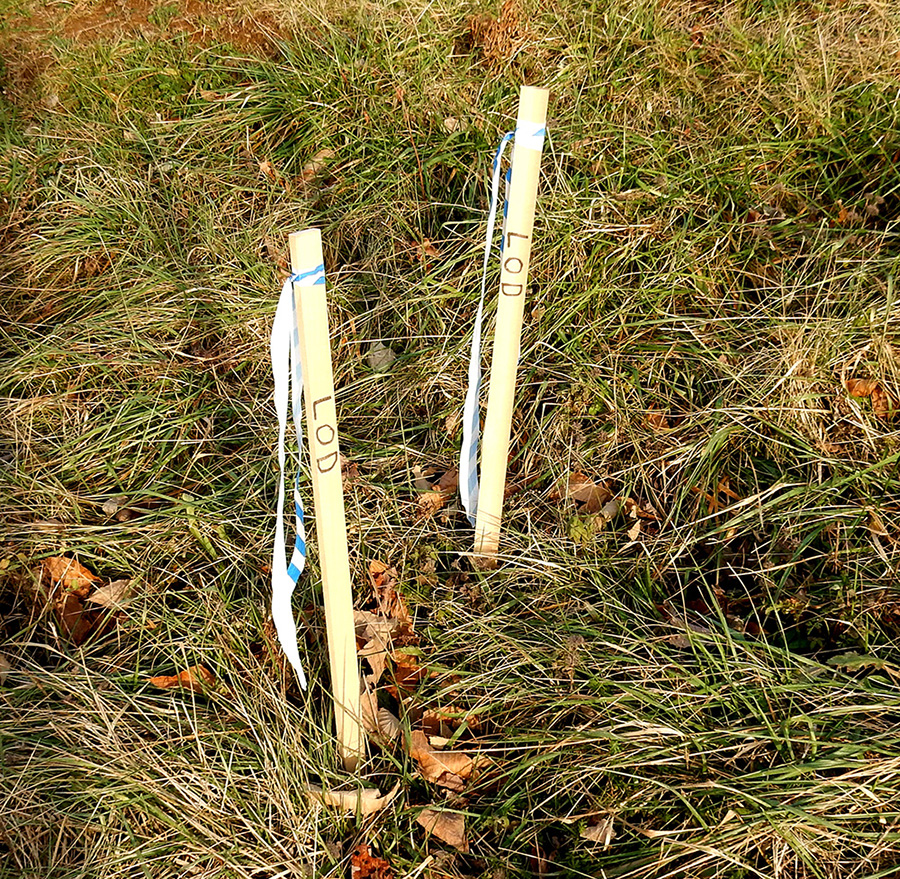
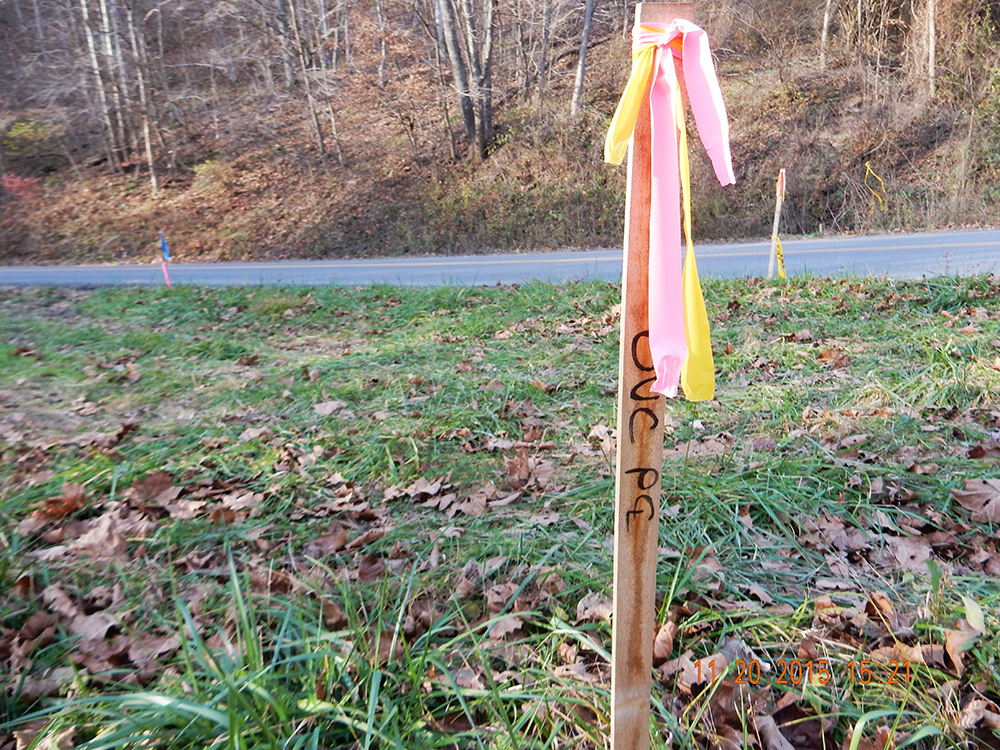
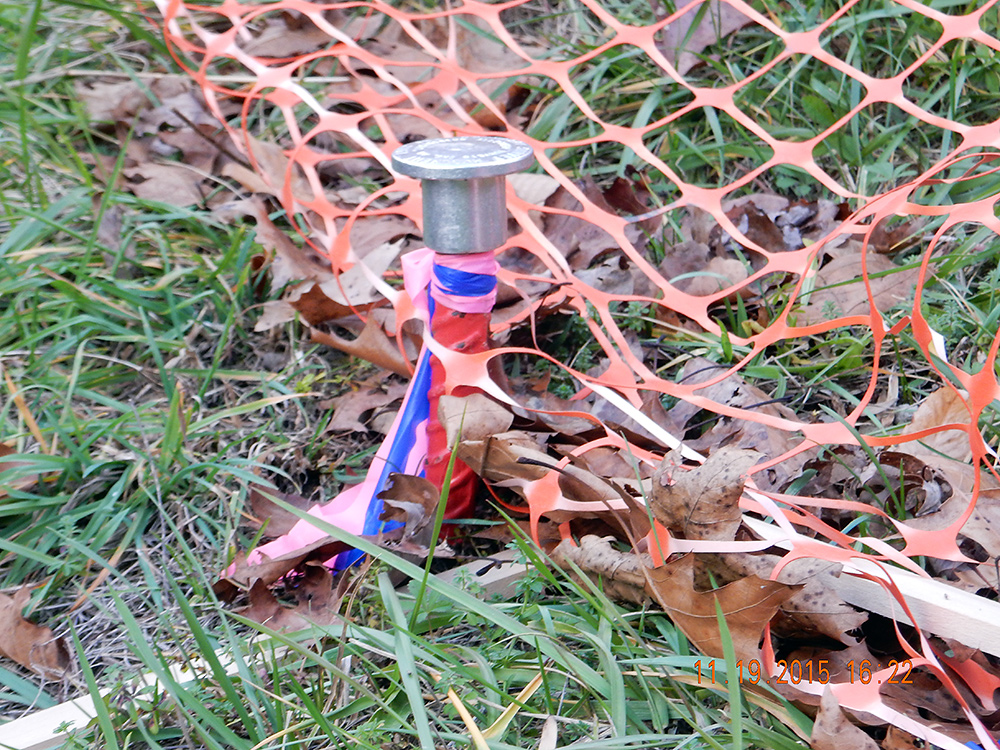
It can be difficult keeping track of all of them and hard at first to identify why they are there. Even if sometimes I am not sure what a stake and flag might indicate, when one shows up very unexpectedly in what is essentially my front yard, it is impossible to not see it. That is what happened in August of 2015. Despite being unable to get our hay cut due to excessive rain the previous month, the colored flags were highly visible. Below shows one of the stakes with surveyor’s tape, and the hay driven down where the surveyors had parked their trucks in my field alongside my access road.
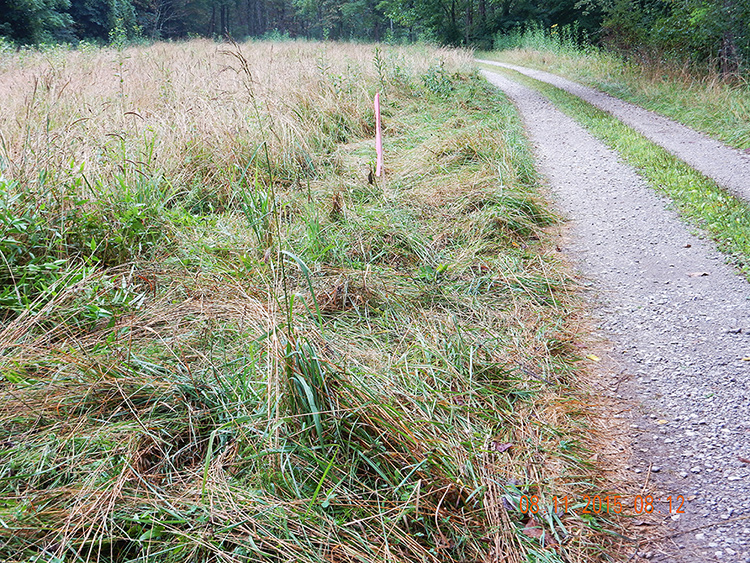
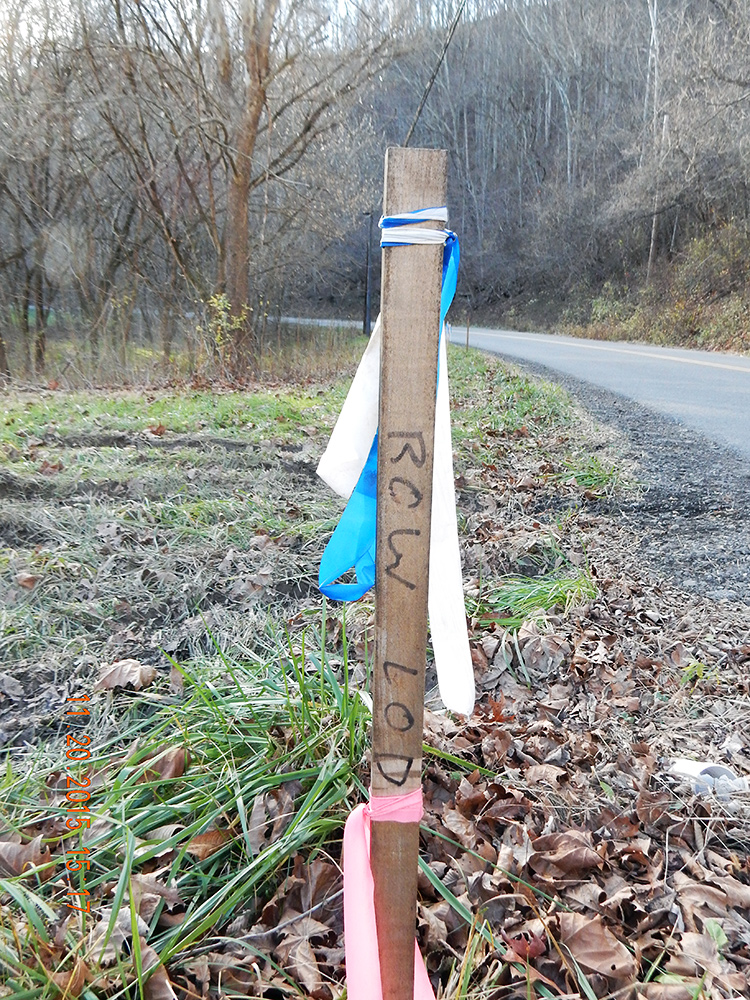
A surveyor stake alongside my access road.
To call it trespassing might not be legally defensible yet. The stakes were, after all, near a public roadway – but the pins and stakes and flags were on my property. Incidents like this, whether intentional or accidental, are what have given the natural gas companies a reputation as bad neighbors. There were surveyors’ stakes and flags at two different locations, my hay was driven down, and I had no idea what all this meant given that I had no communication from anyone at EQT in over 18 months. I consider myself fortunate that the surveyors did not stray into wooded areas where trees might have been cut. It’s been known to happen.
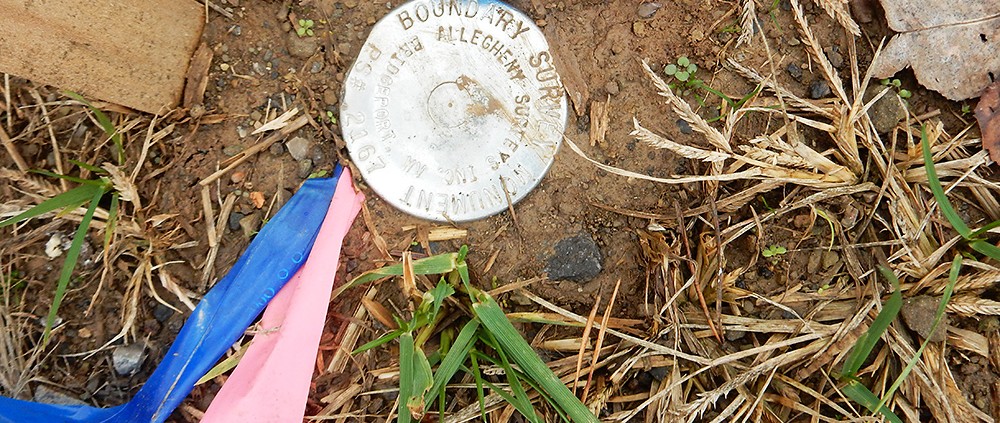
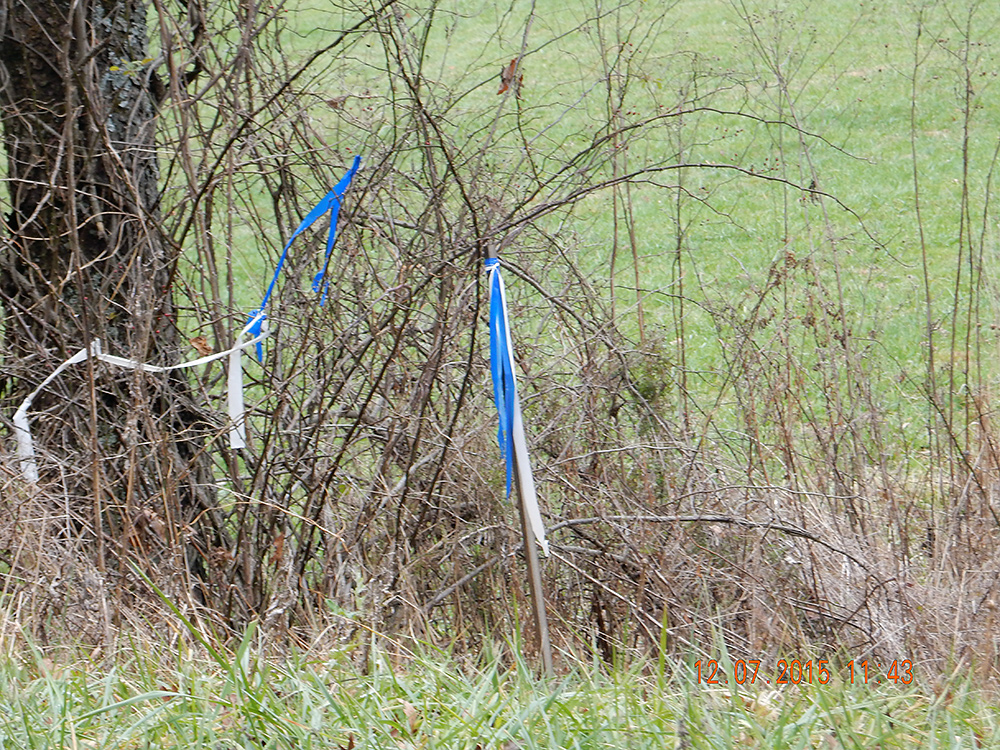
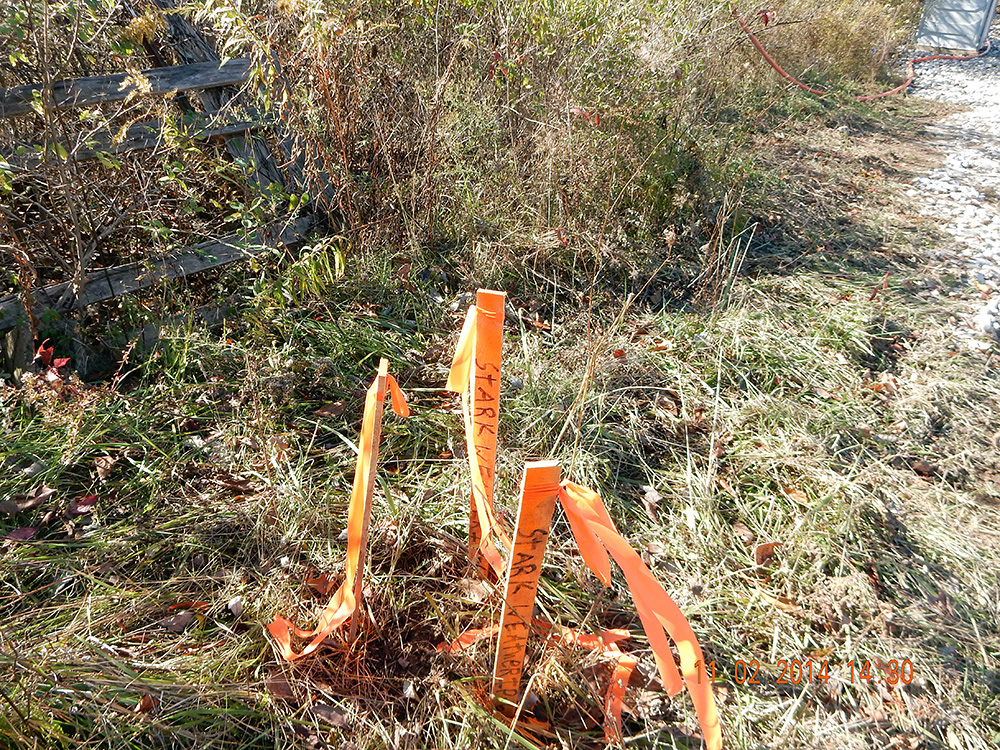
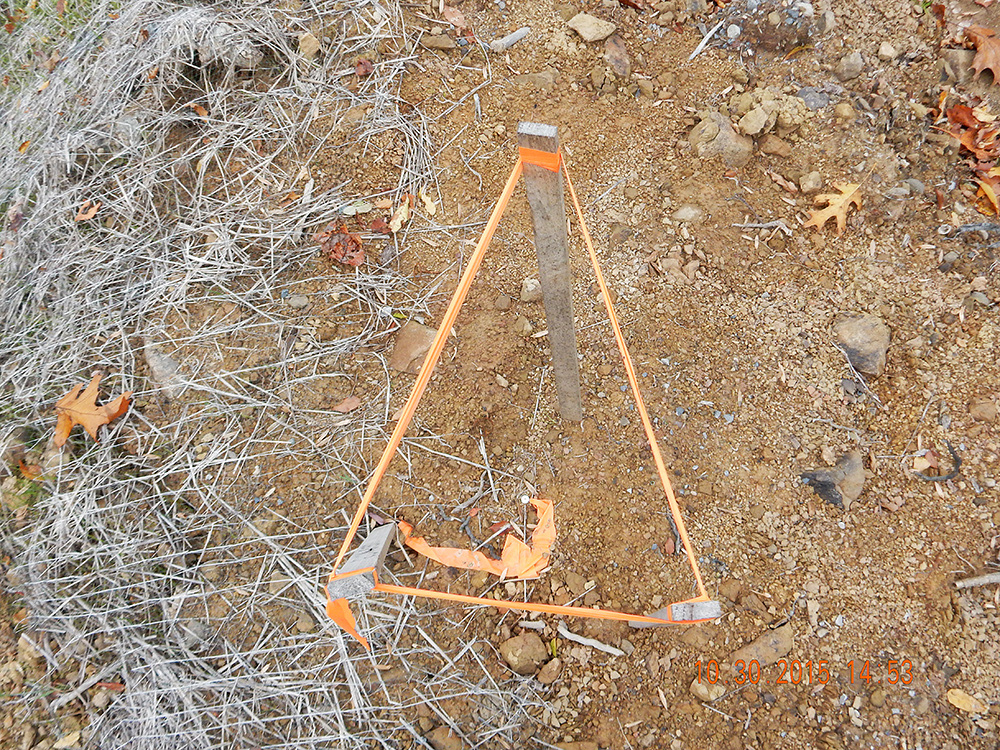
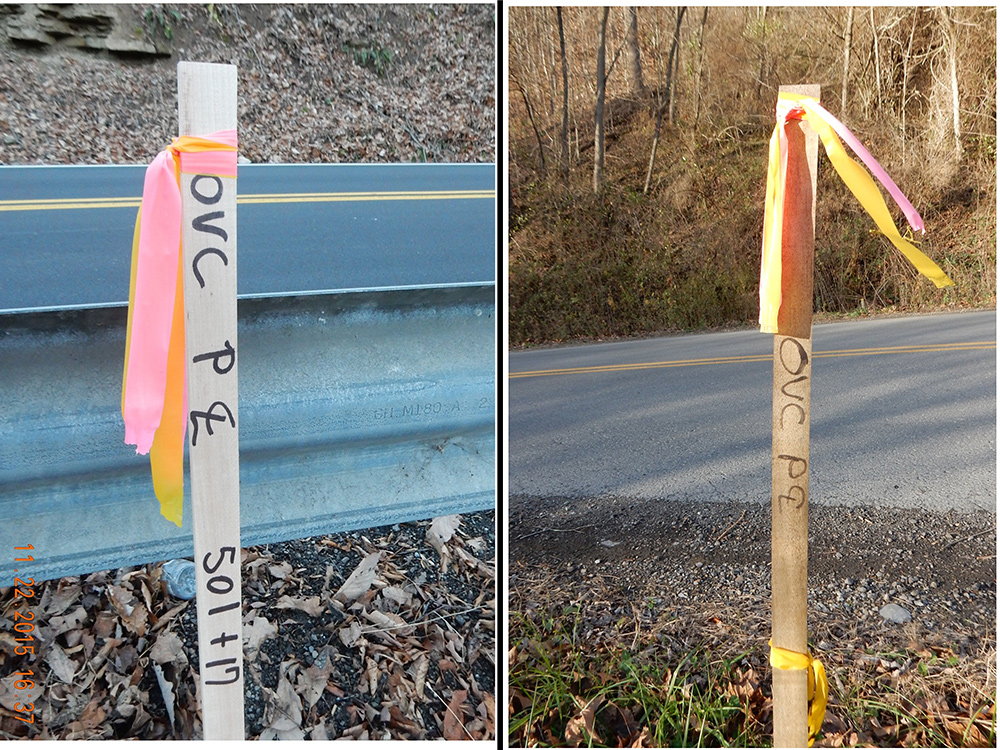
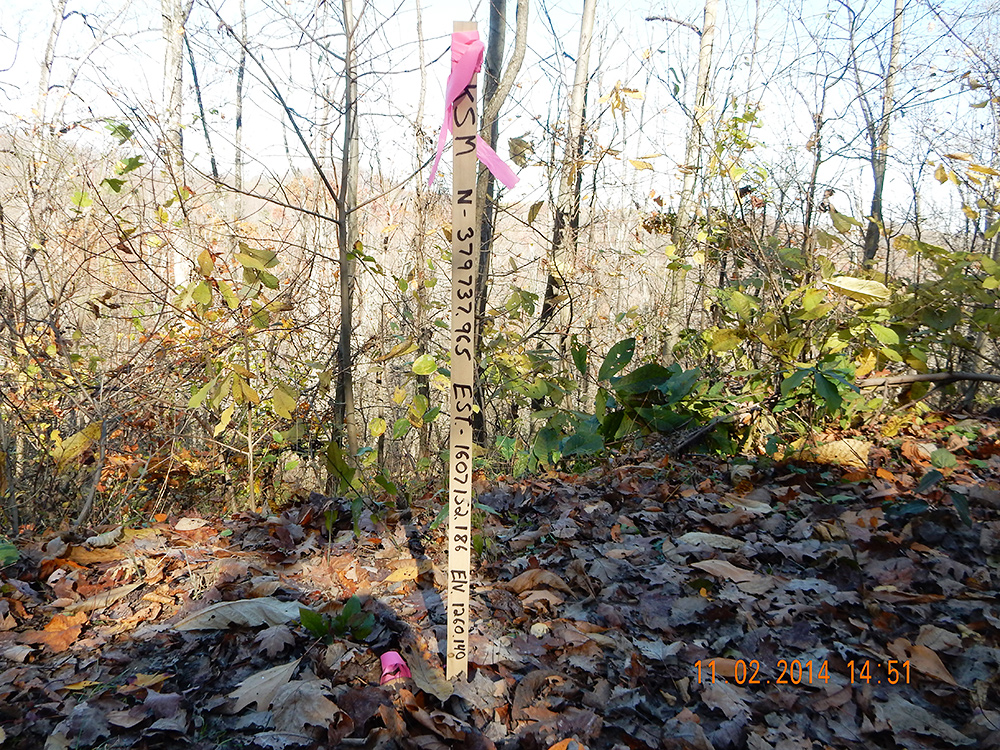
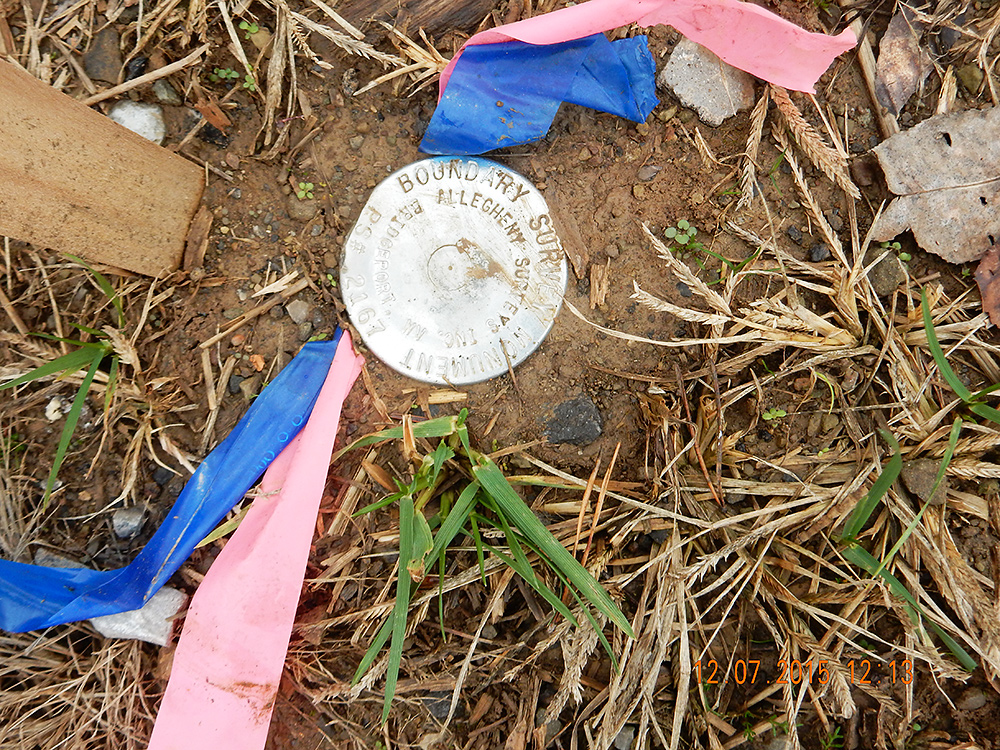
Below shows the two sets of wooden stakes, roughly 70-80 feet apart, with flags and capped steel rebar pins. Both stakes were near the road’s gravel lane, which is a public right of way. Nevertheless, the stakes were clearly on my property. The markings on one side of the stake identify the latitude, longitude, and the elevation above sea level of the point. The other side of the stake identified it as locating the OVC pipeline (seen here as “OVC 6C):


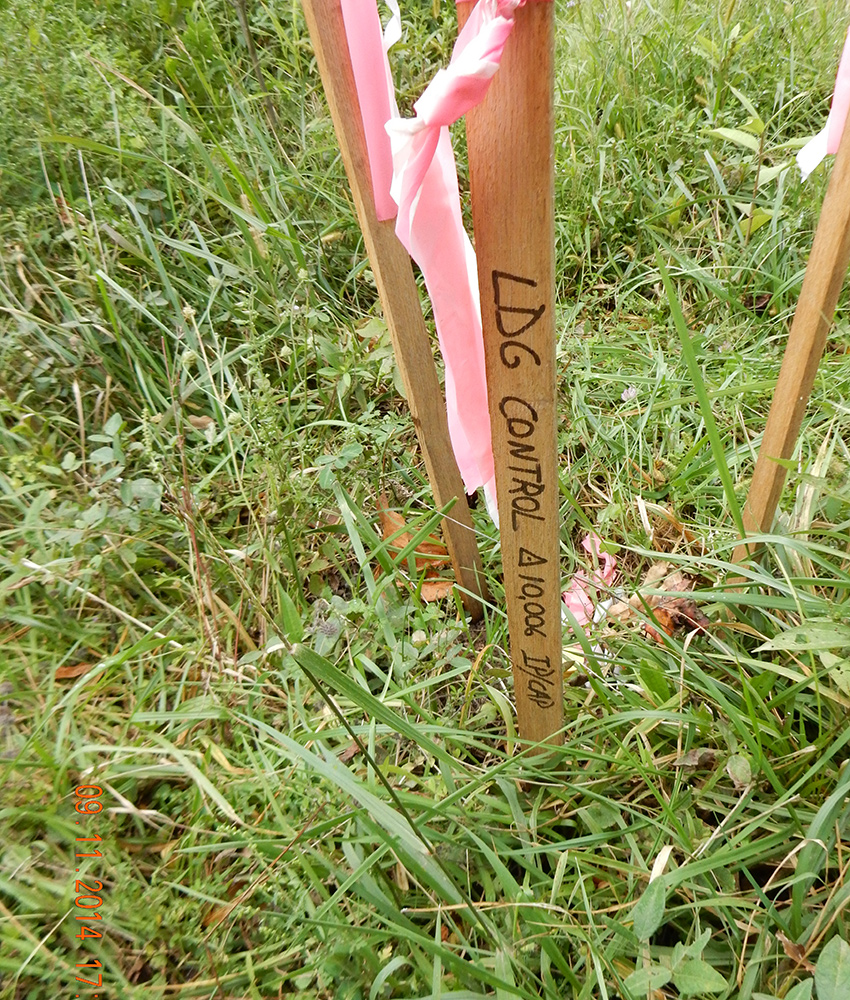
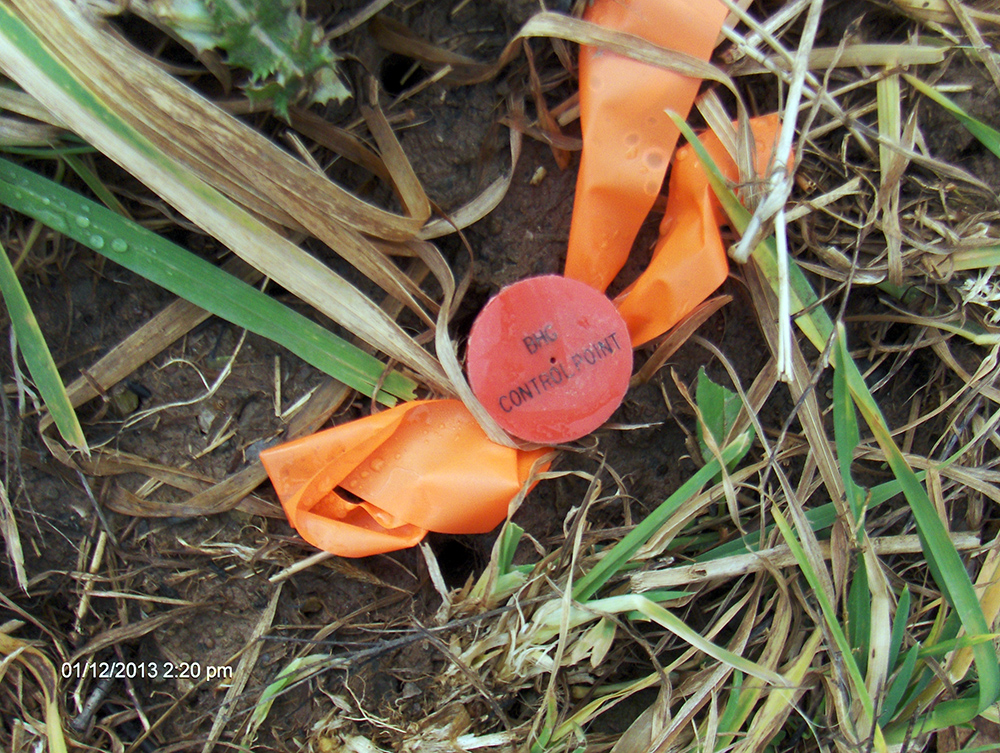
These identifying numbers are unique to this pin which is used to denote a specific type of location called a “control point.” Control points are usually located off to the side of the center-line of the pipeline:
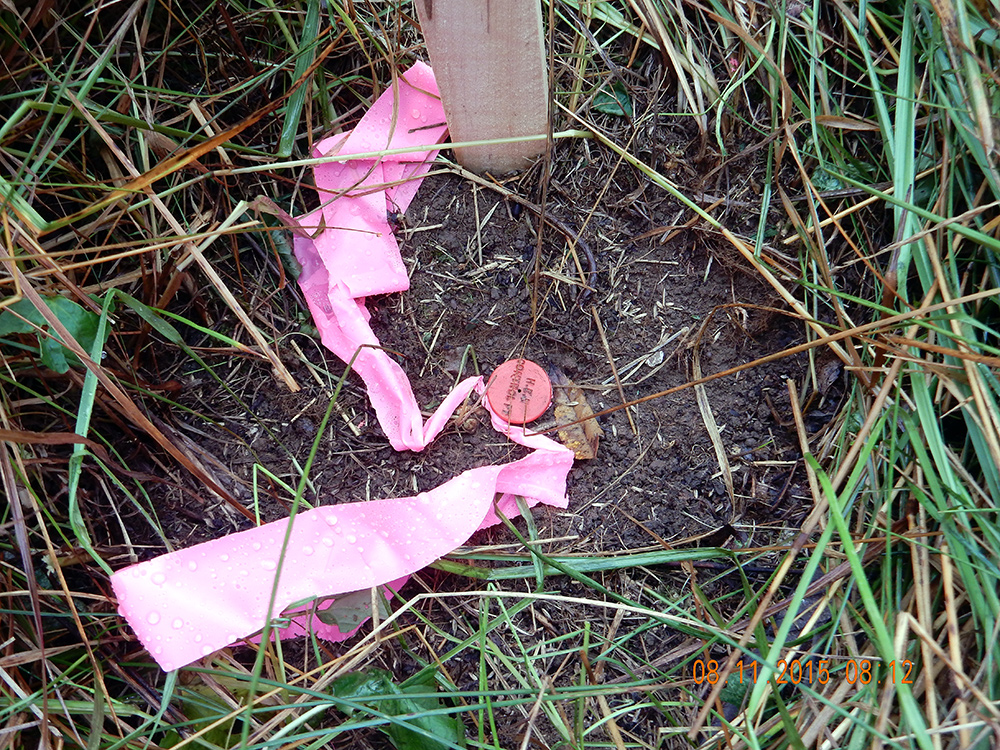
A control point, located off to the side of the center-line of the pipeline.
It seemed that somehow, without informing me or asking permission to be on my land, EQT had changed their mind on the OVC route and were again planning to run a pipeline through my property. If this was intentional, both EQT and I had a problem. If this was some kind of mistake, then only EQT would have a problem. Either way I could not fathom how this happened. Trespassing, real or perceived, is always a sensitive topic. This is especially true since, when I had initially allowed the surveyor to be on my property, I had not given permission for surveying. Given concerns about eminent domain, I wanted answers quickly. I documented all this with detailed pictures in preparation for contacting EQT representatives in Pittsburgh, PA, with my complaints.
Part III: What Happened & How?
I think it is safe to say that, in light of my well-known activism in documenting all things Marcellus, I am not your average surface owner. I have over 10,000 photographs of Marcellus operations in Wetzel County and I document every aspect of it. Frequently this leads to contacting many state agencies and gas operators directly about problems. I knew which gas company was responsible and I also knew exactly who in Pittsburgh to contact. To their credit, the person I contacted at EQT, immediately responded and it took most of the day to track down what had happen. The short story was that it was all a simple mistake—a 4,300 foot long mistake—but still just a mistake. The long story follows.
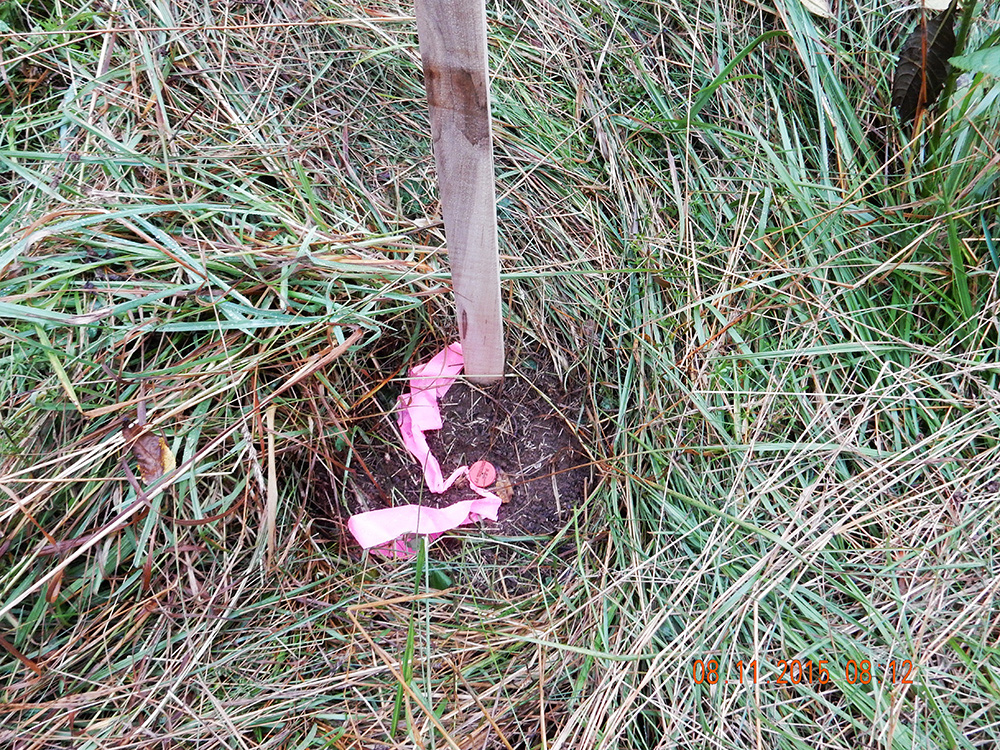
The EQT representative assured me that someone would be out to remove their stakes, flags and the steel pins. I told them that they needed to be prompt and that I would not alter or move their property and locating points. The next day, when I got home, the stakes with flags were gone. Just a small bare patch of dirt remained near the white plastic fencepost I had placed to mark the location. However, since I am a cultivated skeptic—adhering to the old Russian proverb made famous by President Reagan, “Trust but Verify”—I grabbed a garden trowel, dug around a bit, and clink, clink. The steel pin had just been driven deeper to look good, just waiting for my tiller to locate someday. I profusely re-painted the pin, photographed it, and proceeded to send another somewhat harsh e-mail to EQT. The pin was removed the next day.


After all the stakes, ribbons, and steel pins were removed, EQT provided further insights into what had transpired. Multiple pipeline routes were being evaluated by EQT in the area. Gas companies always consider a wide range of constraints to pipeline construction such as road and stream crossings, available access roads, permission and cooperation of the many landowners, steepness of terrain, etc. At a certain point in their evaluation, a final route was chosen. But for unknown reasons the surveyor crew was given the old, now abanoned, route on which to establish their control points. The magnitiude of the error can be seen on the map below. The bright blue line is the original path of the OVC pipeline through my property and the red line shows where the FERC filed pipeline route will go. A new control point has now been established near the highway where the pipeline was meant to cross.
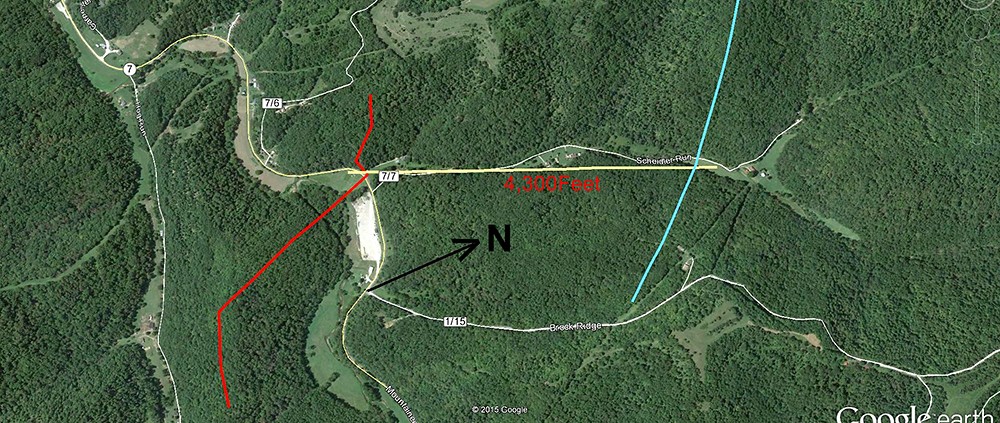
The FERC filed OVC pipeline route vs. the accidentally surveyed route.
Part IV: Lessons To Be Learned
Given the likely impact of many proposed large-diameter, very long, pipelines being planned, it seems useful to examine how these errors can happen. What can we learn from my personal experience with the hundreds of miles of new pipelines constructed in Wetzel County over the past eight years? First, it is important to ask whether or not similar problems are likely to happen elsewhere, or if this was this just an isolated incident. Can we realistically expect better planning on the proposed Mountain Valley Pipeline, which will run for over 300 miles? Can the residents and landowners living along these pipeline RoWs expect more responsible construction and management practices?
In general, many of the pipeline projects with which landowners, such as those in Wetzel County, are familiar with fall into the unregulated, gathering line category. They might be anywhere from six inches in diameter up to sixteen inches. As we review their track record, we have seen every imaginable problem, both during construction and after they were put into operation. We have had gas leaks and condensate spills, hillside mud slips, broken pipes, erosion and sedimentation both during construction and afterwards.
Now for some apparently contradictory assumptions—I am convinced that, for the most part, truck drivers, pipeliners, equipment operators, drilling and fracturing crews, well tenders and service personnel at well sites, all do the best job they can. If they are given the proper tools and materials, accurate directions with trained and experienced supervision, the support resources and the time to do a good job, then they will complete their tasks consistently and proudly. A majority of employees in these positions are dedicated, trained, competent, and hard working. Of course, there are no perfect contractors out there. These guys are human too. And on the midnight shift, we all get tired. In the context of this story, some pipeline contractors are better and more professional than others, some are more experienced, and some have done the larger pipelines. Therefore, despite best intentions, significant errors and accidents will still occur.
The Inherent Contradictions
It seems to me that the fragile link in natural gas production and pipeline projects is simply the weakness of any large organization’s inherent business model. Every organization needs to constantly focus on what I refer to as the “four C’s—Command and Control, then Coordination and Communication—if they are to be at all successful. It is a challenge to manage these on a daily basis even when everyone is in the same big building, working for the same company, speaking the same language. This might be in a university, or a large medical complex, or an industrial manufacturing plant.
But the four C’s are nearly impossible to manage due to the simple fact that the organizational structure of the natural gas industry depends completely on hundreds of sub-contractors. And those companies, in turn, depend on a sprawling and transient, expanding and collapsing, network of hundreds of other diverse and divergent independent contractors. For example, on any given well pad, during the drilling or fracturing process, there might be a few “company” men on site. Those few guys actually work for the gas company in whose name the operating permit is drawn. Everyone else is working for another company, on site temporarily until they are ready to move on, and their loyalty is elsewhere.
In the best of situations, it is next to impossible to get the right piece of information to the right person at just the right time. Effective coordination among company men and contractors is also next to impossible. I have seen this, and listened in, when the drilling company is using one CB radio channel and the nearby pipeline company is using some private business band radio to talk to “their people.” In that case, the pipeline contractors could not talk to the well pad—and it did not matter to them. In other cases, the pilot vehicle drivers will unilaterally decide to use another CB radio channel and not tell everyone. I have also watched while a massive drill rig relocation was significantly delayed simply because a nearby new gas processing plant was simultaneously running at least a hundred dump trucks with gravel on the same narrow roadway. Constant communication is a basic requirement for traffic coordination, but next to impossible to do properly and consistently when these practices are so prevalent.
These examples illustrate how companies are often unable to coordinate their operations. Now, if you can, just try to picture this abysmal lack of command and control, and minimal communication and coordination, in the context of building a 300-mile length of pipeline. The larger the pipeline diameter, and the greater the overall length of the pipeline, the more contractors will be needed. With more contractors and sub-contractors, the more coordination and communication are essential. A FERC permit cannot fix this, nor would having a dozen FERC permits. Unfortunately, I do not envision the four Cs improving anytime soon in the natural gas industry. It seems to be the nature of the beast. If, as I know from personal experience, a major gas company can arrange to locate a surveyed control point 4,300 feet from where it should have been, then good luck with a 300 mile pipeline. Even with well-intentioned, trained employees, massive problems are still sure to come.
The FERC approvals for these pipelines might not be a done deal, but I would not bet against them. So vigilance and preparation will still be of the essence. Citizen groups must be prepared to observe, monitor, and document these projects as they unfold. If massive pipelines like the MVP and OVC are ever built, they should become the most photographed, measured, scrutinized, and documented public works projects since the aqueducts first delivered water to ancient Rome. For the sake of protecting the people and environment of Wetzel County and similar communities, I hope this is the case.
By Bill Hughes, WV Community Liaison, FracTracker Alliance
Read more Field Diary articles.
Appendix: Questions to Ask When Approached by a Land Agent (Landsman)
These questions can be modified to suit your location. The abbreviation “Gas Corp.” is used below to reference a typical natural gas company or a pipeline subsidiary to a natural gas company. These subsidiaries are frequently called Midstream Companies. Midstream companies build and manage the pipelines, gas processing, and some compressor stations on behalf of natural gas companies.
- Please provide a Plain English translation of your landowner initial contract.
- What will Gas Corp. be allowed to do, and not allowed to do, short term and long term?
- What will Gas Corp. be required to do, and not required to do?
- What is the absolute minimum distance this pipeline will be placed away from any dwelling anywhere along its entire length?
- What restrictions will there be on the my land after you put in the pipelines?
- Who will be overseeing and enforcing any environmental restrictions (erosion and sedimentation, slips, stream crossings, etc.)?
- Who will be responsible for my access road upkeep?
- Who will be responsible for long term slips and settlements of surface?
- When would this construction begin?
- When would all work be completed?
- Who would be responsible for long term stability of my land?
- Will the pipeline contractor(s) be bound to any of our agreements?
- Who are the pipeline contractor(s)?
- What will be transported in the pipeline?
- Will there be more than one pipe buried?
- How wide is the temporary work RoW?
- How wide is the permanent RoW?
- How deep will the pipeline(s) be buried?
- What size pipe will it be; what wall thickness?
- How often will the welds on the individual pipe segments be inspected?
- Will there be any above ground pipeline components left visible?
- Where will the pipe(s) originate and where will they be going to?
- What will the average operating pressure be?
- What will the absolute maximum pressure ever be?
- At this pressure and diameter, what is the PIR—Potential Impact Radius?
- Will all pipeline and excavating and laying equipment be brought in clean and totally free from any invasive species?
- How will the disturbed soil be reclaimed?
- Will all top soil be kept separate and replaced after pipeline is buried?
- Also, After all the above is settled, how much will I be paid per linear foot of pipeline?


