
Pipeline Incidents Continue to Impact Residents
Pipelines play a major role in the oil and gas extraction industry, allowing for the transport of hydrocarbons from well sites to a variety of infrastructure, including processing plants, petrochemical facilities, power generation plants, and ultimately consumers. There are more than 2.7 million miles of natural gas and hazardous liquid pipelines in the United States, or more than 11 times the distance from Earth to the moon.
With all of this infrastructure in place, pipelines are inevitably routed close to homes, schools, and other culturally or ecologically important locations. But how safe are pipelines, really? While they are typically buried underground and out of sight, many residents are concerned about the constant passage of volatile materials through these pipes in close proximity to these areas, with persistent but often unstated possibility that something might go wrong some day.
Safety talking points
In an attempt to assuage these fears, industry representatives and regulators tend to throw around variants of the word “safe” quite a bit:
Pipelines are the safest and most reliable means of transporting the nation’s energy products.
— Keith Coyle, Marcellus Shale Coalition
Although pipelines exist in all fifty states, most of us are unaware that this vast network even exists. This is due to the strong safety record of pipelines and the fact that most of them are located underground. Installing pipelines underground protects them from damage and helps protect our communities as well.
— Pipeline and Hazardous Materials Safety Administration (PHMSA)
Pipelines are an extremely safe way to transport energy across the country.
— Pipeline 101
Knowing how important pipelines are to everyday living is a big reason why we as pipeline operators strive to keep them safe. Pipelines themselves are one of the safest ways to transport energy with a barrel of crude oil or petroleum product reaching its destination safely by pipeline 99.999% of the time.
— American Petroleum Institute
But are pipelines really safe?
Given these talking points, the general public can be excused for being under the impression that pipelines are no big deal. However, PHMSA keeps records on pipeline incidents in the US, and the cumulative impact of these events is staggering. These incidents are broken into three separate reports:
- Gas Distribution (lines that take gas to residents and other consumers),
- Gas Transmission & Gathering (collectively bringing gas from well sites to processing facilities and distant markets), and
- Hazardous Liquids (including crude oil, refined petroleum products, and natural gas liquids).
Below in Table 1 is a summary of pipeline incident data from 2010 through mid-November of this year. Of note: Some details from recent events are still pending, and are therefore not yet reflected in these reports.
Table 1: Summary of pipeline incidents from 1/1/2010 through 11/14/2018
| Report | Incidents | Injuries | Fatalities | Evacuees | Fires | Explosions | Damages ($) |
| Gas Distribution | 934 | 473 | 92 | 18,467 | 576 | 226 | 381,705,567 |
| Gas Transmission & Gathering | 1,069 | 99 | 24 | 8,614 | 121 | 51 | 1,107,988,837 |
| Hazardous Liquids | 3,509 | 24 | 10 | 2,471 | 111 | 14 | 2,606,014,109 |
| Totals | 5,512 | 596 | 126 | 29,552 | 808 | 291 | 4,095,708,513 |
Based on this data, on average each day in the US 1.7 pipeline incidents are reported (a number in line with our previous analyses), requiring 9 people to be evacuated, and causing almost $1.3 million in property damage. A pipeline catches fire every 4 days and results in an explosion every 11 days. These incidents result in an injury every 5 days, on average, and a fatality every 26 days.
Data shortcomings
While the PHMSA datasets are extremely thorough, they do have some limitations. Unfortunately, in some cases, these limitations tend to minimize our understanding of the true impacts. A notable recent example is a series of explosions and fires on September 13, 2018 in the towns of Lawrence, Andover, and North Andover, in the Merrimack Valley region of Massachusetts. Cumulatively, these incidents resulted in the death of a young man and the injuries to 25 other people. There were 60-80 structure fires, according to early reports, as gas distribution lines became over-pressurized.
The preliminary PHMSA report lists all of these Massachusetts fires as a single event, so it is counted as one fire and one explosion in Table 1. As of the November 14 download of the data, property damage has not been calculated, and is listed as $0. The number of evacuees in the report also stands at zero. This serves as a reminder that analysis of the oil and gas industry can only be as good as the available data, and relying on operators to accurately self-report the full extent of the impacts is a somewhat dubious practice.
View map fullscreen | How FracTracker maps work
This map shows pipeline incidents in the US from 1/1/2010 through 11/14/2018. Source: PHMSA. One record without coordinates was discarded, and 10 records had missing decimal points or negative (-) signs added to the longitude values. A few obvious errors remain, such as a 2012 incident near Winnipeg that should be in Texas, but we are not in a position to guess at the correct latitude and longitude values for each of the 5,512 incidents.
Another recent incident occurred in Center Township, a small community in Beaver County, Pennsylvania near Aliquippa on September 10, 2018. According to the PHMSA Gas Transmission & Gathering report, this incident on the brand new Revolution gathering line caused over $7 million in damage, destroying a house and multiple vehicles, and required 49 people to evacuate. The incident was indicated as a fire, but not an explosion. However, reporting by local media station WPXI quoted this description from a neighbor:
A major explosion, I thought it was a plane crash honestly. My wife and I jumped out of bed and it was just like a light. It looked like daylight. It was a ball of flame like I’ve never seen before.
From the standpoint of the data, this error is not particularly egregious. On the other hand, it does serve to falsely represent the overall safety of the system, at least if we consider explosions to be more hazardous than fires.
Big picture findings
Comparing the three reports against one another, we can see that the majority of incidents (64%) and damages (also 64%) are caused by hazardous liquids pipelines, even though the liquids account for less than 8% of the total mileage of the network. In all of the other categories, however, gas distribution lines account for more than half of the cumulative damage, including injuries (79%), deaths (73%), evacuees (62%), fires (71%), and explosions (78%). This is perhaps due to the vast network (more than 2.2 million miles) of gas distribution mains and service lines, as well as their nature of taking these hazardous products directly into populated areas. Comparatively, transmission and hazardous liquids lines ostensibly attempt to avoid those locations.
Is the age of the pipeline a factor in incidents?
Among the available attributes in the incident datasets is a field indicating the year the pipeline was installed. While this data point is not always completed, there is enough of a sample size to look for trends in the data. We determined the age of the pipe by subtracting the year the pipe was installed from the year of the incident, eliminating nonsensical values that were created when the pipeline age was not provided. In the following section, we will look at two tables for each of the three reports. The first table shows the cause of the failure compared to the average age, and the second breaks down results by the content that the pipe was carrying. We’ll also include a histogram of the pipe age, so we can get a sense of how representative the average age actually is within the sample.
A. Gas distribution
Each table shows some fluctuation in the average age of pipeline incidents depending on other variables, although the variation in the product contained in the pipe (Table 3) are minor, and may be due to relatively small sample sizes in some of the categories. When examining the nature of the failure in relation to the age of the pipe (Table 2), it does make sense that incidents involving corrosion would be more likely to afflict older pipelines, (although again, the number of incidents in this category is relatively small). On average, distribution pipeline incidents occur on pipes that are 33 years old.
When we look at the histogram (Figure 1) for the overall distribution of the age of the pipeline, we see that those in the first bin, representing routes under 10 years of age, are actually the most frequent. In fact, the overall trend, excepting those in the 40 t0 50 year old bin, is that the older the pipeline, the fewer the number of incidents. This may reflect the massive scale of pipeline construction in recent decades, or perhaps pipeline safety protocol has regressed over time.
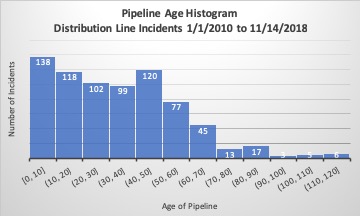
Figure 1. Age of pipeline histogram for gas distribution line incidents between 1/1/2010 and 11/14/2018. Incidents where the age of the pipe is unknown are excluded.
B. Gas Transmission & Gathering
Transmission & Gathering line incidents occur on pipelines routes that are, on average, five years older than their distribution counterparts. Corrosion, natural force damage, and material failures on pipes and welds occur on pipelines with an average age above the overall mean, while excavation and “other outside force” incidents tend to occur on newer pipes (Table 4). The latter category would include things like being struck by vehicles, damaged in wildfires, or vandalism. The contents of the pipe does not seem to have any significant correlation with the age of the pipe when we take sample size into consideration (Table 5).
The histogram (Figure 2) for the age of pipes on transmission & gathering line incidents below shows a more normal distribution, with the noticeable exception of the first bin (0 to 10 years old) ranking second in frequency to the fifth bin (40 to 50 years old).
It is worth mentioning that, “PHMSA estimates that only about 5% of gas gathering pipelines are currently subject to PHMSA pipeline safety regulations.” My correspondence with the agency verified that the remainder is not factored into their pipeline mileage or incident reports in any fashion. Therefore, we should not consider the PHMSA data to completely represent the extent of the gathering line network or incidents that occur on those routes.

Figure 2. Age of pipeline histogram for transmission & gathering line incidents between 1/1/2010 and 11/14/2018. Incidents where the age of the pipe is unknown are excluded.
C. Hazardous Liquids
The average incident on hazardous liquid lines occurs on pipelines that are 27 years old, which is 6 years younger than for distribution incidents, and 11 years younger than their transmission & gathering counterparts. This appears to be heavily skewed by the equipment failure and incorrect operation categories, both of which occur on pipes averaging 15 years old, and both with substantial numbers of incidents. On the other hand, excavation damage, corrosion, and material/weld failures tend to occur on pipes that are at least 40 years old (Table 6).
In terms of content, pipelines carrying carbon dioxide happen on pipes that average just 11 years old, although there are not enough of these incidents to account for the overall departure from the other two datasets (Table 7).
The overall shape of the histogram (Figure 3) is similar to that of transmission & gathering line incidents, except that the first bin (0 to 10 years old) is by far the most frequent, with more than 3 and a half times as many incidents as the next closest bin (4o to 50 years old). Operators of new hazardous liquid routes are failing at an alarming rate. In descending order, these incidents are blamed on equipment failure (61%), incorrect operation (21%), and corrosion (7%), followed by smaller amounts in other categories. The data indicate that pipelines installed in previous decades were not subject to this degree of failure.
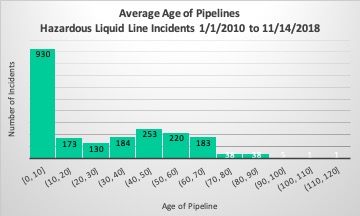
Figure 3. Age of pipeline histogram for hazardous liquid line incidents between 1/1/2010 and 11/14/2018. Incidents where the age of the pipe is unknown are excluded.
Conclusions
When evaluating quotes, like those listed above, that portray pipelines as a safe way of transporting hydrocarbons, it’s worth taking a closer look at what they are saying.
Are pipelines the safest way of transporting our nation’s energy products? This presupposes that our energy must be met with liquid or gaseous fossil fuels. Certainly, crude shipments by rail and other modes of transport are also concerning, but movements of solar panels and wind turbines are far less risky.
Does the industry have the “strong safety record” that PHMSA proclaims? Here, we have to grapple with the fact that the word “safety” is inherently subjective, and the agency’s own data could certainly argue that the industry is falling short of reasonable safety benchmarks.
And what about the claim that barrels of oil or petroleum products reach their destination “99.999% of the time? First, it’s worth noting that this claim excludes gas pipelines, which account for 92% of the pipelines, even before considering that PHMSA only has records on about 5% of gas gathering lines in their pipeline mileage calculations. But more to the point, while a 99.999% success rate sounds fantastic, in this context, it isn’t good enough, as this means that one barrel in every 100,000 will spill.
For example, the Dakota Access Pipeline has a daily capacity of 470,000 barrels per day (bpd). In an average year, we can expect 1,715 barrels (72,030 gallons) to fail to reach its destination, and indeed, there are numerous spills reported in the course of routine operation on the route. The 590,000 bpd Keystone pipeline leaked 9,700 barrels (407,400 gallons) late last year in South Dakota, or what we might expect from four and a half years of normal operation, given the o.001% failure rate. In all, PHMSA’s hazardous liquid report lists 712,763 barrels (29.9 million gallons) were unintentionally released, while an additional 328,074 barrels (13.8 million gallons) were intentionally released in this time period. Of this, 284,887 barrels (12 million gallons) were recovered, meaning 755,950 barrels (31.7 million gallons) were not.
Beyond that, we must wonder whether the recent spate of pipeline incidents in new routes is a trend that can be corrected. Between the three reports, 1,283 out of the 3,853 (32%) incidents occurred in pipelines that were 10 years old or younger (where the year the pipeline’s age is known). A large number of these incidents are unforced errors, due to poor quality equipment or operator error.
One wonders why regulators are allowing such shoddy workmanship to repeatedly occur on their watch.
By Matt Kelso, Manager of Data and Technology, FracTracker Alliance
It is probable that the first 10 years of operation of a pipeline accounts for more incidents because the flaws in construction and operating equipment happen sooner rather than later. If equipment survives the initial period (in this case 10 years) it is lees likely to fail until decades of use and corrosion have taken their toll.
Is it possible to normalize the data? The absolute number of incidents isn’t informative. The number could be higher for pipelines 0-10 years old than 50-60 years old because there are more pipelines or because they fail at a greater rate. In the past PHMSA has normalized the number of incidents to per 10,000 miles of pipe.
It’s definitely important to consider the fact that pipeline construction has increased in scale over time, which likely contributes to the high number of incidents we’re seeing in newer pipelines. We didn’t normalize the data for each age bracket in this particular article, but the data is out there: https://cms.phmsa.dot.gov/data-and-statistics/pipeline/annual-report-mileage-summary-statistics.
Looking at the stats on average age of a pipeline for each cause of failure shows that equipment failure and incorrect operation frequently impact newer pipelines- suggesting that poor safety protocol is also to blame.