
Pipelines Continue to Catch Fire and Explode
For the past decade, petroleum operators in the United States have been busy pumping record amounts of oil and gas from the ground. But has the pace been too frenzied? Since the vast majority of the oil and gas is not used in situ, the industry must transport these hydrocarbon products to other locations. The principal way of achieving this is through pipelines, a process which has resulted in thousands of incidents, causing hundreds of injuries and fatalities, thousands of evacuations, and billions of dollars’ worth of damage.
The United States has an estimated 3 million miles of hazardous liquid, gas distribution, and gathering and transmission pipelines in operation, and more are being built every day. Not only have the pipelines themselves become so ubiquitous that most people never give them a second thought, the incidents themselves have become so familiar to us that even severe ones struggle to gain any attention outside of the local media area.
In 2019, there were 614 reported pipeline incidents in the United States, resulting in the death of 10 people, injuries to another 35, and about $259 million in damages. As mentioned below, some of these totals are likely to creep upward as additional reports are filed. In terms of statistical fluctuations, 2019 was slightly better than normal, but of course statistics only tell a part of the story. Friends and family of the ten people that died last year would find no comfort knowing that there were fewer such casualties than 2017, for example. Similarly, it would be useless to comfort a family that lost their home by reminding them that someone lost an even bigger and more expensive home the year before.
Keeping in mind the human impact, let’s take a look at the data.
Pipeline Incident Summary
These incidents are broken into three separate reports:
- Hazardous Liquids (including crude oil, refined petroleum products, and natural gas liquids).
- Gas Distribution (lines that take gas to residents and other consumers), and
- Gas Transmission & Gathering (collectively bringing gas from well sites to processing facilities and distant markets)
View map fullscreen | How FracTracker maps work
Table 1: Summary of pipeline incidents from 1/1/2010 through 12/31/2019
| Report | Incidents | Fatalities | Injuries | Evacuees | Damages ($) | Fires | Explosions |
| Hazardous Liquids Lines | 3,978 | 10 | 26 | 2,482 | 2,812,391,218 | 130 | 15 |
| Gas Transmission & Gathering Lines | 1,226 | 25 | 108 | 12,984 | 1,315,162,976 | 133 | 57 |
| Gas Distribution | 1,094 | 105 | 522 | 20,526 | 1,229,189,997 | 659 | 257 |
| Totals | 6,298 | 140 | 656 | 35,992 | 5,356,744,191 | 922 | 329 |
But is increasing the capacity of the pipes a good idea? As FracTracker has shown in the past, pipeline incidents occur at a rate of about 1.7 incidents per day. This holds true with updated data, showing 6,298 incidents from January 1, 2010 through December 17, 2019, which was the latest report filed when the data was downloaded in early February 2020.
Pipeline Usage in the United States
In 2018, roughly three million miles of natural gas pipelines transported almost 28 trillion cubic feet (Tcf) of gas, which is roughly 13 times the volume of Mount Everest. For liquids, pipeline data is available showing shipments of from one region of the country (known as a PAD District) to another, which shows that 1.27 billion barrels of crude oil were shipped through almost 81,000 miles of pipelines in 2018, and 3.39 billion barrels through nearly 214,000 miles of pipes when counting natural gas liquids and refined petroleum products.
Note that these figures are less than 2018 estimates based on 70% of liquid petroleum products being moved by pipeline. This discrepancy could be accounted for by the dramatic increase in production in recent years, or perhaps by intra-PAD shipments not listed in the data above. For example, petroleum produced in the Permian Basin in western Texas and eastern New Mexico may travel nearly 500 miles by pipeline en route to export terminals on the Gulf coast, while remaining in the same PAD District. If the 70% estimate holds true, then roughly 2.8 billion barrels (117 billion gallons) of crude would be shipped by pipeline, more than twice as much as the 1.27 billion barrel figure shown above.
The drilling boom in the United States was quickly followed by a boom in pipeline construction. Total mileage for liquid pipelines – known as hazardous liquid lines – increased by 20% from 2010 to 2018. For those aware of thousands of miles of recent gas pipeline projects, it is confusing to hear that the data from the Pipeline and Hazardous Materials Safety Administration (PHMSA) are mixed for natural gas. It does show a 2.4% increase in total miles for gas distribution mainlines to 1.3 million miles, and a 2.0% increase over the same time in distribution service lines, which run from the mainlines to the consumer. However, the total mileage for transmission lines – which are large diameter pipes that move gas long distances – actually contracted 2.1% to just under 302,000 miles. Total mileage for gathering lines fell even more, by 8.4% to just under 18,000 miles. However, since PHMSA estimates only 5% of gathering lines report to the agency, this last figure is probably not a valid estimate.
If this data is accurate, it means that the thousands of miles of transmission and gathering lines built in recent years were more than offset by decommissioned routes. However, given the record production levels mentioned above, it is almost certain that total capacity of the system has gone up, which can be accomplished through a combination of increased pressure and diameter of the pipe.
Hazardous Liquids
Table. 2. Hazardous Liquid Pipeline Incident Impact Summary. Data from PHMSA.
| Year | Incidents | Fatalities | Injuries | Evacuees | Damages ($) | Fires | Explosions |
| 2010 | 350 | 1 | 3 | 686 | 1,075,193,990 | 8 | 1 |
| 2011 | 344 | 0 | 1 | 201 | 273,526,547 | 9 | 2 |
| 2012 | 366 | 3 | 4 | 235 | 145,477,426 | 10 | 2 |
| 2013 | 401 | 1 | 6 | 858 | 278,525,540 | 15 | 2 |
| 2014 | 455 | 0 | 0 | 34 | 140,211,610 | 20 | 4 |
| 2015 | 460 | 1 | 0 | 138 | 256,251,180 | 16 | 1 |
| 2016 | 420 | 3 | 9 | 104 | 212,944,094 | 17 | 2 |
| 2017 | 415 | 1 | 1 | 58 | 163,118,772 | 7 | 0 |
| 2018 | 405 | 0 | 2 | 165 | 152,573,682 | 15 | 1 |
| 2019 | 362 | 0 | 0 | 3 | 114,568,377 | 13 | 0 |
| Grand Total | 3978 | 10 | 26 | 2482 | 2,812,391,218 | 130 | 15 |

The most important statistics when considering pipeline incidents are those representing bodily harm – injuries and fatalities. In those respects, at least, 2019 was a good year for hazardous liquid pipelines, with no reported injuries or fatalities. Most of the other metrics were below average as well, including 362 total incidents, three evacuees, $115 million in damages, and zero explosions. The 13 reported fires represents a typical year. However, we should keep in mind that the results may not be complete for 2019. The data was downloaded on February 3, 2020, but represented the January 2020 update of the dataset. Additionally, there is often a gap between the incident date and the reporting date, which is sometimes measured in months.
One thing that really sticks out about hazardous liquid pipelines is that the pipelines that fail the most often are the newest. Of the hazardous liquid incidents since 2010, 906 occurred in pipelines that were installed within the decade. By means of comparison, the same amount of incidents occurred in the same period for pipes installed in the 40 years between 1970 and 2009. Of course, the largest category is “Unspecified,” where the install year of the pipeline was left blank in 1,459 of the 3,978 total incidents (37%).
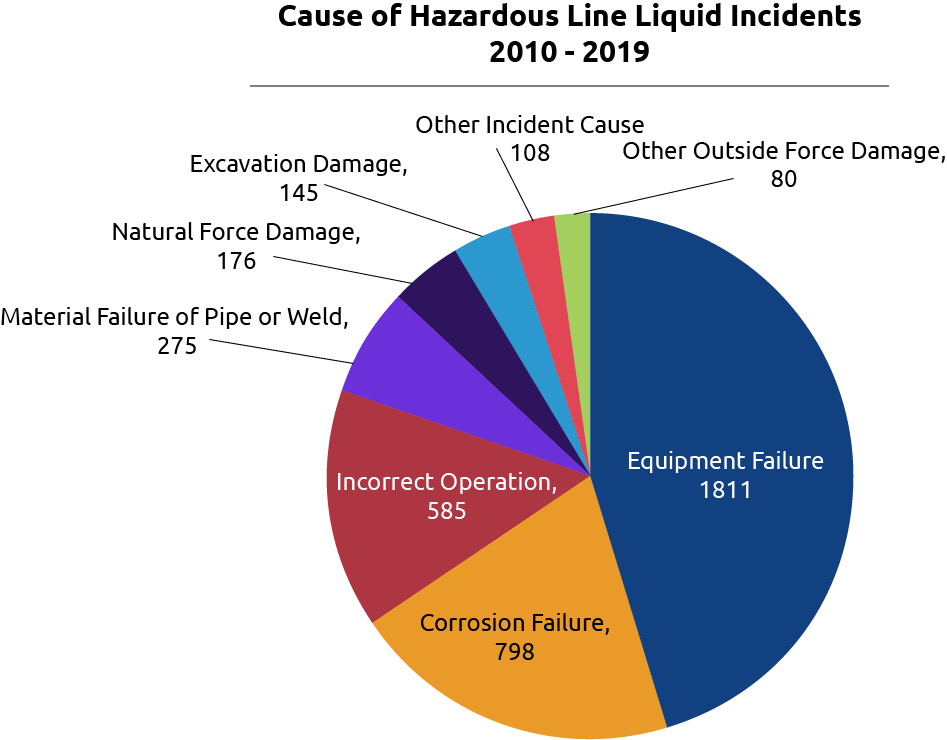
The causes of the incidents are dominated by equipment failure, where the 1,811 incidents accounted for 46% of the total. The next highest total was corrosion failure with 798 incidents, or 20% of the total. Six of the incidents in the “Other Outside Force Damage” are attributed to intentional damage, representing 0.15% of the total.
Gas Transmission & Gathering
Table. 3. Gas Transmission and Gathering Pipeline Incident Impact Summary. Data from PHMSA.
| Year | Incidents | Fatalities | Injuries | Evacuees | Damages ($) | Fires | Explosions |
| 2010 | 116 | 10 | 61 | 373 | 596,151,925 | 19 | 7 |
| 2011 | 128 | 0 | 1 | 874 | 125,497,792 | 14 | 6 |
| 2012 | 116 | 0 | 7 | 904 | 58,798,676 | 15 | 7 |
| 2013 | 112 | 0 | 2 | 3,103 | 53,022,396 | 11 | 4 |
| 2014 | 142 | 1 | 1 | 1,482 | 61,533,154 | 15 | 6 |
| 2015 | 149 | 6 | 16 | 565 | 61,498,753 | 10 | 6 |
| 2016 | 97 | 3 | 3 | 944 | 107,524,564 | 8 | 4 |
| 2017 | 126 | 3 | 3 | 202 | 85,665,233 | 17 | 7 |
| 2018 | 118 | 1 | 7 | 4,088 | 77,753,611 | 17 | 6 |
| 2019 | 122 | 1 | 7 | 449 | 87,716,872 | 7 | 4 |
| Grand Total | 1,226 | 25 | 108 | 12,984 | 1,315,162,976 | 133 | 57 |

One person died and seven were injured from gas transmission and gathering line accidents that were reported to PHMSA in 2019, which were both below average for this dataset. The total number of incidents was typical, while the 499 evacuees, $88 million in property damage, seven fires, and four explosions were all below normal. Note that only a small fraction of the nation’s gathering lines are required to report incident data to PHMSA, so this data should not be seen as comprehensive. And as with the hazardous liquid incidents, it is likely that not all incidents occurring during the year have had reports filed in time for this analysis.
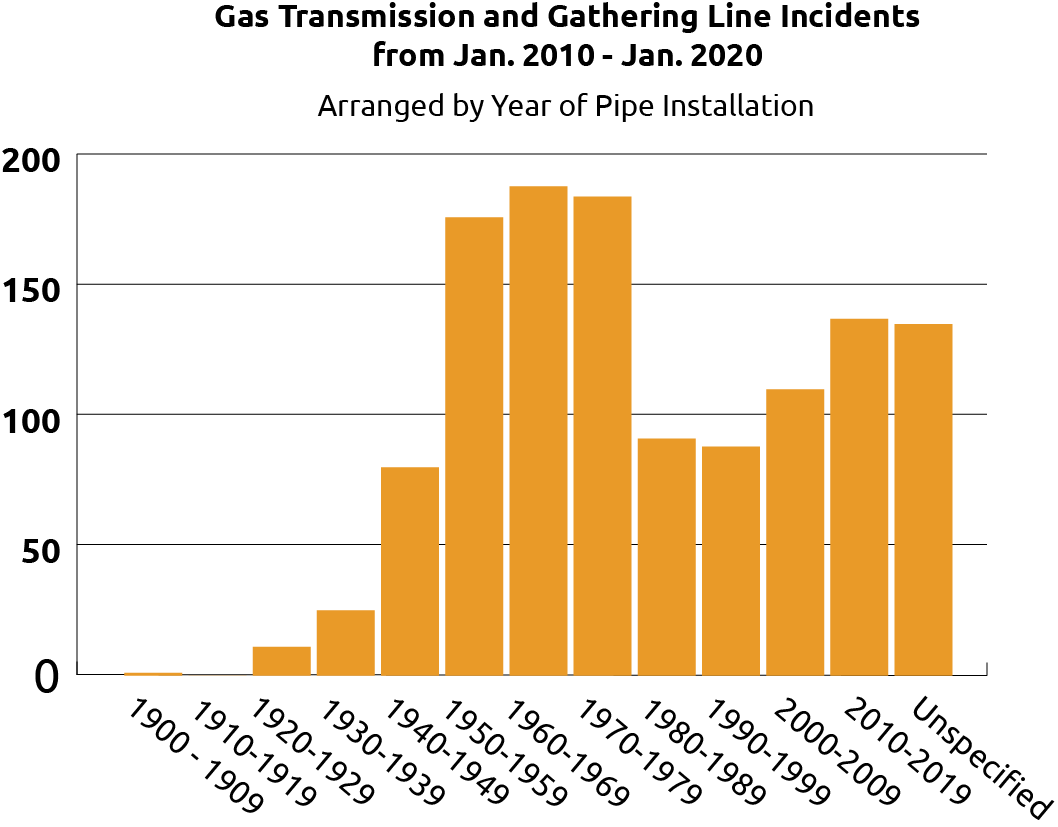
The distribution of the age of pipes that failed within the past decade is different from the hazardous liquid pipelines. Pipes installed in the 1950s, 1960s, and 1970s were the most likely to fail, although failures in routes built this century represent a secondary peak. The number of incidents where the age of pipe data field was not completed remains high at 135 incidents, but the data gap is not as outrageous as it is for hazardous liquid lines.
Once again, equipment failure is the most common cause of transmission and gathering line accidents, with 390 incidents accounting for 32% of the total. Corrosion failure was the second most common reason, with 239 incidents accounting for an additional 19%. One incident was attributed to intentional damage, accounting for 0.08% of the total.
Gas Distribution
| Year | Incidents | Fatalities | Injuries | Evacuees | Damages ($) | Fires | Explosions |
| 2010 | 120 | 11 | 44 | 2,080 | 21,155,972 | 82 | 29 |
| 2011 | 116 | 13 | 53 | 4,417 | 27,105,022 | 73 | 32 |
| 2012 | 88 | 9 | 46 | 746 | 25,556,562 | 61 | 22 |
| 2013 | 104 | 8 | 36 | 1,606 | 37,363,960 | 59 | 20 |
| 2014 | 106 | 18 | 93 | 2,037 | 72,885,067 | 61 | 30 |
| 2015 | 101 | 4 | 32 | 948 | 32,176,608 | 65 | 24 |
| 2016 | 115 | 10 | 75 | 2,510 | 56,900,068 | 71 | 28 |
| 2017 | 104 | 16 | 34 | 1,960 | 72,226,380 | 57 | 17 |
| 2018 | 110 | 7 | 81 | 2,561 | 827,647,610 | 64 | 31 |
| 2019 | 130 | 9 | 28 | 1,661 | 56,172,748 | 66 | 24 |
| Grand Total | 1,094 | 105 | 522 | 20,526 | 1,229,189,997 | 659 | 257 |
Table 4. Gas Distribution Pipeline Incident Impact Summary. Data from PHMSA.


The nine fatalities and 28 injuries reported for gas distribution lines in 2019 were obviously tragic, but these totals are both below what would be expected in a typical year. The 130 incidents and 66 fires were both above average totals, while the 1,661 evacuees, $56 million in property damage, and 24 explosions were all below average. As with the other reports, these totals are subject to change as additional reports are filed.
The distribution for the age of pipes that failed during the past decade is more like a normal (or bell curve) distribution than the other two datasets, with the most incidents occurring in pipeline routes laid in the 1990s. Much like the hazardous liquids dataset, however, the largest category is “Unspecified”, where the age of the pipe was not entered into the data for one reason or another. These 222 incidents account for 20% of the total, and if we had this data, the distribution could be significantly different.
The causes of distribution line incidents are attributed very differently than either the hazardous liquids or transmission and gathering line datasets. The leading cause is “Other Outside Force Damage,” with 355 incidents accounting for 32% of the total, followed by 330 “Excavation Damage” incidents accounting for an additional 30%. This difference could well be explained because this type of line tends to occur in highly populated areas. The largest subtype for the outside force damage category is damage by motor vehicles not involved in excavation, with 160 incidents, followed by fires or explosions which the operator claims did not originate with the pipeline, with 78 incidents. Intentional damage remains rare – although still way too high – with 15 incidents, or 1.4% of the overall total.
Data Notes
PHMSA incident data is ultimately self-reported by the various operators. Because the vast majority of gathering lines do not report to the agency, this dataset should not be seen as comprehensive for incidents in that category.
There were eleven issues with faulty location data that we were able to correct for this map. There are likely to be more, as only the ones with coordinates rendering outside of the United States were identified. Some of these had mixed up latitude and longitude values, or omitted the negative value for longitude, placing the points in Kyrgyzstan, the Himalayas, and Mongolia. One record had no coordinates at all, but included a detailed description of the location, which was then found on Google Maps. Two wells that rendered in Canada were on the correct longitude for the county that they belonged in, but had faulty latitude values. One of these was reduced by exactly 20° of latitude, while the other was reduced by exactly 7° of latitude, and were then located in the proper county. Other than the adjustments for these eleven incidents, all location data reflects the data available on the PHMSA .
Additional Leaks
The data above reflects 6,298 incidents over the course of a decade, with a few more incidents likely to trickle in during the next few updates of the reports by PHMSA. And while these discrete incidents account for the majority of human impacts in terms of life and well-being, it is worth noting that these 1.7 incidents per day are not the only problems that occur along millions of miles of pipelines in this country.
William Limpert has analyzed information about pipeline leakage in gas transmission lines, which found that 0.35% of the volume of gas was lost in transmission, one tenth of which was vented or flared intentionally, for example in compressor station blowdown events. This means that 0.315% of the gas is released unintentionally.
These numbers sound tiny, but due to the enormous volume of gas transported in pipes, they really add up quickly. For example, the Atlantic Coast Pipeline, Mr. Limpert’s primary focus, is scheduled to transmit 1.5 billion cubic feet (Bcf) of natural gas per day. At a typical rate of failure, we could expect leakage of 4.725 million cubic feet (MMcf) per day, or 1.725 billion cubic feet over the course of a year. That’s enough gas to provide to all Pennsylvania residential consumers for about 13 days in August, and this is just from one pipeline.
As mentioned above, the entire pipeline network moved about 28 Tcf in 2018. The estimated amount leaked at 0.315% is 88.2 Bcf. What would residential consumers pay for that volume of gas? Even with the current low prices due to the gas glut, the average residual price was $9.43 per Mcf in November 2019, the most recent data available. That means that residential consumers would pay roughly $832 million for an equivalent amount of gas.
Still More Leaks
There are also countless leaks that occur during the construction of the pipelines themselves. When pipelines are built, they have numerous obstacles to navigate during their construction. Among the most challenging are linear obstacles, such as roads and streams. A method that the industry regularly uses to avoid having to trench through these features is horizontal directional drilling (HDD).
While HDDs are meant to minimize impacts, they very frequently result in an incident known as an “inadvertent return,” when volumes of drilling mud return to the surface through a series of underground voids, frequently karst geology or abandoned mines. The leaking borehole under the road or stream then leaks drilling mud – sometimes thousands of gallons of it – which can then affect aquatic stream life. Additionally, these areas represent voids in the matrix that is intended to keep the pipeline stable and may represent future opportunities for catastrophic failure.
These features are so prevalent in some parts of the country that pipeline operators seem to be unable to avoid them, and regulators seem unwilling to press the issue in a proactive fashion. For example, Energy Transfers’ Mariner East II pipeline is currently being built to move natural gas liquids from Appalachia to its industrial complex and export terminal at Marcus Hook, Pennsylvania. During construction, there have been hundreds of inadvertent returns, both to the soil and waters of the Commonwealth. The presence of karst and abandoned mines along the route were well known ahead of time to the operator designing and implementing the HDDs, as well as the regulators who approved their use.
The many issues along the Mariner East II route, when combined with a massive pipeline explosion in Beaver County led to Pennsylvania’s decision to temporarily block all permit actions by the operator statewide. That hold is now lifted, leading residents along the route worried about a new batch of inadvertent returns, related sinkholes, and other follies as the project is completed. Construction activities for the parallel Mariner East 2X pipeline are already underway.
While residents along the Mariner East pipeline system have seen more than their fair share of impacts from the construction, these impacts are not at all rare on unusual. What is unusual, however, is for regulators to provide data highlighting these types of errors. In Pennsylvania, enough people requesting data on a variety of problematic pipelines has prompted the Department of Environmental Protection to create a Pennsylvania Pipeline Portal page. This only includes information on recent major pipeline projects and is not comprehensive in terms of content, but it is a major step in the right direction in terms of data transparency.
Can We Do Better?
Statistics can never capture the full force of tragedies. Most of us are aware of this point intellectually, and yet when we are confronted with such numbers, it seems that we are obliged to process them in one form or another. Perhaps the most common way is to compartmentalize it, where we might acknowledge the data and misfortune that they represent, but the file it away in the messy cabinet of our mind, clearing the slate of active thought for the next bit of information. Many of us never stop to question whether we can do better.
So, can we do better with pipelines? Perhaps so. If there are structural hazards such as abandoned mines or karst, perhaps regulators could demand that the operator route around them. If there are residents nearby, communities should demand that the pipeline get rerouted as well. Of course, these reroutes will just push the impacts elsewhere, but hopefully to an area where people won’t be affected by them, if such a place exists. Certainly, there could be better standards for construction and identification, so that there are fewer accidents involving pipelines. Or better yet, we could transition to renewable fuels for an ever-increasing share of our energy needs, making dirty and dangerous pipelines a relic of the past.
The one thing that we can no longer afford to do is continue to stick our fingers in our ears and dismiss the entire issue of pipeline safety as manageable or the cost of doing business.
By Matt Kelso, Manager of Data and Technology, FracTracker Alliance
Feature image at top of page shows San Bruno, California, following the 2010 pipeline explosion
I hope we can do better in design and construction and/or decrease the demand by reducing our reliance on this form of energy. Humanity should cooperate with nature and use it’s resources safely.
Agreed!