Upper Ohio River in Beaver County: Impact of Petrochemical Facility Discharge on the Community and What’s Behind This Long Battle
Overview
This project looked at the petrochemical industry within Beaver County, Pennsylvania, specifically focusing on their wastewater discharge into the upper Ohio River. This area should be of concern because much of the County lies within a “zone of high concern,” in a source water protection area designated by the federal EPA—and there are several industrial facilities along the river.
With the new Shell ethane cracker plant under construction in Potter Township, more discharge will be added to the existing pollution.
The first focus of the project was to calculate the load of certain toxins petrochemical facilities in Beaver County are permitted to discharge into the upper Ohio River, including the addition of the ethane cracker plant, and to study the chemicals of concern—as well as their health impact—since most attention has focused on a single point source, instead of the cumulative impact. GIS was used to map Beaver County’s demographic data to better understand the population affected.
The second part of the project was to evaluate reasons the Ohio River Valley has faced many extractive industries which laid the groundwork for the proposed new petrochemical infrastructure along the Ohio River. With the successful permanent fracking ban in the Delaware River Basin, it is worth looking into the unique challenges that make passing similar environmental protection policies difficult in the Ohio River Basin.
Based on the findings, this project also gave policy and strategy recommendations to environmental/environmental health organizations for future directions to involve the public and to increase awareness.
Pennsylvania is the second largest natural gas producing state in the US, with much of the production taking place in southwest Pennsylvania, including [13] Beaver County. For a long time, steel dominated the region’s industry [6]. Although the steel industry has died down, Beaver County has experienced more extractive industries in the Marcellus Shale, which is rich in underground natural gas. There have been many drilling activities here.
In 2016, Shell proposed to build a new ethane cracker plant in Potter Township, Beaver County. This facility will convert ethane gas, extracted from fracked wells, into polyethylene plastic. Shell stated it chose this location because of its proximity to ethane feedstock, and because 70 percent of North American polyethylene customers are within a 700-mile radius of Pittsburgh, which is only 30 miles away from this site. [14]
Study Site
For this project, I chose to focus on all the petrochemical facilities (Figure 1) within the county, including the Shell ethane cracker (Figure 2), because although a few of them are not adjacent to the Ohio River, their runoff and discharge will eventually end up there. These businesses are classified in these categories: plastics material and resin manufacturing, paint and coating manufacturing, lubricant oils and greases, a former oil refinery, and other miscellaneous products.

Figure 1. All petrochemical facilities in Beaver County, Pennsylvania

Figure 2. Map of petrochemical sites in Beaver County, Pennsylvania
Data Collection
All these facilities need to have a National Pollutant Discharge Elimination System (NPDES) permit in order to legally discharge into the water body. The permit gives facilities a discharge limit for different types of pollutants. Table 1 shows the four chemicals I focused on in this report.
I chose these chemicals because they appear on the Emergency Planning and Community Right-to-Know Act (EPCRA) Toxic Release Inventory, and are listed as hazardous under several US Code of Federal Regulations (CFR). Title 40 lists, including 40 CFR 401.15 Toxic Pollutants, 40 CFR 261.24 Toxicity Characteristic, 40 CFR 261.31 Hazardous Wastes from Non-Specific Sources, 40 CFR 261.32 Hazardous Waste from Specific Sources, and 40 CFR 261.33 Discarded Commercial Chemical Products.

Table 1. The four chemicals that are on all the hazardous waste lists and their health impact.
Among these four, carbon tetrachloride is a B2 group carcinogen, meaning it is probably carcinogenic to humans, and specifically may cause liver cancer in humans. Another chemical, trichloroethylene, can easily migrate into groundwater, and it’s the most commonly found contaminant in drinking water supplies in the country. There is increasing evidence that trichloroethylene can increase cancer risk, as experiments showed lung, kidney, testicular tumors, and lymphoma in animals. The EPA is still reclassifying this chemical as a carcinogen.
Other toxic chemicals I examined are listed in Table 2. These five chemicals—plus nitrobenzene—are the top five discharges from the petrochemical sites into the Ohio River basin by mass, so I believe it’s worthy to know their health impact on people, as well. These toxins are classified in at least one of the hazardous lists mentioned above.
In summary, they can cause eye and skin irritation, act on multiple organs, and the central nervous, reproductive, and cardiovascular systems. Other notable things from this list is that 2,5-dinitrotoluene and nickel are likely human carcinogens.

Table 2. Toxic chemicals discharged by Beaver County, Pennsylvania petrochemical facilities and their health impact.
Calculation
Table 3 presents the sum of all the chemicals of concern discharged, shown in pounds per day. The highlighted row is the Shell ethane cracker and its proposed discharge limit—which compared to the other available data is greater than almost all the other facilities combined.
It is also interesting that most of the chosen facilities did not have mass loading limits listed on their NPDES permits for the chemicals chosen. This created challenges for estimating the health impact from the discharge accurately.

Table 3. Sum of all discharge in pounds per day. The left column has all NPDES permit numbers. “N/A” means data was not found.
Demographic Data
Pennsylvania state demographic data was downloaded from the U.S Census Bureau by census tract. All demographic data are based on the 2015 — 2019 American Community Survey (ACS) five-year estimates, and was filtered by county ID [12]. For this analysis, I only selected age and sex, race, educational attainment, poverty, and health insurance. This demographic data was joined to the Beaver County census tract polygon, and was displayed using graduated colors to show any potential patterns.
Population
Beaver County total population is estimated 163,929 people. Figure 3 shows there are only a few tracts with a population greater than 6,000.

Figure 3. Beaver County, Pennsylvania’s total population distribution. Source: US Census Bureau
Age Groups
Age groups under concern are children under five, because they are more sensitive and vulnerable to the chemical discharge and their health affects [4]. Senior populations above 65 years old are also under concern, because of their weakened immune systems, limited mobility, and presence of other medical conditions [9]. Adult population (25-64 years old) distribution is also presented because adults potentially become the workforce—which could impact exposure—as well as support for or protest against petrochemical industries in Beaver County, shaping the future of the industry.

Figure 4. Senior (65 or older) Population in Beaver County, PA, by census tract. Source: US Census Bureau

Figure 5. Population of children five years or younger in Beaver County, PA, by census tract. Source: US Census Bureau
Something notable from these maps is the high percentage of seniors in Beaver County (Figure 4). The percentage of elderly in the state is 16.9 percent in 2019 [11], but in Beaver County, most of the census tracts are higher than that, and a few are even higher than 25 percent. This shows the population in Beaver County is aging. Seniors may be more vulnerable to developing sickness from exposure to pollution.
Percentage of children under five years old (Figure 5) is lower than the national number, which is around seven percent. For most census tracts, the percentage of children under five years old is lower than six percent, with a few that are between one and four percent, and a few that are between six and nine percent.
Adult population percentage is also lower than the national proportion (67 percent). Census tracts next to the river have lower adult population percentage compared to those farther away (Figure 6). Both information regarding children and adult population percentage support the finding that Beaver County has an aging population.

Figure 6. Percentage of adults (25-65 years) in each census tract. Source: US Census Bureau
Race Groups
I also mapped the distribution of Black, White, and Asian populations. Figure 7 shows Beaver County is dominated by white populations: most regions are over 90 percent white, with only a few areas below 50 percent.
For other race groups—even though there are some variations in distribution—the percentages remain low for both Black and Asian (the next highest groups), with the highest percentage of Asian being 4.1 percent (Figure 9), and most areas with no Asian populations. The highest Black population of 63.1 percent is in one census tract near Aliquippa (Figure 8). Census tracts along the river generally have higher percentages of people of color compared to other areas.

Figure 7. Percentage of white population in Beaver County, Pennsylvania, by census tract. Source: US Census Bureau

Figure 8. Percentage of Black population in Beaver County, Pennsylvania, by census tract. Source: US Census Bureau

Figure 9. Percentage of Asian population in each census tract in Beaver County, Pennsylvania. Source: US Census Bureau
Education Attainment
Figure 10 shows the percentage of the population who obtained a Bachelor’s degree or higher. The percentage of having a higher education degree in Beaver County is slightly lower than the national average (about 47 percent), with the highest regions reaching 36.4—46 percent. A few areas are below 15 percent.

Figure 10. Percent of population with a higher education degree (Bachelor’s and higher).
Health Insurance
Having health insurance is an important factor to examine, as it influences the ease of getting medical treatment when people fall ill because of pollutant discharges.
The highest percentage of the population without health insurance is 11—12 percent, which occurs in two census tracts (Figure 11). The good news is that senior populations are almost 100 percent covered with health insurance, except one census tract near Aliquippa, with six percent of seniors not covered with health insurance (Figure 12).

Figure 11. Percent of the Beaver County population without health insurance. Source: US Census Bureau

Figure 12. Percent of seniors without health insurance in Beaver County, Pennsylvania. Source: US Census Bureau
Poverty
Figure 13 shows Beaver County’s population percentage living in poverty.
In this study, poverty is defined by having an income to poverty level ratio smaller than or equal to one. An income to poverty level ratio less than one means income falls below poverty level.
The overall poverty rate of the US is 13.7 percent. While most of Beaver County is below that, there are a few tracts with a poverty rate greater than 13 percent, with the highest ranging from 37.7—46.6 percent. Poverty is a major factor contributing to environmental justice concerns, as polluting facilities are often built in low-income areas and can lead to disinvestment in a neighborhood. Furthermore, people with less financial capabilities are less likely to get proper medical care when needed, and may not be able to avoid risks of exposure.

Figure 13. Percent of poverty in each census tract in Beaver County, Pennsylvania. Source: US Census Bureau
Region Highlights
Based on these maps, there is a pattern of tracts along the banks of the Ohio and Beaver Rivers showing relatively higher percentages of seniors, people of color, people without health insurance, and households in poverty.
Industrial sites like petrochemical plants are often along the banks of rivers to access water for intakes and transporting products. Further research can focus on finding the disproportionate health burden communities along these rivers face, and how demographic factors have affected the site selection process for industrial sites.
The patterns found in this analysis support the environmental justice map of Pennsylvania created by EPA (Figure 14). Future studies can also examine whether facilities from nonchemical industries and investigate any relationships between them and the location of these communities.

Figure 14. Pennsylvania Environmental justice map by the EPA. Only the Beaver County portion is displayed here.
The long battle against fracking
In February 2021, great news came from the Delaware River Basin that fracking is now permanently banned there. It is a huge win – but also a long fight – as it took almost ten years to get to this point. When the ban was proposed in 2017, four more years passed until it became official [5].
However, here in the Ohio River Basin, the situation is very different.
The Ohio River is often referenced as one of the most polluted rivers in the US. Along with fracking, the expansion of petrochemical facilities along the river is a growing threat to the health of the river.
This section discusses the institutional, economic, and policy factors that enable the growth of the petrochemical industry, presenting challenges to the Ohio River’s protection.
Historical Aspect
States along the Ohio River, including Pennsylvania, West Virginia, and Ohio, have a long history of resource extraction — from logging in the 18th century, to coal mining and oil and gas extraction more recently [8]. This history makes the public and political leaders more familiar with polluting industries, which could make them more amenable to future industrial sites, and/or make companies seek abandoned industrial sites to build future ones.
Furthermore, newer industries may create less obvious signs of environmental devastation compared to industrial development of the past. As such, some residents may be complacent witnessing industrial sites, or believe that they are an improvement from previous polluting sites.
Economic & Job Opportunities
Petrochemical industries have always used the prospect of financial prosperity as a lobbying point.
During an interview, Kenneth Broadbent, a business manager of the Steamfitters Local 449, said: “We’re environmentalists ourselves, but you’ve got to be able to eat. The biggest thing in life is making sure your kids are having as good a life as you with a decent wage and health coverage. We’re partnering with the natural gas industry because it creates good jobs. We need all the infrastructure for this thing to grow, so we can hopefully be the next Louisiana.” [14]
However, the economic promises of the oil, gas, and petrochemical industry have not played out in reality.
In Pennsylvania—the country’s second largest producer of natural gas—the oil and gas industry has never eclipsed more than half a percent of total jobs in the state over the past decade. Many oil and gas operators are headquartered out of the state (or the country) they’re drilling in, and therefore profits go to managers and CEOs elsewhere. Also, many of the workers travel from out of state. Housing and feeding out-of-state workers may provide a temporary economic boost, but one that’s ultimately unsustainable if workers decide to leave when the work ends [15].
Policy
Governors of states along the Ohio River have shown support for the petrochemical industry and have given promises to industries for even more construction opportunities.
For example, in 2017 Governor Wolf announced that Pennsylvania can support another four major petrochemical facilities, in addition to the Shell ethane cracker [8]. Pennsylvania fracking policies also prop up the industry.
Challenges to Water Quality Improvement
This section discusses the challenges to improve the Ohio River’s quality, including enforcement, funding, and geography.
Poor Enforcement
According to Feldkamp [3], one study looked at NPDES permit data from 2011 to 2017 and found on average, 27,849 facilities were noncompliant. Among them, only 13,076 faced EPA or state enforcement action on an annual basis, which means over half of them got away with it unpunished.
Funding and Watershed Regulation
The Ohio River crosses through eight states and is governed by an interstate basin commission, the Ohio River Valley Water Sanitation Commission (ORSANCO). Enacting regulations for a river basin whose borders contradict political boundaries presents many challenges.
Relative to other river basin governance organizations, ORSANCO has less staff in the commission and receives a smaller budget for water quality management. Figure 15, which was published in the 2015 journal article, Governance, Policy, and Economics of Intergovernmental River Basin Management, shows different river basin governance and their funding. The Ohio River Basin’s funding heavily depends on federal and state backing, with no permits/fees, and a minimal amount of grants. Farther east, the Delaware River Basin has a big source of funding from permits/fees and grants, despite receiving no funding from the federal government, even though the Ohio River Basin is over ten times bigger and has twice the population of the Delaware River Basin [10].
Of note, this is an older study. The Fiscal Year 2022 budget for ORSANCO’s “total resources” is $5,963,199 [16].
Lasting Burden
Another difficulty in addressing pollution in the Ohio River is that chemicals released from industrial sites include persistent bio-accumulative toxic (PBT) chemicals that won’t be removed easily [3]. PBT chemicals can accumulate in animals and be passed up the food chain, while increasing in concentration. This means even if we stop dumping chemicals into the river now, the water quality will not immediately improve.

Figure 15. River basin compacts, their areas, population, staff, and budget. Delaware River Basin Comission is DRBC, Ohio River Valley Water Sanitation Commission is ORSANCO. Source: Governance, Policy, and Economics of Intergovernmental River Basin
The Take Away
In summary, petrochemical facilities in Beaver County are discharging many concerning chemicals that can increase cancer risk and many other health issues into the Ohio River. The Shell ethane cracker will only make things worse when it is finished.
However, many of Beaver County’s petrochemical facilities do not list mass loadings for the chemicals chosen for this study. Future research is needed to understand the health impact of the discharged chemicals and their potential transport into drinking water sources.
For the residing population, Beaver County has an overall aging population that is more vulnerable to environmental issues, and has a population with slightly less higher education attainment, which may present environmental justice and health concerns. Although the community is predominantly white, people of color cluster in certain regions, where other issues like health insurance, poverty, and education are also a concern. More research should be conducted to look at other pollution sources and these communities.
To address health concerns, we may also want to be proactive in our public health practices.
As we discussed earlier, children and seniors are more vulnerable populations, but there are no established systems to monitor their health conditions [4]. This can be crucial, because most of the chemicals are endocrine disrupting chemicals (EDCs) whose impact may not be observed in people until decades later.
The invasion of the petrochemical industry cannot be isolated from past extractive industries that have impacted the region, such as fracking.
Challenges to more sustainable development include the region’s history, the promise of economic and job opportunities, and policy difference, and the challenges to keep the Ohio River clean include poor enforcement, lack of funding and staffing, and the chemical nature of pollutants discharged into the river.
Advocates are needed for proactive public health practices and policy changes across natural gas producing states to mitigate the impact of the natural gas industry to communities.
Acknowledgements
The 2021 Environmental Health Fellowship was made possible by the Community Foundation for the Alleghenies and the Heinz Endowments.
I would like to express my great appreciation to the entire FracTracker Alliance team for help in coming up with this research topic. The idea of looking at total discharge was borrowed from the project with Earthworks.
Special thanks to Erica Jackson for all her assistance with data collection and advice on the direction of the study, and Shannon Smith for checking in with the progress and pointing me to available resources.
Feature image courtesy of FracTracker Alliance.
References & Where to Learn More
Advocates from OH, PA, WV Urge Common Approach to Shale Taxation. Multi-State Shale Research Collaborative. Retrieved Aug 20, 2021, from: http://www.multistateshale.org/three-state-severance-tax
Bayer, P., & Ovodenko, A. (2019). Many voices in the room: a national survey experiment on how framing changes views toward fracking in the United States. Energy Research & Social Science, 56, 101213.
Feldkamp, B. J. (2020, January 15). Toxic Discharge Data Shows Where Pollutants Leach into the Ohio River, but Enforcement Remains an Issue. Eye on Ohio. Retrieved July 20, 2021, from: https://www.alleghenyfront.org/we-mapped-the-toxic-wastewater-discharges-along-the-ohio-river-heres-what-we-learned/
Finkel, M. L., Hays, J., & Law, A. (2013). Modern natural gas development and harm to health: The need for proactive public health policies. International Scholarly Research Notices, 2013.
Guerrero, M. & Ong, K. (2021, February 25) Fracking Banned in the Delaware River Basin! The Natural Resource Defense Council. https://www.nrdc.org/experts/marisa-guerrero/fracking-banned-delaware-river-basin
History of Beaver County. Beaver County Pennsylvania. Retrieved August 5 2021: http://www.beavercountypa.gov/Pages/History.aspx
Huang, K. M., & Etienne, X. L. (2020). Do Exploitations of Marcellus and Utica Shale Formations Improve Regional Economy in Pennsylvania, Ohio, and West Virginia? A Synthetic Control Analysis.
Heuer, M., & Yan, S. (2017). Marcellus Shale fracking and Susquehanna River stakeholder attitudes: A five-year update. Sustainability, 9(10), 1713.
Joshzt, L. (2018, July 20) 5 Vulnerable Populations in Healthcare. The American Journal of Managed Care. Retrieved July 20, 2021, from: https://www.ajmc.com/view/5-vulnerable-populations-in-healthcare
Kauffman, G. J. (2015). Governance, policy, and economics of intergovernmental river basin management. Water Resources Management, 29(15), 5689-5712.
Share of old age population (65 years and older) in the total U.S. population from 1950 to 2050 (2020 September). Statista. Retrieved August 1, 2021, from https://www-statista-com.proxy.library.upenn.edu/statistics/457822/share-of-old-age-population-in-the-total-us-population/
TIGER/Line with Selected Demographic and Economic Data. United States Census Bureau. Retrieved July 20, 2021, from: https://www.census.gov/geographies/mapping-files/time-series/geo/tiger-data.html
U.S. EIA. Pennsylvania State Profile and Energy Estimates. 2016. Available online: www.eia.gov (accessed on 4 May 2017).
Zuidema, T. (2019, February 25) Have environmentalists lost their battle to thwart the petrochemical industry in Southwest PA? PublicSource. Retrieved August 1, 2021, from: https://www.publicsource.org/have-environmentalists-lost-their-battle-to-thwart-the-petrochemical-industry-in-southwest-pa/
O’Leary, Sean (2021, February 10) Appalachia’s Natural Gas Counties: How dreams of jobs and prosperity turned into almost nothing Ohio River Valley Institute. https://ohiorivervalleyinstitute.org/fracking-counties-economic-impact-report/
Ohio River Valley Water
Sanitation Commission (2021 May 20) https://www.orsanco.org/wp-content/uploads/2021/05/CommissionAgendaMaterialsJune21.pdf
Topics in This Article:
Join the Conversation
Stay Informed
Support Our Work
FracTracker Alliance helps communicate the risks of oil and gas and petrochemical development to advance just energy alternatives that protect public health, natural resources, and the climate.
By contributing to FracTracker, you are helping to make tangible changes, such as decreasing the number of oil and gas wells in the US, protecting the public from toxic and radioactive chemicals, and stopping petrochemical expansion into vulnerable communities.
Your donations help fund the sourcing and analysis of new data so that we can keep you informed and continually update our resources.
Please donate to FracTracker today as a way to advocate for clean water, clean air, and healthy communities.
What You Should Read Next
 https://www.fractracker.org/a5ej20sjfwe/wp-content/uploads/2025/09/Figure-1.jpg
852
1500
Shannon Smith
https://www.fractracker.org/a5ej20sjfwe/wp-content/uploads/2025/09/2025-Wordmark-Logo.png
Shannon Smith2025-09-26 10:26:462025-10-01 12:32:55LNG 101: A Guide to Liquefied Natural Gas
https://www.fractracker.org/a5ej20sjfwe/wp-content/uploads/2025/09/Figure-1.jpg
852
1500
Shannon Smith
https://www.fractracker.org/a5ej20sjfwe/wp-content/uploads/2025/09/2025-Wordmark-Logo.png
Shannon Smith2025-09-26 10:26:462025-10-01 12:32:55LNG 101: A Guide to Liquefied Natural Gas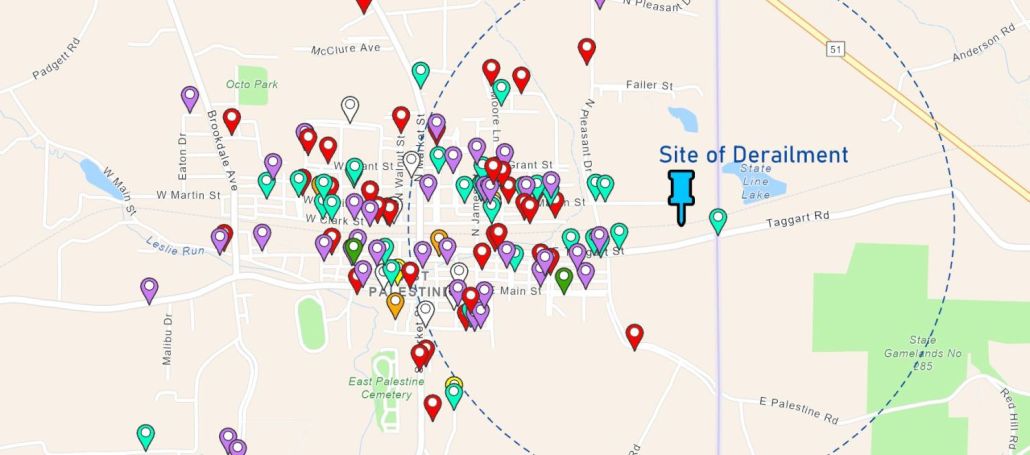 https://www.fractracker.org/a5ej20sjfwe/wp-content/uploads/2023/06/East-Palestine-Featured-Map.jpg
662
1500
Erica Jackson
https://www.fractracker.org/a5ej20sjfwe/wp-content/uploads/2025/09/2025-Wordmark-Logo.png
Erica Jackson2023-06-30 10:58:572023-06-30 10:58:57Widespread, Lingering Impacts of Norfolk Southern Warrant an Emergency Response
https://www.fractracker.org/a5ej20sjfwe/wp-content/uploads/2023/06/East-Palestine-Featured-Map.jpg
662
1500
Erica Jackson
https://www.fractracker.org/a5ej20sjfwe/wp-content/uploads/2025/09/2025-Wordmark-Logo.png
Erica Jackson2023-06-30 10:58:572023-06-30 10:58:57Widespread, Lingering Impacts of Norfolk Southern Warrant an Emergency Response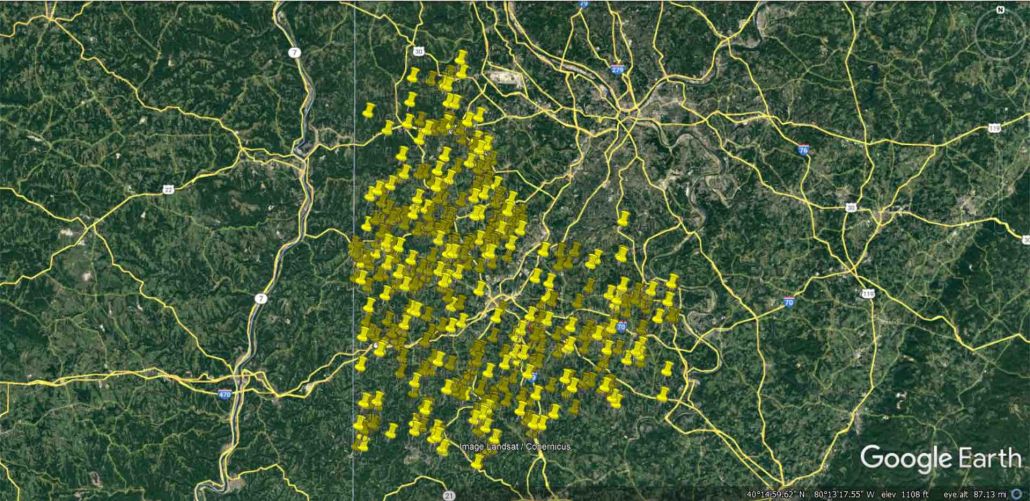 https://www.fractracker.org/a5ej20sjfwe/wp-content/uploads/2022/11/Washington-County-PA-2022-Google-Earth.jpg
933
1920
FracTracker Alliance
https://www.fractracker.org/a5ej20sjfwe/wp-content/uploads/2025/09/2025-Wordmark-Logo.png
FracTracker Alliance2022-11-04 12:55:532022-11-04 13:04:53FracTracker Receives Two Federal Grants to Support Community Air Monitoring Initiatives in the Ohio River Valley
https://www.fractracker.org/a5ej20sjfwe/wp-content/uploads/2022/11/Washington-County-PA-2022-Google-Earth.jpg
933
1920
FracTracker Alliance
https://www.fractracker.org/a5ej20sjfwe/wp-content/uploads/2025/09/2025-Wordmark-Logo.png
FracTracker Alliance2022-11-04 12:55:532022-11-04 13:04:53FracTracker Receives Two Federal Grants to Support Community Air Monitoring Initiatives in the Ohio River Valley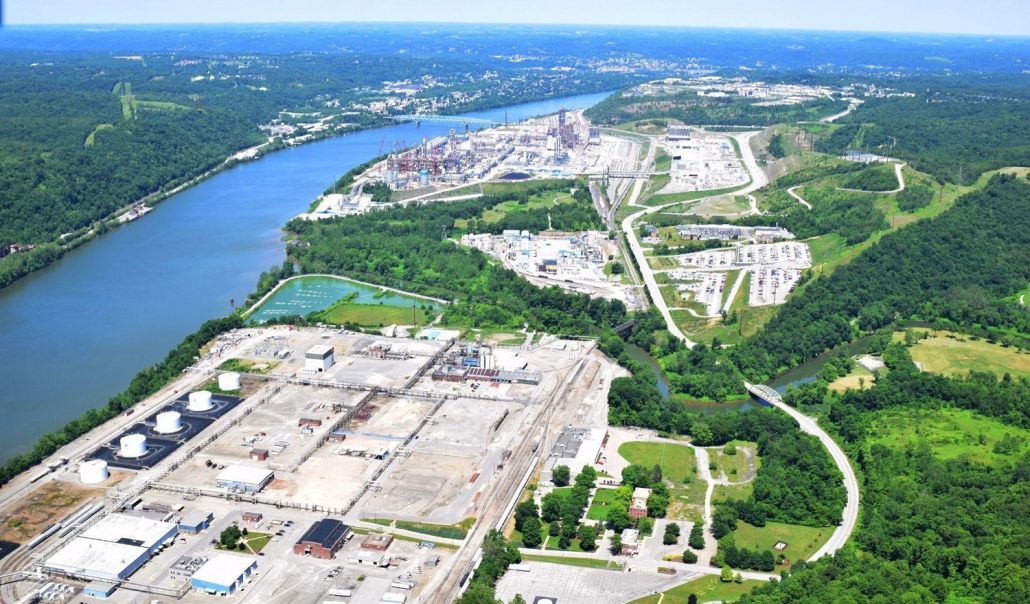 https://www.fractracker.org/a5ej20sjfwe/wp-content/uploads/2021/12/FeatImage_CNie.jpg
879
1500
Intern FracTracker
https://www.fractracker.org/a5ej20sjfwe/wp-content/uploads/2025/09/2025-Wordmark-Logo.png
Intern FracTracker2022-01-04 11:53:562022-01-24 17:51:21Upper Ohio River in Beaver County: Impact of Petrochemical Facility Discharge on the Community and What’s Behind This Long Battle
https://www.fractracker.org/a5ej20sjfwe/wp-content/uploads/2021/12/FeatImage_CNie.jpg
879
1500
Intern FracTracker
https://www.fractracker.org/a5ej20sjfwe/wp-content/uploads/2025/09/2025-Wordmark-Logo.png
Intern FracTracker2022-01-04 11:53:562022-01-24 17:51:21Upper Ohio River in Beaver County: Impact of Petrochemical Facility Discharge on the Community and What’s Behind This Long Battle https://www.fractracker.org/a5ej20sjfwe/wp-content/uploads/2021/03/Falcon-Ohio-River-Crossing-Feature-A.LauschkeLightHawk-scaled.jpg
667
1500
Erica Jackson
https://www.fractracker.org/a5ej20sjfwe/wp-content/uploads/2025/09/2025-Wordmark-Logo.png
Erica Jackson2021-03-17 08:48:432021-04-15 15:11:21Shell’s Falcon Pipeline Under Investigation for Serious Public Safety Threats
https://www.fractracker.org/a5ej20sjfwe/wp-content/uploads/2021/03/Falcon-Ohio-River-Crossing-Feature-A.LauschkeLightHawk-scaled.jpg
667
1500
Erica Jackson
https://www.fractracker.org/a5ej20sjfwe/wp-content/uploads/2025/09/2025-Wordmark-Logo.png
Erica Jackson2021-03-17 08:48:432021-04-15 15:11:21Shell’s Falcon Pipeline Under Investigation for Serious Public Safety Threats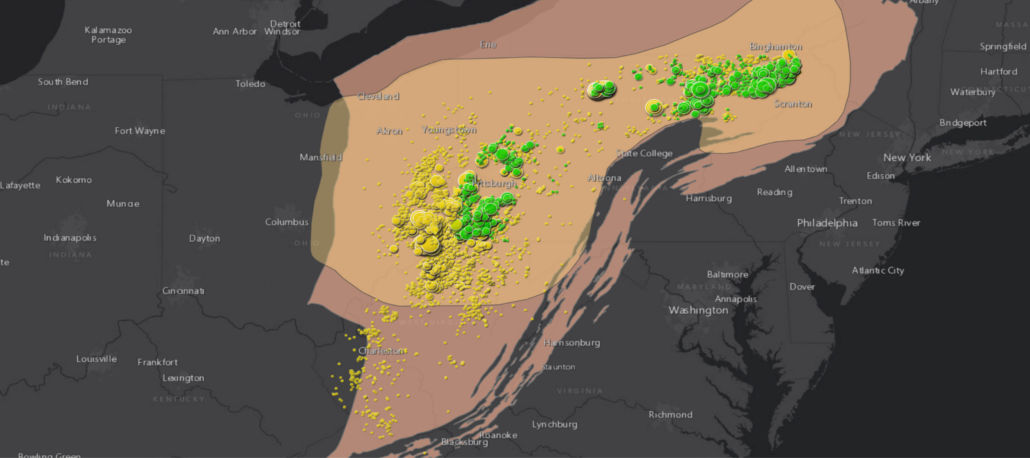 https://www.fractracker.org/a5ej20sjfwe/wp-content/uploads/2021/01/Utica-and-Marcellus-shale-plays-feature-scaled.jpg
667
1500
Erica Jackson
https://www.fractracker.org/a5ej20sjfwe/wp-content/uploads/2025/09/2025-Wordmark-Logo.png
Erica Jackson2021-01-15 17:36:502021-04-16 19:46:43Fracking Waste in the Appalachian Basin – A Story Map
https://www.fractracker.org/a5ej20sjfwe/wp-content/uploads/2021/01/Utica-and-Marcellus-shale-plays-feature-scaled.jpg
667
1500
Erica Jackson
https://www.fractracker.org/a5ej20sjfwe/wp-content/uploads/2025/09/2025-Wordmark-Logo.png
Erica Jackson2021-01-15 17:36:502021-04-16 19:46:43Fracking Waste in the Appalachian Basin – A Story Map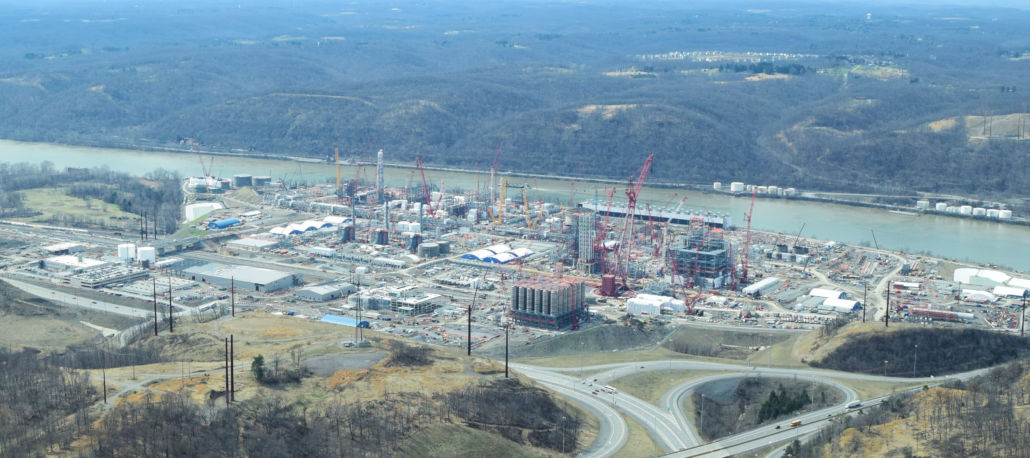 https://www.fractracker.org/a5ej20sjfwe/wp-content/uploads/2019/07/Beaver-Cracker-Plant-Feature-scaled.jpg
667
1500
Erica Jackson
https://www.fractracker.org/a5ej20sjfwe/wp-content/uploads/2025/09/2025-Wordmark-Logo.png
Erica Jackson2019-07-10 09:33:552022-02-15 10:54:51Mapping the Petrochemical Build-Out Along the Ohio River
https://www.fractracker.org/a5ej20sjfwe/wp-content/uploads/2019/07/Beaver-Cracker-Plant-Feature-scaled.jpg
667
1500
Erica Jackson
https://www.fractracker.org/a5ej20sjfwe/wp-content/uploads/2025/09/2025-Wordmark-Logo.png
Erica Jackson2019-07-10 09:33:552022-02-15 10:54:51Mapping the Petrochemical Build-Out Along the Ohio River![]()
216 Franklin St, Suite 400, Johnstown, PA 15901
Phone: +1 (717) 303-0403 | info@fractracker.org
FracTracker Alliance is a 501(c)3 non-profit: Tax identification number: 80-0844297