Proposed Tire Fire Plant in Greenwood Twp., Crawford County, PA

In the fall of 2010 Crawford Renewable Energy, LLC (CRE) announced plans to build a “tire-fired” power plant in Greenwood Township of Crawford County. The facility is designed to produce 100 MW of energy by burning used, recycled tires in two circulating fluidized bed (CFB) boiler systems. The design of the facility includes several pollutant emission control technologies. These types of equipment remove a portion of the pollutants from the exhaust. As nice as it is to think of tires simply “disappearing” rather than being land-filled, when any hydrocarbon fuel source is burned, such as a tire or coal, a multitude of toxic and carcinogenic compounds are released. And most of these pollutants cannot be captured using control technologies, so they are emitted into the air.

The facility is planned on an 80 acre industrial park land parcel. The control equipment includes a CFB scrubber, a fabric filter baghouse, and a regenerative catalytic reactor. The flue gasses will then be emitted through a 325 foot tall stack. A CFB scrubber uses limestone to decrease sulfur emissions. The regenerative catalytic reactor is used to reduce NOX. The fabric filter baghouse is a series of screens and filters that remove the majority of the mass of particulate matter. The majority of the mass of particulate emissions are removed by capturing the coarse fraction of particles, which are particles with larger diameters and mass, but do not pose a significant health threat. Baghouses and other particulate control devices (PCDs) are not as efficient at capturing the fine and ultrafine fraction of particulate emissions, which have smaller diameters. The fine and ultrafine modes of particulates are the most hazardous, and are directly related to asthma exacerbation, chronic obstructive pulmonary disorder (COPD) and other forms of respiratory disease.

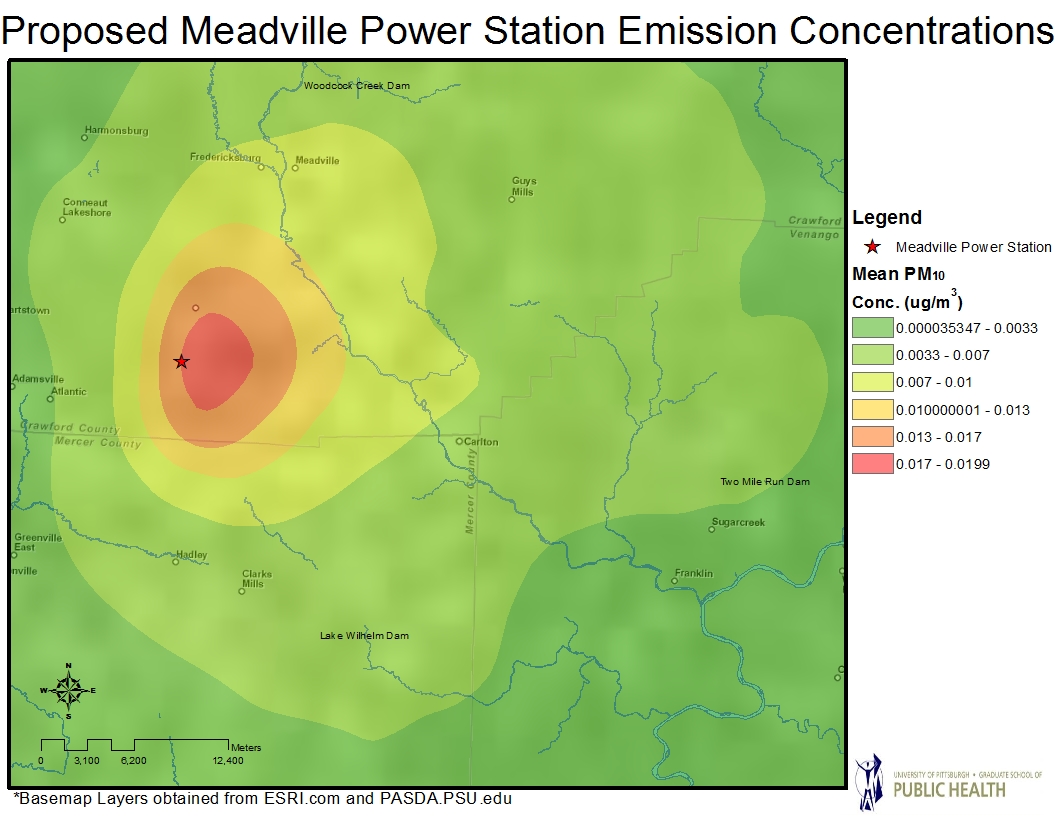
The emissions and deposition pattern from this facility were modeled by the Center for Healthy Environments and Communities to assess the impact on local air quality. Several pollutant species were modeled, including sulfur dioxide (SO2), oxides of nitrogen (NOx), and both the course and the fine fractions of particulate matter, PM10 and PM2.5 respectively. Concentrations of these pollutants at ground level in ambient air were modeled using the CalPUFF non-steady state dispersion model. These will not be the only pollutants transported, rather these are efficient to model. Plumes of some of the other contaminants will most likely have similar patterns.

The mean, or average, levels of predicted ambient air concentrations are presented first for each pollutant (Figures 1, 3, 5, and 7). These maps show the average concentrations of the pollutant that are predicted to occur while the facility is operating. The concentrations are averaged over a one year period. Next, peak day concentrations of pollutants are presented (Figures 2, 4, 6, and 8). These concentrations are the highest predicted concentrations for a single day that would occur when the facility is operating normally, over the one year modeled cycle. The concentrations shown in all of the maps are only attributable to the proposed facility, and do not include any other sources of pollution or background concentrations of pollutants. These values essentially show the increases in ambient air pollutants that will occur when the proposed facility is operating.

For this 80 acre industrial park, a square “fence-line” with 570 meter sides could surround the park. Typically, exposures are expected to be very limited within the fence-line because the area is inaccessible to the public. Concern is focused on the exposures that may occur beyond the limit of the fence-line. If the smokestack is assumed to be located at the center of the park, it would be at a distance approximately 235 meters from the fence-line. Using the scales on the maps, it is evident that the even the highest concentration gradients shown in the maps would occur beyond the fence-line. When the facility is operating, it is reasonable for the surrounding communities to expect exposures to even the highest concentration gradients shown in the maps.

Figure 1.  Mean values of modeled SO2 ambient air concentrations at ground level, attributable to emissions from the proposed CRE plant.
Figure 2.  Peak day values of modeled SO2 ambient air concentrations at ground level, attributable to emissions from the proposed CRE plant.
Figure 3.  Mean values of modeled NOX ambient air concentrations at ground level, attributable to emissions from the proposed CRE plant.
Figure 4.  Peak day values of modeled NOX ambient air concentrations at ground level, attributable to emissions from the proposed CRE plant.
Figure 5.  Mean values of modeled PM10 ambient air concentrations at ground level, attributable to emissions from the proposed CRE plant.
Figure 6.  Peak day values of modeled PM10 ambient air concentrations at ground level, attributable to emissions from the proposed CRE plant.
Figure 7.  Mean values of modeled PM2.5 ambient air concentrations at ground level, attributable to emissions from the proposed CRE plant.
Figure 8.  Peak day values of modeled PM2.5 ambient air concentrations at ground level, attributable to emissions from the proposed CRE plant.

Volz Senate Hearing Committee Testimony and Presentation

Conrad Dan Volz, DrPH, MPH was asked by Senator Cardin to testify today before the Senate Committee on Environment and Public Works and its Subcommittee on Water and Wildlife, Joint Hearing on “Natural Gas Drilling, Public Health and Environmental Impacts.”

You can watch the proceedings on C-SPAN or view Dr. Volz’s Testimony and PowerPoint. Below is an excerpt from his testimony:

My testimony today will cover three critical public health and environmental policy areas related to unconventional natural gas production:

First is the unregulated siting of natural gas wells in areas of high population density,and near schools and critical infrastructure. Unconventional gas extraction wells arehighly industrialized operations that have public health preparedness risks of catastrophicblowout, explosion and fire. Any of these incidents can create an Immediately Dangerousto Life and Health (IDLH) condition for adults or children in close physical proximity.The unregulated siting of unconventional natural gas extraction wells and productionfacilities in residential neighborhoods and near critical infrastructure is unwisepreparedness policy, especially in light of federal and state efforts to reduce risk fromterror attacks on USA citizens and critical infrastructure.

Secondly, the higher rates and differential patterns of oil and gas act violations fromMarcellus Shale gas extraction operations, as compared to conventional oil and gas wells,suggests a much greater impact to drinking water and aquatic resources. Marcellus Shalegas extraction wells have between 1.5 to 4 times more violations than their conventionalwell counterparts per offending well, including more serious violations and violationsthat have a direct impact on water quality and aquatic resources. Marcellus Shale gasextraction wells are more likely to have violations for:

  • Failures to minimize accelerated erosion, implement erosion and sedimentation plans, and/or maintain erosion and sedimentation controls.
  • Discharge of pollution to waters of the Commonwealth of Pennsylvania.
  • General violations of the Clean Streams Law.
  • Failure to properly store, transport, process or dispose of a residual waste and -Failures to adequately construct or maintain impoundments holding gas extractionflowback fluids containing toxic contaminants.

The third problem public health and environmental policy area to be addressed is thedisposal of gas extraction flowback fluids, carrying a plethora of toxic elements andchemicals, in inefficient “brine” treatment facilities and Publicly Owned TreatmentWorks (POTW’s) [commonly called sewage treatment plants], which dischargeeffluent into surface water sources. Studies of the effluent from a commercial facilityin Pennsylvania that treats fluids only from gas and oil operations shows discharge of 9pollutants in excess of nationally recognized human and/or aquatic health standards into anearby stream.

Full Testimony  |  PowerPoint

Bucknell MSI Publications Database

Archived

This page has been archived. It is provided for historical reference only.

The Bucknell University Marcellus Shale Initiative (MSI) announces a new educational resource: the MSI Publications Database, a web-based clearinghouse that references and summarizes primarily print-based publications on the Marcellus Shale natural gas extraction and related topics.

The Marcellus Shale, a geologic formation containing natural gas spanning NY, PA, WV, OH, and VA, is undergoing rapid development as a major US energy source. The use of horizontal drilling and hydraulic fracturing to release the gas qualifies the extraction to be termed “unconventional.” The Bucknell University MSI, directed by Carl S. Kirby, Professor of Geology, was created in 2010 to support Marcellus Shale-related research in the physical sciences, social sciences and humanities at Bucknell.

The MSI Publications Database covers primarily print-based publications as these are the most reputable sources of information to date. The database contains links to publications as well as short summaries of each publication. The database also explains the differences among publication types and how to access and retrieve copyrighted publications. As the database grows, it will also include more references to publications that are not directly related to the Marcellus Shale; such publications might feature other unconventional gas extraction such as the Barnett Shale, hydraulic fracturing, potential health issues, or address socioeconomic changes in energy boom towns.

The MSI Publications Database is intended to serve the public as well as regulators, industry, citizens’ groups and academics who want to know more about the background and potential impact of the development of this resource. The Initiative is dedicated to updating the database as rapidly as resources allow. This database does not provide coverage of websites, blogs, news articles, newsletters, or other media. Partners in this effort include the Forum for Pennsylvania’s Heartland, the Degenstein Foundation, and Geisinger Center for Health Research.

The MSI is the fourth and newest initiative of the BUEC. The MSI will also facilitate teaching and additional public outreach efforts. Because an avalanche of information is reaching the public through the web and other media, the MSI also has a long-term plan to critically evaluate this information. This effort is currently in development.

A Look at Horizontal Well Production in Virginia

Horizontal gas wells in Virginia in 2008 to 2009. Note that they are all clustered in the extreme western portion of the Commonwealth.

According to the Virginia Department of Mines, Minerals, and Energy’s (DMME) Division of Gas and Oil, there are 30 horizontal gas wells that produced gas between January 2008 and December 2009 (1). While this is not a large number of horizontal wells, the dataset is interesting, since Virginia publishes monthly production data online.

Of the 30 wells, only nine were in production for at least 12 of the 24 months that I looked at. This is, admittedly, a small sample size, but is as good an entry point as any into the discussion of how gas production changes over time.


Chart 1: Production in Thousands of Cubic Feet (Mcf) of Horizontal Gas Wells in Virginia, with at least 12 months of production between 2008 to 2009.

Many of the wells in this analysis have a spike in production within the first few months of production, followed by a gradual decline.


Chart 2: Maximum, Minimum, and Mean Production of Horizontal Gas Wells in Virginia, with at least 12 months of production between 2008 to 2009.

For wells with at least 12 months of production, the mean production value tends to be closer to the minimum value than the maximum. This is particularly true for those wells which show a significant spike in production, such as VH-520008.


Chart 3: Ratio of Most Recent Monthly Production to Peak Monthly Production of Horizontal Gas Wells in Virginia, with at least 12 months of production between 2008 to 2009.


Ratio of December 2009 production to each well’s maximum monthly production for all horizontal gas wells. Please click the gray compass rose and double carat (^) to hide those menus. Click the “i” tool then any map feature for more information.

For these nine horizontal gas wells in Virginia, the average production of the most recent month (December 2009) is slightly less than 30 percent of the peak monthly production. This figure is skewed on the one side by a well with a tremendous production spike (VH-530008, 6.93%) and on the other by a well with low but relatively steady production (VH-536927, 42.75%). When all wells are considered (as with the map) the range of values is much greater.

Each of these wells had been in production between 12 and 24 months as of December 2009, and none of them produced even half as much gas in that month as the month for their respective maximum production values. The complete production data is available on FracTracker’s DataTool.

  1. The most recent production data currently available is for January 2010, one month after the end of this analysis.

Abandoned Well Suspected in McKean County Explosion

The Pennsylvania Department of Environmental Protection (DEP) thinks this February 28, 2011 gas explosion might have been caused by one of three abandoned gas wells in the vicinity. Photo by Jay Braddish

Luckily, Thomas Federspiel of Bradford Township in McKean County Pennsylvania was outside of his home when it suddenly exploded on February 28, 2011. He was able to rescue his dogs, too, but his house didn’t fare as well, taking an estimated $250,000 in damages, according to the Erie Times-News.

This fire, combined with a similar incident on December 12, 2010 have gotten the attention of U.S. Senator Bob Casey, who urged federal input into the investigation, which he suspected might be due to recent gas drilling operations:

While investigations are ongoing, the initial determinations are that these harrowing incidents were not caused by any gas utility issue. Rather, it appears that the gas may have migrated from deep underground during periods of high barometric pressure coupled with seismic activity and extensive new deep drilling activities.

The DEP recently suggested that the issue might be related to abandoned wells in the area, rather than new gas drilling activities. Three nearby uncapped abandoned wells were discovered, all of which are at least 90 years old. The well that the DEP considers to be a suspect in the February explosion, Rogers 9, was drilled in 1881.

Wells are considered to be abandoned if they have been out of production for twelve months.

Dr. Volz presented potential impacts of shale gas extraction at EPA hearings

As part of the U.S. EPA’s investigation into the safety of hydraulic fracturing, a process used to extract natural gas from underground, CHEC’s director Conrad Dan Volz, DrPH, MPH presented at the U.S. EPA’s Hydraulic Fracturing Study Technical Workshop 3, Fate and Transport on March 28 and 29, 2011. Extended Abstract | Presentation

New Collaboration with Pitt’s Journal of Environmental and Public Health Law

Archived

This article has been archived and is provided for reference purposes only.

FracTracker is proud to announce an exciting collaboration with the University of Pittsburgh’s Journal of Environmental and Public Health Law. PJEPHL is the nation’s leading academic journal covering the convergence of environmental and public health legal issues. Its staff is made up of hard working students from the University of Pittsburgh, along with several University faculty advisors.

Check back soon for updates or read the most recent articles by the PJEPHL in 2011.

Contact information: Journal of Environmental and Public Health Law University of PittsburghSchool of Law, 3900 Forbes Avenue,
Pittsburgh, PA 15260

Chemical and Biological Risk Assessment for Natural Gas Extraction in New York

By Ronald E. Bishop, Ph.D., CHO

Over the last decade, operators in the natural gas industry have developed highly sophisticated methods and materials for the exploration and production of methane from unconventional reservoirs. In spite of the technological advances made to date, these activities pose significant chemical and biological hazards to human health and ecosystem stability.

If future impacts may be inferred from recent historical performance, then:

  • Approximately two percent of shale gas well projects in New York will pollute local ground-water over the short term. Serious regulatory violations will occur at more than one of every ten new shale gas projects.
  • More than one of every six shale gas wells will leak fluids to surrounding rocks and to the surface over the next century.
  • Each gas well pad, with its associated access road and pipeline, will generate a sediment discharge of approximately eight tons per year. If not sequestered from local waterways, these sediments will further threaten federally endangered mollusks and other aquatic organisms.
  • Construction of access roads and pipelines will fragment field and forest habitats, further threatening plants and animals which are already species of concern.
  • Some chemicals in ubiquitous use for shale gas exploration and production, or consistently present in process wastes, constitute human health and environmental hazards when present at extremely low concentrations. Potential exposure effects for humans include poisoning of susceptible tissues, endocrine disruption syndromes, and elevated risks for certain cancers.
  • Exposures of gas field workers and neighbors to toxic chemicals and noxious bacteria are exacerbated by certain common practices, such as air/foam-lubricated drilling and the use of impoundments for flowback fluids. These methods, along with the intensive use of diesel-fueled equipment, will degrade air quality and may cause a recently described “down-winder’s syndrome” in humans, livestock and crops.
  • State officials have not effectively managed oil and gas exploration and production in New York, evidenced by thousands of undocumented or improperly abandoned wells and numerous incidents of soil and water contamination. Human health impacts from these incidents may include abnormally high death rates from glandular and reproductive system cancers in men and women. Improved regulations and enhanced enforcement may reasonably be anticipated to produce more industry penalties, but not necessarily better industry practices, than were seen in the past.

Overall, proceeding with any new projects to extract methane from unconventional reservoirs by current practices in New York State is highly likely to degrade air, surface water and ground-water quality, to harm humans, and to negatively impact aquatic and forest ecosystems. Mitigation measures can partially reduce, but not eliminate, the anticipated harm.

View/Download Full Report


Ronald E. Bishop, Ph.D., CHO
Chemistry & Biochemistry Department
State University of New York, College at Oneonta
Sustainable Otsego

Pennsylvania 2010 Oil and Gas Violation on FT’s DataTool

2010 Oil and Gas Violations per Drilled Well (small)
All oil and gas violations issued by the PA DEP in 2010, divided by the number of wells drilled in the same time frame, by county. Please click the map for a larger, dynamic view.

Two new violation datasets are up on FracTracker’s DataTool: 2010 Oil and Gas Violations in PA and 2010 Violations by County. The first set includes the raw data from the Pennsylvania Department of Environmental Protection (DEP)(1), and the second set includes violation and other oil and gas data at the county level.

Well Violation Data


See the legend for description of well type. Please click the gray tabs with the compass rose and the double carat (^) to hide those menus. for information on specific wells, click the “i” tool then any map feature.

There are a number of problems with this dataset. Altogether, there were 3,273 violations, but the total number of unique wells that represents is not known, because 271 of the violations didn’t even have a valid well API number associated with it. Since this data does not contain longitude, latitude, well type, or any indicators as to whether the violating wells were Marcellus Shale wells or horizontally drilled, none of this information can be known about these 271 violations.


2010 Oil and Gas Violations: Marcellus Shale, Other Formations, and Unknown Wells

In fact, of the remaining 3,011 violations, 665 are from wells where the API number do not match a compilation of over 40,000 permits from 1998 to 2010 which has been published on the DEP website. It’s a pity, since the rate of violations per offending well is lower than either of the other category then we must say that this value for both Marcellus Shale and non Marcellus Shale wells are overstated. We just don’t know by how much.


Violations per offending well type, January 2007 to September 2010

However, in a previous analysis over a 40 month period (including a nine month overlap with this data), the number of violations per offending wells were fairly comparable to the 2010 data. In the older dataset, offending Marcellus Shale wells were likely to have 1.47 times as many violations as their non Marcellus counterparts, and in the current data, that number is 1.44.

The most frequent violations are as follows:


Most frequently cited oil and gas violations in 2010 (2)

Here are the five wells which were issued the most citations in 2010:


Wells with most violations issued by the PA DEP in 2010

County Level Violation Data

The 2010 Violations by County dataset linked to above contains a wealth of county level oil and gas data for Pennsylvania. Also included are the number of drilled wells in 2010, July 2010 to December 2010 Marcellus Shale production data (3), as well as ratios of violations to both categories.

2010 Marcellus Shale Violations per Drilled Well (large)
2010 Marcellus Shale (MS) violations per 2010 MS well drilled. Please click the image for a dynamic view.

2010 Violations per Non Marcellus Shale Well (large)
2010 non MS violations per 2010 non MS drilled well. Please click the image for a dynamic view.

To my mind, it is notable that Washington and Green Counties in Southwestern Pennsylvania both have relatively few violations per well, despite the fact that they are both in the top five counties in terms of Marcellus Shale production.

Speaking of production, let’s take a look at that. While violations per well can give you an idea of what to expect for any new well in a geographic area, production from the Marcellus Shale is uneven. Some may argue that industry violations are more permissible in areas that yield more gas. Whether that argument holds water for you or not, violation per production amount is still a useful cost-benefit tool.

2010 MS Violations per Bcf of Gas Produced (large)
2010 MS violations per billion cubic feet (Bcf) produced by the MS between July 2010 and December 2010. Counties with at least 5 Bcf of production in that period are outlined in red. Please click the image for a dynamic view.

As was the case in Utah, a pattern is emerging where the most violations come from areas where drilling is relatively less well established or productive. None of the seven counties with at least 5 Bcf produced (outlined in red) are near the top of the violations per Bcf map.

  1. The dataset required heavy formatting to be transformed into a usable file. If you look at the original data linked above, you will note that there are boxes, in which values listed at the top apply to all boxes in that range. There are Excel tricks to allow for automatically filling these boxes, yet those could lead to significant error. There are instances where the box ends, but the spaces below are blank as well. My interpretation of this is that that values outside of the box are intended to be blank. It would be preferable if the DEP output filled in all of these cells appropriately, not only saving time, but reducing the chance for errors, and removing viewer interpretation as a factor in the dataset.
  2. The large number of “Failure to plug a well upon abandonment” for the “Unknown Formation” category may suggest that most of these wells are non Marcellus Shale, as many of those wells are older and more likely to be abandoned. In retrospect, I might have gotten more well number matches if I had used the PASDA list, which includes wells older than 1998, and last I checked, has over 120,000 wells in their database. PASDA data includes location, but no indication of whether the wells are Marcellus Shale or horizontally drilled.
  3. Unfortunately, there is no way to separate out Marcellus Shale production for the first half of the year, the data for which had been formatted to reflect a July to June fiscal year. Also, as of this writing, no production data for non Marcellus Shale wells for any part of 2010 is available.

Sam Malone awarded Duquesne’s "Emerging Leaders’ Extraction and Environment" travel grant

Note

This page has been archived.

Samantha Malone, MPH, CPH, communications specialist for CHEC and doctoral student at GSPH, is a recipient of a travel grant from Duquesne University to participate in their Emerging Leaders’ Extraction and Environment (E-LEEP) program. E-LEEP will take approximately 22 people from across the United States to Accra, Ghana this summer. There they will examine the effects of extractive industries on populations, economics, and the environment and share their experiences from working on similar issues in the U.S. For the last two years, CHEC and Sam have researched the potential environmental and public health impacts of natural gas drilling in the Marcellus Shale region and helped to develop FracTracker.org. E-LEEP enables concerned professionals to share their global perspectives on local issues – an absolutely priceless experience. As part of this initiative, Sam will be blogging regularly during her trip. Check back soon for field photographs and updates.

Read more from Sam’s perspective.