This page has been archived. It is provided for historical reference only.
By: C. D. Volz, DrPH, MPH
John Dawes of the Environmental Integrity Project put up a very useful dataset onto FracTracker’s DataTool showing the geographical location of congressional districts. I have visualized this dataset along with locations of violations of the PA Oil and Gas Act across the state. One can get further information on each congressional district and the violations in them by clicking on the “i” button and then on the map to see details. Some of these violations are especially serious and include brine and wastewater entering the surface waters of the Commonwealth of Pennsylvania. These pollution events can certainly have an effect on downstream municipal water sources-individually and collectively.
https://www.fractracker.org/a5ej20sjfwe/wp-content/uploads/2025/09/2025-Wordmark-Logo.png00Guest Authorhttps://www.fractracker.org/a5ej20sjfwe/wp-content/uploads/2025/09/2025-Wordmark-Logo.pngGuest Author2010-11-17 12:55:002020-07-21 10:36:22FracTracker Visualizes Violations of the Pennsylvania Oil and Gas Act by Congressional District
This page has been archived. It is provided for historical reference only.
By Samantha Malone, MPH, CPH – Communications Specialist, Center for Healthy Environments & Communities (CHEC) of the University of Pittsburgh Graduate School of Public Health (GSPH), & DrPH Student, GSPH
During the final days of the APHA Conference and my trip to Colorado, I spent a lot of time working on the University of Pittsburgh Graduate School of Public Health’s (GSPH) upcoming conference on the potential public health effects of shale gas extraction (registration has closed).
I also spent time learning more about how people in CO and surrounding states view shale gas drilling, especially the perspectives of public health professionals attending the conference.
Interestingly, my conversations and observations revealed something entirely different than I expected. A “Blue Bear” in the window, you could say (photo left). The conference attendees I spoke with did not seem nearly as concerned as many people I converse with here within the Marcellus Shale play. Perhaps this is because shale gas drilling (in the form we are seeing in the Marcellus right now) started earlier in the western and southwestern states, and the shale plays are much smaller in other parts of the country. (Don’t worry. I openly acknowledge that I have a bit of a sampling bias in assessing how often Marcellus concerns crop up during conversation around me. Try sitting at my family’s Thanksgiving dinner table with me.)
Being as unbiased as I could, it seemed that local professionals in Colorado view shale gas drilling as a “necessary evil.” They figure, if it is going to happen, they should know the most intimate details. As a result, some of the researchers and groups in those portions of the U.S. are actively involving industry in their research and outreach efforts. Perhaps this is an approach Marcellus-based organizations should take. I wonder how often it is already occurring in our region, and I would love your feedback about this inquiry.
As a I said, some researchers are working with gas drilling companies to address their academic research needs. Below is a quick summary of a presentation by Roxana Witter, MD, MSPH that utilized industry and community input. I won’t go into the dirty details because Dr. Witter, Jim Rada, and John Adgate, PhD will be presenting the entire results of their work at GSPH’s conference this Friday. You can read the abstract of Dr. Witter’s APHA presentation here: Use of Health Impact Assessment (HIA) to Help Inform Decision Making Regarding Natural Gas Drilling Permits in Colorado.
Battlement Mesa Health Impact Assessment
In a study by Roxana Witter, MD, MSPH; Jim Rada, BS, REHS; Kaylan Stinson, MSPH; Kenneth Scott, MPH; John Adgate, PhD; and Lee Newman, MD, MA (don’t you just love all of those credentials?) – a health impact assessment was conducted in Battlement Mesa, Garfield County, CO. During the APHA conference, Dr. Witter reported that the study area previously experienced what is called a “boom and bust” of natural gas drilling. In case you are interested, the tendency for this industry to follow a “boom and bust” cycle is discussed in the following article: “Energy Boomtowns & Natural Gas” PDF. Recent interest by a drilling company triggered the request of an HIA to help guide land use decision making.
In 2005, Jim Rada began conducting ambient (outside) air monitoring for particulates and other contaminants. At this time, Rada educated citizens and also encouraged dialogues between the industry and citizens. The formal health assessment began in 2009. In addition to their own epidemiological (health-by-numbers) investigations, the researchers held stakeholder meetings with citizens, state agencies, and industry to gather their input and perspectives. The researchers were able to release a draft of the HIA in September 2010, where it was open for public comment until recently (this week, I believe). Look for the final HIA soon. Essentially, the draft HIA shows that quality of health was not significantly affected, but the community felt some impacts:
Increase in violent crimes
Chlamydia cases doubled (a sexually transmitted bacterial infection)
School enrollment increased
The researchers also conducted a Health Risk Assessment to identify potential problems down the road. They looked a eight (8) major areas of concern based on the stakeholder meetings: air quality, water quality, traffic, noise, economic conditions, social conditions, health infrastructure, and accidents/malfunction.
Of those, the researchers identified four key areas of concern based on available data (shown in descending order below) that pose the highest risk of producing negative health impacts:
Air quality
Traffic
Water quality
Community wellness (defined by looking at “crime rates, mental health, substance abuse and suicide, occurrence of sexually transmitted infection, and enrollment in K-12 education”)
Like I said, Dr. Witter and her colleagues will go into more detail about this on Friday. I would hate to be a complete spoiler. Just in case you missed the cutoff for registration for that conference, no fear, the video of the conference will be posted on this blog and on the conference website.
And finally, I discussed some of my impressions about CO and a lot about FracTracker’s DataTool (now archived) during an interview on Penn State’s Sustainability Now radio show. It aired live on Friday, November 11th from 4-5 pm (while I was visiting Breckenridge) on The Lion 90.7 fm.
Third blog post out of three. Read the first and second.
https://www.fractracker.org/a5ej20sjfwe/wp-content/uploads/2025/09/2025-Wordmark-Logo.png00FracTracker Alliancehttps://www.fractracker.org/a5ej20sjfwe/wp-content/uploads/2025/09/2025-Wordmark-Logo.pngFracTracker Alliance2010-11-16 22:21:002020-07-21 10:36:21Denver, CO – Final Days of the APHA Conference
This page has been archived. It is provided for historical reference only.
Recent well site and pit north of Evans City, Butler County, PA. Click the image for a dynamic view.
[image removed]
Sometimes, you get a bit lucky. While helping a user find data about drilling operations in Butler County, I noticed that while there are relatively few Marcellus Shale gas wells in the county, activity has picked up dramatically there in 2010. Prompted by these factors, I decided to try to find visual evidence of drilling operations using our DataTool. I found this recent pair of wells and brine pit.
Closeup of wells. Both wells were issued permits on 12-16-09.
Using the information tool (the white “i” in the blue circle), we can find out some information about these wells. Their unique API numbers are 019-21657 and 019-21658, both were drilled by Rex Energy, and the permits for both were approved on December 16, 2009. Having the API number, we can look on our other datasets to find that one of them was drilled on February 8, 2010, and the other one was spudded twelve days later. Both of these wells are on the production dataset, although apparently, neither of them had produced anything as of the June 30th cutoff date for that report.
Closeup of brine pit. Note the trees for scale.
It is possible to zoom in even further. If you follow the link that says, “Click to see more details on this map”, it will take you to our DataTool. From there, you can zoom in with the zoom bar at the bottom left, and then even more with the wheel of your mouse.
https://www.fractracker.org/a5ej20sjfwe/wp-content/uploads/2025/09/2025-Wordmark-Logo.png00Matt Kelso, BAhttps://www.fractracker.org/a5ej20sjfwe/wp-content/uploads/2025/09/2025-Wordmark-Logo.pngMatt Kelso, BA2010-11-16 18:03:002020-07-21 10:36:02Satellite Image of Well Found with FracTracker’s DataTool
This page has been archived. It is provided for historical reference only.
Marcellus Shale Gas Production by County. Please click the map for more information and a dynamic view. [map removed]
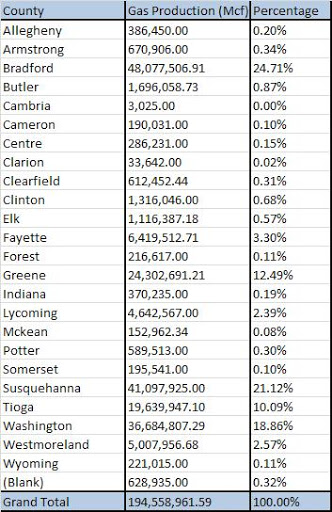
Pennsylvania released preliminary production information for Marcellus Shale gas wells in September, but the updated data that the Department of Environmental Protection (DEP) posted earlier this month is superior in several ways. First of all, it is more complete than the preliminary list, as one quarter of the operators actually missed the reporting deadline. In addition, the columns of data are no longer jumbled together, and units of measure have been provided. With all of these improvements, it is time for another look at the numbers.
Between July 1, 2009 and June 30, 2010, Marcellus Shale wells in Pennsylvania produced almost 195 billion cubic feet (Bcf) of natural gas. That sounds like a huge number, but Pennsylvania consumed at least 756 Bcf in 2009 according to the US Energy Information Administration. That means that the Marcellus Shale gas boom in the state accounts for only about of 28% of our own usage.
Geographic Distribution
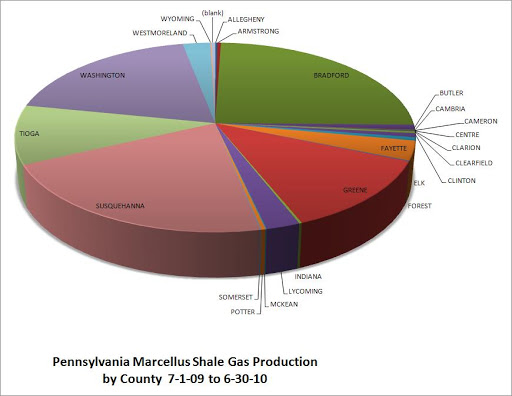
Marcellus Shale Gas Production in Pennsylvania by County, July 1, 2009 through June 30, 2010
Marcellus Shale Gas Production in Pennsylvania by County, July 1, 2009 through June 30, 2010
The two counties with the highest natural gas production levels are Bradford and Susquehanna, both in the northeastern quadrant of the state. The next highest producers are Washington and Greene Counties, located in the southwest. These four counties account for 77% of all Marcellus Shale production in the state.
Production by Drilling Operator
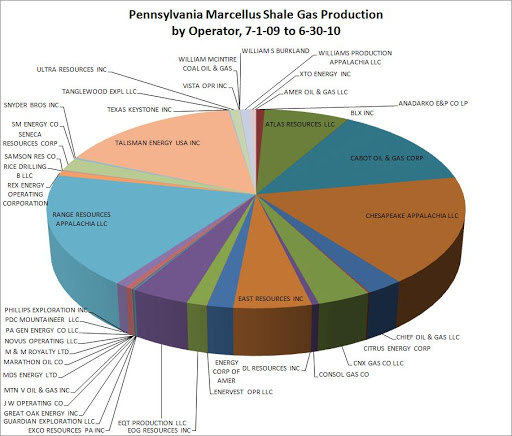
Marcellus Shale Gas Production in Pennsylvania by Drilling Operator, July 1, 2009 through June 30, 2010
Marcellus Shale Gas Production in Pennsylvania by Drilling Operator, July 1, 2009 through June 30, 2010
There are 44 drilling operators listed on the report. Four of these–Cabot,Chesapeake, Range Resources, and Talisman–account for over 65% of the production.
https://www.fractracker.org/a5ej20sjfwe/wp-content/uploads/2025/09/2025-Wordmark-Logo.png00Matt Kelso, BAhttps://www.fractracker.org/a5ej20sjfwe/wp-content/uploads/2025/09/2025-Wordmark-Logo.pngMatt Kelso, BA2010-11-15 13:37:002020-07-21 10:36:02Updated Pennsylvania Marcellus Shale Production Information
This page has been archived. It is provided for historical reference only.
By Samantha Malone, MPH, CPH – Communications Specialist, CHEC & DrPH Student, University of Pittsburgh Graduate School of Public Health (GSPH); & Drew Michanowicz, MPH, CPH – GIS Specialist, CHEC & DrPH Student, GSPH
Aquaculture and public health: Implications for food systems and the environment
On Monday morning, Drew and I attended a session on ‘aquaculture’ at the APHA conference to learn more about United States’ reliance upon aquaculture (seafood farming) and the environmental public health concerns associate with it. No, natural gas drilling was never mentioned. Our reason for attending this session was to learn more about the advantages vs. disadvantages of consuming farmed fish so that we can be responsible AND healthy consumers. This session had three speakers, and although they all did a great job, my hands-down favorite presentation was the one by Casson Trenor, MA – “Fish, forks, and the future: How a global environmental organization is working to improve the relationship between seafood markets, consumer demand, and the health of our oceans.” During his presentation, Trenor, of Greenpeace, strongly communicated the need to consider the sustainability of our seafood choices as consumers. One was was to avoid eating farmed salmon.
More importantly, however, Trenor’s presentation highlighted another multi-disciplinary problem; different fields often do not communicate very well with one another. A previous speaker during the same session encouraged eating farmed salmon because of the health benefits of the Omega-3 fatty acids and the low amounts of mercury found in farmed salmon. The problem with this, according to Trenor, is that raising farmed salmon can be very unsustainable. Public health says, “Eat more seafood, because it is good for you.” Unfortunately, we are consuming seafood at rates much too high to continue to meet the demand down the road. What Trenor suggested was that environmental and public health organizations need to develop collaborative messages that advise people on the best practices from both fields. Eating fish that are lower on the tropic level (lower on the food chain), such as sardines for example, would be the best of both worlds; raising sardines does not require as many resources as farmed salmon (good for the environment, which is good for everyone), and they are high in Omega-3 fatty acids and low in mercury (good for your health).
Correspondingly, people seeking information about natural gas drilling often experience conflicting messages, as well. Residents and policy-makers want to know the risks vs. the benefits of drilling, but where should they look? I feel this is a major concern to properly protecting health, the environment, and the economy. — Public health strives to prevent negative health impacts as a result of the drilling by looking at the risks, but this might mean suggesting that drilling should not occur at all. Engineers attempts to develop the most effective technologies, and yet they do not always focus on technologies that reduce pollution. Environmental groups are concerned with the conservation and protection of their environment, but may dismiss the economic benefits that leasing mineral rights could have for private citizens. Industry works to maximize profitability and efficiency, potentially overlooking environmental and public health impacts, and yet they also need to reduce the occupational risks to their employees. What is the balanced answer? Is there even a “right” answer? For people considering leasing their mineral rights or those involved in policy making, I suggest looking at collaborative tools, such as FracTracker’s DataTool (link archived), your departments of environmental protection, and talking with your municipality about how drilling is being dealt with on a local level.
Emergency Preparedness and Older Adults
On Monday afternoon I was able to attend a great session about the various public health preparedness needs of aging communities. One of the presentations assessed whether the needs of people with chronic diseases are properly addressed during natural disasters. (How long could you go without your blood pressure medicine if there was a major flood in your state?) The main reason I attended this session, however, was to hear a talk by Sharon Larson, PhD of the Geisinger Center for Health Research about “An examination of an aging community when natural gas drilling comes to town.”
Dr. Larson conducted a rural health needs assessment in an Eastern PA community recently and was presenting the results of her study. To summarize her presentation, rates of poverty and elderly populations are higher in rural areas. In the community that she assessed, residents held very little social capital, must drive 55 miles to the nearest hospital, lost jobs due to the decline of the logging industry, and were experiencing a very high suicide rate. Residents wanted to know why. To her surprise, Dr. Larson’s health needs assessment found that one of the biggest concerns that this community had was that of Marcellus Shale natural gas drilling.
“Why?”, you might ask. The people who took part in this study certainly place a high value on the quality of their natural resources, yes, but more importantly, it is an aging community. The youngest EMS volunteer is 65 years old. This presents a significant public health concern in the event of a gas drilling accident. The EMS volunteers did not feel that they were adequately prepared to deal with a major incident. For any industry members who happen to read this post, I advise you to contact Dr. Larson to coordinate community EMS trainings and perhaps provide additional EMS personnel for the community, if possible. —
Second blog post in a series of three. Read the first one. Check back soon for number three.
https://www.fractracker.org/a5ej20sjfwe/wp-content/uploads/2025/09/2025-Wordmark-Logo.png00FracTracker Alliancehttps://www.fractracker.org/a5ej20sjfwe/wp-content/uploads/2025/09/2025-Wordmark-Logo.pngFracTracker Alliance2010-11-13 16:29:002020-07-21 10:36:01Denver, CO – Day 3 of the APHA Conference
This page has been archived. It is provided for historical reference only.
Analysis by Offending Versus Drilled Wells
This map shows Marcellus Shale and other oil and gas violations issued between 1-1-2007 and 9-30-2010. [map removed]
In a recent post, I examined the relationship between different types of wells in Pennsylvania and the number of violations per offending well. This post expands on that theme by examining the number of violations per wells drilled, and addresses a number of complications that are associated with that analysis.
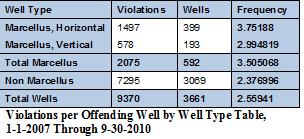
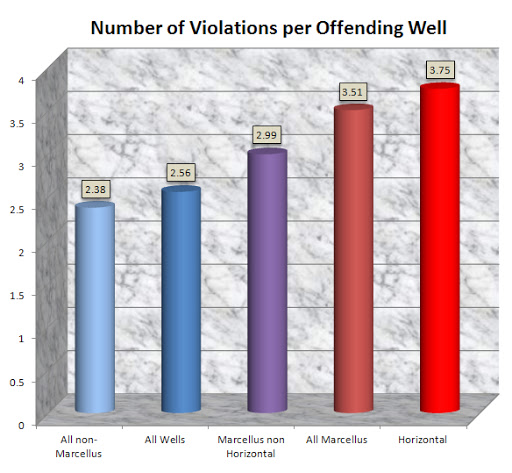
This graph shows the mean number of violations per well type in Pennsylvania. This is based on a list of 9,370 violations provided by the PA DEP from 1-1-2007 through 9-30-2010. Please note that this reflects only wells where violations occurred, not every well of this type within Pennsylvania.
This chart shows that of all the offending wells, Marcellus Shale wells clearly have more violations per well than their conventional counterparts, and that among the Marcellus wells, those that were drilled horizontally have more violations associated with them than vertical wells do.
I focused on offending wells rather than total wells for two reasons. First, all of the data that I needed to do this analysis was complete from one source except for which wells were flagged as horizontal, which I obtained from permit information on the Department of Environmental Protection (DEP) website. On the other hand, I do not have any sort of estimate for the total number of wells drilled in the state. PASDA maintains a list of DEP data which contains at least 123,000 oil and gas locations, but there is no indication which of these have been drilled. The DEP maintains a list of drilled wells since 1998 on their website, but that omits well over a century of hydrocarbon production.
My second reason for focusing on offending wells was that I thought the values for the “All non-Marcellus” and “All Wells” categories would be bloated by their antiquity. After all, commercial oil wells have been in the state since 1859, while DEP data shows that the earliest Marcellus Shale well was spudded on March 6, 2006, and drilling began on the earliest horizontal well on February 12, 2008.
Even though the violations that I was considering were all issued after January 1, 2007, I had some reason to suspect a data skew of this sort: abandoned wells. The DEP violation list indicated 1,111 violations where the drilling operator failed to plug a well, all but five of which were not Marcellus Shale wells. This category alone accounts for nearly 12% of the total violations, and is almost certainly dominated by wells that were drilled long before the start date of the violation dataset.
Drilled Well Analysis
Keeping these factors in mind, I still wanted to take a look at how many violations per drilled well there were in the various categories, so I compared the violations data to the list of wells since 1998 mentioned above.
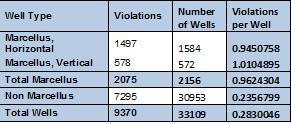
Number of Violations by Well Type for wells drilled between 1-1-1998 and 10-21-2010. All violations are from 1-1-2007 through 9-30-2010.
Number of Violations by Well Type for wells drilled between 1-1-1998 and 10-21-2010. All violations are from 1-1-2007 through 9-30-2010.
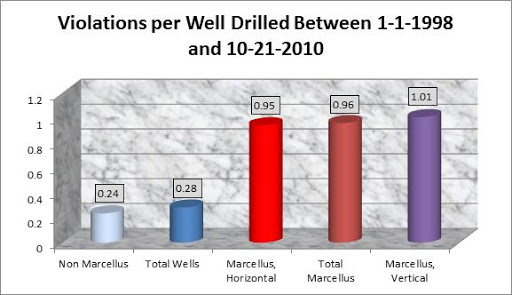
Obviously, my prediction of bloated values for non-Marcellus Shale wells is not supported by these numbers, with more than four times as many violations per drilled Marcellus Shale well than its conventional counterpart. Still, I am uncomfortable with this presentation of the data, due to the fact that it includes eight more years of traditional wells than Marcellus Shale wells. It does allow for the likelihood that older wells were included in the violation list, but perhaps overly so.
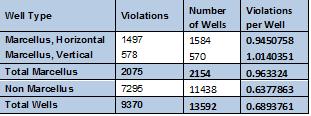
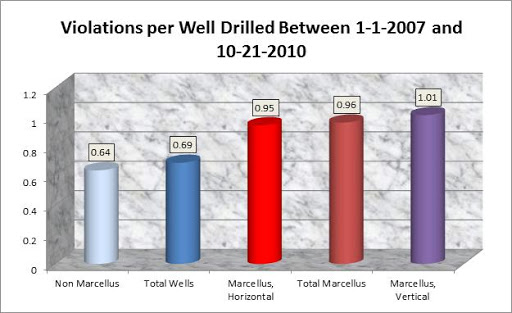
Number of Violations by Well Type for wells drilled between 1-1-2007 and 10-21-2010. All violations are from 1-1-2007 through 9-30-2010.
Number of Violations by Well Type for wells drilled between 1-1-2007 and 10-21-2010. All violations are from 1-1-2007 through 9-30-2010.
These are the numbers that are most affected by the large abandoned well data skew, and still Marcellus Shale wells are 1.5 times more likely to have a violation than their more conventional counterparts. All of the values for Marcellus Shale wells are nearly identical to the set from 1998 onward, because all but two of those wells are in both datasets. I consider the two datasets to be bookends for non-Marcellus Shale wells and total wells, since the data is skewed by time in different ways. Marcellus Shale wells are therefore somewhere between 1.5 and 4 times more likely to have violations than all other wells in the Commonwealth.
Horizontal Wells
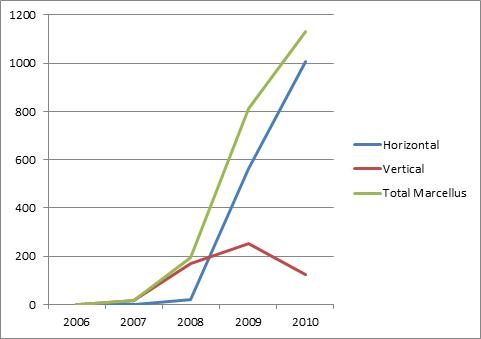
Marcellus Shale Wells by Type and Year, 2006 through 2010
But what about horizontal wells? When we considered violations per offending well, they had 0.76 more violations per well than vertical Marcellus Shale wells, but when compared to the total number of wells of those types, vertical wells actually had slightly more violations than horizontal wells. Why is this?
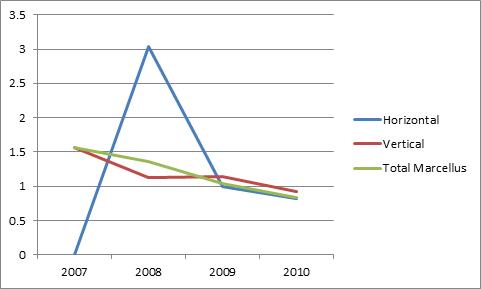
Marcellus Shale Violations per Drilled Well, 2007 through 2010
The 2008 spike in horizontal violations per drilled well is based on a very small sample size, and does not account for the difference that we are looking for. The opposing trends of the rapid expansion of horizontal wells and the steady erosion of the number of violations per well drilled certainly does, however. Most of the vertical wells were drilled when there were more violations per well, and most of the horizontal wells were drilled when there were fewer.
All of this begs the question: Why are there so many fewer violations per well than there were three years ago? Is it because the industry is more in compliance with the regulations, or that the DEP is not equipped to monitor the rapidly expanding industry? Are we getting the same level of environmental protection from the Commonwealth as we did in 2007? These questions should be a part of the policy discussion as Pennsylvania continues to understand the effects of Marcellus Shale drilling operations.
https://www.fractracker.org/a5ej20sjfwe/wp-content/uploads/2025/09/2025-Wordmark-Logo.png00Matt Kelso, BAhttps://www.fractracker.org/a5ej20sjfwe/wp-content/uploads/2025/09/2025-Wordmark-Logo.pngMatt Kelso, BA2010-11-10 17:46:002020-07-21 10:36:01PA Data Shows Marcellus Wells 1.5 to 4 Times More Likely to Have Violations
This page has been archived. It is provided for historical reference only.
Click on the map for a dynamic view and for more information.
[map removed]
I have posted updates of West Virginia’s Marcellus Shale permit and well data onto our FracTracker DataTool. The information was downloaded from the West Virginia Department of Environmental Protection (DEP) Office of Oil and Gas website.
I searched the DEP website for Marcellus Shale wells and found 1,463 different locations. When I looked at the at permit data, I got almost 12,000 records for 1,464 Marcellus Shale distinct wells. It seems difficult to believe that all but one permitted well has already been drilled, and a closer look at the data shows that really can’t be the case.
[image removed] In this dataset, there are 1,338 Marcellus Shale permits issued (green), 21 permits canceled (red), and 39 permit applications returned (yellow).
Of those permit records, only 1,338 are listed as having the permit issued. Unlike the Pennsylvania well list which includes only spuded wells, it seems that the West Virginia DEP thinks of the well list as a summary of the permit list, rather than a list of sites that have actually been drilled. In addition, West Virginia does not include the spud date on their oil and gas well data. Instead, they use the date for the last permit that was received for the well, which in no way indicates whether drilling activity has commenced.
I have contacted the West Virginia DEP for clarification on this point, and will share their response as a comment on this space.
https://www.fractracker.org/a5ej20sjfwe/wp-content/uploads/2025/09/2025-Wordmark-Logo.png00Matt Kelso, BAhttps://www.fractracker.org/a5ej20sjfwe/wp-content/uploads/2025/09/2025-Wordmark-Logo.pngMatt Kelso, BA2010-11-09 11:11:002020-07-21 10:36:01Updated West Virginia Marcellus Shale datasets on our DataTool
This page has been archived. It is provided for historical reference only.
By Samantha Malone, MPH, CPH – Communications Specialist, CHEC & DrPH Student, University of Pittsburgh Graduate School of Public Health (GSPH); and Drew Michanowicz, MPH, CPH – GIS Specialist, CHEC & DrPH Student, GSPH
My coworker, Drew Michanowicz, and I landed in Denver, Colorado on Saturday morning in preparation for the 2010 American Public Health Association Conference. CHEC sent us to this meeting of over 12,000 public health professionals in order to learn more about the impacts of natural gas drilling in shale formations where it has been occurring longer than in the Marcellus Shale, to ascertain how FracTracker’s blog and DataTool can be improved upon, and to get a general feeling on the perspectives that people concerned with prevention have about the gas drilling.
Days one and two in Denver involved getting oriented with our surroundings, and attending a few meetings, including a very interesting one for the Union of Concerned Scientists.
On Saturday, Drew’s friend who lives in Denver gave us a quick tour of the city. Downtown appears to have been built on a grid, something I wish Pittsburgh could have done to make it easier to navigate! Aside from the residents’ sincere interest in skiing, buffalo, and tiaras apparently, here are some interesting facts…
The streets are wide, and we saw tons of people walking the streets. (The unseasonably warm weather certainly didn’t hurt.) Denver has some of the healthiest residents in the U.S., probably due to their incredible system for public transit and biking. Denver sits at the foothills of the Rockies and has some of the most beautiful sunrises (picture left) I have ever seen. Additionally, the residents of Denver seem laid-back and appreciative of the natural resources they have at their close disposal.
Another fact that many people probably don’t know about Colorado: shale gas drilling is quite prevalent here, with over 27,000 wells drilled state-wide. (PA has about 1/20th the amount of drilled wells in the Marcellus Shale so far.) Despite the passion that Colorado residents seem to have for their natural environment, natural gas drilling occurred quite prevalently here.
What does this tell us about the future of drilling in the much larger Marcellus Shale play (which underlies most of PA)? See the snapshot below to view all of the shale gas plays in the continental U.S.
[map archived]
https://www.fractracker.org/a5ej20sjfwe/wp-content/uploads/2025/09/2025-Wordmark-Logo.png00FracTracker Alliancehttps://www.fractracker.org/a5ej20sjfwe/wp-content/uploads/2025/09/2025-Wordmark-Logo.pngFracTracker Alliance2010-11-08 21:23:002020-07-21 10:36:01Denver, CO – Days 1 and 2 of the APHA Conference
This page has been archived. It is provided for historical reference only.
Ozone is Produced by Reactions of Organic Compounds Released During Marcellus Shale Gas Extraction Activities with Sunlight and Oxides of Nitrogen
By: Conrad Dan Volz, DrPH, MPH – CHEC Director and Principal Investigator
Story Inspired by FracTracker work of Kathleen Tyner
I was searching over new snapshots on the FracTracker database and noticed one done by Kathleen Tyner. Her snapshot (below) shows Marcellus Wells drilled in West Virginia overlaid with locations of ozone monitoring devices placed by WV DEP personnel for monitoring this criteria air pollutant under the Clean Air Act.
[image removed]
Analysis of this snapshot reveals only 6 monitoring locations within the vast geographic area of West Virginia where Marcellus Shale gas extraction operations exist.
West Virginia is characterized by some of the highest elevation peaks and ridges in the Appalachian range, an area where weather inversions can be frequent and can hold air pollutants in valley areas for days if not weeks. If ozone and other air contaminants are trapped in these valleys, over time concentrations of these pollutants can build up without being cleared by prevailing winds. Without proper placement of ozone monitors (and other types of monitors for other criteria pollutants generated) in these characteristic areas no one will be able to pickup ozone concentrations in air. Ozone is formed by the reaction of organic chemicals volatilized into air from Marcellus Shale gas extraction activities, including:
drilling,
diesel exhaust [truck traffic and running compressors],
wastewater impoundments,
condenser stations,
pipeline leaks,
cryogenic plants,
compressor stations,
mercaptan injection stations,
chemical plants – existing oxides of nitrogen from coal powered electrical generation facilities and other industrial operations (see the figure below), and
sunlight.
Additionally, over large geographic areas of the state there are very few ozone monitors shown which could pick up ground level ozone as it is advectively transported by wind over large areas of the state.
Ozone is a criteria air pollutant that has been associated with a variety of health problems, including:
airway irritation,
coughing,
pain when taking a deep breath,
wheezing and breathing difficulties during exercise or outdoor activities,
inflammation, which is much like a sunburn on the skin,
aggravation of asthma,
increased susceptibility to respiratory illnesses like pneumonia and bronchitis, and
permanent lung damage with repeated exposures.
Given the importance of ozone to human health outcomes and its ability to also affect plants, it is vital to understand ozone concentrations and exposure over space and time.
West Virginia’s Environmental Policies
The State of West Virginia needs to reevaluate its environmental policies in light of the explosion of activity in the Marcellus gas fields. Significant funding should be provided to state environmental enforcement agencies to perform research into:
Where ozone effects might be pronounced due to topographic variation;
Understanding where ozone monitors should be placed to be able to predict ozone exposure reliably for each sub-regions populations (especially children); and
Determining the number of additional ozone air monitoring stations for proper statistical analysis and spatial modeling.
Additionally, the placement of Marcellus Shale wells is ongoing and accelerating. Since over the next 25 years it is reasonable to assume that there could be up to 100,000 Marcellus shale wells in West Virginia – as well as additional associated infrastructure including stripping and refining stations, compressor stations and pipelines – the State of West Virginia needs to set aside significant funding to ensure that ozone monitoring is ongoing. This funding should also ensure that data generated are analyzed and communicated to the public using proper and accurate risk communication language with numerous outlets so all citizens are informed of this air hazard regularly. Finally, since the Marcellus Shale gas industry will be moving throughout the state over time – developing wells and infrastructure as needed -any state program needs to have enough flexibility to move with the industry. Better yet, the state should require planning documents from industry. This can allow it to predict where the industry will move next so that baseline, pre-extraction air levels of ozone and other air contaminants generated in this process can be compared to the levels generated post-production
Locations of NOx Sources in the States of West Virginia, Ohio, Maryland, and Pennsylvania by Tonnage. NOx is a precursor contaminant that can react with organic compounds volatilized from Marcellus Shale gas extraction activities to produce ozone. Note large sources of NOx as you move down the Ohio and West Virginia border, in Northern West Virginia, and on the Pennsylvania border.
https://www.fractracker.org/a5ej20sjfwe/wp-content/uploads/2025/09/2025-Wordmark-Logo.png00Guest Authorhttps://www.fractracker.org/a5ej20sjfwe/wp-content/uploads/2025/09/2025-Wordmark-Logo.pngGuest Author2010-11-07 15:22:002020-07-21 10:36:01Revise West Virginia Environmental Policy to Properly Characterize Ozone Air Pollution
This page has been archived. It is provided for historical reference only.
Recognizing the need for government and industry-related drilling data to be more transparent, the Pennsylvania Department of Environmental Protection (PA DEP) has added new resources to their oil and gas website for data related to natural gas drilling compliance and production. As the press release says, this is the first time that all of this information is available online from the PA DEP.
See the map below for an updated view of the number and location of Marcellus well violations based on data provided by the PA DEP. You can zoom in using the magnifying glass button in the gray toolbar to inspect an area more closely. Or you can click on the “i” in the toolbar and then on a point on the map to inspect an individual record:
[image removed]
While we applaud the PA DEP’s efforts to improve the accessibility of drilling information online, the new section still has some HTML quirks and can be difficult to find when trying to navigate there from the DEP’s homepage. The Center for Healthy Environments has been in discussion with various citizens, media personnel, regulatory agencies, and academic institutions about the possibility of using FracTracker’s DataTool to aid in improving data transparency. We strongly believe that data transparency leads to better-informed decision making and fear reduction; FracTracker can provide an easy-to-use, online, user-generated platform to present data and associated information about drilling in shale formations.
If you would like to know more about how FracTracker works, just check out this page and keep your eyes peeled for an online tutorial coming soon, as well.
https://www.fractracker.org/a5ej20sjfwe/wp-content/uploads/2025/09/2025-Wordmark-Logo.png00FracTracker Alliancehttps://www.fractracker.org/a5ej20sjfwe/wp-content/uploads/2025/09/2025-Wordmark-Logo.pngFracTracker Alliance2010-11-05 12:31:002020-07-21 10:36:01Improved PA DEP Drilling Data Transparency