The Science Behind OK’s Man-made Earthquakes, Part 1

By Ariel Conn, Seismologist and Science Writer with the Virginia Tech Department of Geosciences

On April 21, the Oklahoma Geological Survey issued a statement claiming that the sharp rise in Oklahoma earthquakes — from only a couple per year to thousands — was most likely caused by wastewater disposal wells associated with major oil and gas plays. This is huge news after years of Oklahoma scientists hesitating to place blame on an industry that provides so many jobs.

Now, seismologists from around the country — including Oklahoma — are convinced that these earthquakes are the result of human activity, also known as induced or triggered seismicity. Yet many people, especially those in the oil industry, still refute such an argument. Just what is the science that has seismologists so convinced that the earthquakes are induced and not natural?

Hidden Faults

Over the last billion years (give or take a couple hundred million), colliding tectonic plates have created earthquake zones, just as we see today in California, Japan, Chile and Nepal. As geologic processes occurred, these zones shifted and moved and were covered up, and the faults that once triggered earthquakes achieved a state of equilibrium deep in the basement rocks of the earth’s crust. But the faults still exist. If the delicate balance that keeps these fault systems stable ever shifts, the ancient faults can still move, resulting in earthquakes. Because these inactive faults are so deep, and because they can theoretically exist just about anywhere, they’re incredibly difficult to map or predict – until an earthquake occurs.

Thanks to historic reports of earthquakes in the central and eastern United States, we know there are some regions, far away from tectonic plate boundaries, that occasionally experience large earthquakes. Missouri and South Carolina, for example, suffered significant and damaging earthquakes in the last 200 hundred years, yet these states lie nowhere near a plate boundary. We know that fault zones exist in these locations, but we have no way of knowing about dormant faults in regions of the country that haven’t experienced earthquakes in the last couple hundred years.

What is induced seismicity?

As early as the 1930s, seismologists began to suspect that extremely large volumes of water could impact seismic activity, even in those regions where earthquakes weren’t thought to occur. Scientists found that after certain reservoirs were built and filled with water, earthquake swarms often followed. This didn’t happen everywhere, and when it did, the earthquakes were rarely large enough to be damaging. These quakes were large enough to be felt, however, and they represented early instances of human activity triggering earthquakes.[1]

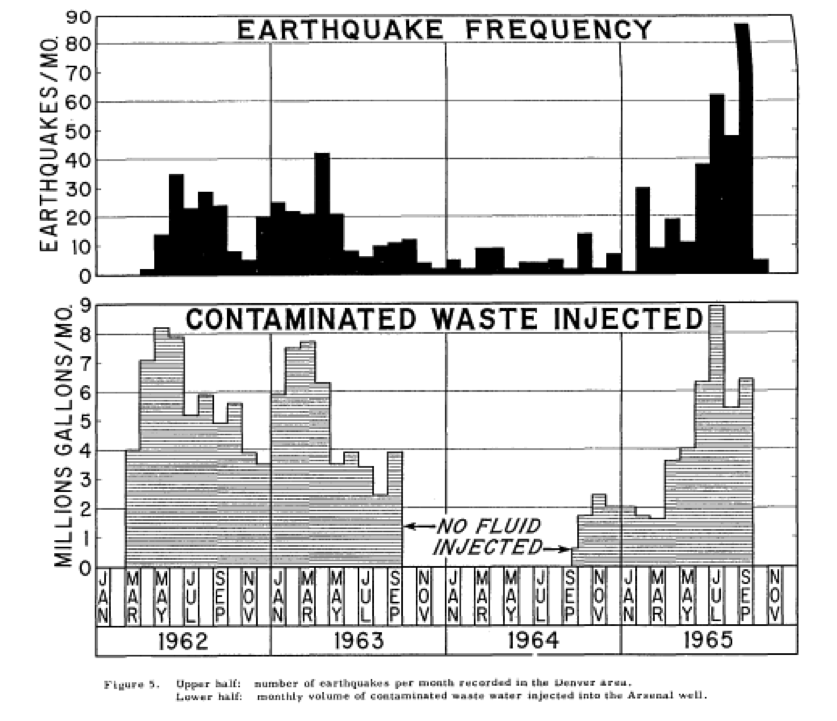
Research into induced seismicity really picked up in the 1960s. The most famous example of man-made earthquakes occurred as a result of injection well activity at the Rocky Mountain Arsenal. The arsenal began injecting wastewater into a disposal well 12,000 feet deep in March of 1962, and by April of that year, people were feeling earthquakes. Researchers at the arsenal tracked the injections and the earthquakes. They found that each time the arsenal injected large volumes of water (between 2 and 8 million gallons per month, or 47,000 to 190,000 barrels), earthquakes would start shaking the ground within a matter of weeks (Figure 1).
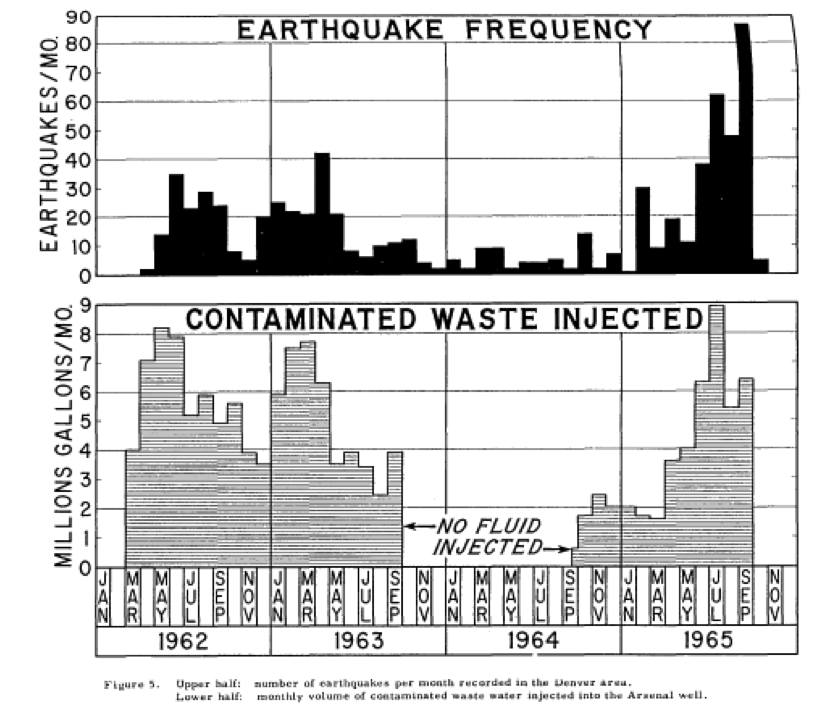
Rocky Mountain Arsenal fluid injection correlated to earthquake frequency

Figure 1. Rocky Mountain Arsenal fluid injection correlated to earthquake frequency

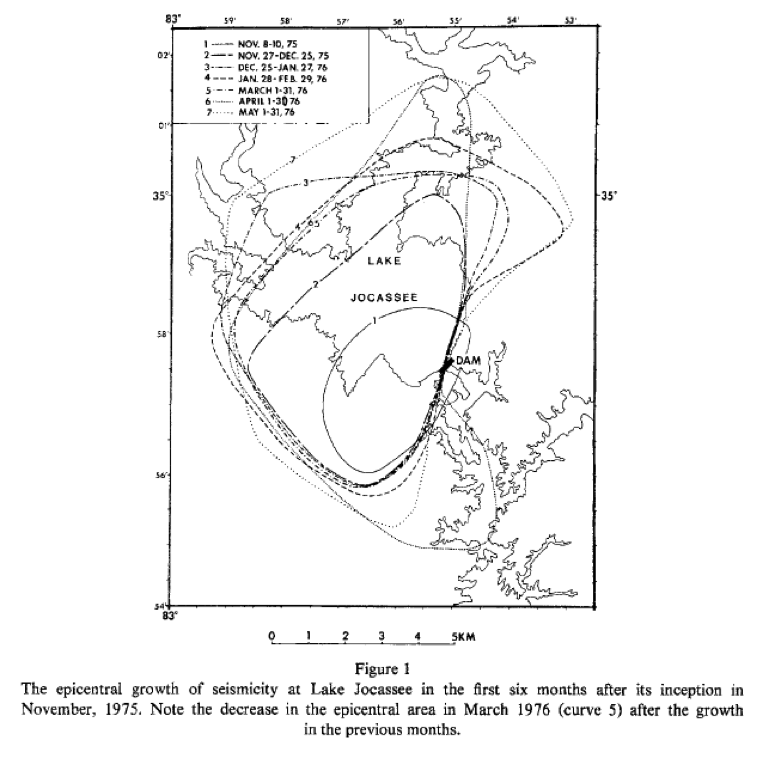
South Carolina experienced induced earthquakes after filling a reservoir

Figure 2. South Carolina experienced induced earthquakes after filling a reservoir

When the injections ended, the earthquakes also ceased, usually after a similar time delay, but some seismicity continued for a while. The well was active for many years, and the largest earthquake thought to be induced by the injection well actually occurred nearly a year and a half after injection officially ended. That earthquake registered as a magnitude 5.3. Scientists also noticed that over time, the earthquakes moved farther and farther away from the well.

Research at a reservoir in South Carolina produced similar results; large volumes of water triggered earthquake swarms that spread farther from the reservoir with time (Figure 2).

When people say we’ve known for decades that human activity can trigger earthquakes, this is the research they’re talking about.

Why now? Why Oklahoma?

Class II Injection Well. Photo by Lea Harper

Injection Well in Ohio. Photo by Ted Auch

Seismologists have known conclusively and for quite a while that wastewater injection wells can trigger earthquakes, yet people have also successfully injected wastewater into tens of thousands of wells across the country for decades without triggering any earthquakes. So why now? And why in Oklahoma?

The short answers are:

  • At no point in history have we injected this much water this deep into the ground, and
  • It’s not just happening in Oklahoma.

One further point to clarify: General consensus among seismologists is that most of these earthquakes are triggered by wastewater disposal wells and not by hydrofracking (or fracking) wells. That may be a point to be contested in a future article, but for now, the largest induced earthquakes we’ve seen have been associated with wastewater disposal wells and not fracking. This distinction is important when considering high-pressure versus high-volume wells. A clear connection between high-pressure wells and earthquakes has not been satisfactorily demonstrated in our research at the Virginia Tech Seismological Observatory (VTSO) (nor have we seen it demonstrated elsewhere, yet). High-volume wastewater disposal wells, on the other hand, have been connected to earthquakes.

At the VTSO, we looked at about 8,000 disposal wells in Oklahoma that we suspected might be connected to induced seismicity. Of those, over 7,200 had maximum allowed injection rates of less than 10,000 barrels per month, which means the volume is low enough that they’re unlikely to trigger earthquakes. Of the remaining 800 wells, only 300 had maximum allowed injection rates of over 40,000 barrels per month — and up to millions of barrels per year for some wells. These maximum rates are on par with the injection rates seen at the Rocky Mountain Arsenal, and our own plots indicate a correlation between high-volume injection wells and earthquakes (Figure 3-4).

Triangles represent wastewater injection wells scaled to reflect maximum volume rates. Wells with high volumes are located near earthquakes.
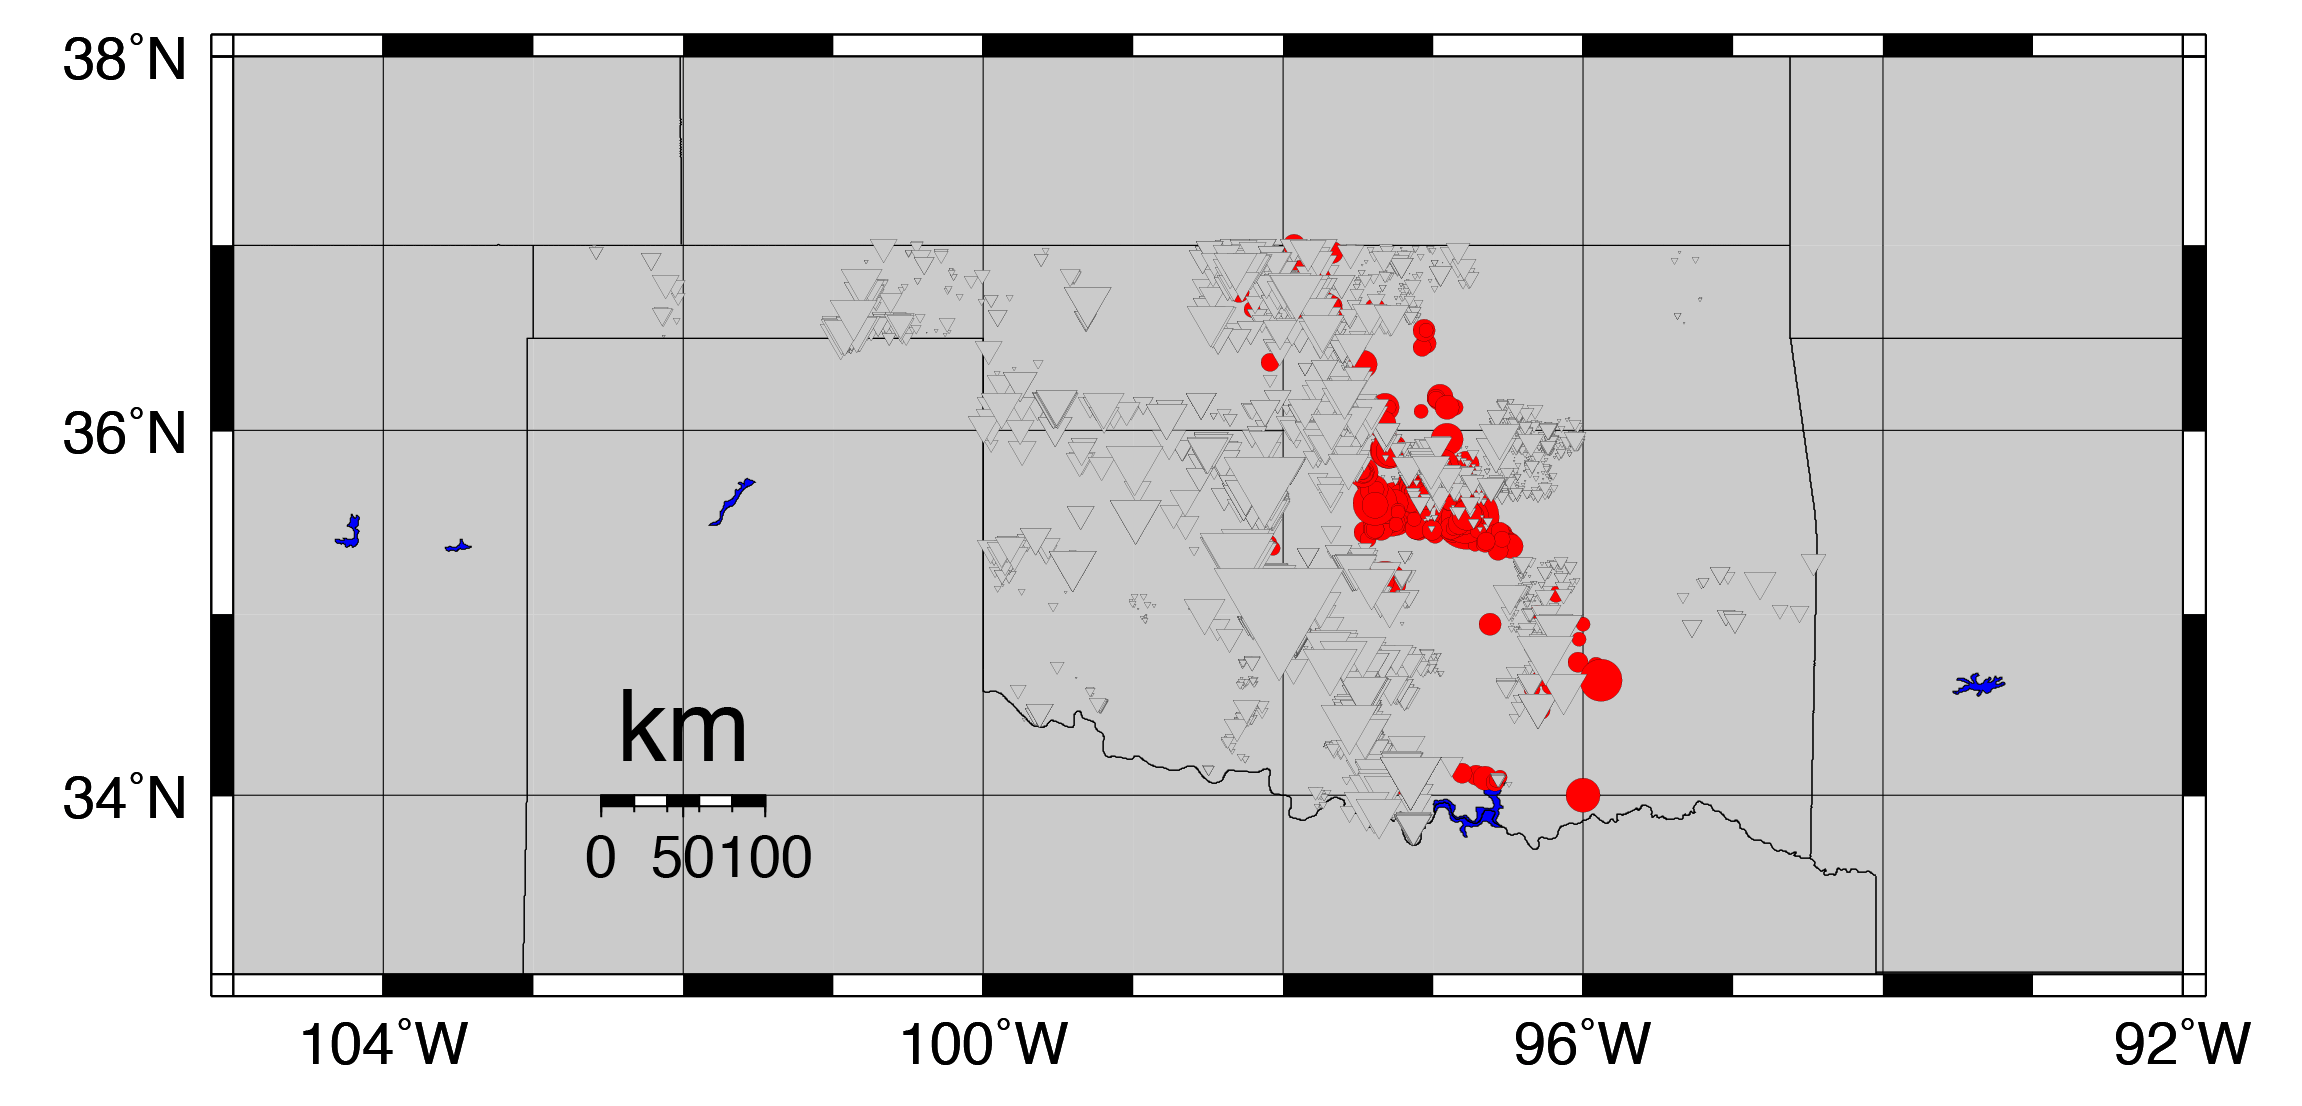
Figure 3. Triangles represent wastewater injection wells scaled to reflect maximum volume rates. Wells with high volumes are located near earthquakes.

Triangles represent wastewater injection wells scaled to reflect maximum pressure. Wells with high pressures are not necessarily near earthquakes.

Figure 4. Triangles represent wastewater injection wells scaled to reflect maximum pressure. Wells with high pressures are not necessarily near earthquakes.

This does not mean that all high-volume wells will trigger earthquakes, or that lower-volume wells are always safe, but rather, it’s an important connection that scientists and well operators should consider.

Starting in 2008 and 2009, with the big oil and gas plays in Oklahoma, a lot more fluid was injected into a lot more wells. As the amount of fluid injected in Oklahoma has increased, so too have the number of earthquakes. But Oklahoma is not the only state to experience this phenomenon. Induced earthquakes have been recorded in Arkansas, Colorado, Kansas, New Mexico, Ohio, West Virginia and Texas.

In the last four years, Arkansas, Kansas, Ohio and Texas have all had “man-made” earthquakes larger than magnitude 4, which is the magnitude at which damage begins to occur. Meanwhile, in that time period, Colorado experienced its second induced earthquake that registered larger than magnitude 5. Oklahoma may have the most induced and triggered earthquakes, but the problem is one of national concern.

Footnote

[1] Induced seismicity actually dates back to the late 1800s with mining, but the connection to high volumes of fluid was first recognized in the 1930s. However, the extent to which it was documented is unknown.
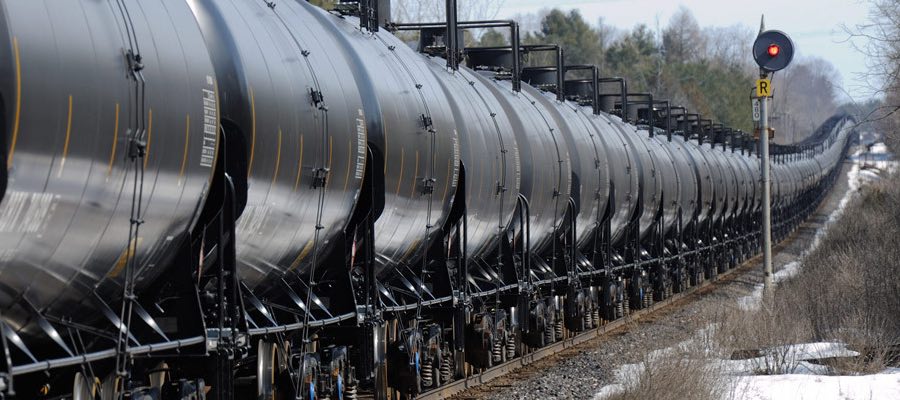
Oil train - Photo by Washinton House Democrats

Increasing Risk from Exploding Crude Trains

By Randy Sargent, Carnegie Mellon CREATE Lab and Samantha Malone, FracTracker Alliance

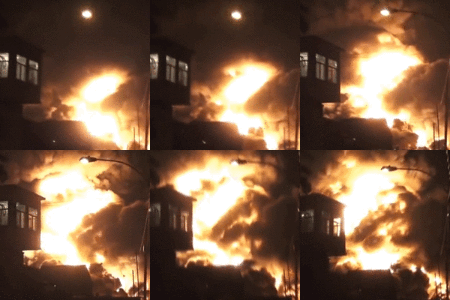
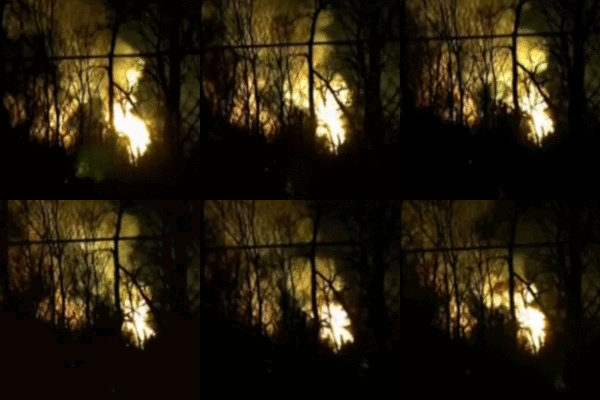
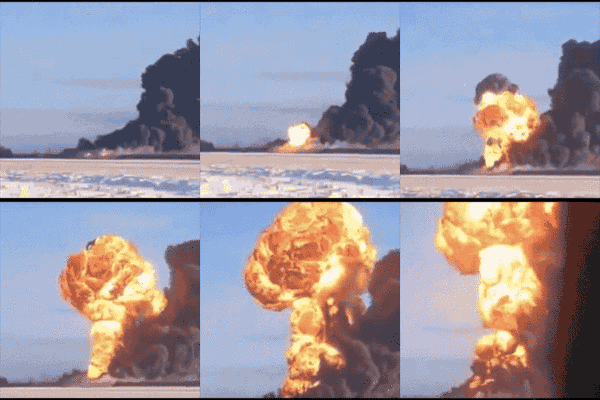
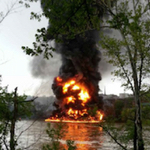
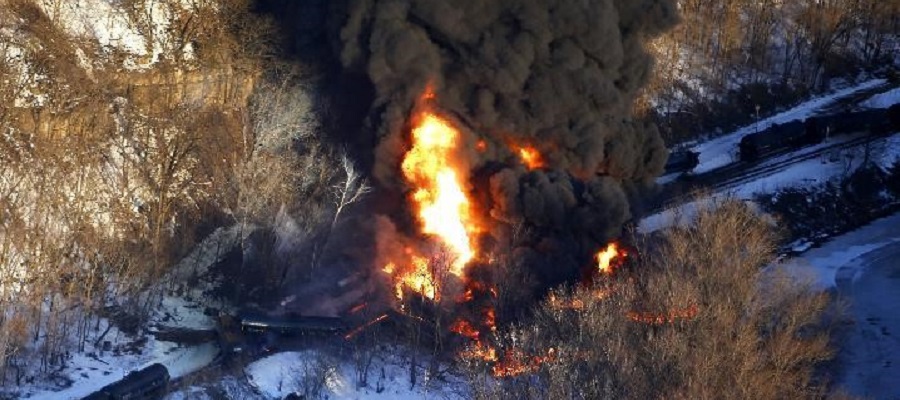
In the past two years, crude oil trains have exploded 10 times, killing 47 people.

LacMegantic

Lac-Mégantic, Quebec: 47 killed

NewBrunswick

Outside Plaster Rock, New Brunswick

Casselton

Outside Casselton, ND

Aliceville

Outside Aliceville, AL

Lynchburg

Outside Lynchburg, VA

WV

Outside Mt. Carbon, WV

Timmins

Outside Timmins, Ontario

Galena

Outside Galena, IL


Heimdal

Outside Heimdal, ND

Gogoma

Outside Gogama, Ontario

It could have been much worse. Eight of the ten trains exploded in rural areas. The train that flattened half the business district of the small town of Lac-Mégantic might have killed hundreds of people if it had exploded during business hours.[1] Residents in Philadelphia have dodged a bullet several times already; they’ve seen two oil train derailments there that fortunately did not explode. And last week’s Amtrak train derailment in Philadelphia that killed 8 people and injured more than 200 could have been much worse, had it impacted an oil train in that area.

Today we ship 17 times as much oil by rail as we did in 2010. This past year we shipped 14.5 billion gallons of oil — that’s 6,700 oil trains the size that destroyed Lac-Mégantic:

This chart above and the ones that follow are derived from the U.S. Energy Information Administration’s recently provided data tracking crude oil movements by rail.

Why do oil trains explode so easily?

Like a carbonated beverage with dissolved CO2, oil extracted from Bakken wells naturally has lighter hydrocarbons in it, such as methane, ethane, propane, and butane. Methane — natural gas — is the lightest of the gases and boils out quickly at surface pressure. But ethane, propane, and butanes, known as light ends or natural gas liquids in the oil industry, take time and/or heat to boil out.[2]

In the most prolific oilfield in the U.S. today, North Dakota’s Bakken formation, most of light ends are left in the oil before loading on the train, to maximize value of what is sent to the refinery. But much like a soda bottle, the pressure increases with temperature and motion, with pressurized ethane, propane, and butane at the top. With those highly volatile gases under pressure, all it takes to create an explosion is a leak and a spark, and both commonly happen in a derailment or collision.

All ten exploding crude trains carried oil from the Bakken.

In contrast, shale oilfields in Texas do stabilize crude by removing light ends prior to shipment by rail.

Where are the exploding Bakken oil trains going?

Bakken trains travel through much of the US and Canada, heading to refineries on the coasts. Increasingly, they are traveling to East coast refineries, which now handle over half of Bakken crude oil production.

Closer to home for the authors, Pittsburgh is a popular waypoint for Bakken oil trains. Known for its steel industry in the 20th century, Pittsburgh continues to sport a large rail infrastructure. Its rails go through very densely populated areas, a good thing when the rails carried ore and steel and coal for the mills. But it’s a disaster waiting to happen now that the rails are bringing explosive oil trains through the city.

CMU

Oil and compressed gasses transit Carnegie Mellon University multiple times daily, Pittsburgh, PA

Oil trains travel across Pittsburgh's North Shore and Downtown multiple times daily, as well

Oil trains travel across Pittsburgh’s North Shore and Downtown multiple times daily, as well


A significant and growing fraction of Bakken oil trains carrying 1 million gallons or more transit Pittsburgh, with ~30 a week based on Pennsylvania Emergency Management Agency data released for five days in October 2014. Prior to the disclosure, volunteers spent a day with us in 2014 recording traffic along one of several routes into the city to learn more about whether / how the trains might pose a risk to city residents and workers. Learn more about what we found here.

Why does this matter?

As crude-by-rail traffic continues to increase, it is only a matter of time before an oil train explodes in a populated area again. Imagine any of the 10 explosions so far taking place instead in downtown Philadelphia or Pittsburgh, or flattening a school in suburban Chicago, for example.

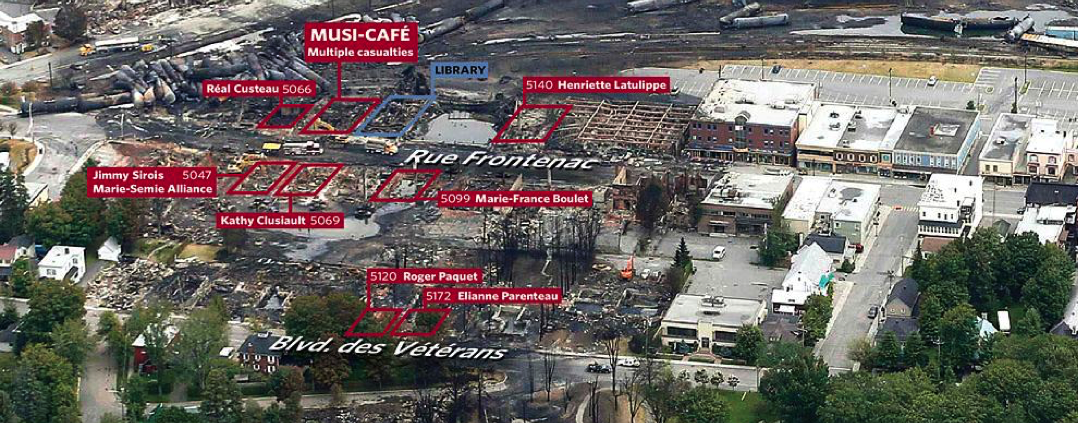
Map of Lac-Mégantic destruction from the Toronto Star’s article, “Where they died”

Map of Lac-Mégantic destruction from the Toronto Star’s article, Where they died. Click to explore the interactive map.

Learn more about the Lac-Megantic disaster through the eyes of those who lived through it.

What can be done

One attempt to make these trains safer, by requiring new tanker cars be built to a safer standard, does not appear to have helped; the most recent 5 exploding trains used the newest, “safer” tanker cars.

But there are effective measures that are in our power to take:


Photo and Video Credits

Endnotes

  1. The direction that the ignited oil flowed after the incident also played a significant role in the path of the damage and fatalities.
  2. Light Ends information
CA Crude Oil by Rail Shipments and Railway Accidents

CA Crude Oil by Rail Shipments and Railway Accidents

By Kyle Ferrar, Western Program Coordinator, FracTracker Alliance

Incidents in California involving oil-by-rail cars increased from 3 in 2011 to 25 in 2013. There were 24 incidents within the first 6 months of 2014, and oil spills from rail cars increased from 98 in 2010 to 182 in 2013.1 With such an increase in oil train incidents, we have to ask what the state is doing to protect public safety.

CA Crude Oil by Rail – The Status Quo

California is currently far behind states like New Hampshire and Minnesota that have taken more control over in-state hazards, and have passed laws aimed at forcing rail and pipeline companies to abide by more rigorous emergency response measures instead of relying on the federal government and undertaking state-level spill response plans. These state movements are in response to the existing federal oversight, which critics cite as inadequate.2

State environmental health officials have acknowledged the dangers of a derailment, but have downplayed the risk – comparing the hazard of an incident to be similar to ethanol or gasoline, based on volatility. They do not believe oil train derailments are as hazardous as other materials transported by rail such as chlorine or ammonia. The bigger concern, though, is the huge volume of Bakken crude oil that is being shipped by rail. A recent report by the State of California Interagency Rail Safety Working group acknowledged this and identified key vulnerabilities along CA rail lines; Destinations of the crude trains in CA are the Bay Area via the Feather River or Donner Pass, Bakersfield via the Tehachapi Pass, and Los Angeles via the same route. These routes pass through the state’s most densely populated areas, as well as through some of the state’s most sensitive ecological areas, and each route has at least one high hazard area for derailments. Other issues identified include the impact of earthquakes on trains and rail lines and a shortage of emergency response capacity.

At-Risk Populations

A recent report by the Natural Resources Defense Council used census data to identify at risk-populations for communities living near the rail lines that can be used for transporting shipments. The analysis identified a total of nearly four million people in the Bay Area and the Central Valley alone that live within 1 mile (the U.S. DOT isolation zone for a crude tanker fire) of a crude shipment rail line. The authors go on to provide the following recommendations to prevent crude oil train accidents:

  1. Remove Defective, Dangerous Tankers from Crude by Rail Service
  2. Impose Safer Speed Limits
  3. Reroute Around Sensitive Areas
  4. Provide Emergency Responder Resources
  5. Make Additional operational Safety and Oversight Improvements
  6. Exercise Local Government Powers4

Crude Oil Shipment Trends

Support of these recommendations is most important as more crude shipments in CA are on the horizon. A recent permit application by the Phillips 66 oil company included a proposal to use Amtrak passenger lines to transport Bakken crude through the San Francisco Bay Area. A review of the proposal by Hinman Consulting Engineers found that over the next 30 years, there is an approximate 28% risk of derailment in the heavily populated stretches of Berkeley, Emeryville, Oakland, Santa Clara, San Jose and others. This estimate is assuming there is no increase in shipping volumes. The damage of an accident was estimated by the researchers, and the analysis showed that approximately 47,000 households and $22 billion in improved property value lay within the projected blast zone, 1000 feet from the railway. A projection of the damage from a single accident estimated that an average of 117 households along with $244 million in property value could be destroyed. Hinman also stated that “this figure does not include loss of revenue, environmental cleanup costs, loss of human life, or other societal costs.”5 A proposal by Valero Refining Co. plans to ship 100 crude oil tank cars a day through downtown Sacramento and downtown Davis to Benicia.

Responses by CA Regulators and Railroads

To plan for this increase in rail traffic, Sacramento passed a shipping charge to prevent and manage spills that will result in $11 million in 2015. Another bill has been introduced to impose a second shipping fee on oil companies to train and equip first responders to deal with major spills and fires on railroad lines. An additional bill was also authored requiring rail carriers to communicate more closely with state emergency officials about crude oil rail movements.6

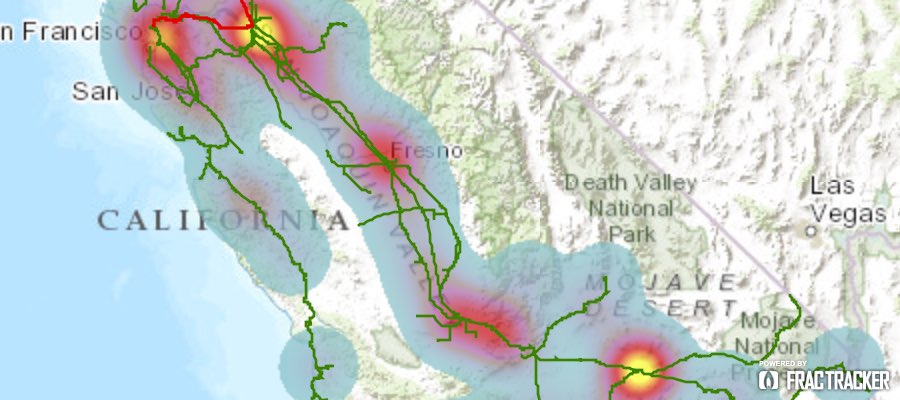
The map below shows where spills and train accidents have occurred in CA since 2011. When zoomed out the map shows areas with higher incidence rates of accidents, but when zoomed to a higher resolution the map differentiates the accidents by year.7

CA Crude Oil by Rail and Railroad Accidents

View Full Screen

In the map above, a hot spot analysis shows the frequency of railroad accidents, such as derailments. Areas with the highest incidence rates are shown in yellow. The actual locations and descriptions with dates of these accidents can be seen by zooming in using the plus (+) button in the top left corner of the map, and clicking on a diamond symbol. Shown in red and green are the BNSF and other railroad lines used for the transportation of crude by rail.

BNSF Route

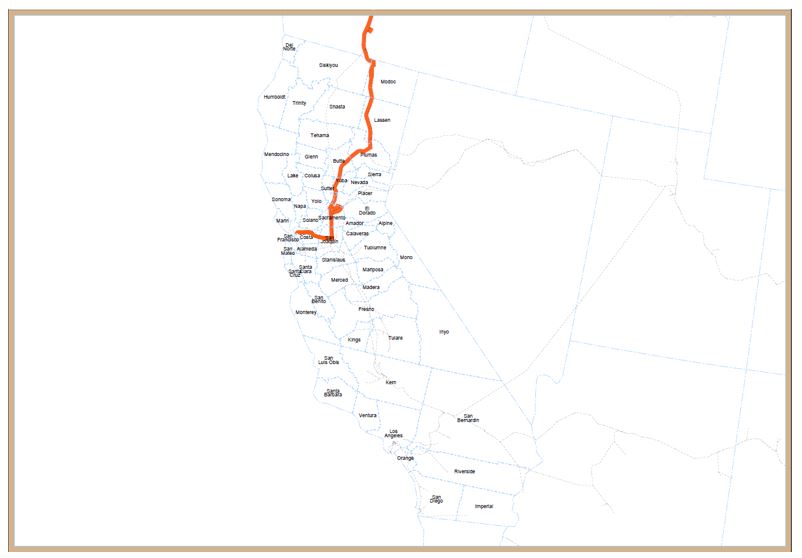
Figure taken from BNSF’s U.S. DOT disclosure to the state of California for emergency preparedness.9

From what little data has been released, it is clear that BNSF railway intends to ship two Bakken crude trains per week carrying more than one million gallons of crude through the CA counties of Butte, Contra Costa, Lassen, Modoc, Placer, Plumas, Sacramento, San Joaquin, and Yuba.8 The same information from Union Pacific Railroad has not been made public by the state of CA. The route shown in the figure to the right has been mapped in the FracTracker Alliance’s California Crude Shipment Routes and Railroad Accidents map above. From the map, you can see that there have been numerous accidents already on this BNSF rail line, particularly near Stockton and in the heavily populated North Bay Area.

References

  1. California Office of Emergency Services. 5/6/14. Historical HazMat Spill Notifications. Accessed 3/8/15.
  2. Douglas E. 6/16/14. 2 States Beef Up Oil-by-Rail and Pipeline Safety After String of Accidents. Inside Climate News. Accessed 3/9/15.
  3. Interagency Rail Safety Working Group. 6/10/14. Oil by Rail Safety in California. California Office of Emergency Services.
  4. Bailey D. 6/2014. It Could Happen Here: The Exploding Threat of Crude by Rail in California. Natural Resources Defense Council. Accessed 3/10/15.
  5. Reis E & Coughlin A. 6/6/2014. New Proposed Oil Transportation Calls for Rational, Risk-Based Mitigation Approach. Hinman Consulting Engineers. Accessed 3/11/15
  6. Bizjak T. 6/16/14. California to impose fee on crude oil rail shipments; funds to be used for spill prevention, cleanup. The Sacramento Bee. Accessed 3/10/15.
  7. U.S. DOT. 5/7/2014. Emergency Order. Docket No. DOT-OST-2014-0067. Accessed 3/10/15.
  8. California Public Utilities Commission. 2015. Railroad Safety and Operations. Accessed 3/8/15.
  9. U.S. DOT. 9/30/14. Re: U.S. Department of Transportation Emergency Order Docket Number DOT-OST-2014-0067 (Issued May 7, 2014). Accessed 3/10/15.
Frac

Fracking’s Most Wanted – An NRDC Issue Paper

Lifting the Veil on Oil & Gas Company Spills & Violations

NRDC Issue Paper • April 2015

Today Natural Resources Defense Council (NRDC) released a report in conjunction with work by those of us at FracTracker Alliance.

We launched this investigation to determine what information about oil and gas company violations is publicly available on the Internet, how accessible it is, and whether it provides an adequate understanding about the practices of different companies.

This report highlights the information gaps about the frequency and nature of oil and gas company violations; such data is only publically accessible in 3 states – even though 36 states have active oil and gas development.

Read Report

April 2015 (PDF)

To take the review one step further, we analyzed the data that was available from these states – Pennsylvania, Colorado, and West Virginia. The results show that companies have been issued a series of violations, some of which were quite severe.

Of these companies, the following 10 had the most violations overall, in order of most to least:

  1. Chesapeake Energy (669)
  2. Cabot Oil and Gas (565)
  3. Talisman Energy (362))
  4. Range Resources (281)
  5. EXCO Resources (249)
  6. ExxonMobil (246)
  7. EQT Corporation (245)
  8. Anadarko Petroleum Corporation (235)
  9. Shell (223)
  10. Penn Virginia Corporation (186)

Find out more information, including the top violators in PA, CO, and WV, on NRDC’s website or by reading the full report (PDF)

Contact: Kate Slusark Kiely, 212-727-4592 or kkiely@nrdc.org


Responses to the Rash of Oil Train Incidents

By Kyle Ferrar and Samantha Malone

Throughout the U.S. more crude was spilled from rail incidents in 2013 than the prior four decades combined. Recently, in a period of three weeks, there were four* derailments of crude oil trains carrying Bakken and other Canadian crudes resulting in fire and explosions, with multiple cars rupturing and set ablaze.1 One of the most recent incidents occurred on March 5th in Galena, Illinois, just north of Chicago (video below). The fires resulting from crude derailments blaze so hot that emergency responders and firefighters are not able to get close enough to extinguish them.  The only option is to let the fire burn out. This process can take days, during which local communities are subject to impaired air quality if not evacuated.2

*This number was revised 4/19/15.

Here we explore how regulators are responding to this public health risk and the new rules being put in place.

Oil Train Incidents Prior to August 2014


Derailments and accidents that occurred prior to August 1, 2014. Click here to view map fullscreen3

Regulatory Responses

Local Bakken Oil and Oil Train Resolutions

In response to these incidents and concerns, at least 50 cities and counties around the country have enacted or proposed resolutions regarding oil trains and Bakken oil. Some of these resolutions ask for direct action while others simply express concern publicly about the risks that the transportation of volatile crude oil by rail poses within their communities.

Resolutions Passed By Local Jurisdictions in California

While we have not collected all of these repossess, a good sample is shown below by state:

STATE TYPE
California
Berkeley, CA Resolution no. 66516
California State Senate Safety provisions in budget
Davis, CA Resolution
Martinez, CA Resolution No. 106-14
Moorpark, CA Letter
Oakland, CA Resolution no. 85054
Richmond, CA Resolution no. 26-14
Sacramento Area Council of Governments Letter
San Jose, CA Letter
San Luis Obispo, CA Letter
Santa Cruz County, CA Letter
Simi Valley, CA Letter
Illinois
Barrington/Chicago, IL Commission letter to President Obama
New York
Clinton County, NY Proposed taskforce
Hyde Park, NY Resolution no. 9:8 – 2 OF 2014
Newburg, NY Resolution no. 230-2014
New York State NY Governor letter to President Obama
Philipstown, NY Resolution
Rockland County, NY Meeting plus resolution
Oregon
Hood River, OR Resolution 2014-22
Columbia River Gorge Commission, OR/WA Resolution
Pennsylvania
Harrisburg, PA Proposed
Philadelphia, PA Resolution no. 150129-A01
Washington
Aberdeen, WA Resolution no. 2014
Anacortes, WA Resolution no. 1889
Auburn, WA Resolution no. 5050
Bainbridge Island, WA Resolution no. 2014 – 18
Bellingham, WA Resolution no. 2014-03
Chehalis, WA Resolution
Columbia River Gorge Commission, OR/WA Resolution
Edmonds, WA Resolutions no. 1317 & no. 1280
Elma, WA Resolution
Hoquiam, WA Resolution no. 2014-10
Kent, WA Proposed resolution
King County, WA Resolution 2014-0164
Montesano, WA Resolution
Mount Vernon, WA Resolution no. 879
Mukilteo, WA Resolution no. 2014-12
Ocean Shores, WA Resolution no. 727
Olympia, WA Resolution no. M-1812
Port of Olympia, WA Resolution no. 2014-07
Quinault Indian Nation Issued opinion
Seattle, WA Resolution no. 31504
Safe Energy Leadership Alliance SELA letter to DOT and WA Governor
Spokane, WA Resolution
Stevenson, WA Resolution no. 2014-279
Vancouver, WA Policy resolution 5b
Washington State Council of Firefighters Resolution no. 14-33
Washougal, WA Resolution no. 1048
Whatcom County, WA Resolution no. 2014-001

If any of the PDF’s linked to above do not load, refresh your browser.

Thank you to the many groups and individuals who have helped to compile this list above, such as Audubon Washington and Forest Ethics.

If you would like to recommend additions to this oil trains local actions list, please do so using the comment form at the bottom of this page.

Federal and National Responses

In an official request, the federal Department of Transportation ordered rail companies to provide the shipping details only to state emergency response officials. Due to the health and safety implications of crude by rail, groups like Earth Justice say the public has the right to know what is going through their backyards.4 The National Transportation Safety Board (NTSB) and a working group for the state of New York both found numerous deficiencies in the regulation of rail safety. The Working Group found that there are serious risks throughout the state from oil by rail in addition to significant gaps in local emergency response capabilities.5, 6

To reduce the actual intensity of these incidents, federal regulations establishing “vapor-pressure cap” rules go into effect this April. This specific regulation puts a limit on the amount of explosive gas allowed in the tanker cars. Crudes with greater amounts of short chain hydrocarbons are more volatile (lighter) and therefore more explosive. Bakken crude is considered “light” and “sweet” (more volatile short chain hydrocarbons) and therefore is more flammable/explosive than other crudes.7 Oil producers will have to measure the actual vapor pressure of the crude. The current practice is to calculate the vapor pressure using standards that are not specific enough for the lighter Bakken crude. Measuring the vapor pressure of each tank using an established protocol (i.e. regulatory standards) is therefore necessary to ensure an accurate knowledge of vapor pressure.8

The new standards for North Dakota crude will require operators to filter the crude in order to bring the vapor pressure down to 13.7 psi, a level comparable to the 13.5 psi standard for most automobile gasoline. The North Dakota Petroleum Council criticized the regulations, saying the explosive components of the Bakken crude are what give it such high value. NDPC also criticized the standards for temperature and pressure as being unnecessary.9 The recent West Virginia train that derailed and exploded would have violated this rule according to the testing conducted in North Dakota before departure. Crude involved in the Lac-Mégantic disaster was far below this standard, with an estimated vapor pressure of 9.3.10

Canadian Pacific Railway, the second largest rail company in Canada, wants the authority to refuse to haul crude oil and other hazardous materials due to liability concerns. This change would require an overhaul of the Canada Transportation Act that requires railways to haul any and all legal goods in rail cars that meet safety standards. The Board of Directors asked, “‘What kind of exposure do we have and what kind of exposure are we [exposing] the public to by hauling some of these commodities?” The U.S. railway BNSF, owned by Warren Buffet’s Berkshire Hathaway, has also protested against a similar U.S. federal regulation.11

Are the recent regulations enough?

The most destructive incident to-date was the Lac-Mégantic, Quebec derailment that killed 47 people on July 6, 2013. Following the Lac-Mégantic explosion, U.S. regulators issued an emergency directive that trains carrying hazardous materials could no longer be left unattended with the engines running unless they first received approval from the Federal Railroad Administration (FRA). The actual implementation of the rule only requires the railroad operators to prepare a plan for such activity and have it on file. There is no requirement for approval from the FRA.3

Other more substantive regulations are slowly coming into effect; for example, by 2017 the weaker DOT-111 oil tanker cars will be retired and all crude will be transported in safer Model CPC-1232 tank cars. Of note, however, is the fact that all five of these recent incidents have involved the safer, reinforced Model 1232 tank cars. A video of the recent derailment outside of Chicago can be seen below.


Galena, Illinois oil train derails with safer model CP-1232 tank cars that had been retrofitted with protective shields.

Data Transparency and Information

Not much detailed information is known publicly about the amount of crude being shipped by railway, the source of the crude, or which routes will be used, but research by the FracTracker Alliance has identified the expansion of crude shipments in communities throughout New York State. In the City of Buffalo, 33% of residents live within the ½ mile blast zone of a railway with crude oil tanker shipments, for example.12 Additional work by groups such as ours and Oil Change International has identified gaps in oversight that may not be possible for state or federal regulations to address. Because the nature of shipping by rail involves long distances and periods of time with infrequent cargo checks, any type of oil spill that goes immediately unnoticed may make it impossible to issue an effective response. Such is the case of a spill in Washington State, shown in the map below.12

In order to preserve the confidentiality of this information, the BNSF and other rail carriers have claimed trade secret exemptions to keep the information and data from being released to the public. The U.S. Department of Transportation has found the oil shipments by rail to “constitute an imminent hazard” and has required that carriers notify the State Emergency Response Commission (SERC) in each state that it operates trains transporting 1,000,000 gallons (23,809.5 barrels) or more of Bakken crude. This information has not been released to the public due to security concerns, however.13

References

  1. Wikipedia. List of Rail Accidents. (http://en.wikipedia.org/wiki/List_of_rail_accidents_%282010%E2%80%93present%29#2015). Accessed 4/19/15.
  2. Stern, Marcus; Jones, Sebastian. U.S. Crackdown on Oil Trains – Less Than Meets the Eye. 12/8/2014. Inside Climate News. Accessed 3/10/15.
  3. Kelso, Matt. 2014. North American Petroleum Transportation by Rail. FracTracker Alliance. Accessed 3/10/15.
  4. Bizjak, Tony. Tate, Curtis. 10/7/2014. Details about Crude Oil Rail Shipments Shrouded in secrecy. The Sacramento Bee. Accessed 3/10/15.
  5. 1/23/14. Safety Recommendation R-14-1. Accessed 3/5/15.
  6. State of New York. 4/30/14. Transporting Crude Oil in New York State: A Review of Incident Prevention and Response Capacity. Accessed 3/10/15.
  7. Pipeline and Hazardous Materials Safety Administration. 2014. Operation Safe Delivery Update. U.S. Department of Transportation. Accessed 3/12/15.
  8. Pichler, Hannes, and Josef Lutz. 2014. Why Crude Oil Vapor Pressure Should Be Tested Prior to Rail Transport. Advances in Petroleum Exploration and Development2.
  9. Scheyder, Ernest. 12/9/2014. North Dakota to require every barrel of crude oil be filtered. Reuters. Accessed 3/10/15.
  10. Gold, Russel. 3/2/15. Crude on Derailed Train Contained High Levels of Gas. Wall Street Journal. Accessed 3/10/15.
  11. Eric Atkins. 3/4/2015. Canadian Pacific wants to limit shipments of dangerous goods. The Globe and Mail. Accessed 3/12/15.
  12. Kelso, Matt. 1/29/15. Regulatory Gaps for Train Spills?. FracTracker Alliance. Accessed 3/14/15.
  13. S. DOT. 5/7/2014. Emergency Order. Docket No. DOT-OST-2014-0067. Accessed 3/10/15

Population Near Railroads in Allegheny County, PA

By Matt Kelso, Manager of Data and Technology

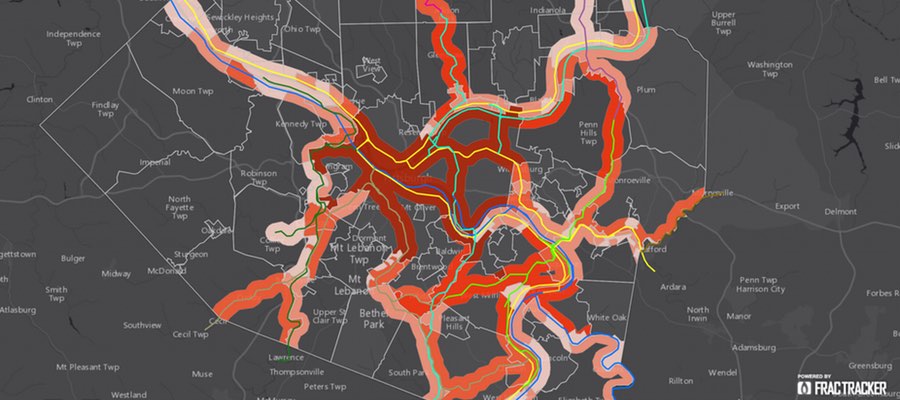
In a joint project with PennEnvironment earlier this month, we analyzed the number of people who live within a half-mile of active rail lines in Pennsylvania and are therefore potentially at risk of an oil train explosion similar to the recent ones in Lac-Mégantic, Quebec; Lynchburg, Virginia; and Mount Carbon, West Virginia. To take that project one step further, we have taken a closer look at the population near railroads in Allegheny County, the second most populous county in PA with over 1.2 million inhabitants. Of the various figures, we found that Pittsburgh has over 183,000 people that live with half-mile mile of an active rail line.

In Philadelphia, the city’s boundary takes up the entire county of the same name, but in Allegheny County, the municipal boundaries are considerably more fractured. In fact, Pittsburgh is just one of 130 municipalities in Allegheny County; its 305,704 inhabitants represent just 25% of the residents in the county, and 13% of the metropolitan area. For the sake of simplicity, residents from the various cities, boroughs, and townships in the county will often say they are from Pittsburgh when speaking with people from outside the region, although they might actually live in Blawnox, McKees Rocks, or Swissvale, for example.


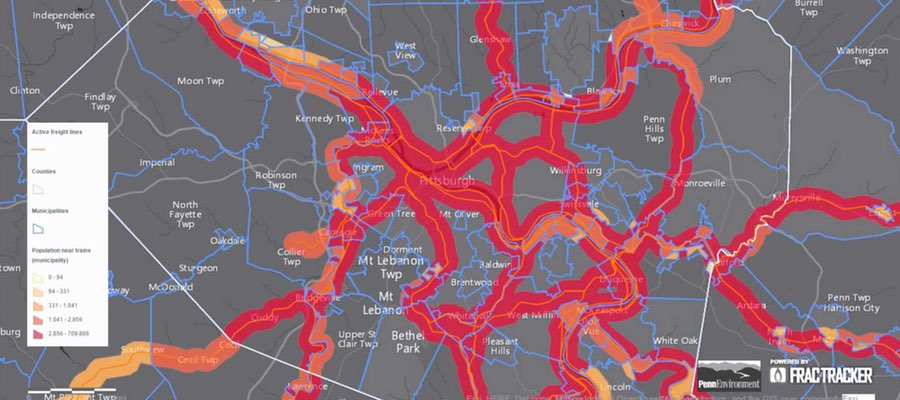
Estimated population within a half-mile of active rail lines in Allegheny County, PA. Click here to access the legend and other map tools.

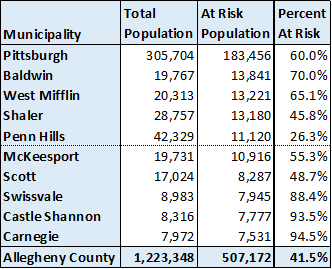
Here is a list of the top ten municipalities with the largest estimated population in the at-risk zone:

Municipalities in Allegheny County with the largest estimated population within a half-mile of railroads.

Municipalities in Allegheny County with the largest estimated population within a half-mile of railroads.

Not surprisingly, the most at-risk municipality in Allegheny County is Pittsburgh, with over 183,000 people living within a half-mile of an active rail line. During any given workday, when individuals flock into the city, even more individuals would theoretically be at risk of an oil train disaster. Following Pittsburgh, Baldwin, West Mifflin, and Shaler all share similar numbers at risk, with Baldwin seeing the greatest percentage of its population at risk of the three. While Castle Shannon and Carnegie have lower populations than the other municipalities, a significant proportion of their residents (93-95%) are near rail lines.

What can violations data tell us?

By Samantha Malone, MPH, CPH – Manager of Education, Communications, & Partnerships

The rate of violations by fracking companies has been of significant interest to many groups including our own. But why? What can violations data tell us about oil and gas safety that a news article about a particular incident cannot?

When companies do not follow regulatory standards and protocols – and either self report the issue or are caught – they may be issued a citation of some sort by the state regulatory agency where the violation occurred. While data of this kind is not always readily available, we can gain key insights into the environment of a particular company and the related state agency by reviewing these violations more closely.

The Stories Behind the Data

Violation trends can be indicators of environmental and public health risks, by looking into spills or illegal air emissions. The degree of transparency both within the oil and gas industry, as well as in the state regulatory agency, can be gleaned based on the quality and quantity of data available about company violations. And of course, the degree to which a company complies with our state and federal laws says a lot about their corporate environment and safety protocols.

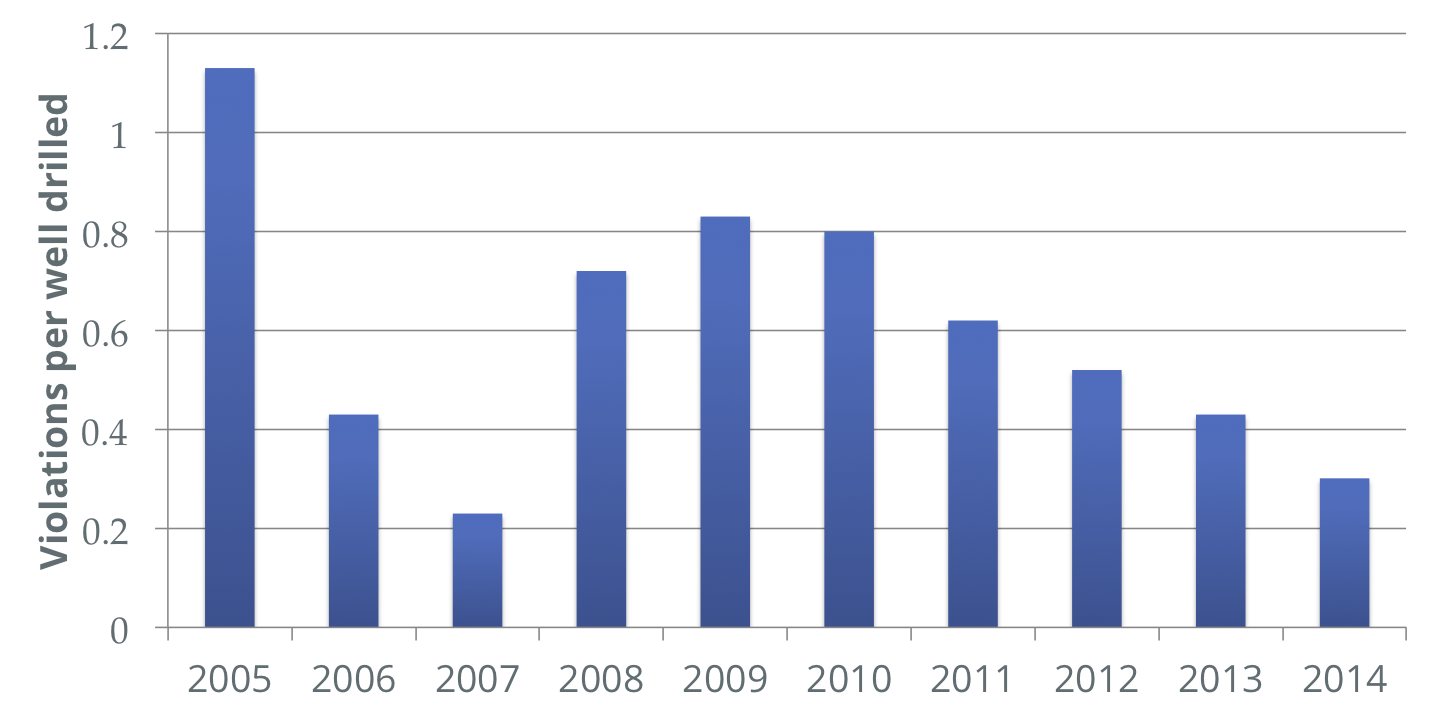
In Pennsylvania, for example, we have seen a decline in violations per well over time (Figure 1, below). At first glance, this trend appears to be a step in the right direction. There could be several reasons behind this change, however, including but not limited to:

  • Improved compliance among operators – Great!
  • Decreased regulatory inspections – Not so great
  • Decreased regulatory reporting of violations during those inspections – Not so great
  • Changes in what qualifies as a “violation” or how violations data is collected/shared
  • Less self reporting by the companies when something goes wrong – Not so great
  • Larger, more established operators with better safety protocols have bought out smaller, resource-limited companies
  • Improved control technologies or infrastructure (throughputs) – Great!
  • More public pressure to comply with regulations – Great!
VpW PA Over Time

Figure 1. Violations per well drilled in PA 2005-2014. Data source

Two Recent Violations Data Reports

With the insight that can be acquired by analyzing violations (and other types of data), it is not uncommon to see an increase in the organizations and researchers digging into the data.

On January 27th, for example, Environment America released a report detailing the top oil and gas violators in the United States. Among their many findings…

Houston-based Cabot Oil, a prime Halliburton contractor, committed the most total violations with 265 across the study period. Chesapeake Energy was close behind. Pittsburgh-based Atlas was guilty of the most breaches for every well drilled, while Mieka, part of Dallas-based Vadda Energy, was responsible for the most infractions per well operated. Learn more

A report that we wrote last year finally made its way through peer review and was published in the Journal of Environmental Science and Health, Part A on Tuesday last week1. We did not focus specifically on the operators committing violations like Environment America did, but on the state of the data that is or should be available to the public about these operations from state regulatory agencies. Unfortunately, we found that many states often do not release violations data – especially not in a publicly accessible manner. Learn more about this study through an article I wrote for the Sunlight Foundation’s blog or check out the abstract.

A third violations report is due out soon, so keep your eyes peeled! UPDATE: As of April 2, 2015 – The Natural Resources Defense Council report is available.

Endnotes

1. The other publications in the special issue, Facing the Challenges – Research on Shale Gas Extraction, are listed below:

Foreword
John F. Stolz Professor, Duquesne University
Pages: 433-433

Current perspectives on unconventional shale gas extraction in the Appalachian Basin
David J. Lampe & John F. Stolz
Pages: 434-446

Long-term impacts of unconventional drilling operations on human and animal health
Michelle Bamberger & Robert E. Oswald
Pages: 447-459

Human exposure to unconventional natural gas development: A public health demonstration of periodic high exposure to chemical mixtures in ambient air
David R. Brown, Celia Lewis & Beth I. Weinberger
Pages: 460-472

Reported health conditions in animals residing near natural gas wells in southwestern Pennsylvania
I. B. Slizovskiy, L. A. Conti, S. J. Trufan, J. S. Reif, V. T. Lamers, M. H. Stowe, J. Dziura & P. M. Rabinowitz
Pages: 473-481

Marcellus and mercury: Assessing potential impacts of unconventional natural gas extraction on aquatic ecosystems in northwestern Pennsylvania
Christopher J. Grant, Alexander B. Weimer, Nicole K. Marks, Elliott S. Perow, Jacob M. Oster, Kristen M. Brubaker, Ryan V. Trexler, Caroline M. Solomon, & Regina Lamendella
Pages: 482-500

Data inconsistencies from states with unconventional oil and gas activity
Samantha Malone, Matthew Kelso, Ted Auch, Karen Edelstein, Kyle Ferrar, & Kirk Jalbert
Pages: 501-510

Scintillation gamma spectrometer for analysis of hydraulic fracturing waste products
Leong Ying, Frank O’Connor, & John F. Stolz
Pages: 511-515

Well water contamination in a rural community in southwestern Pennsylvania near unconventional shale gas extraction
Shyama K. Alawattegama, Tetiana Kondratyuk, Renee Krynock, Matthew Bricker, Jennifer K. Rutter, Daniel J. Bain, & John F. Stolz
Pages: 516-528

Danger Around the Bend

The Threat of Oil Trains in Pennsylvania

A PennEnvironment Report – Read Full Report (PDF)

On the heels of the West Virginia oil train explosion, this new study and interactive map show populations living in the evacuation zone of a potential oil train crash.

PA Oil Train Routes Map


This dynamic map shows the population estimates in Pennsylvania that are within a half-mile of train tracks – the recommended evacuation distance in the event of a crude oil rail car explosion. Zoom in for further detail or view fullscreen.

Danger Around the Bend Summary

The increasingly common practice of transporting Bakken Formation crude oil by rail from North Dakota to points across the nation—including Pennsylvania—poses a significant risk to the health, well-being, and safety of our communities.

This risk is due to a confluence of dangerous factors including, but not limited to:

  1. Bakken Formation crude oil is far more volatile and combustible than typical crude, making it an incredibly dangerous commodity to transport, especially over the nation’s antiquated rail lines.
  2. The routes for these trains often travel through highly populated cities, counties and neighborhoods — as well as near major drinking water sources.
  3. Bakken Formation crude is often shipped in massive amounts — often more than 100 cars, or over 3 million gallons per train.
  4. The nation’s existing laws to protect and inform the public, first responders, and decision makers are woefully inadequate to avert derailments and worst-case accidents from occurring.
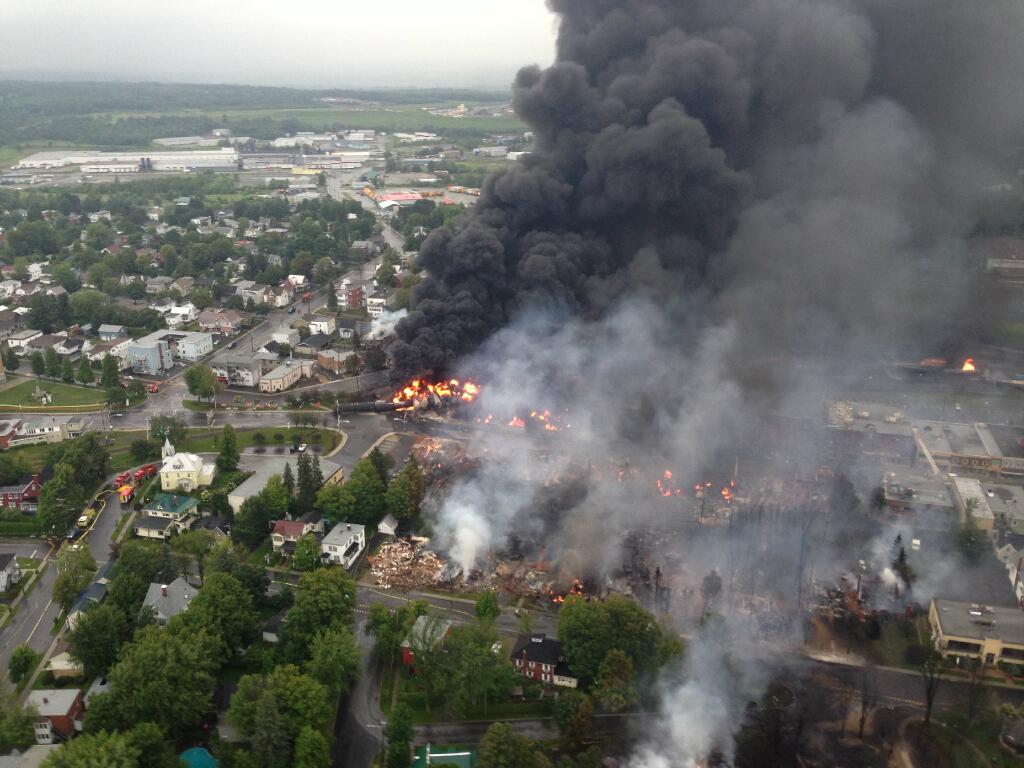
Lac-Mégantic derailment. Source: http://en.wikipedia.org/wiki/Lac-M%C3%A9gantic_derailment

Lac-Mégantic derailment, July 2013. Source

In the past few years, production of Bakken crude oil has dramatically increased, resulting in greater quantities of this dangerous fuel being transported through our communities and across the nation every day. This increase has led to more derailments, accidents, and disasters involving oil trains and putting local com- munities at risk. In the past 2 years, there have been major disasters in Casselton, North Dakota; Lynchburg, Virginia; Pickens County, Alabama; and most recently, Mount Carbon, West Virginia. The worst of these was the town of Lac-Mégantic, in Canada’s Quebec Province. This catastrophic oil train accident took place on July 6, 2013, killing 47 people and leveling half the town.

Oil train accidents have not just taken place in other states, they have also happened closer to home. Pennsylvania has had three near misses in the last two years alone — one near Pittsburgh and two in Philadelphia. In all three cases, trains carrying this highly volatile Bakken crude derailed in densely populated areas, and in the derailment outside of Pittsburgh, 10,000 gallons of crude oil spilled. Fortunately these oil train accidents did not lead to explosions or fires.

All of these incidents point to one fact: that unless we take action to curb the growing threat of oil trains, the next time a derailment occurs an unsuspecting community may not be so lucky.

Bakken oil train routes often travel through high-density cities and neighborhoods, increasing the risk of a catastrophic accident for Pennsylvania’s residents. Reviewing GIS data and statewide rail routes from Oak Ridge National Laboratory, research by FracTracker and PennEnvironment show that millions of Pennsylvanians live within the potential evacuation zone (typically a half-mile radius around the train explosion ). Our findings include:

  • Over 3.9 million Pennsylvania residents live within a possible evacuation zone for an oil train accident.
  • These trains travel near homes, schools, and day cares, putting Pennsylvania’s youngest residents at risk. All told, more than 860,000 Pennsylvania children under the age of 18 live within the 1⁄2 mile potential evacuation zone for an oil train accident.
  • Philadelphia County has the highest at-risk population — Almost 710,000 people live within the half-mile evacuation zone. These areas include neighborhoods from the suburbs to Center City.
  • 16 of the 25 zip codes with the most people at risk — the top percentile in the state — are located in the city of Philadelphia.
  • The top five Pennsylvania cities with the most residents at risk are:
    • Philadelphia (709869, residents),
    • Pittsburgh (183,456 residents),
    • Reading (70,012 residents),
    • Scranton (61,004 residents), and
    • Erie (over 51,058 residents).
Read full report

Danger Around The Bend


Bakken Crude Oil

How we get it and why we ship it

Bakken crude oil comes from drilling in the Bakken Formation, located in North Dakota. It contains deposits of both oil and natural gas, which can be accessed by hydraulic fracturing, or “fracking.” Until recent technological developments, the oil contained in the formation was too difficult to access to yield large production. But advances in this extraction technology since 2007 have transformed the area into a major oil producer — North Dakota now ranks second in the U.S. for oil production. The vast expansion of wells over the last 4 years (from 470 wells to over 3,300 today) means that there is more oil to transport to the market, both domestically and abroad. This increase is especially concerning considering that the U.S. Department of Transportation stated in early 2014 that Bakken crude oil may be more flammable than traditional crude, therefore making it more dangerous to transport by rail.

For More Information

Regulatory Gaps for Train Spills?

By Matt Kelso, Manager of Data & Technology

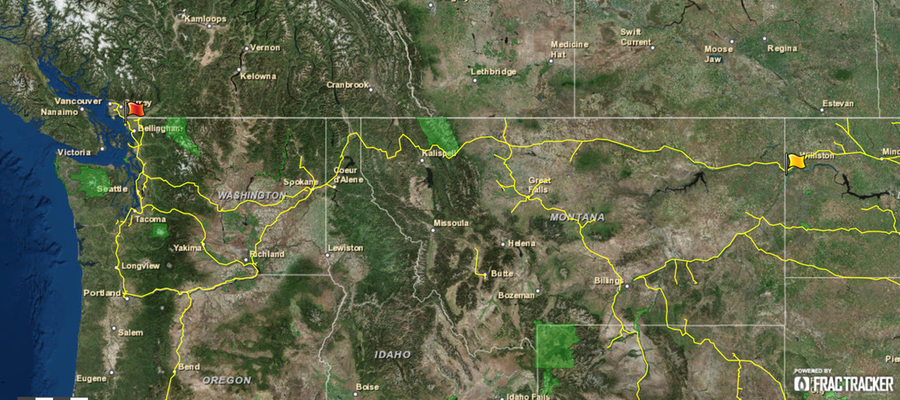
On January 26, 2015, the Columbian, a paper in Southwestern Washington state, reported that an oil tanker spilled over 1,600 gallons of Bakken Crude in early November 2014.  The train spill was never cleaned up, because frankly, nobody knows where the spill occurred. This issue highlights weaknesses in the incident reporting protocol for trains, which appears to be less stringent than other modes of transporting crude.

Possible Train Spill Routes


To follow the most likely train route for this incident, start at the yellow flag, then follow the line west. The route forks at Spokane – the northernmost route would be the most efficient. View full screen map

While there is not a good place for an oil spill of this size, some places are worse than others – and some of the locations along this train route are pretty bad.  For example, the train passes through the southern edge of Glacier National Park in Montana, the scenic Columbia River, and the Spokane and Seattle metropolitan areas.

Significant Reporting Delay

The Columbian article mentions that railroads are required to report spills of hazardous materials in Washington State within 30 minutes of spills being noticed. In this case, however, the spill was apparently not noticed until the tanker car in question was no longer in BNSF custody. Therefore, relevant state and federal regulatory agencies were never made aware of the incident.

Both state and federal officials are now investigating, and we will follow up this post with more details when they are made available.

What is fracking fluid?