Drilling, Emergency Preparedness, & Public Engagement
By Danny Kallich, Southwest Pennsylvania Environmental Health Project
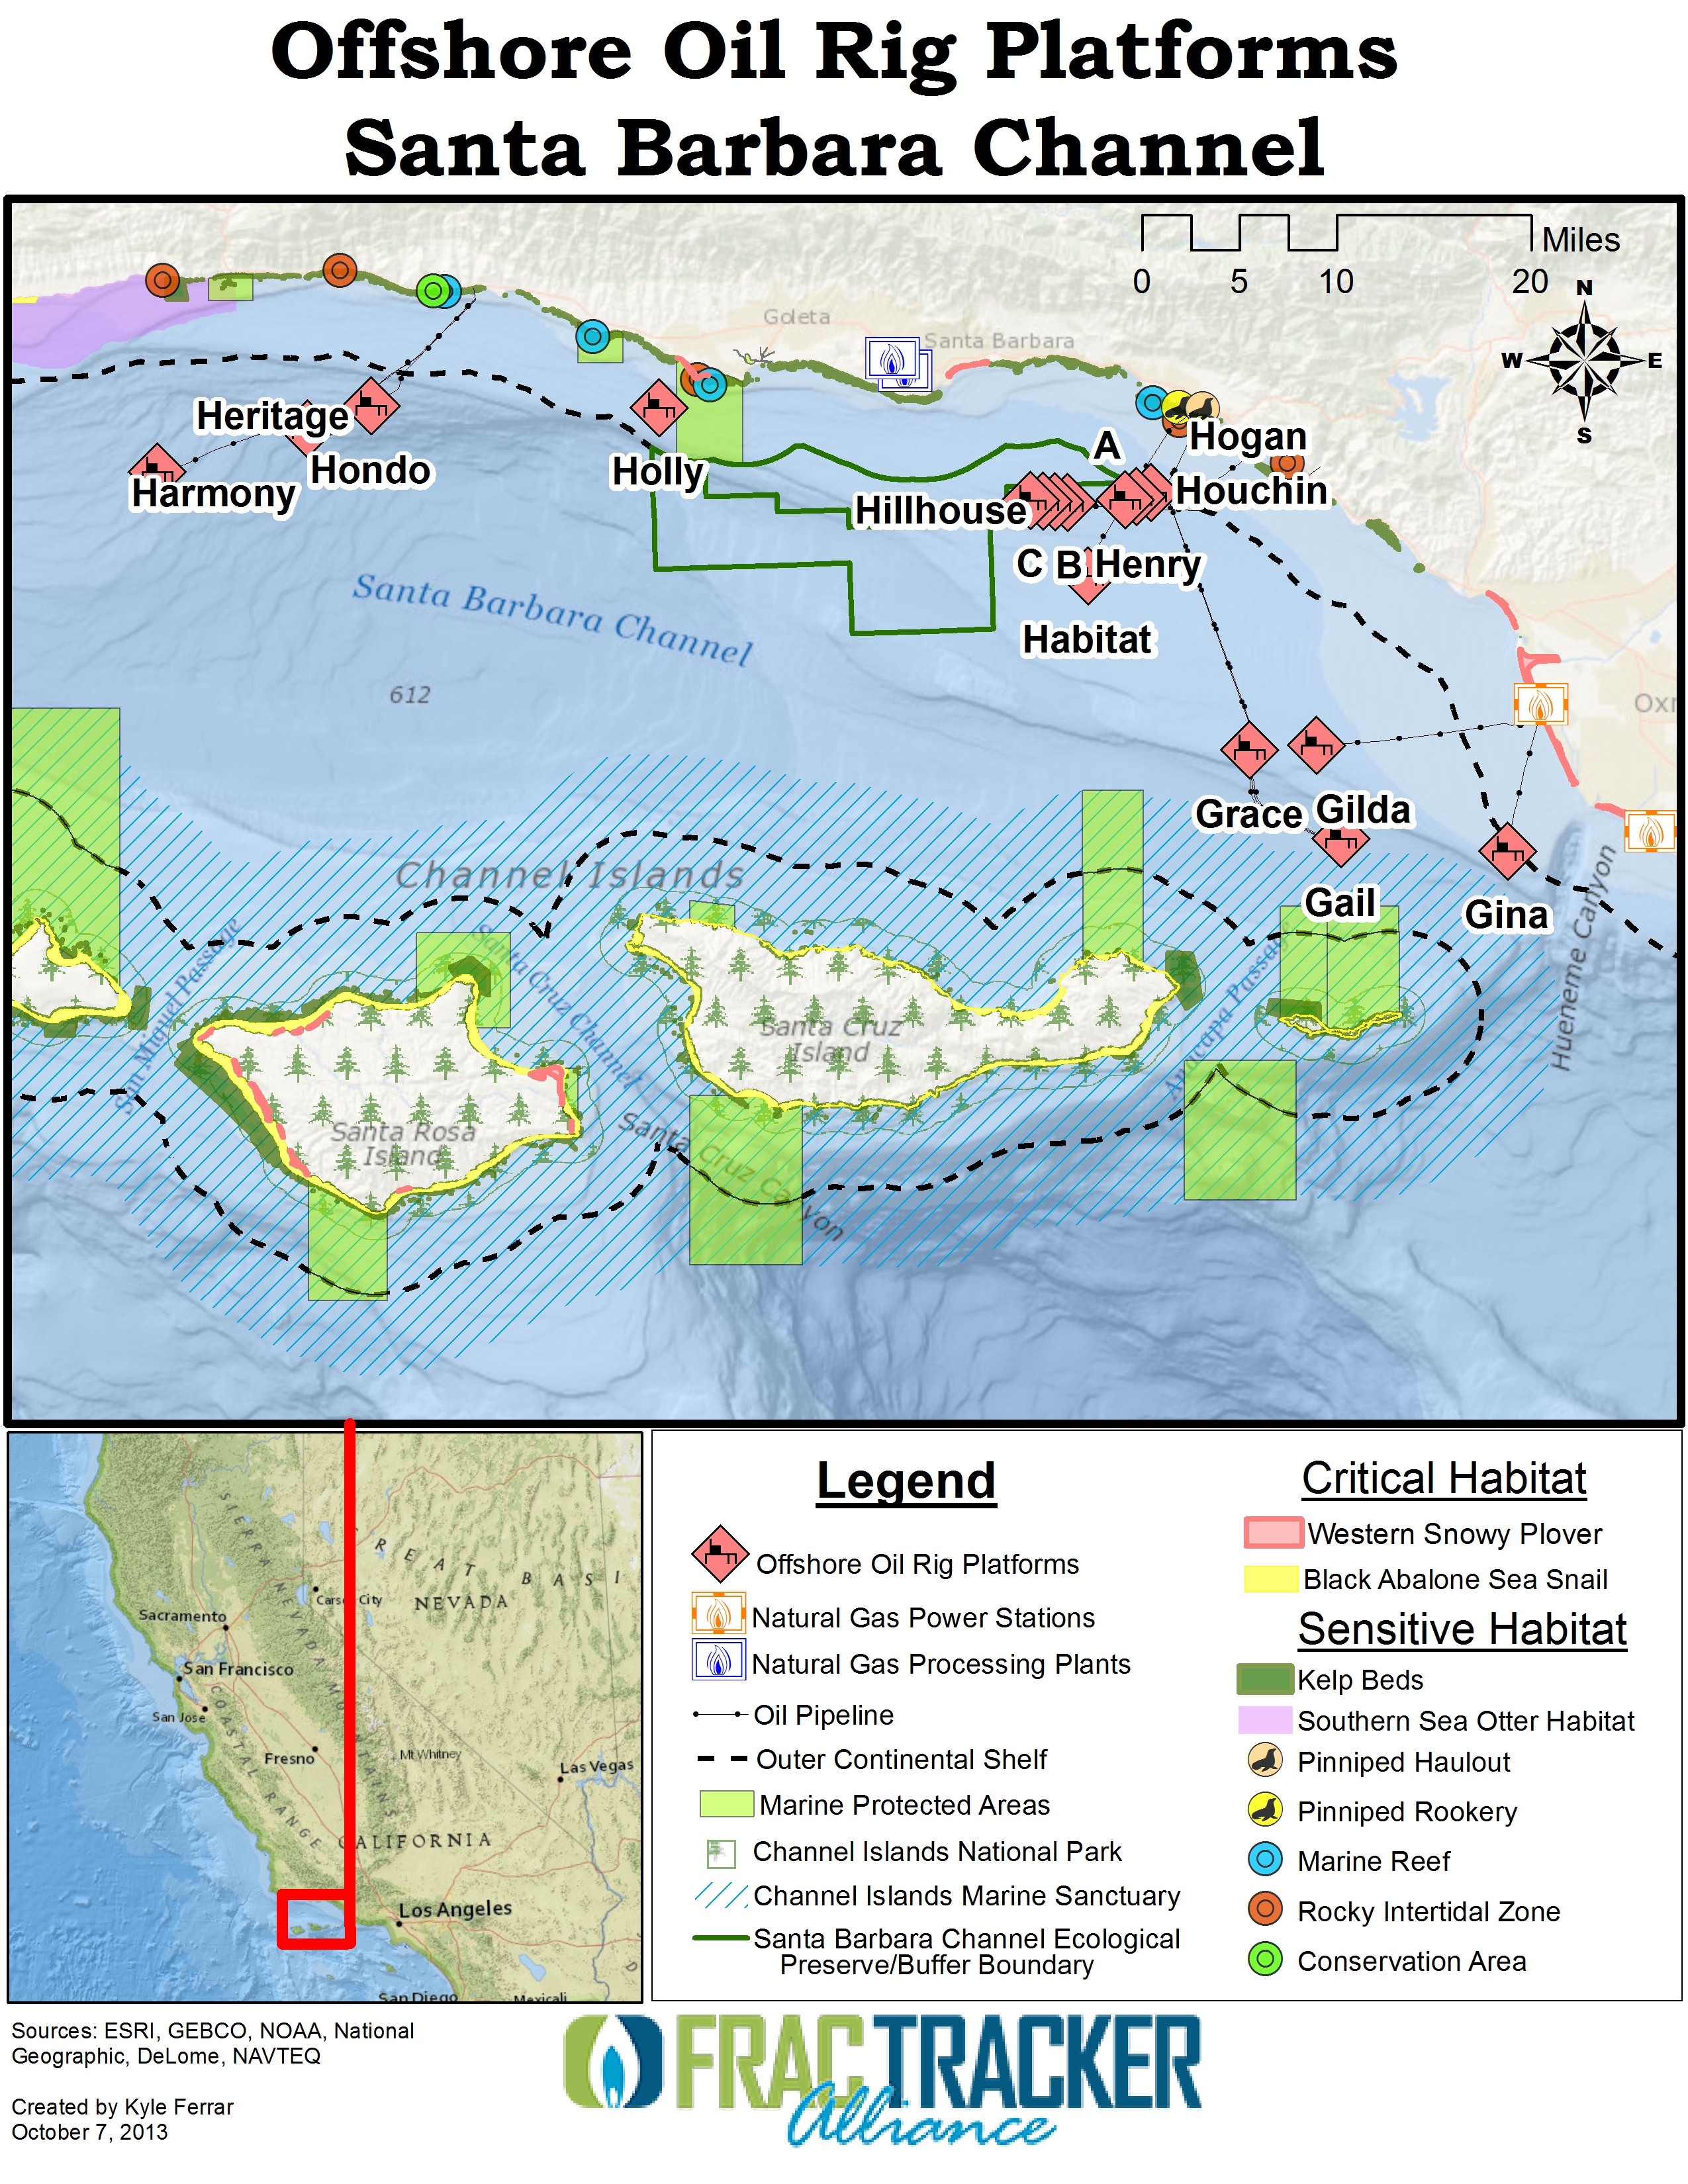
This article examines whether emergency responders are prepared in rural areas for oil and gas drilling emergencies, how people may be put at risk if the proper procedures aren’t in place, and other critical safety questions that citizens in Southwest Pennsylvania should be asking.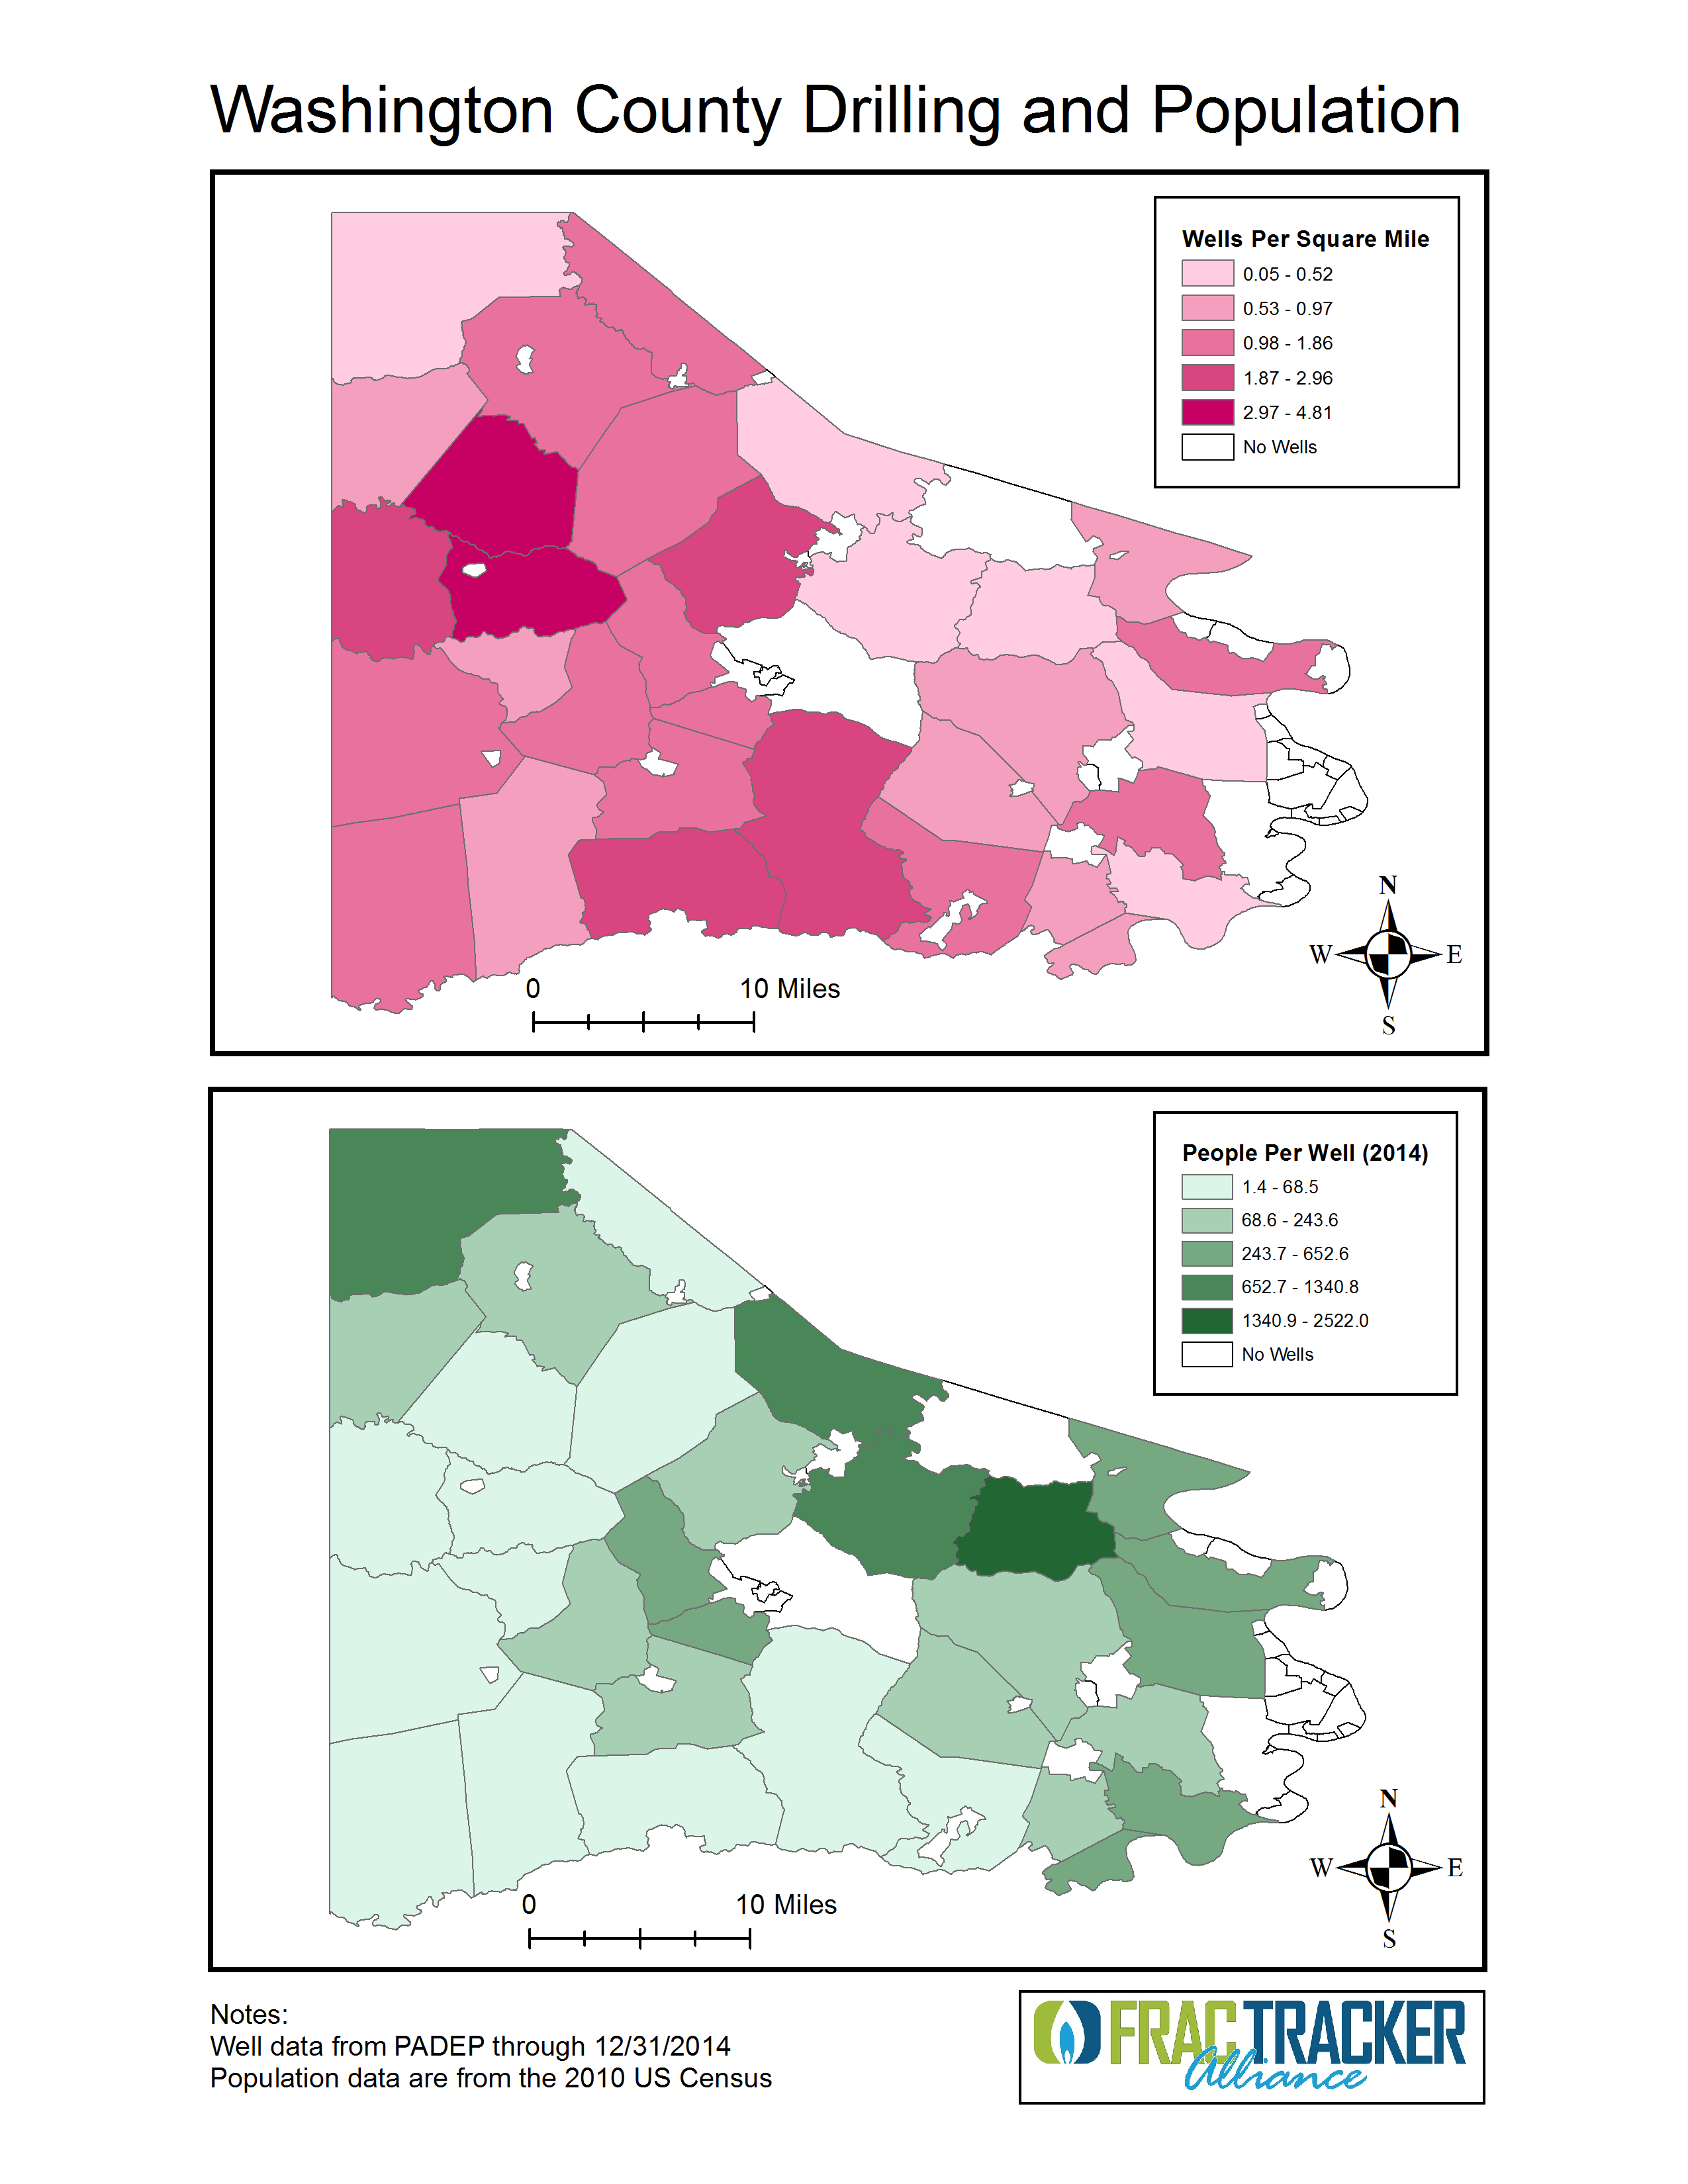
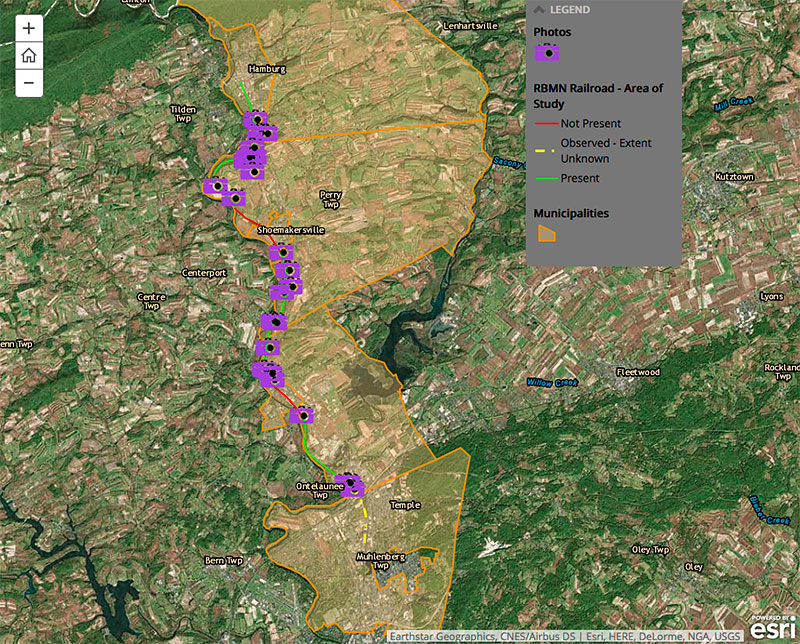
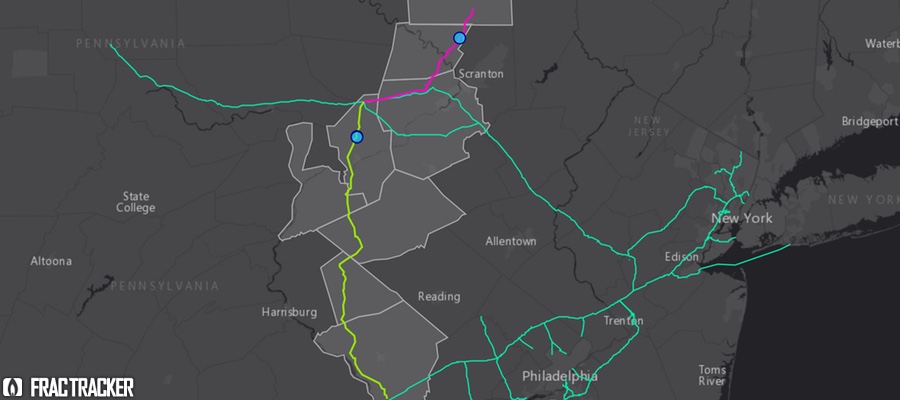
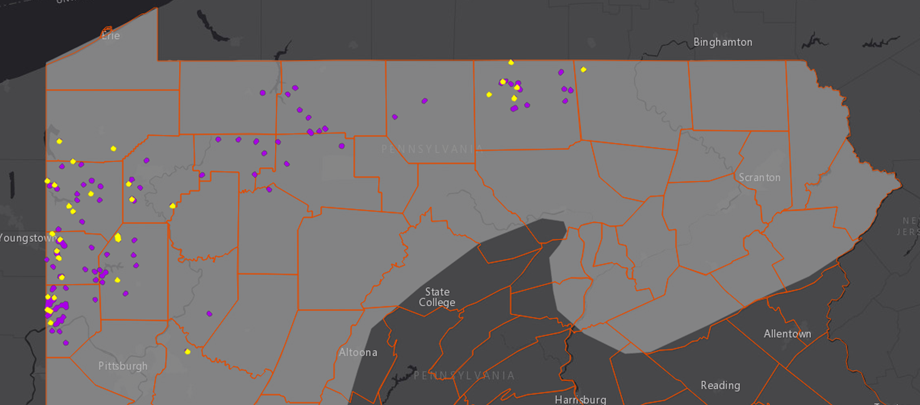
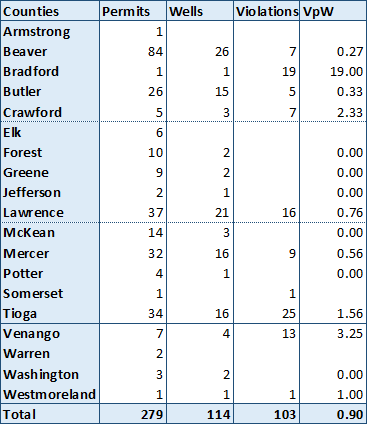
Maps of wells per sq. mile and people per well in Washington County, PA
The rapid spread of unconventional natural gas development (UNGD) across Pennsylvania has highlighted the need for state, county, and municipal agencies to regulate industry activity and protect the public on several fronts. In particular, comprehensive emergency preparedness and response specific to natural gas development is an obvious necessity for residents living within close proximity of wells, compressor stations, and other stages of UNGD.
While experts in the field of emergency planning are rightfully responsible for creating and executing emergency plans, the Federal Emergency Planning and Community Right to Know Act of 1986 (EPCRA) defines citizens’ rights to engage in the process, both through open records requests and public meetings with local emergency planners. EPCRA establishes roles and requirements for emergency planners while clarifying the rights of citizens to engage in dialogue with those responsible for safety about potentially harmful industrial activity in their community.
Unique Emergency Preparedness Challenges
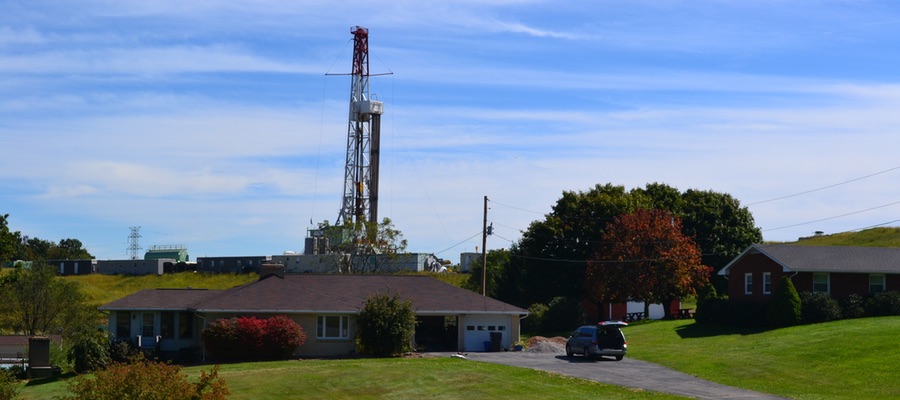
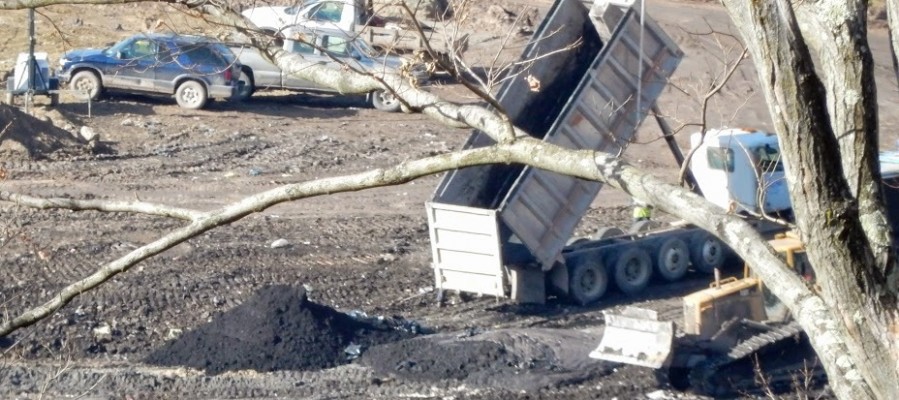
UNGD presents a unique set of challenges for residents and emergency planners. The high likelihood that UNGD will be located in a rural area not typically supporting industrial use argues for the need for special treatment by emergency planners. Furthermore, responding to a UNGD emergency requires specialized training that is not mandated for local first responders, often volunteer fire fighters. While local first responders cannot be expected to specialize in UNGD related emergencies, it takes many hours for the contracted well-fire specialists, Texas-based Wild Well Control, to arrive and mitigate an emergency situation. The interim period between the arrival of local and county first responders and the arrival of Wild Well Control is, nonetheless, a critical time during which a system for consistent updates to nearby residents should be a priority. An emergency situation, as demonstrated by the February 11, 2014 Chevron Appalachia well fire, discussed below, can affect a community in a variety of ways, even if evacuation is not necessary.
Chevron Appalachia Incident, Greene County, PA
Testing The System:
Using Right-To-Know requests to gauge transparency & citizen awareness
The opportunities for citizen comment and engagement with emergency planners are limited and not well publicized. The dearth of clear and consistent means of communication between residents and those responsible for emergency planning provides a noteworthy opportunity to test the provisions of EPCRA as they relate to UNGD.
In this regard, testing the emergency response system related to oil and gas drilling emergencies is intended to analyze existent emergency plans, municipal preparedness, communication between county, municipal, and industry emergency planners, and perhaps most importantly, how much of this information is available to citizens.
The transparency of the system was tested by filing Right-To-Know requests. These public information requests were filed with nine municipalities in various counties across the state of Pennsylvania. All filed requests specifically asked for “all available county, municipal, and company generated emergency plans” in relation to specific well sites. One request asked for emergency plans generated by an elementary school in relation to a well site within approximately a half-mile.
Of these nine requests, three were fulfilled with returned emergency plans. Of the remaining six requests, five were not fulfilled because no emergency plan existed on record in the municipality. Initially, the request for the elementary school emergency plan was unable to be met by the municipal open records officer because no plan existed. Two months after that request, an unsolicited response from the same individual was received stating that the now-existent plan could not be shared because of security issues. A final question posed to the open records officer asked what concerned parents might be able to do to prepare themselves for emergency situations. This question, too, was deemed unanswerable due to security reasons. Another unmet municipal request was redirected to a county emergency planner who stated that the company generated plan was not theirs to distribute. Of the three emergency plans received, only one made any specific mention of residents living within close proximity; this response merely stated the number of nearby houses. Excluding GPS coordinates, no plan addressed any other infrastructure specific to the surrounding area, indicating a broad generality to their application.
The fact that six out of nine queried communities in PA were unable or unwilling to provide emergency response plans is highly concerning. These findings, when considered in the broader national context, indicate a significant chance that UNGD specific emergency planning and necessary communication with the public is deficient, particularly on the municipal level.
What Communities Need
Lack of specificity, inter-agency communication, and transparency indicate that the potential of EPCRA to benefit citizens has been largely untapped during the Marcellus Shale boom relative to emergency planning. Residents living within close proximity to UNGD should not only be apprised of emergency risk and strategy before an emergency arises, they should have a clearly accessible venue through which to voice concerns, needs, and recommendations. Furthermore, residents have valid reason to demand greater public oversight of current emergency planning efforts when the overwhelming majority of publicly available emergency plans fail to provide any information useful to a layperson.
Currently, there are communities in which the questionable practice of locating UNGD within a half-mile of elementary schools and other sensitive areas continues. In such areas, every effort must be made to develop, institute, and practice emergency plans prioritizing the concerns, safety, and coordination of local residents. Recommendations for improved transparency include:
- Make publicly available site-specific plans,
- Hold regular public meetings, and
- Prioritize communication between emergency responders and residents during emergency events
We encourage residents who are concerned about what their community is doing for UNGD-specific emergency planning to contact their local emergency responders and attend Local Emergency Planning Committee meetings in their county to advocate for such measures.
About EHP
The Southwest Pennsylvania Environmental Health Project (EHP) is a nonprofit environmental health organization created to assist and support Washington County residents who believe their health has been, or could be, impacted by natural gas drilling activities. Their Mission is to respond to individuals’ and communities’ need for access to accurate, timely and trusted public health information and health services associated with natural gas extraction.


