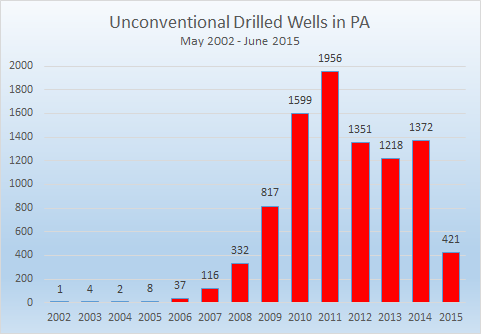
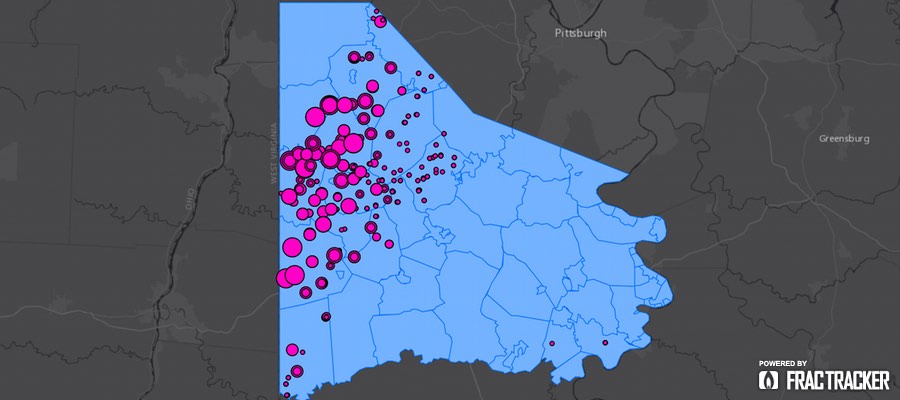
Figure 1: Newly drilled unconventional wells in Pennsylvania peaked in 2011.
Unconventional oil and gas drilling is well established in Pennsylvania, with over 9,200 drilled wells, an additional 7,200 permitted locations that have not yet been drilled, and 5,300 violations all happening since the turn of the millennium. It took a while for the industry to gather steam, with just one unconventional well drilled in 2002, and only eight in 2005. But by 2010, that figure had ballooned to 1,599 wells, which was greater than the previous eight years combined. There were 1,956 wells drilled in 2011, representing the peak for unconventional drilling activity in Pennsylvania (Figure 1).
None of the three full years since then, however, have seen more than 70% of the 2011 total. Halfway through 2015, the industry is on pace to drill only 842 unconventional wells statewide, which would be the lowest total since 2009, and only 43% of the 2011 total.
Pennsylvania Shale Viewer. Click here to access the full screen view with a legend, layer details, and other tools.
Taken cumulatively, the footprint on the state is immense, as is shown in the map above, and impacts remain for some time. Of Pennsylvania’s 9,234 unconventional wells 8,187 (89%) are still active. Only 474 wells have been permanently plugged so far, with 570 given an inactive status, and one well listed as “proposed but never materialized,” despite being included on the spud report.
Permits & Violations
The number of permits and violations issued have been declining over the past five years as well.
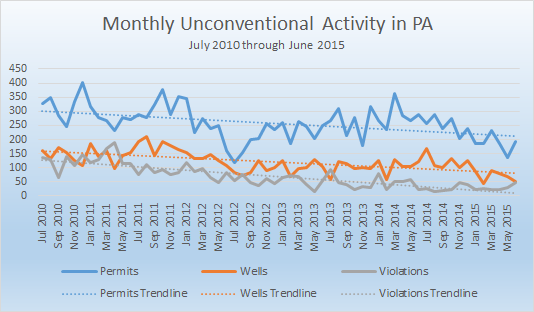
Figure 2: Five years of unconventional oil and gas activity in Pennsylvania, July 2010 through June 2015.
Figure 2 shows the monthly totals of permits, wells, and violations over the last 60 months. Linear trendlines were added to the chart to give a visual representation of changes over time if we ignore the noise of the peaks and troughs of activity, which is an inherent attribute of the industry. Each of the three trendlines has a negative slope1, showing downward trends in each category.
In fact, permits for new wells are declining more rapidly than the drilled wells, and violations issued are declining at a still faster rate. Over the course of five years, these declines are substantial. In July 2010, the smoothed totals that are “predicted” by the trendline show 304 permits issued, 159 wells drilled, and 128 violations issued per month. 60 months later, one would expect 213 permits, 81 wells drilled, and just 12 violations issued2.
Location of Drilling Activity
The oil and gas industry has been more selective about where unconventional wells are being drilled in recent years, as well. Altogether, there are unconventional wells in 39 different counties, with 32 counties seeing action in both 2010 and 2011. That number is down to 22 for both 2014 and the first half of 2015. There has been drilling in 443 different municipalities since 2002, with a maximum of 241 municipal regions in 2011, which shrank to 161 last year, and just 88 in the first half of 2015.
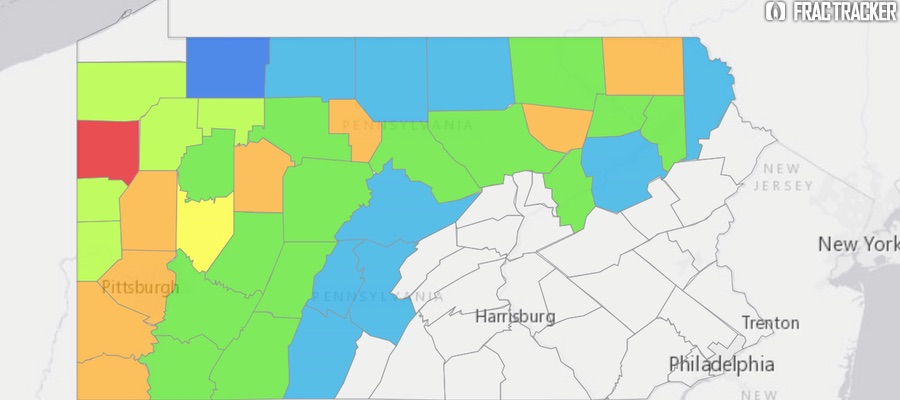
Summary of unconventional wells drilled in each Pennsylvania county by year, through June 30, 2015. Click here to access the full screen view with a legend, layer details, and other tools
Clicking on any of the counties above will show the number of unconventional wells drilled in that county by year since the first unconventional well was spudded in Pennsylvania back in 2002. The color scheme shows the year that the maximum number of unconventional wells were drilled in each county, with blues, greens, and yellows showing counties where the activity has already peaked, oranges showing a peak in 2014, and red showing a peak in 2015, despite only six months of activity. 30 of the 39 counties with unconventional wells in the state saw a peak in activity in 2013 or before.
Notes
The equations for the three trendlines are as follows:
Permits: y = -1.5128x + 303.81
Wells: y = -1.2939x + 158.95
Violations: y = -1.9334x + 127.53
The lowest actual value for each category are as follows:
Permits: 117, in July 2012
Wells: 43, in February 2015
Violations: 16, in August 2014.
https://www.fractracker.org/a5ej20sjfwe/wp-content/uploads/2015/07/PA-Down-Feature.jpg400900Matt Kelso, BAhttps://www.fractracker.org/a5ej20sjfwe/wp-content/uploads/2025/09/2025-Wordmark-Logo.pngMatt Kelso, BA2015-07-08 14:44:562020-07-21 10:30:04Unconventional Drilling Activity Down In Pennsylvania
Sea otters, an endangered keystone species, are at risk due to offshore oil and gas drilling spills. Along the west coast of the U.S., this marine mammal’s habitat is commonly near offshore drilling sites, specifically in California and Alaska.
Sea Otters – a Keystone Species
Sea otter numbers used to range from several hundred thousand to more than a million. Today, there are estimated to be just over 106,000 in existence worldwide, with fewer than 3,000 living in California. Their habitats range from Canada, Russia, Japan, California and Washington, but the majority of all wild sea otters are found in Alaskan waters.
Sea otters play a significant role in their local environments, and a much greater ecosystem role than any other species in their habitat area. Sea otters are predators, critical to maintaining the balance of the near-shore kelp ecosystems, and are referred to as keystone species. Without this balancing act, coastal kelp forests in California would be devoured by other aquatic life. Sea otter predation helps to ensure that the kelp community continues to provide cover and food for many of the marine animals. Additionally, kelp plays a tremendous role in capturing carbon in the coastal ecosystems. In that sense, sea otters also inadvertently help to reduce levels of atmospheric carbon dioxide.
Oil Spills and their Health Implications
Recently, Alaska and California, home to a wide variety of marine life, have been popular areas for offshore oil and gas drilling, which may include the use of fracking to extract hydrocarbons. Oil spills are a great concern for the sea otter; unlike other marine animals that may be able to eventually rid themselves of the oil, contact with the oil causes the sea otters fur to mat, preventing insulation, which can lead to hypothermia. Additionally, the ingestion of toxic oil chemicals while cleansing their fur can cause liver and kidney failure, as well as severe damage to their lungs and eyes.
Because their numbers are low and their geographic location area is rather small compared to other sea otter populations, the California sea otter is especially vulnerable, and could be devastated by oil contamination.
Prince William Sound, Alaska
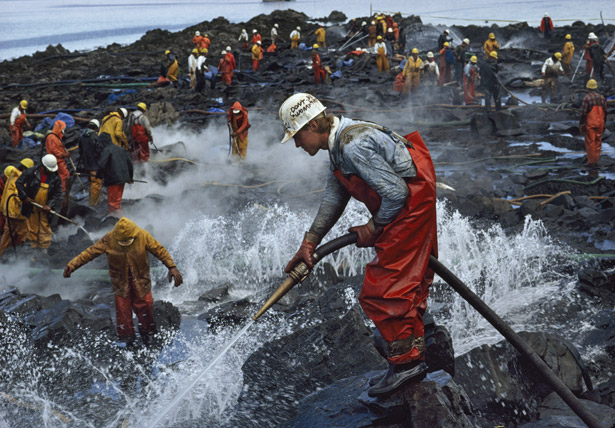
Exxon Valdez cleanup. Photograph by Natalie Fobes, National Geographic
On March 24, 1989, the tanker vessel Exxon Valdez ran aground on Bligh Reef in Prince William Sound, Alaska, spilling an estimated 42 million liters of Prudhoe Bay crude oil. This incident affected marine life throughout western Prince William Sound, the Gulf of Alaska, and lower Cook Inlet. An estimated 3500–5500 otters from a total population of about 30,000 may have died as a direct result of the oil spill. Oiling and ingestion of oil-contaminated shellfish may have affected reproduction and caused a variety of long-term sublethal effects. Necropsies of sea otter carcasses indicated that most deaths of sea otters were attributed to the oil, and pathologic and histologic changes were associated with oil exposure in the lung, liver, and kidney. Studies of long-term effects indicate that the sea otter population in the Prince William Sound area suffered from chronic effects of oil exposure at least through 1991. While some populations may recover after a spill, it would seem that the threat of oil pollution impacts is intensified for populations in deteriorating habitats and to those that are in decline.
Santa Barbara Coast, California
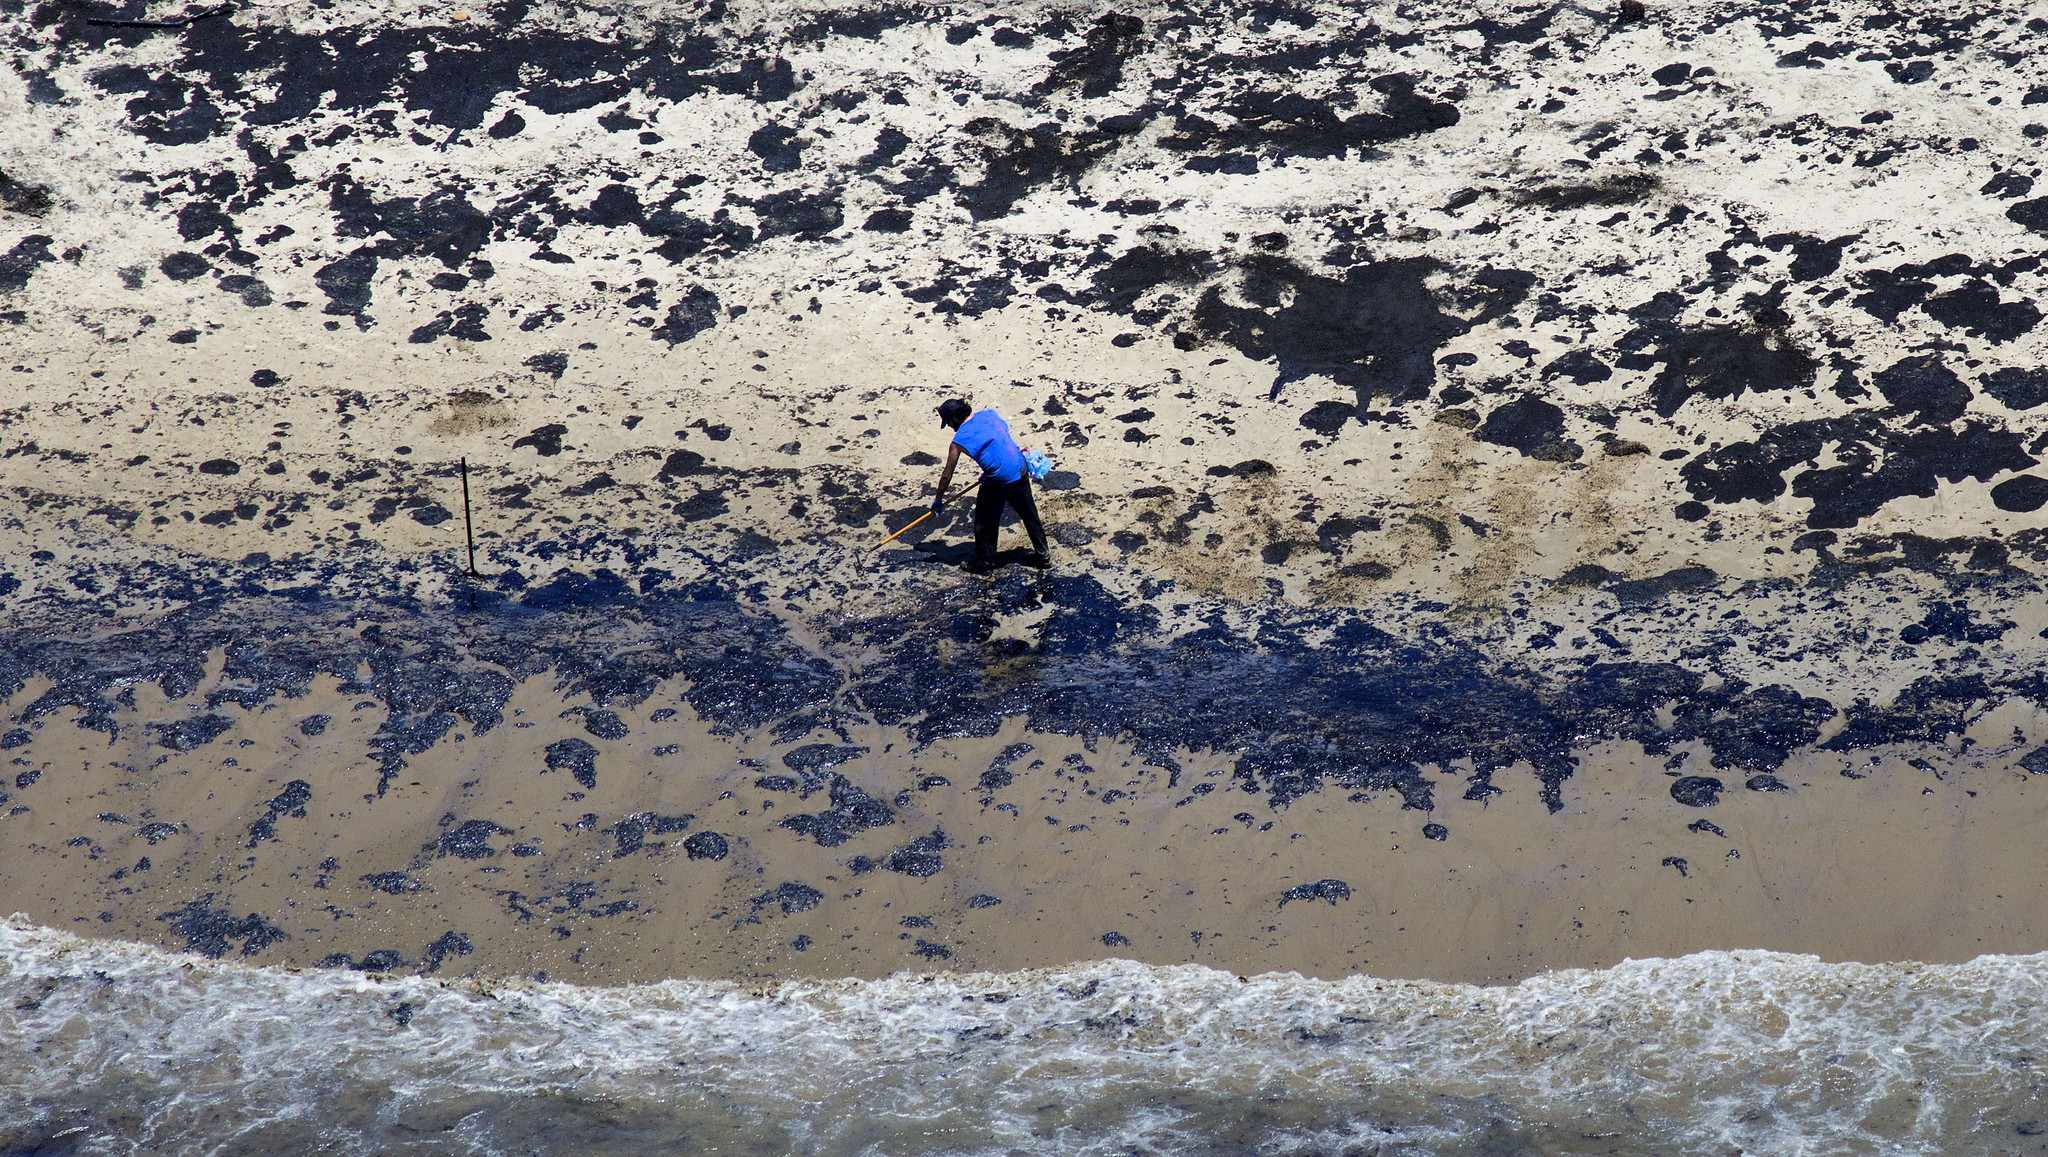
LA Santa Barbara Oil Spill Cleanup – Photo by: Brian van der Brug / Los Angeles Times
On Tuesday, May 19, 2015, a pipeline was found to be leaking into the Santa Barbara Coast in California. This broken pipeline, owned by Plains All American, spilled approximately 105,000 gallons of crude oil into the ocean, according to various news reports, stretching out into a 4-mile radius along the central California coastline.
These waters are home to an array of shore birds, seals, sea lions, otters and whales. Numerous amounts of marine life have been found washed up on the shore, including crabs, octopuses, fish, birds, and dolphins. Elephant seals, sea lions, and other marine wildlife have been taken to Seaworld in San Diego for treatment and recovery.
The Santa Barbara accident occurred on the same stretch of coastline as spill in 1969 that – at the time – was the largest ever incident in U.S. waters and contributed to the rise of the American environmental movement. Several hundred-thousand gallons spilled from a blowout on an oil platform, and thousands of seabirds were killed and numerous ocean wildlife, including sea lions, elephant seals, and fish perished.
Conclusion
Overall, the ocean is home to a great diversity of marine wildlife, all of which are vulnerable to oil contamination. Offshore gas drilling is a significant threat to the survival of sea otters and other marine life, wherein spills and accidents could cause health problems, toxicity, and even death. Oil spills are exceptionally problematic for sea otters, due to the vulnerable state of this animal and its endangered species state. Keeping keystone species healthy is instrumental to maintaining a well flourished ecosystem, while protecting habitats for a large array of marine and wildlife. The potential impacts on CA sea otters and other marine life due to events such as the 2015 oil spill in California should not be taken lightly.
https://www.fractracker.org/a5ej20sjfwe/wp-content/uploads/2015/06/Otter-Feature.jpg400900FracTracker Alliancehttps://www.fractracker.org/a5ej20sjfwe/wp-content/uploads/2025/09/2025-Wordmark-Logo.pngFracTracker Alliance2015-06-30 13:00:062025-05-02 14:45:36Offshore Oil and Gas Drilling: Risks to the Sea Otter
In Pennsylvania, the vast majority of unconventional oil and gas activity is focused on the Marcellus Shale formation, a Devonian period deposit of black shale with a high hydrocarbon content, which requires horizontal drilling and large scale hydraulic fracturing to produce enough oil and gas to make the drilling economically viable. This formation was created about 390 million years ago, when organic-rich deposits accumulated in what is now the Appalachian Mountains, but was at that time a shallow sea. Down below the base of the Marcellus lies the Utica Shale, an Ordovician period formation, with almost the same geographic extent as the Marcellus, but the deposits were placed there about 65 million years earlier.
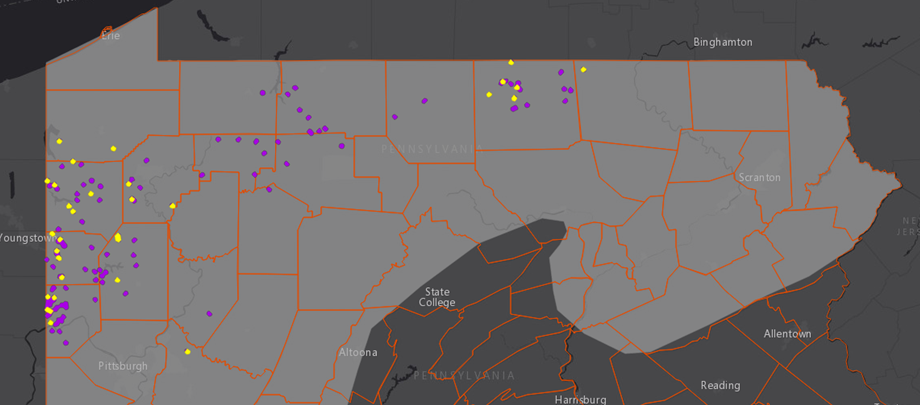
Utica permits and violations in Pennsylvania. Click here to access the legend and other map tools.
In neighboring Ohio, it is the Utica that gets most of the attention, with 937 permitted wells, as opposed to just 20 for the Marcellus. In Pennsylvania, the reverse is true: there are 16,110 permitted Marcellus wells, but only 279 permits for Utica wells. Part of the reason for this is because the subsurface characteristics of these formations vary widely, especially in terms of thickness and depth. With changes in depth come changes in temperature and pressure, which are key criteria in hydrocarbon formation. In other words, the same formation that produces considerable quantities of gas and valuable liquid hydrocarbons in eastern Ohio may be economically unviable just a county or two over in western Pennsylvania.
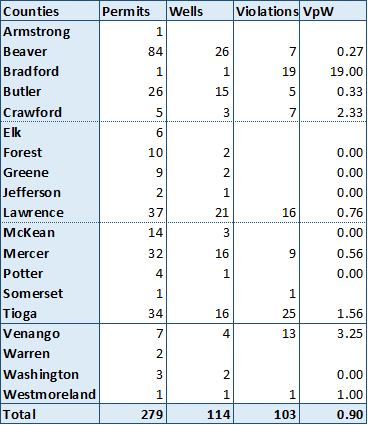
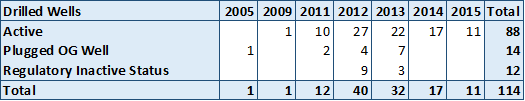
Utica shale permits, drilled wells, violations, and violations per well for Pennsylvania, through June 19, 2015.
Utica drilling permits have been issued in 19 different counties in Pennsylvania, with wells having been drilled in 15 of those. The violations per well (VpW) score for Utica wells in the Keystone State is 0.9, meaning that there are nine violations issued for every 10 wells that have been drilled. It is worth noting, however, that only 36 of the 114 drilled wells have received violations, meaning that some wells have been cited on multiple occasions.
Of particular note is Bradford county, the site of only one Utica well, but 19 items on the compliance report. The problematic Bayles 1 well was run by three different operators before being permanently plugged. This well also has two “Drill Deeper” permits, and as a result, it is likely that the first six violations assessed to this well were issued before it was associated with the Utica Shale, as they precede the most recent spud date for the well in June, 2005. Most of the violations for this well seem to be for pit violations and discharges to the ground and nearby stream.
Wells drilled into the Utica Formation in Pennsylvania, by year and current status.
In terms of drilling activity, it appears to have peaked in 2012, calling into question whether the industry considers the formation to be economically viable in Pennsylvania. Of the 28 wells drilled since the beginning of 2014, Tioga County has seen the most activity with 11 wells drilled, followed by five wells in Butler County, then three in Lawrence County. If we think of drilling activity as a sort of positive feedback from the industry – meaning that they like what they see and want to keep exploring – then only Tioga County seems to be holding the attention of the various operators who have been active in the Utica Shale. Given the Utica activity in Ohio, one might have thought that counties on the western edge of the state – especially Beaver, Lawrence, and Mercer – would have shown the most promise, but this appears not to be the case.
https://www.fractracker.org/a5ej20sjfwe/wp-content/uploads/2015/06/PA_Utica-crop.png405920Matt Kelso, BAhttps://www.fractracker.org/a5ej20sjfwe/wp-content/uploads/2025/09/2025-Wordmark-Logo.pngMatt Kelso, BA2015-06-23 14:52:012020-07-21 10:30:04Utica Drilling in Pennsylvania
Media outlets have been very focused recently on reporting oil train derailments and explosions. Additionally, the Keystone XL pipeline has hastened political debates and arguments for years by both political parties since its initial proposal in 2008 – and the May 19th pipeline oil spill in California isn’t helping matters. In the midst of all of this commotion, a million questions are being asked, yet no one can seem to reach a conclusion about what method of transporting oil is truly safest and economically feasible – or if we are just stuck between a rock and a hard place.
Some say the solution to this problem is transporting the volatile crude via pipelines, while others believe it is a matter of increasing regulations, standards, and compliance for transport by train. The answer is simply not simple.
In light of this, a few of the folks at FracTracker gathered some facts on pipelines vs oil trains to lay out this issue in a clearer fashion.
Let’s start with trains.
Benefits
Due to the increasing demand of crude oil supply, there has been increasing activity in the transportation of crude oil by rail, which provides flexibility and quick transportation throughout the U.S. and its 115 refineries. Railroads are also willing to offer shippers shorter contracts than pipelines and other transportation methods, making them a more favorable method of crude oil transportation.
In 2008, U.S. freight trains were delivering somewhere from 9-10,000 carloads of crude oil. In 2013, they delivered roughly 435,560 carloads of crude oil, showing a 20-fold increase in crude oil shipments.
Risks
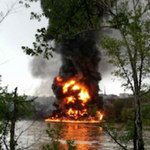
Oil trains, as well as pipelines, can pose a detrimental risk to communities and public health in the case of an explosion and/or spill. Danger Around the Bend describes in detail the dangers of transporting Bakken Formation crude oil from North Dakota to parts all over the country.
Some of the risks of transporting volatile crude via train have been clearly depicted in the news with announcements of spills, derailments, and explosions in urban and suburban areas, putting many people in harm’s way. Despite the decrease in spills between 1996 and 2007, devastating train accidents like the one on July 6, 2013 have raised questions about the safety of transportation by train.
Trains and train tracks in general can be very dangerous, as demonstrated by the deadly Amtrak train derailment in Philadelphia this May. The total number of incidents in 2014, according to the Federal Railroad Administration, sum up to 11,793 – with 818 of those being fatal. These fatalities have been linked to a range of possible causes, but the numbers depict the gravity of safety issues within the railroad regulations.
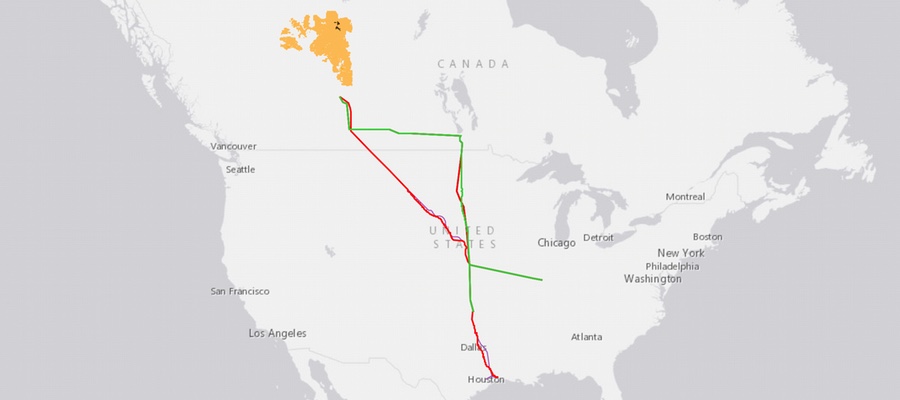
As we all know, finishing the Keystone XL pipeline has stirred years of controversy, since this project was initially proposed back in 2008. On January 31, 2014, the U.S. Department of State released the Final Supplemental Environmental Impact Statement (SEIS) of the Keystone XL Pipeline, which would transport up to 830,000 barrels of tar sand oil per day through an 875-mile long pipeline running from Alberta, Canada, to the Gulf Coast area. Below we have mapped the current and proposed tracks of the Keystone, along with the numerous ports, refineries, and rail lines:
The Keystone XL, Alberta oil sands, North American oil refineries and associated ports. View fullscreen and click Details for the metadata behind this map.
The SEIS discussed the impacts that the proposed pipeline would have on the environment and public health based on research, modeling, and analysis. One of the many purposes of the SEIS is to focus on whether the proposed project serves the national interest by comparing the risks to the benefits – discussed in more detail below.
Risks
The current risks associated with pipelines are similar to the risks associated with other modes of transporting oil across the United States. Oil spills are among the highest risks, but with the XL pipeline, it’s a more profound risk due to the type of oil being carried: tar sand oil. Tar sand oil, also known as heavy oil, is known for its tedious processing and its many environmental implications. Burning one single barrel of oil produced from Canadian tar sands generally emits 170 pounds of greenhouse gases into the atmosphere. It also requires large amounts of energy and water, much of which cannot be recycled, to separate the oil from the tar sands and transform the oil into a form of petroleum that can be processed by refineries.
According to the final SEIS:
The proposed project would emit approximately 24 million metric tons of carbon dioxide per year during the construction period (up to three times as much than producing conventional crude), which would be directly emitted through fuel use in construction vehicles and equipment as well as land clearing activities including open burning, and indirectly from electricity usage.
Additional risks associated with the XL pipeline include potential groundwater contamination of major aquifers – particularly the Ogallala Aquifer – as well as deforestation, habitat destruction, and fragmentation.
In the event of an oil spill from the Keystone XL or other pipelines crossing the U.S., the responsibility for who cleans it up does not fall on TransCanada. According to a report from the Natural Resource Defense Council (NRDC), tar sand oils are exempt from paying into the Oil Spill Liability Trust Fund. Amendments that would require TransCanada to pay the 8-cent-per-barrel fee to the fund have not been passed.
Devastating oil spills such as the one in Santa Barbara in mid May reflect the impact it not only has on wildlife, but on the local culture, especially on those who depend on fisheries and whose lives revolves around surfing in the brisk waters of the Pacific Ocean. 21,000 gallons of crude oil covers roughly 4 miles of Santa Barbara’s coast now, extending about 50 yards into the water.
Benefits
Jobs, jobs, jobs. The economic stimulus is one purported advantage to the XL pipeline. During construction, proposed project spending would support approximately 42,100 jobs, directly and indirectly and around $2 billion in earnings throughout the US, according to the final SEIS. Despite different job creation estimates, any number will contribute significantly to the US gross domestic product, associating a huge economic growth with the construction of the proposed XL pipeline. (TransCanada estimates around 13,000 construction jobs and 7,000 manufacturing jobs, which is about 3 times higher than the State Department’s estimate.) In addition, the cost of paying for the Keystone XL project ($3.3 billion) would not be placed on the U.S. but on Keystone.
According to the Pipeline and Hazardous Materials Safety Administration (PHSMA), the industry and their operators have reduced the risk of hazardous materials transportation incidents with death or major injury by 4% every 3 years, and since 2002, they have reduced the risk of a pipeline spill with environmental consequences by an average of 5% per year.1
Still, there is more work to be done. Safety issues that the pipeline industry is aiming to fix include:
Infrastructure: Repair obsolete pipeline infrastructure through a pipeline integrity management program and investigate new technologies that can detect pipeline risks.
Improving human error and safety culture: Increase the focus on safety beyond compliance standards and evaluate the potential value of safety management systems.
Adding secondary containment: Limit the spread of HAZMAT in the event of a failure in the primary container, and improve leak detection.
Transparency: Increasing transparency for companies and their accountability
Check out the infographic below for a summary of all of these pros and cons:
Moving Forward
All methods of transporting oil present various risks and benefits based on the available data. Explaining both sides of this coin allows us to assess each method’s impacts on our economy, environment, and public health. Through these assessments, we can make more informed decisions on what truly serves the nation’s interests. Oil and gas transport is a dangerous business, but all transportation industries are improving their management programs and increasing their regulations to provide citizens peace of mind and the safety they deserve. In light of ongoing issues, however, some would ask if these risks are even necessary.
For example, the growth of safer energy resources such as solar energy would significantly cut down the risks mentioned above in addition to providing jobs and stimulating the overall economy. According to the Bureau of Labor Statistics and the Solar Foundation, the growth in direct industry jobs for solar has outweighed oil and gas for the past 3 years. In 2014, new jobs created for the solar industry were more than twice the jobs created for the oil and gas industry. Based on 2014’s economics, Kepler Cheuvreux stated that all renewables are already more competitive than oil priced at $100 per barrel — This is because renewables have a higher net energy return on capital invested (EROCI).
As a reader and a citizen, it is important to know the pros and cons of the current activities taking place in our country today. We must be aware of loopholes that may be putting our states, cities, or counties into harm’s way, as well as recognize alternative energy sources and regulatory oversight that lessen the threats that oil extraction and transport pose to our health and environment.
Footnote
1. These statistics are based from the Census Bureau analysis and Bureau of Transportation Statistics as of July 2012.
https://www.fractracker.org/a5ej20sjfwe/wp-content/uploads/2015/04/Keystone-Apr2015.jpg400900FracTracker Alliancehttps://www.fractracker.org/a5ej20sjfwe/wp-content/uploads/2025/09/2025-Wordmark-Logo.pngFracTracker Alliance2015-05-26 11:00:222020-07-21 10:30:03Pipelines vs Oil Trains
By Randy Sargent, Carnegie Mellon CREATE Lab and Samantha Malone, FracTracker Alliance
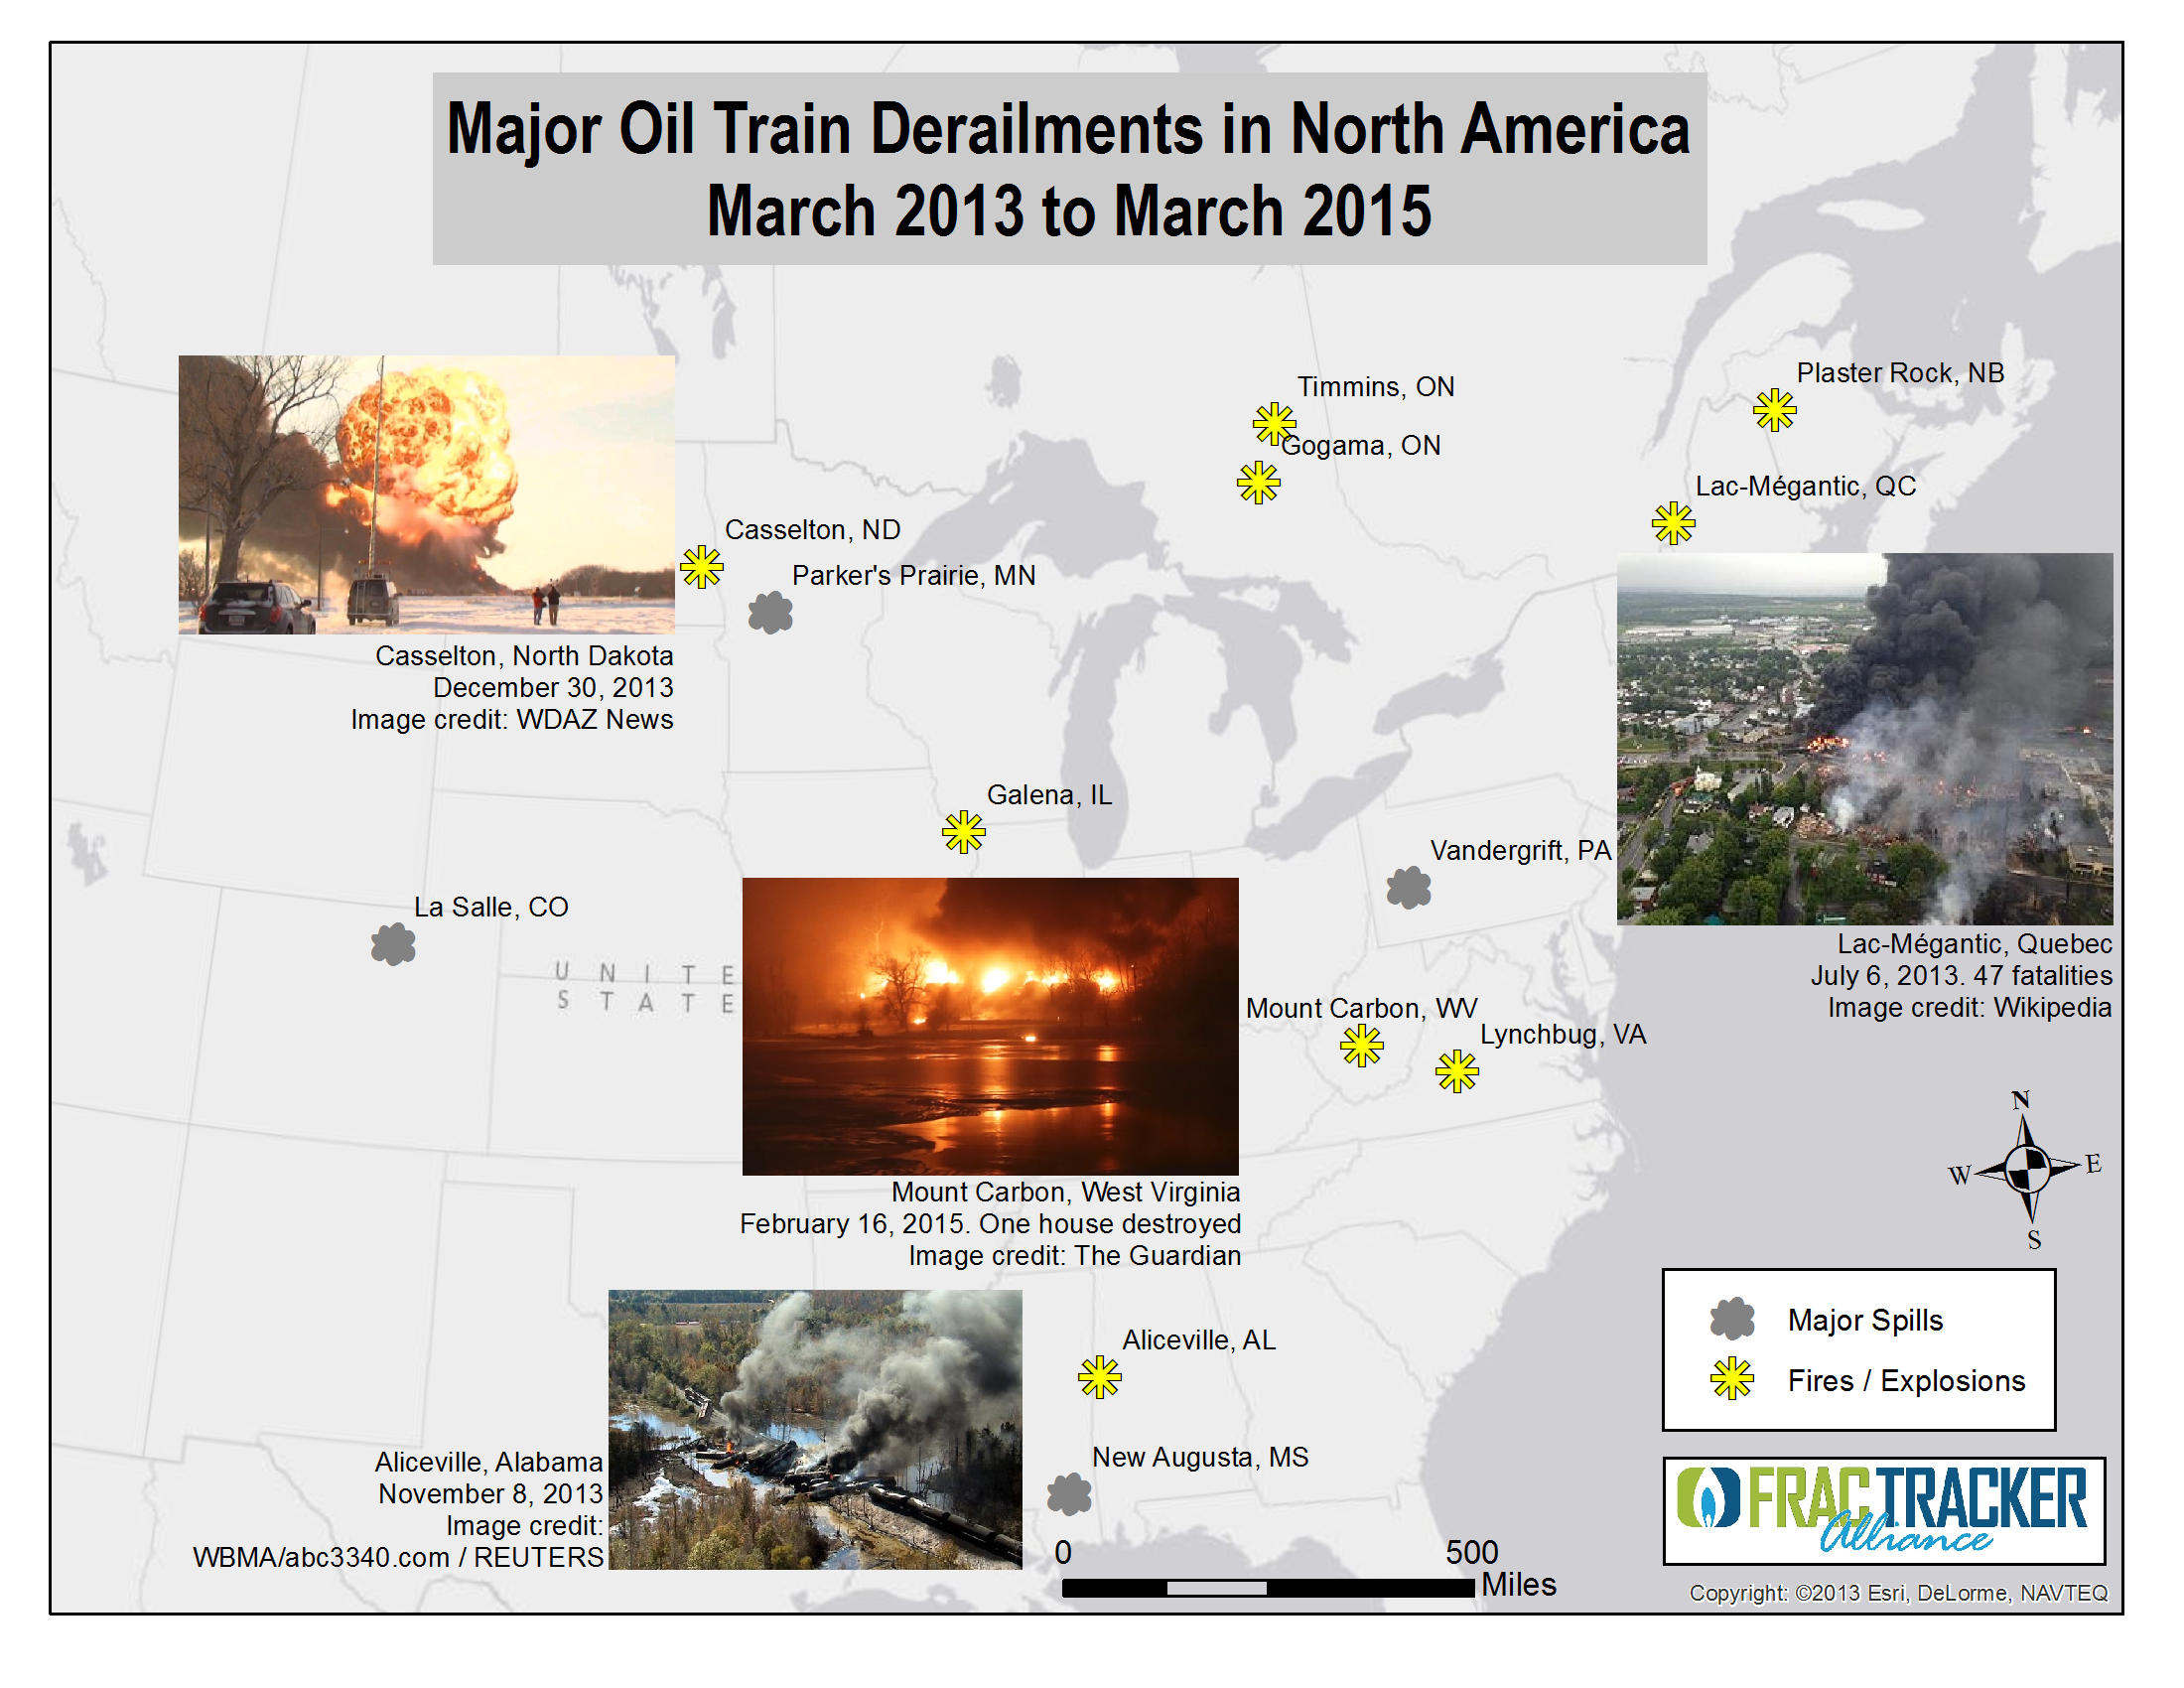
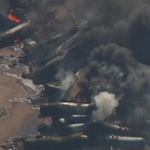
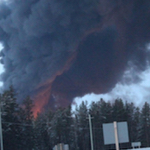
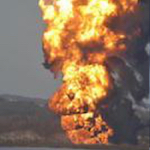
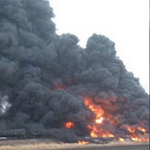
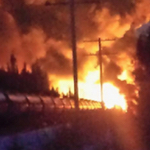
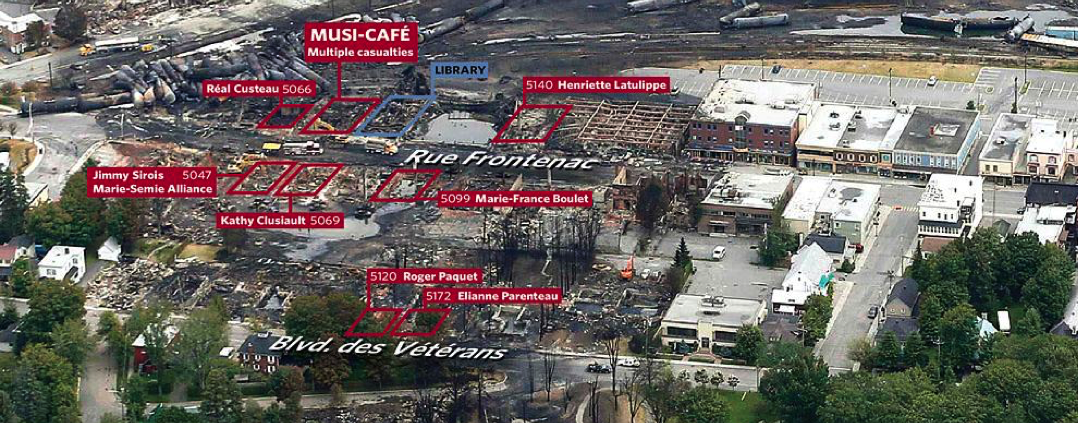
In the past two years, crude oil trains have exploded 10 times, killing 47 people.
Lac-Mégantic, Quebec: 47 killed
Outside Plaster Rock, New Brunswick
Outside Casselton, ND
Outside Aliceville, AL
Outside Lynchburg, VA
Outside Mt. Carbon, WV
Outside Timmins, Ontario
Outside Galena, IL
Outside Heimdal, ND
Outside Gogama, Ontario
It could have been much worse. Eight of the ten trains exploded in rural areas. The train that flattened half the business district of the small town of Lac-Mégantic might have killed hundreds of people if it had exploded during business hours.[1] Residents in Philadelphia have dodged a bullet several times already; they’ve seen two oil train derailments there that fortunately did not explode. And last week’s Amtrak train derailment in Philadelphia that killed 8 people and injured more than 200 could have been much worse, had it impacted an oil train in that area.
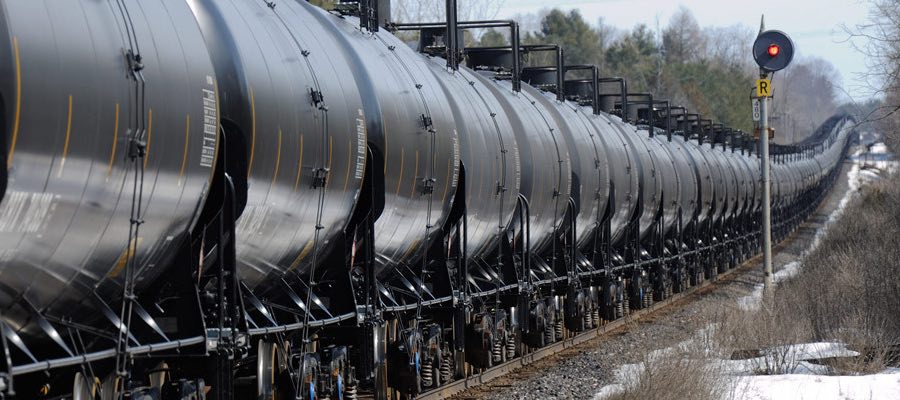
Today we ship 17 times as much oil by rail as we did in 2010. This past year we shipped 14.5 billion gallons of oil — that’s 6,700 oil trains the size that destroyed Lac-Mégantic:
This chart above and the ones that follow are derived from the U.S. Energy Information Administration’s recently provided data tracking crude oil movements by rail.
Why do oil trains explode so easily?
Like a carbonated beverage with dissolved CO2, oil extracted from Bakken wells naturally has lighter hydrocarbons in it, such as methane, ethane, propane, and butane. Methane — natural gas — is the lightest of the gases and boils out quickly at surface pressure. But ethane, propane, and butanes, known as light ends or natural gas liquids in the oil industry, take time and/or heat to boil out.[2]
In the most prolific oilfield in the U.S. today, North Dakota’s Bakken formation, most of light ends are left in the oil before loading on the train, to maximize value of what is sent to the refinery. But much like a soda bottle, the pressure increases with temperature and motion, with pressurized ethane, propane, and butane at the top. With those highly volatile gases under pressure, all it takes to create an explosion is a leak and a spark, and both commonly happen in a derailment or collision.
All ten exploding crude trains carried oil from the Bakken.
Bakken trains travel through much of the US and Canada, heading to refineries on the coasts. Increasingly, they are traveling to East coast refineries, which now handle over half of Bakken crude oil production.
Closer to home for the authors, Pittsburgh is a popular waypoint for Bakken oil trains. Known for its steel industry in the 20th century, Pittsburgh continues to sport a large rail infrastructure. Its rails go through very densely populated areas, a good thing when the rails carried ore and steel and coal for the mills. But it’s a disaster waiting to happen now that the rails are bringing explosive oil trains through the city.
Oil and compressed gasses transit Carnegie Mellon University multiple times daily, Pittsburgh, PA
Oil trains travel across Pittsburgh’s North Shore and Downtown multiple times daily, as well
A significant and growing fraction of Bakken oil trains carrying 1 million gallons or more transit Pittsburgh, with ~30 a week based on Pennsylvania Emergency Management Agency data released for five days in October 2014. Prior to the disclosure, volunteers spent a day with us in 2014 recording traffic along one of several routes into the city to learn more about whether / how the trains might pose a risk to city residents and workers. Learn more about what we found here.
Why does this matter?
As crude-by-rail traffic continues to increase, it is only a matter of time before an oil train explodes in a populated area again. Imagine any of the 10 explosions so far taking place instead in downtown Philadelphia or Pittsburgh, or flattening a school in suburban Chicago, for example.
Map of Lac-Mégantic destruction from the Toronto Star’s article, Where they died. Click to explore the interactive map.
One attempt to make these trains safer, by requiring new tanker cars be built to a safer standard, does not appear to have helped; the most recent 5 exploding trains used the newest, “safer” tanker cars.
But there are effective measures that are in our power to take:
If you are concerned about these oil trains, please engage in the democratic process and tell your representatives and friends what you think. The Department of Transportation regulates interstate rail traffic. And local governments can be effective in rerouting traffic, as we’ve seen in St. Louis.
By Kyle Ferrar, Western Program Coordinator, FracTracker Alliance
Incidents in California involving oil-by-rail cars increased from 3 in 2011 to 25 in 2013. There were 24 incidents within the first 6 months of 2014, and oil spills from rail cars increased from 98 in 2010 to 182 in 2013.1 With such an increase in oil train incidents, we have to ask what the state is doing to protect public safety.
CA Crude Oil by Rail – The Status Quo
California is currently far behind states like New Hampshire and Minnesota that have taken more control over in-state hazards, and have passed laws aimed at forcing rail and pipeline companies to abide by more rigorous emergency response measures instead of relying on the federal government and undertaking state-level spill response plans. These state movements are in response to the existing federal oversight, which critics cite as inadequate.2
State environmental health officials have acknowledged the dangers of a derailment, but have downplayed the risk – comparing the hazard of an incident to be similar to ethanol or gasoline, based on volatility. They do not believe oil train derailments are as hazardous as other materials transported by rail such as chlorine or ammonia. The bigger concern, though, is the huge volume of Bakken crude oil that is being shipped by rail. A recent report by the State of California Interagency Rail Safety Working group acknowledged this and identified key vulnerabilities along CA rail lines; Destinations of the crude trains in CA are the Bay Area via the Feather River or Donner Pass, Bakersfield via the Tehachapi Pass, and Los Angeles via the same route. These routes pass through the state’s most densely populated areas, as well as through some of the state’s most sensitive ecological areas, and each route has at least one high hazard area for derailments. Other issues identified include the impact of earthquakes on trains and rail lines and a shortage of emergency response capacity.
At-Risk Populations
A recent report by the Natural Resources Defense Council used census data to identify at risk-populations for communities living near the rail lines that can be used for transporting shipments. The analysis identified a total of nearly four million people in the Bay Area and the Central Valley alone that live within 1 mile (the U.S. DOT isolation zone for a crude tanker fire) of a crude shipment rail line. The authors go on to provide the following recommendations to prevent crude oil train accidents:
Remove Defective, Dangerous Tankers from Crude by Rail Service
Impose Safer Speed Limits
Reroute Around Sensitive Areas
Provide Emergency Responder Resources
Make Additional operational Safety and Oversight Improvements
Exercise Local Government Powers4
Crude Oil Shipment Trends
Support of these recommendations is most important as more crude shipments in CA are on the horizon. A recent permit application by the Phillips 66 oil company included a proposal to use Amtrak passenger lines to transport Bakken crude through the San Francisco Bay Area. A review of the proposal by Hinman Consulting Engineers found that over the next 30 years, there is an approximate 28% risk of derailment in the heavily populated stretches of Berkeley, Emeryville, Oakland, Santa Clara, San Jose and others. This estimate is assuming there is no increase in shipping volumes. The damage of an accident was estimated by the researchers, and the analysis showed that approximately 47,000 households and $22 billion in improved property value lay within the projected blast zone, 1000 feet from the railway. A projection of the damage from a single accident estimated that an average of 117 households along with $244 million in property value could be destroyed. Hinman also stated that “this figure does not include loss of revenue, environmental cleanup costs, loss of human life, or other societal costs.”5 A proposal by Valero Refining Co. plans to ship 100 crude oil tank cars a day through downtown Sacramento and downtown Davis to Benicia.
Responses by CA Regulators and Railroads
To plan for this increase in rail traffic, Sacramento passed a shipping charge to prevent and manage spills that will result in $11 million in 2015. Another bill has been introduced to impose a second shipping fee on oil companies to train and equip first responders to deal with major spills and fires on railroad lines. An additional bill was also authored requiring rail carriers to communicate more closely with state emergency officials about crude oil rail movements.6
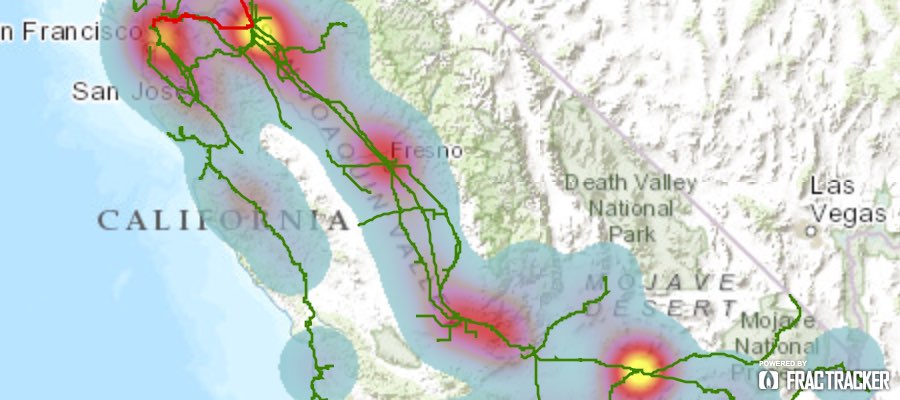
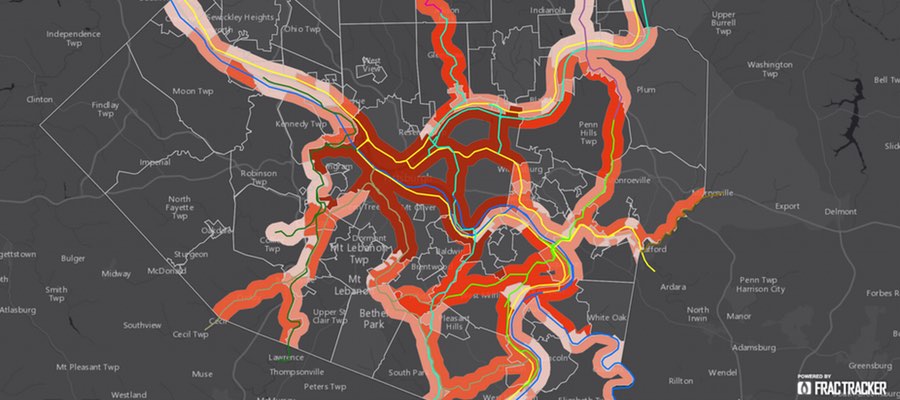
The map below shows where spills and train accidents have occurred in CA since 2011. When zoomed out the map shows areas with higher incidence rates of accidents, but when zoomed to a higher resolution the map differentiates the accidents by year.7
In the map above, a hot spot analysis shows the frequency of railroad accidents, such as derailments. Areas with the highest incidence rates are shown in yellow. The actual locations and descriptions with dates of these accidents can be seen by zooming in using the plus (+) button in the top left corner of the map, and clicking on a diamond symbol. Shown in red and green are the BNSF and other railroad lines used for the transportation of crude by rail.
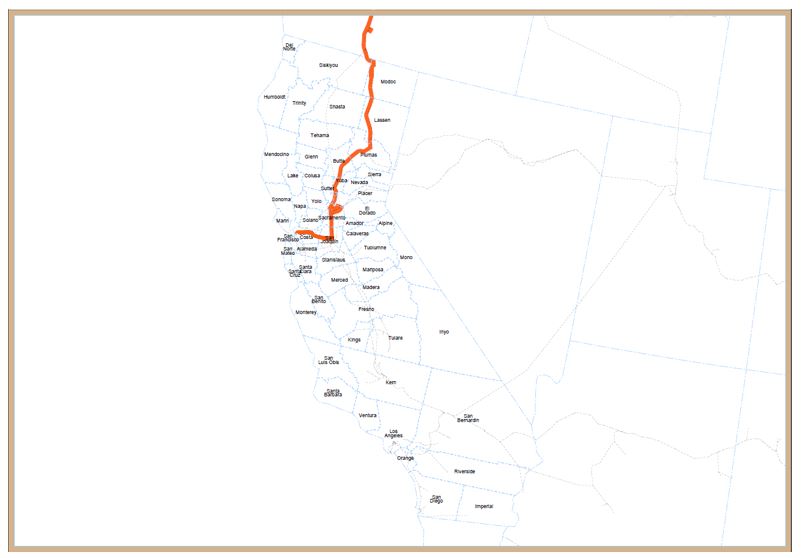
Figure taken from BNSF’s U.S. DOT disclosure to the state of California for emergency preparedness.9
From what little data has been released, it is clear that BNSF railway intends to ship two Bakken crude trains per week carrying more than one million gallons of crude through the CA counties of Butte, Contra Costa, Lassen, Modoc, Placer, Plumas, Sacramento, San Joaquin, and Yuba.8 The same information from Union Pacific Railroad has not been made public by the state of CA. The route shown in the figure to the right has been mapped in the FracTracker Alliance’s California Crude Shipment Routes and Railroad Accidents map above. From the map, you can see that there have been numerous accidents already on this BNSF rail line, particularly near Stockton and in the heavily populated North Bay Area.
Twice per year, the Pennsylvania Department of Environmental Protection (PADEP) releases its unconventional oil and gas production and waste reports, which is a good opportunity to check on what’s happening with the industry as a whole. In the past, FracTracker has analyzed this data as soon as it became available. That strategy proved to be a mistake, however, as it is common for some of the operators to release data after the deadline, meaning that early versions of the report can be incomplete. To mitigate the effects of late reporting, the data in this analysis was downloaded from the PADEP on March 10, 2015, several weeks after the reports were first published.
While the production and waste reports are released together, and appear together on the same map below, the FracTracker Alliance will analyze the data from these two reports in separate blogs, with this one focusing on PA’s unconventional production data.
PA Unconventional O&G Production and Waste – July 1, 2014 to December 31, 2014. Click here to access the full screen map, with legend, details, and additional controls.
Producing Wells
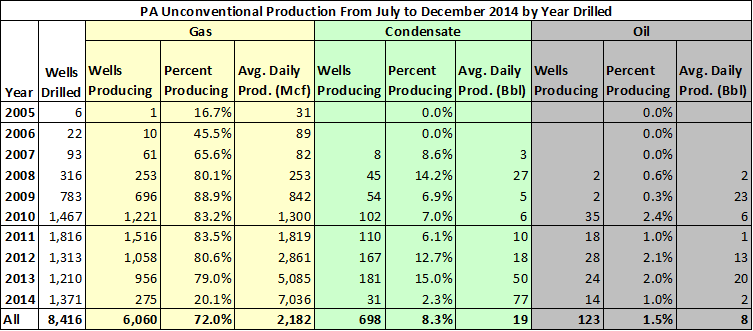
The production report lists the amount of gas produced per well in thousands of cubic feet (Mcf), as well as oil and condensate totals in 42 gallon barrels. Also included are the spud date and the number of days that each well produced in each of the three categories. This allows us to take a look at how the age of the well factors into its daily production rates:
Figure 1: Average daily production values for PA unconventional wells between July and December 2014, sorted by year well was spudded.
The average daily production values in Figure 1 were calculated from all wells reporting production for the given commodity type. For example, of the 1,467 wells on the report with a spud date in 2010, 1,221 (83.2%) of those produced some gas in the latest reporting period, and the average daily production of that group is 1,300 Mcf. Only 102 wells spudded that same year reported condensate production, averaging 6 barrels per day, and 35 wells produced oil, also averaging 6 barrels per day. It’s also worth pointing out that the majority of wells drilled last year were not yet in production for the reporting period.
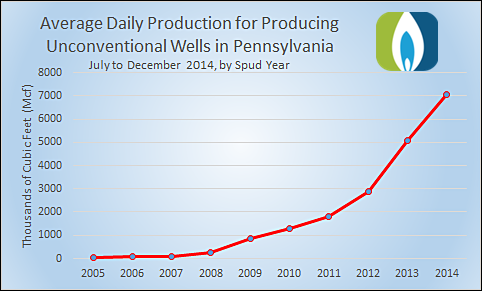
Wells drilled in 2013 produced 38% less gas than wells those drilled in 2014, and the newer wells are producing 4.4 times as much as wells drilled in 2010.
Figure 2: Average daily production (Mcf) for unconventional wells in PA between July and December 2014, sorted by spud year.
In Pennsylvania, gas production amounts are quite high, while liquid hydrocarbon returns are fairly modest. In this six month period, operators reported 2.13 trillion cubic feet of gas production, 2.1 million barrels of condensate, and 171 thousand barrels of oil. Over 71% of all oil was produced in Washington County in Southwestern Pennsylvania, while other counties in the western part of the state made up the rest of the production. Washington County also accounts for 94% of all condensate produced from the state’s unconventional wells.
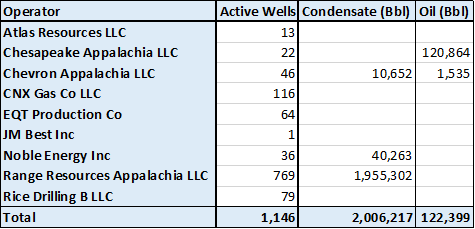
FracTracker wanted to see if there were any liquid production trends when we sorted the data by operator. Of the 1,146 active wells on the report in Washington County, 769 (67%) are operated by Range Resources Appalachia, LLC. Their wells produced 1,955,302 barrels (97%) of the condensate in the county, meaning that the remaining 377 wells from other operators produced a combined 50,915 barrels of condensate.
At first, it seems a bit anomalous that all of the other producers in the county should have such low a total for condensate. Some of this is likely attributable to defining the difference between condensate and oil. The way the data are presented, it seems as if they are two separate liquid hydrocarbon products. However, the difference really amounts to the liquid’s density, with heavier, thicker fluids considered to be oil, while condensates occupy the lighter, less viscous end of the spectrum. Condensate is also legal to export, while crude oil is not.
Figure 3: Oil and condensate production in Washington County from July to December 2014, by operator.
With this in mind, when we look at the liquid production in Washington County over the six month period, it seems likely that what Range Resources considered to be condensate was classified as oil by Chesapeake. The complete lack of liquid hydrocarbon production by any of the 259 wells operated by CNX, Rice, or EQT in the county does seem curious at first, but none of the three operators are active in any of the six municipalities reporting 100,000 or more barrels of liquids. Unconventional liquid hydrocarbon production in Washington County – and PA for that matter – is limited geographically, with the highest returns limited to a handful of municipalities close to the northern panhandle of West Virginia.
Unconventional wells reporting liquid production in Washington County from July to December 2014. Among unconventional wells in Pennsylvania, those in Washington County accounts for over 71% of oil production and 94% of condensate production.
Non-Producing Wells
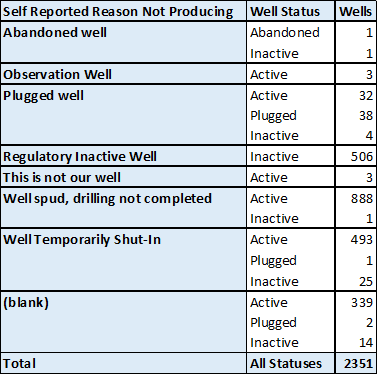
Figure 4: Spudded PA Unconventional wells not producing – July to December 2014
Altogether, there are 2,351 wells on the production report that are listed as spudded but are not producing any of the three commodity types. The report includes a section for operators to explain why there is no production, as well as data about the well’s status. The reason that the majority of these wells are not producing are relatively straightforward; they are either plugged, have an inactive status, are not yet complete, or are shut-in, awaiting a pipeline connection.
In prior discussions with PADEP, active wells were described to us as those that had been spudded and not yet permanently plugged. There are also some conditions that can put the well into an inactive status at the operator’s request, for up to five years.
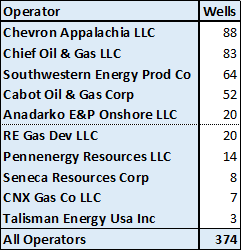
Figure 5: Operators with the most unconventional active wells that are not in production – excluding observation wells, those that were not completed during the reporting period, or those that are shut-in, awaiting additional infrastructure.
Still, there are a number of active wells that don’t fall into any of these categories, leaving us with no clear idea as to why they are not producing. The 10 operators with with the most active wells not in production – excluding observation, incomplete, and shut-in wells – are listed in Figure 5: Chevron, Chief, Southwestern, Cabot, and Anadarko.
Included in the statewide totals are three wells listed as having the incorrect operator, 32 wells where the reason for no production is listed as “Plugged well” but the well status is active, and 339 wells with active statuses where the reason for no production was left blank. Two operators, Chevron Appalachia and Chief Oil & Gas, account for 46% of these wells where the reason for non-production is uncertain.
https://www.fractracker.org/a5ej20sjfwe/wp-content/uploads/2015/03/Production-Feature.jpg400900Matt Kelso, BAhttps://www.fractracker.org/a5ej20sjfwe/wp-content/uploads/2025/09/2025-Wordmark-Logo.pngMatt Kelso, BA2015-03-26 12:11:532020-07-21 10:32:12A Closer Look at PA’s Unconventional Production Data
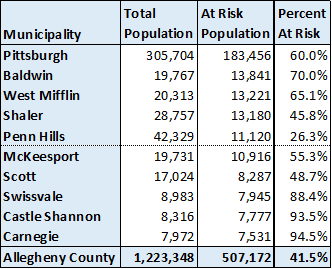
In a joint project with PennEnvironment earlier this month, we analyzed the number of people who live within a half-mile of active rail lines in Pennsylvania and are therefore potentially at risk of an oil train explosion similar to the recent ones in Lac-Mégantic, Quebec; Lynchburg, Virginia; and Mount Carbon, West Virginia. To take that project one step further, we have taken a closer look at the population near railroads in Allegheny County, the second most populous county in PA with over 1.2 million inhabitants. Of the various figures, we found that Pittsburgh has over 183,000 people that live with half-mile mile of an active rail line.
In Philadelphia, the city’s boundary takes up the entire county of the same name, but in Allegheny County, the municipal boundaries are considerably more fractured. In fact, Pittsburgh is just one of 130 municipalities in Allegheny County; its 305,704 inhabitants represent just 25% of the residents in the county, and 13% of the metropolitan area. For the sake of simplicity, residents from the various cities, boroughs, and townships in the county will often say they are from Pittsburgh when speaking with people from outside the region, although they might actually live in Blawnox, McKees Rocks, or Swissvale, for example.
Estimated population within a half-mile of active rail lines in Allegheny County, PA. Click here to access the legend and other map tools.
Here is a list of the top ten municipalities with the largest estimated population in the at-risk zone:
Municipalities in Allegheny County with the largest estimated population within a half-mile of railroads.
Not surprisingly, the most at-risk municipality in Allegheny County is Pittsburgh, with over 183,000 people living within a half-mile of an active rail line. During any given workday, when individuals flock into the city, even more individuals would theoretically be at risk of an oil train disaster. Following Pittsburgh, Baldwin, West Mifflin, and Shaler all share similar numbers at risk, with Baldwin seeing the greatest percentage of its population at risk of the three. While Castle Shannon and Carnegie have lower populations than the other municipalities, a significant proportion of their residents (93-95%) are near rail lines.
https://www.fractracker.org/a5ej20sjfwe/wp-content/uploads/2015/03/AlleghenyCo-Train.jpg400900Matt Kelso, BAhttps://www.fractracker.org/a5ej20sjfwe/wp-content/uploads/2025/09/2025-Wordmark-Logo.pngMatt Kelso, BA2015-03-17 11:45:092020-07-21 10:32:11Population Near Railroads in Allegheny County, PA
The US Food, Energy, Water Interface Examined By Ted Auch, Great Lakes Program Coordinator
With the emergence of concerns about the Food, Energy, Water (FEW) intersection as it relates to oil and gas (O&G) expansion, we thought it was time to dig into the numbers and ask some very simple questions about organic farms near drilling. Below is an analysis of the location and quantity of organic farms with heavy drilling activity in Ohio and nationally. Organic farms rely heavily on the inherent/historical quality of their soils and water, so we wanted to understand whether and how these businesses closest to O&G drilling are being affected.
Key Findings:
Currently 11% of US organic farms are within US O&G Regions of Concern (ROC). However, this number has the potential to balloon to 15-31% if our respective shale plays and basins are exploitated, either partially or in full,
68-74% of these farms produce crops in states like California, Ohio, Michigan, Pennsylvania, and Texas,
Issues such as soil quality, watershed resilience, and water rights are likely to worsen over time with additional drilling.
Methods
To answer this broad question, we divided organic farms in the United States into three categories, depending on whether they were within the:
Core (O&G Wells < 1 mile from each other),
Intermediate (1-3 miles between O&G Wells), or
Periphery (3-5 miles between O&G Wells) of current activity or Regions of Concern (ROC).1
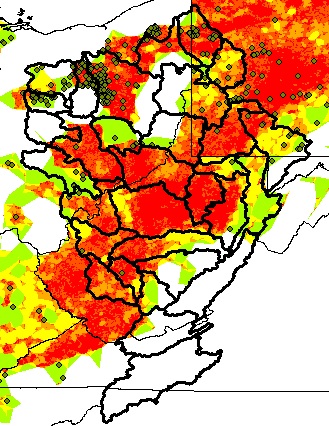
Additionally, from our experience looking at O&G water withdrawal stresses within the largely agrarian Muskingum River Watershed in OH we decided to add to the ROCs. To this end we worked to identify which sub-watersheds (5-10 miles between O&G Wells) and watersheds (10-20 miles between O&G Wells) might be affected by O&G development.
Together, distance from wells and density of development within particular watersheds make up the 5 Regions of Concern (ROCs) (Table 1).
Table 1. Five ROCs under this investigation and what they look like from a mapping perspective
Label
Distance Between Wells
Mapping Visual
Core
< 1 mi
Intermediate
1-3 mi
Periphery
3-5 mi
Sub-Watershed
5-10 mi
Watershed
10-20 mi
We generated a dataset of 19,515 US organic farms from the USDA National Organic Program (NOP) by using the Geocode Address function in ArcGIS 10.2, which resulted in a 100% match for all farms.2
We also extracted soil order polygons within the above 5 ROCs using the NRCS’ STATSGO Derived Soil Order3 dataset made available to us by Sharon Whitmoyer at the USDA-NRCS-NSSC-Geospatial Research Unit and West Virginia University. For those not familiar with soil classification, soil orders are analogous to the kingdom level within the hierarchy of biological classification. Although, in the case of soils there are 12 soil orders compared to the 6 kingdoms of biology.
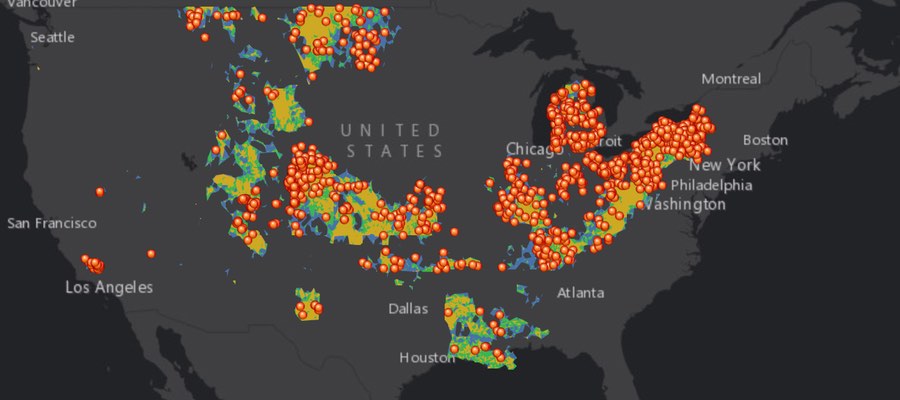
The National Organic Farms Map
This map shows organic farms across the U.S. that are located within the aforementioned ROCs. Data include certifying agent, whether or not the farm produces livestock, crops, or wild crops along with contact information, farm name, physical address, and specific products produced. View map fullscreen
National Numbers
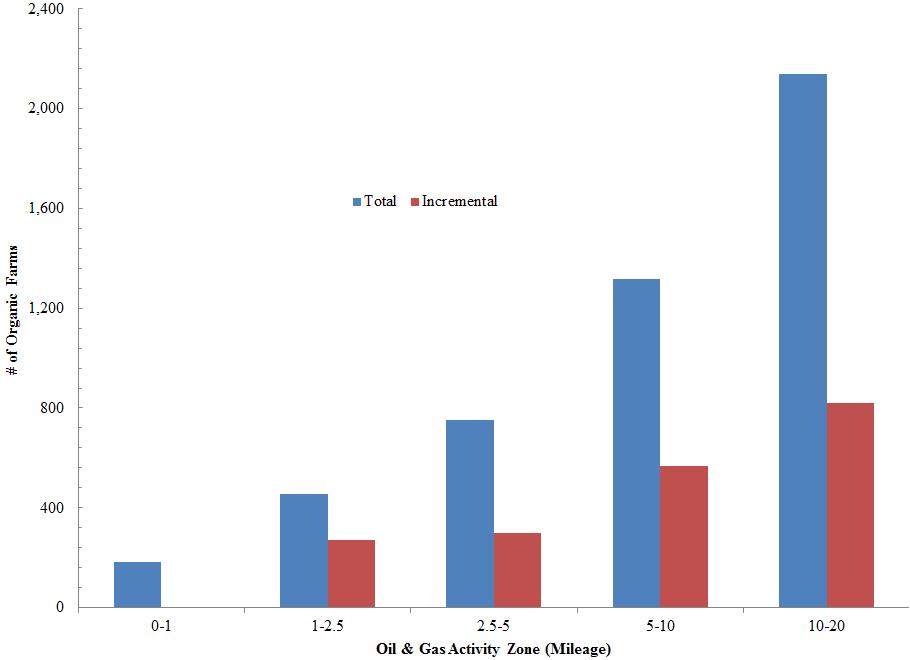
Figure 1. Total and incremental number of US organic farms in the 5 O&G ROCs.
Nationally, the number of organic farms near drilling activity within specific regions of concern are as follows (as shown in Figure 1):
Watershed O&G ROC – 2,140 organic farms (11% of North American organic farms)
Sub-Watershed O&G ROC – 1,319
Periphery O&G ROC – 752
Intermediate O&G ROC – 455
Core O&G ROC – 183
Ohio’s Organic Farms Near Drilling
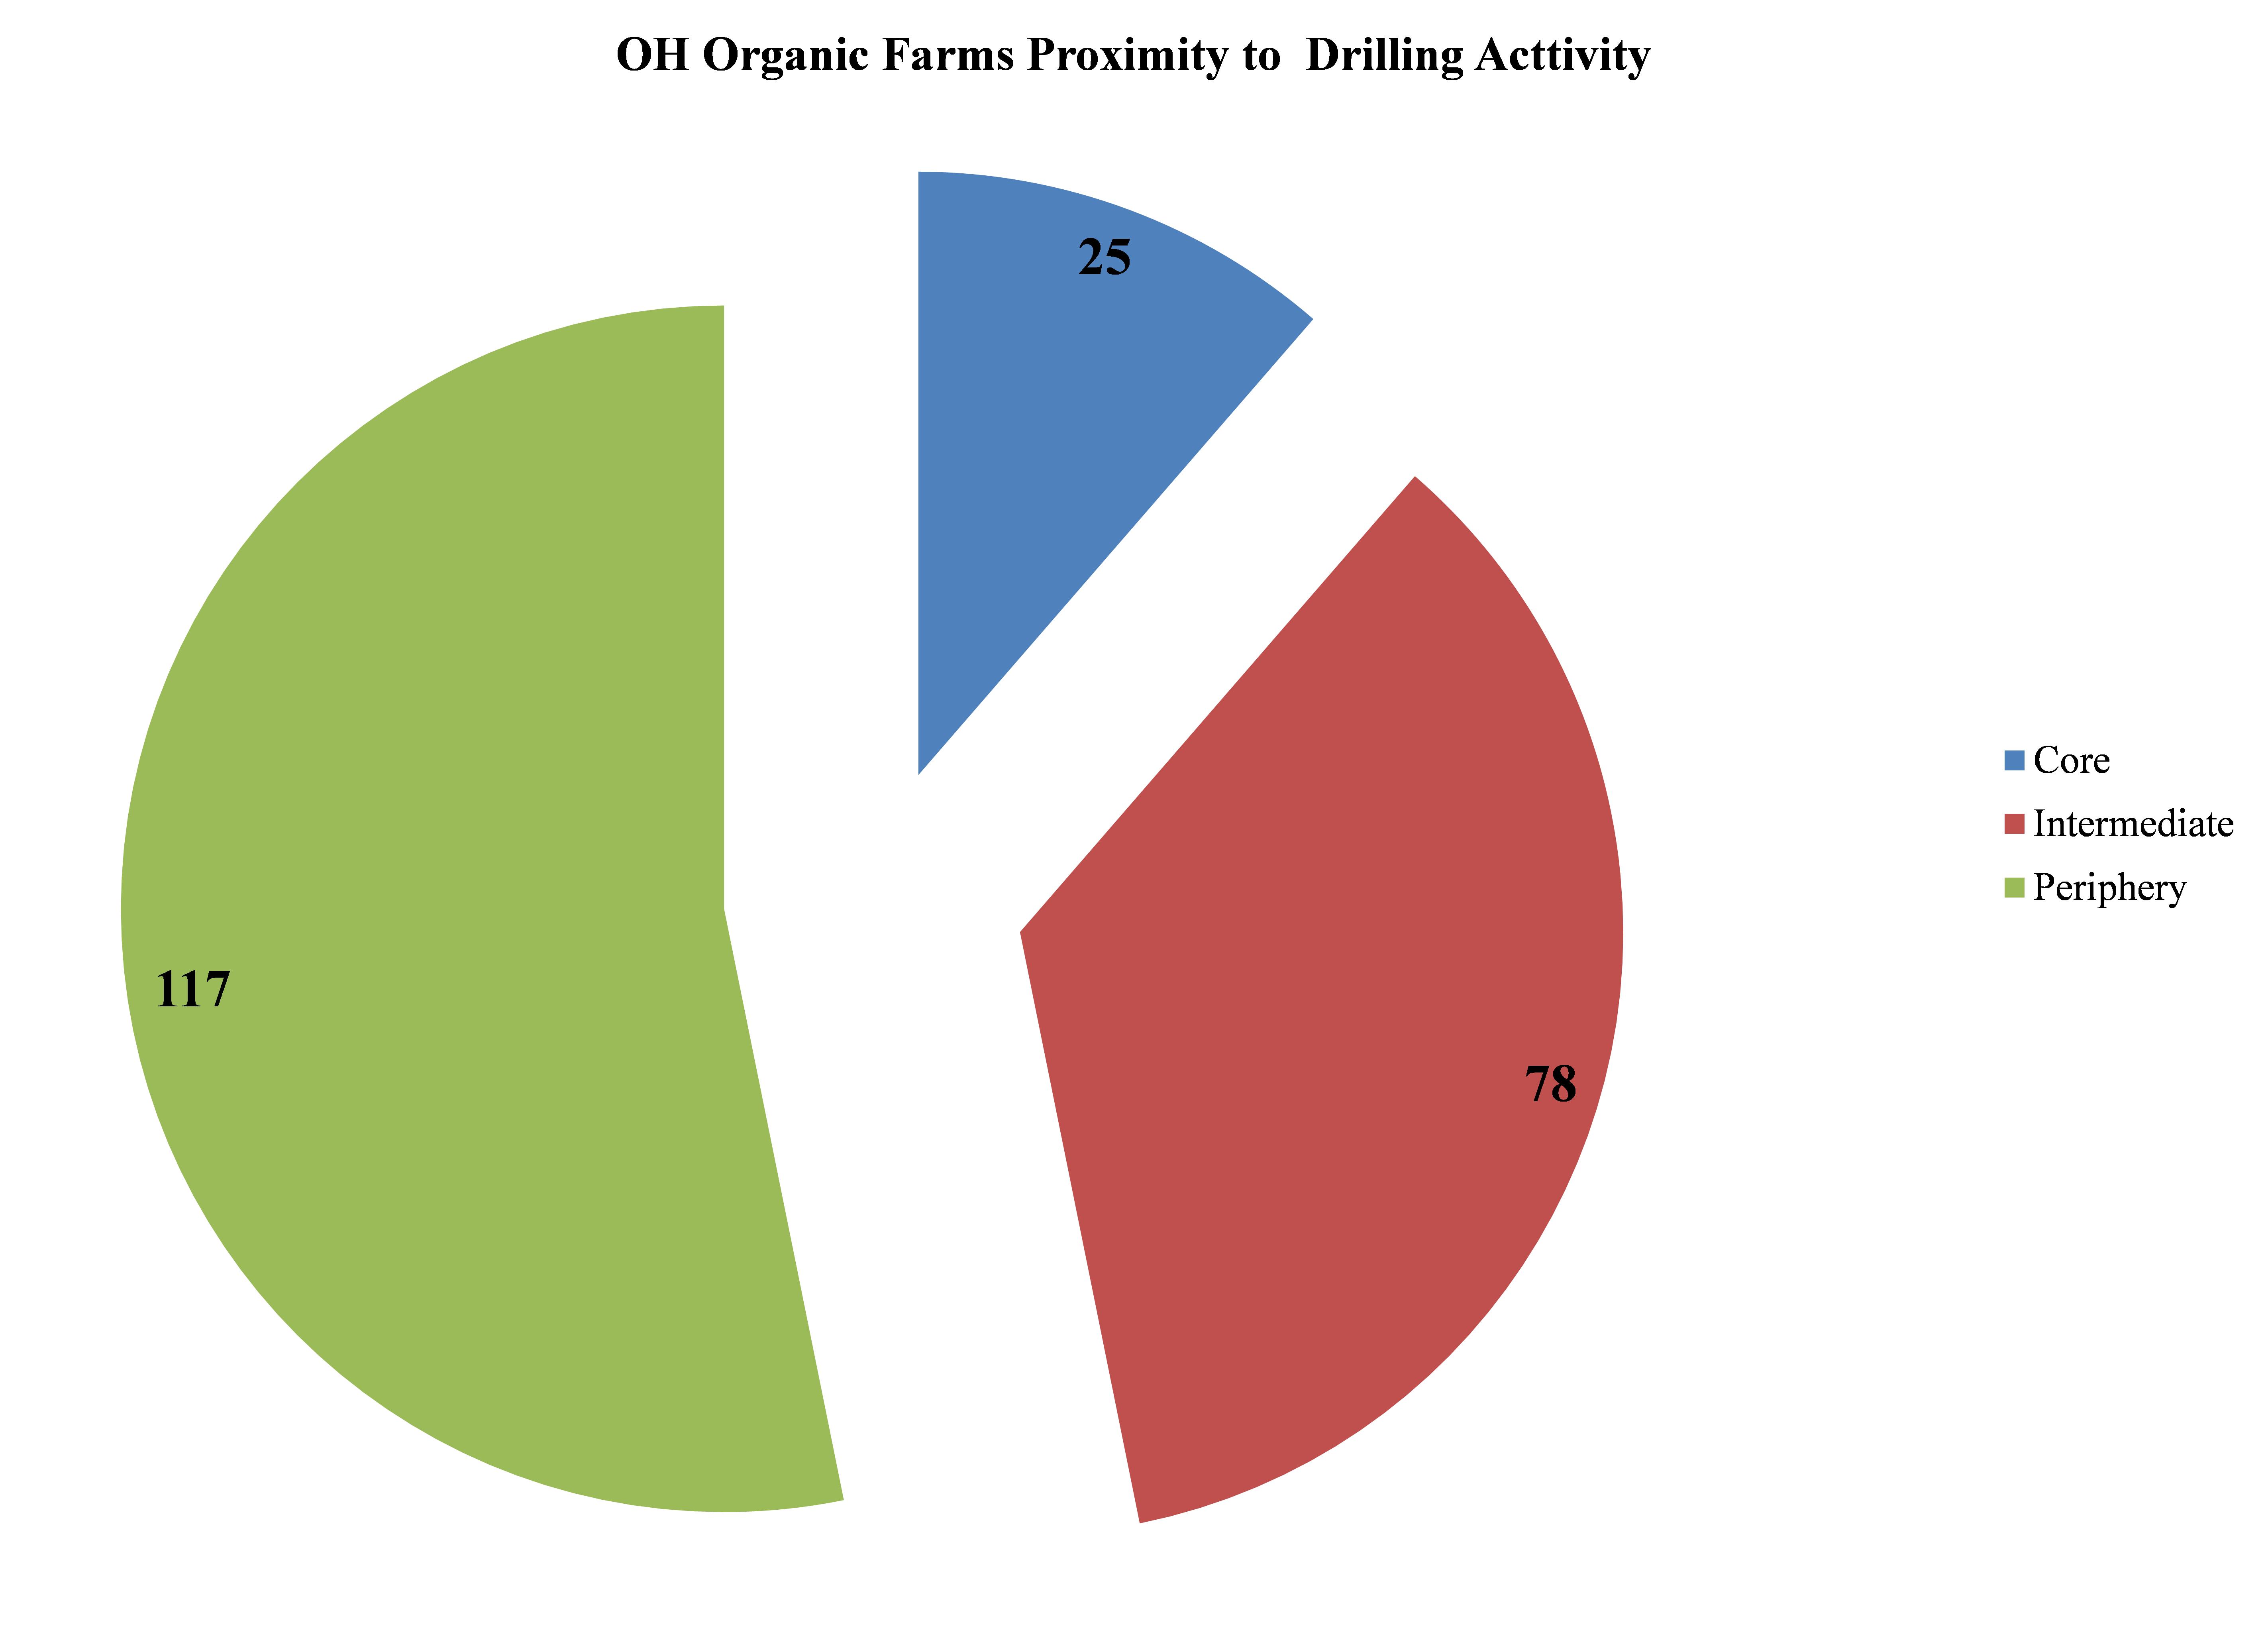
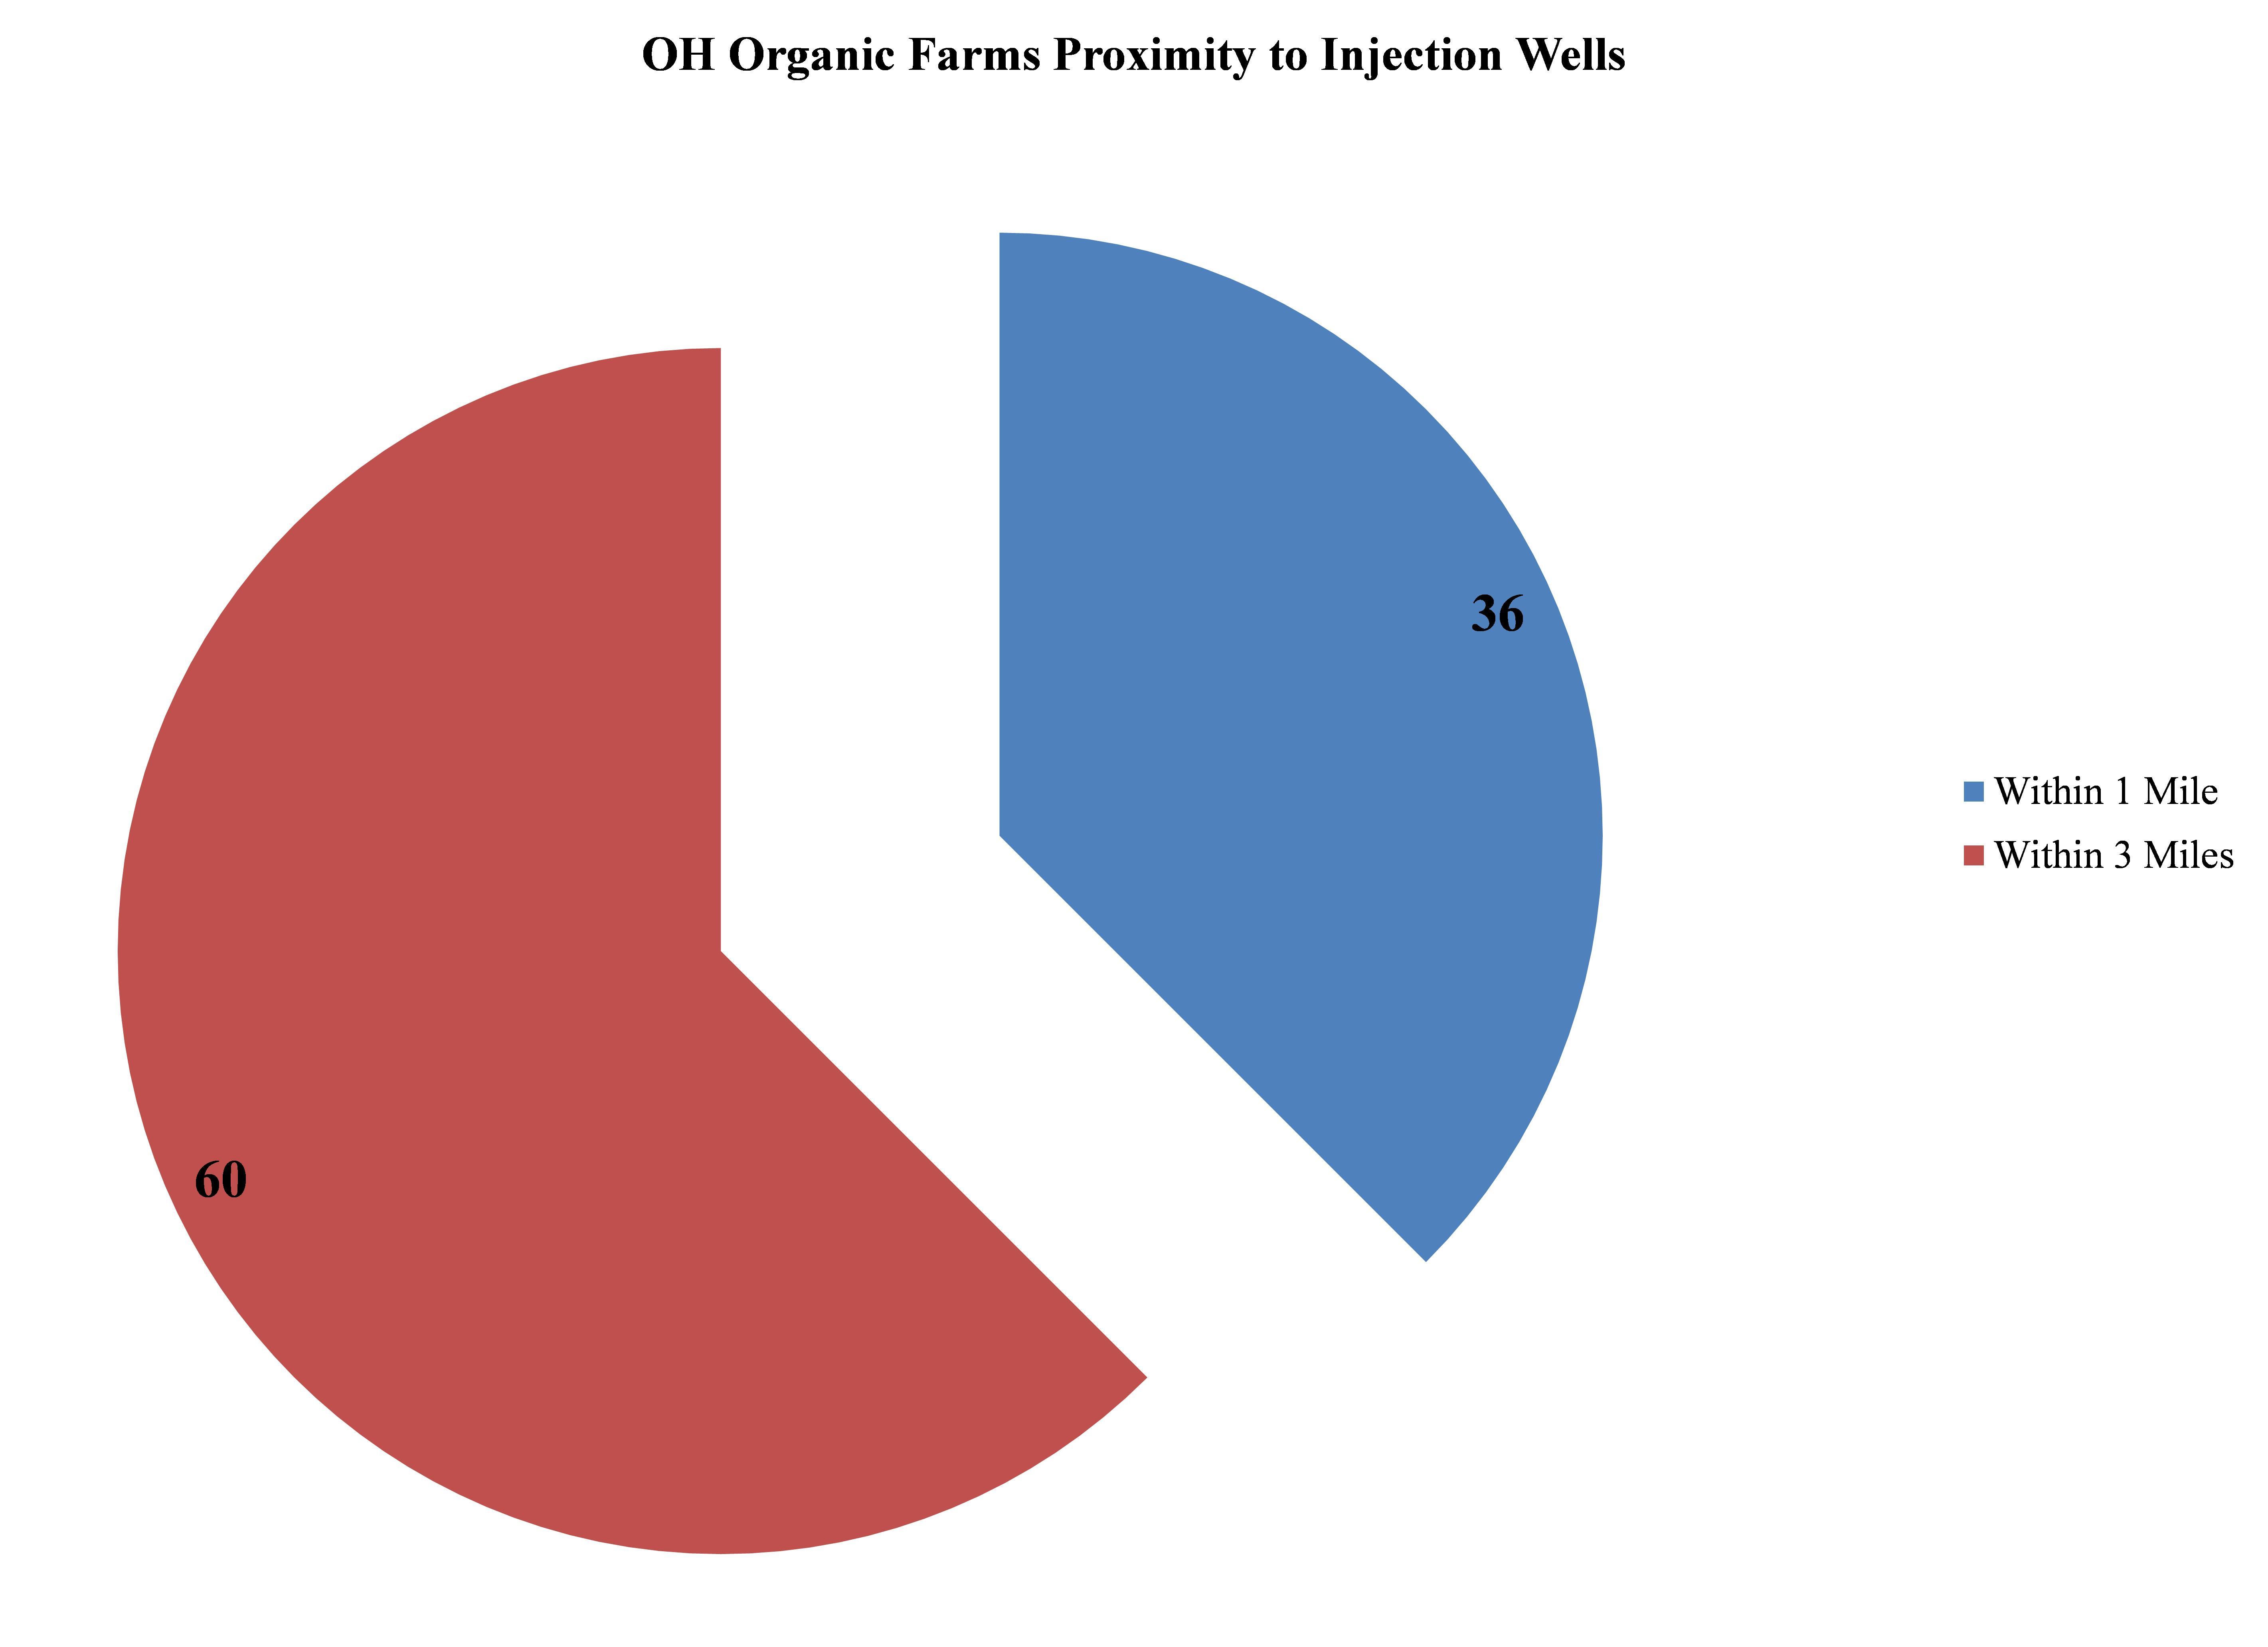
The following key statistics stood out among the analyses for OH’s 703 (3.6% of US total) organic farms. Figures 2 & 3 show how many farms are near drilling activity and injection (disposal) wells in OH. Click the images to view fullsize graphics:
Figure 2. OH Organic Farms Proximity to Drilling Activity
Figure 3. OH Organic Farms Proximity to Injection Wells
Potential Trends
If oil and gas extraction continues along the same path that we have seen to-date, it is reasonable to expect that we could see an increase in the number of organic farms near this industrial activity. A few figures that we have worked up are shown below:
2,912 Organic Farms in the US Shale Plays (15% of total organic farms)
Another way to look at these five ROCs when asking how shale gas build-out will interact with and/or influence organic farming is to look at the soils beneath these ROCs. What types of activity do they currently support? The productivity of organic farms, as well as their ability to be labeled “organic,” are reliant upon the health of their soils even more so than conventional farms. Organic farms cannot rely on synthetic fertilizers, pesticides, herbicides, or related soil amendments to increase productivity. Soil manipulation is prohibitive from a cost and options perspective. Thus, knowing what types of soils the shale industry has used and is moving towards is critical to understanding how the FEW dynamic will play out in the long-term. There is no more important variable to the organic farmer sans freshwater than soil quality and diversity.
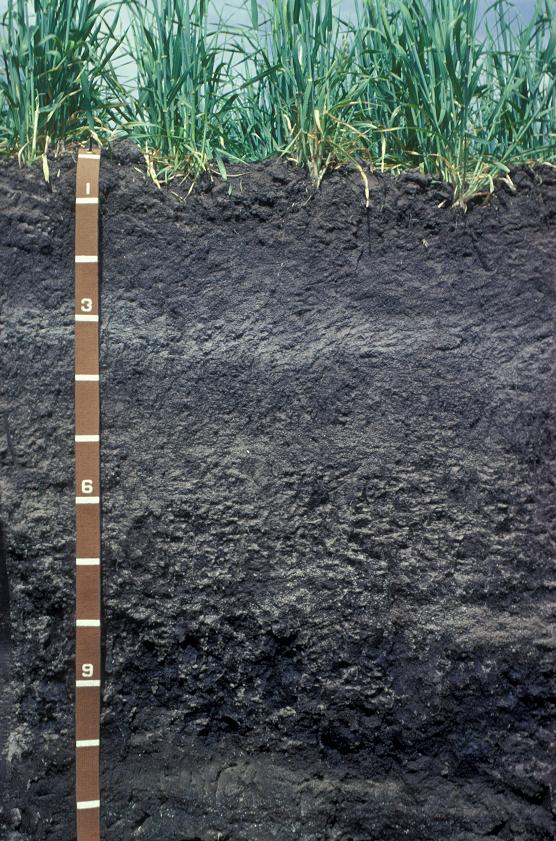
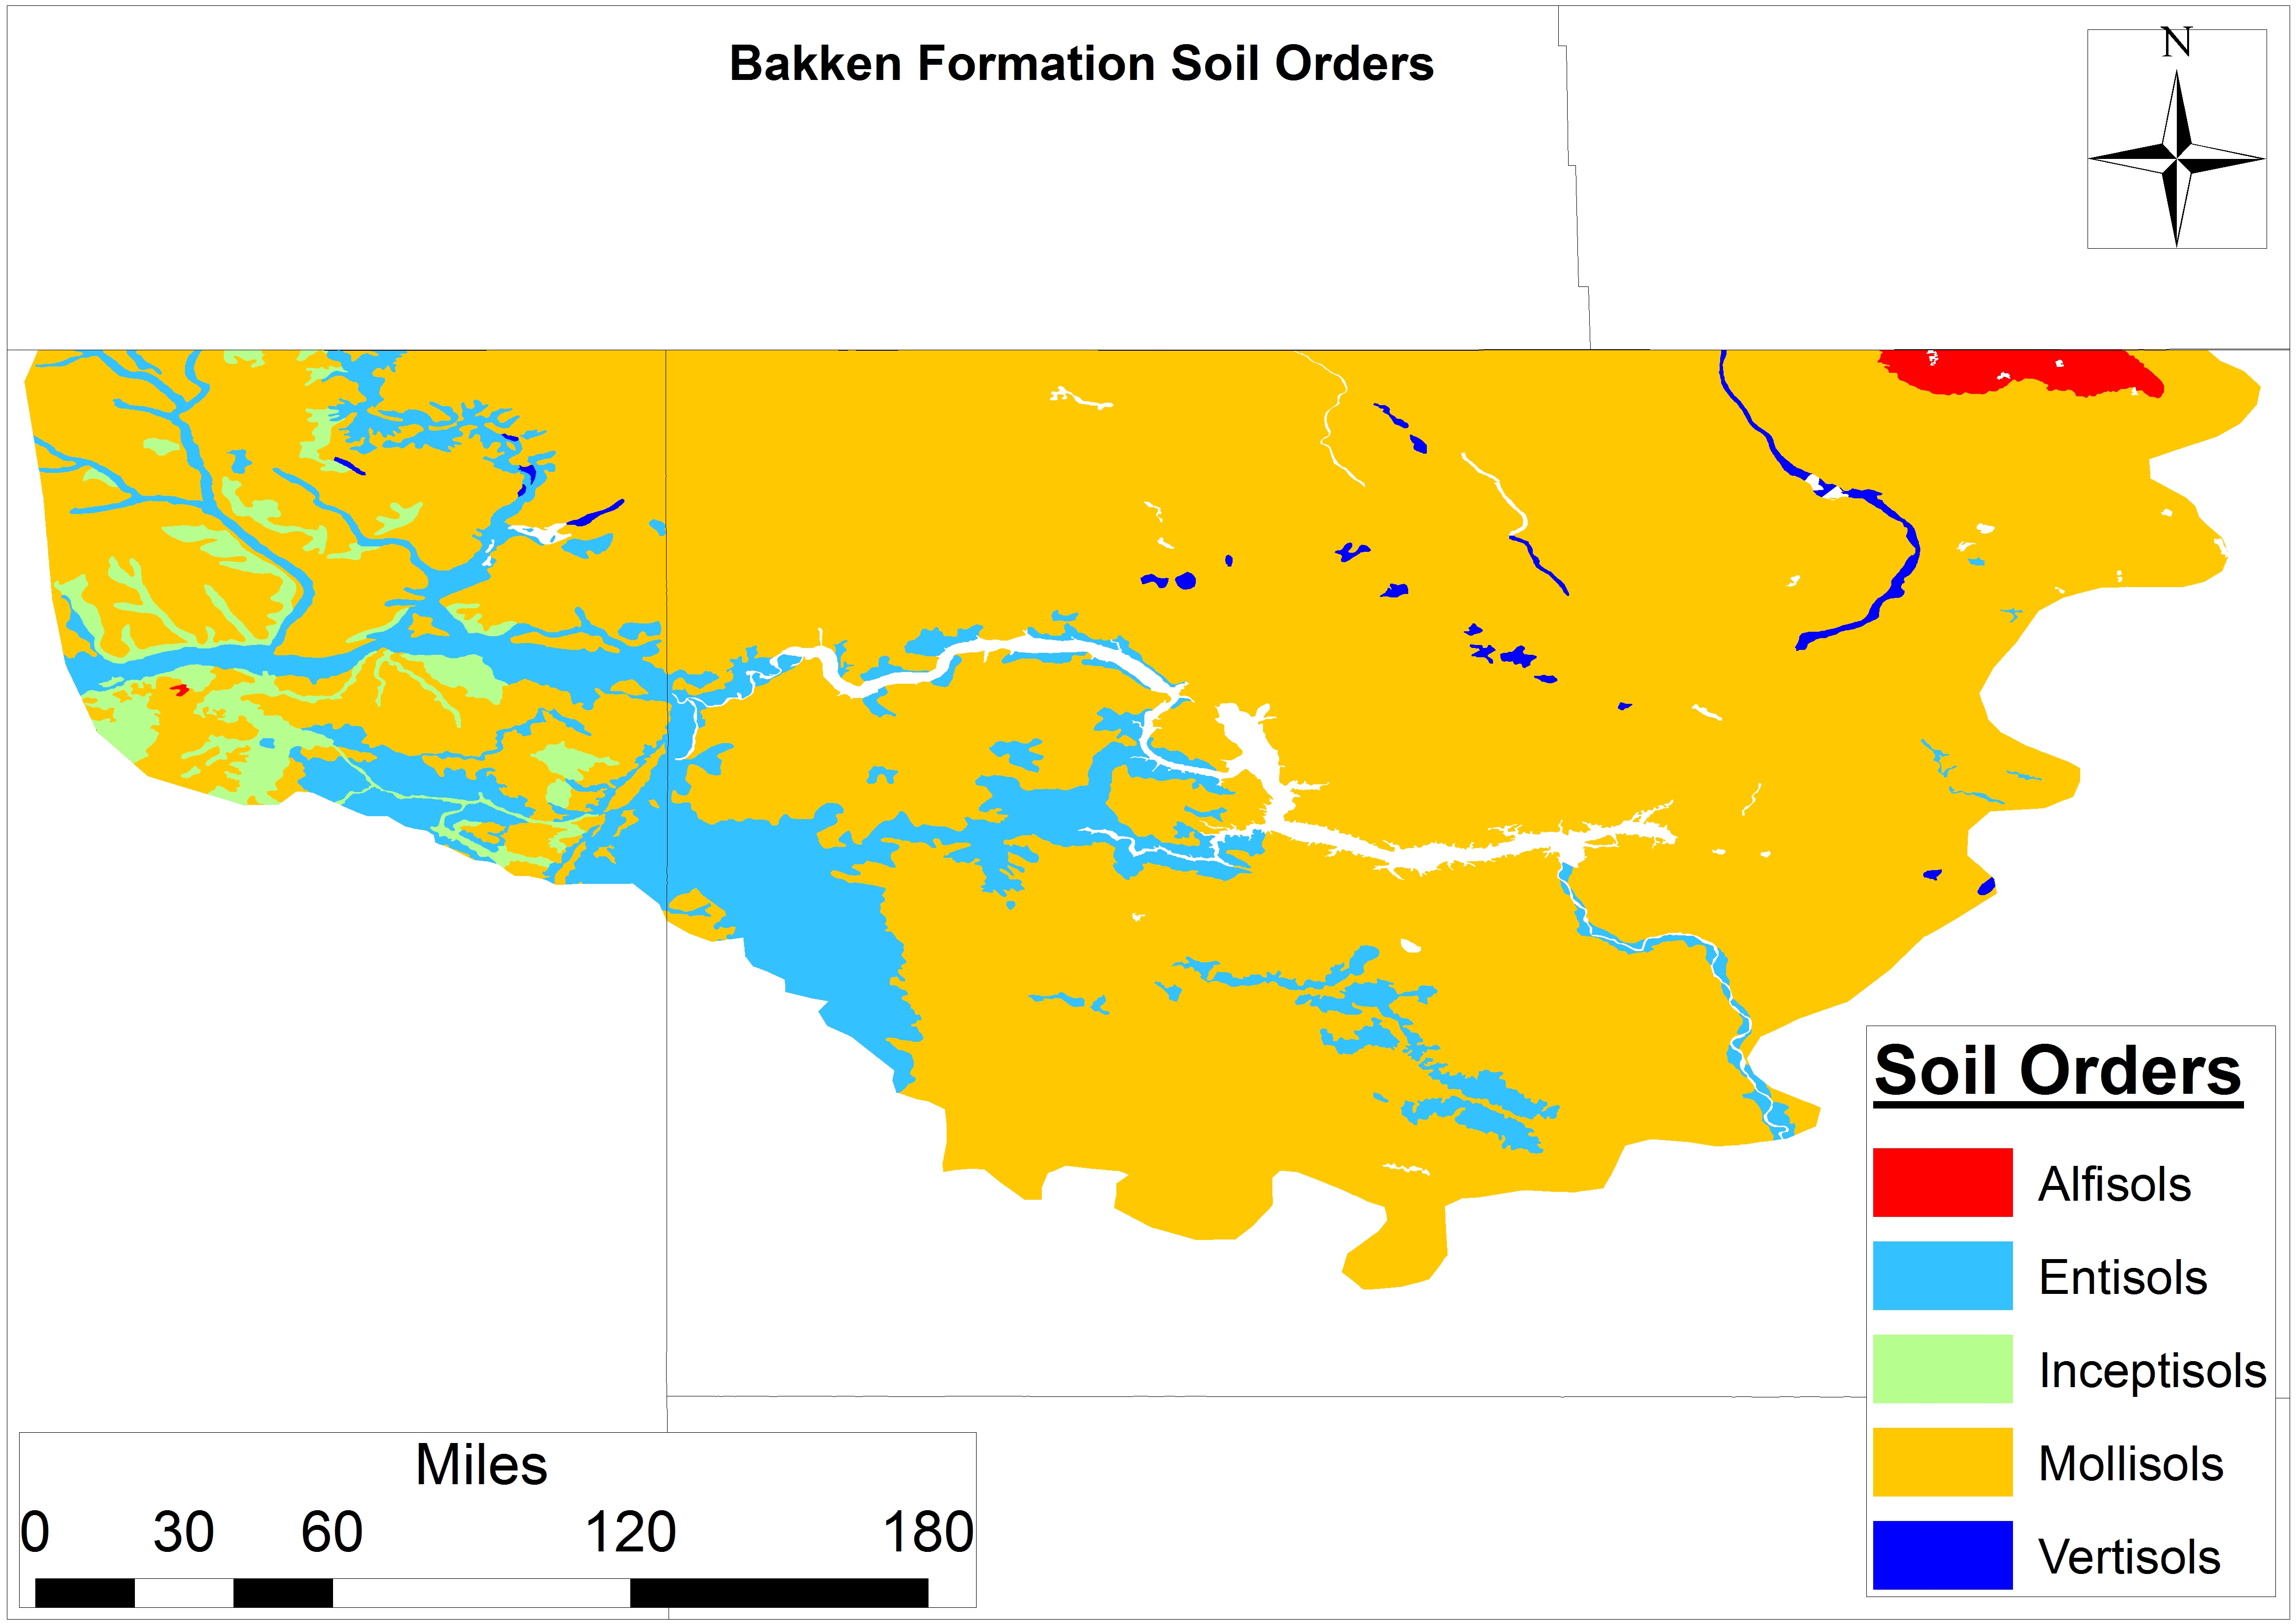
The soils of most concern under this analysis are the Prairie-Forest Transition soils of the Great Lakes and Plains, commonly referred to as Alfisols, and the Carbon-Rich Grasslands or Mollisols (Figure 4 & 5). The latter is proposed by some as a soil order worthy of protection given our historical reliance on its exceptional soil fertility and support for the once ubiquitous Tall Grass Prairies. Both soils face a second potential wave of O&G development, with a combined 18,660 square miles having come under the influence of the O&G industry within the Core ROC and an additional 58-108,000 square miles in the Intermediate and Periphery ROCs. If the watersheds within these soils and O&G co-habitat were to come under development, total potential Alfisol and Mollisol alteration could reach 273,200 square miles. This collection of soils currently accounts for 43-47% of the Core and Intermediate O&G ROCs and would “stabilize” at 50-51% of O&G development if the watersheds they reside in were to see significant O&G exploration.
Figure 6. The five soil orders within the Bakken Shale formation in Montana and North Dakota.
These same soils sit beneath or have been cleared for much of our wheat, corn, and soybean fields – not to mention much of the Bakken Shale exploration to date (Figure 6, above)
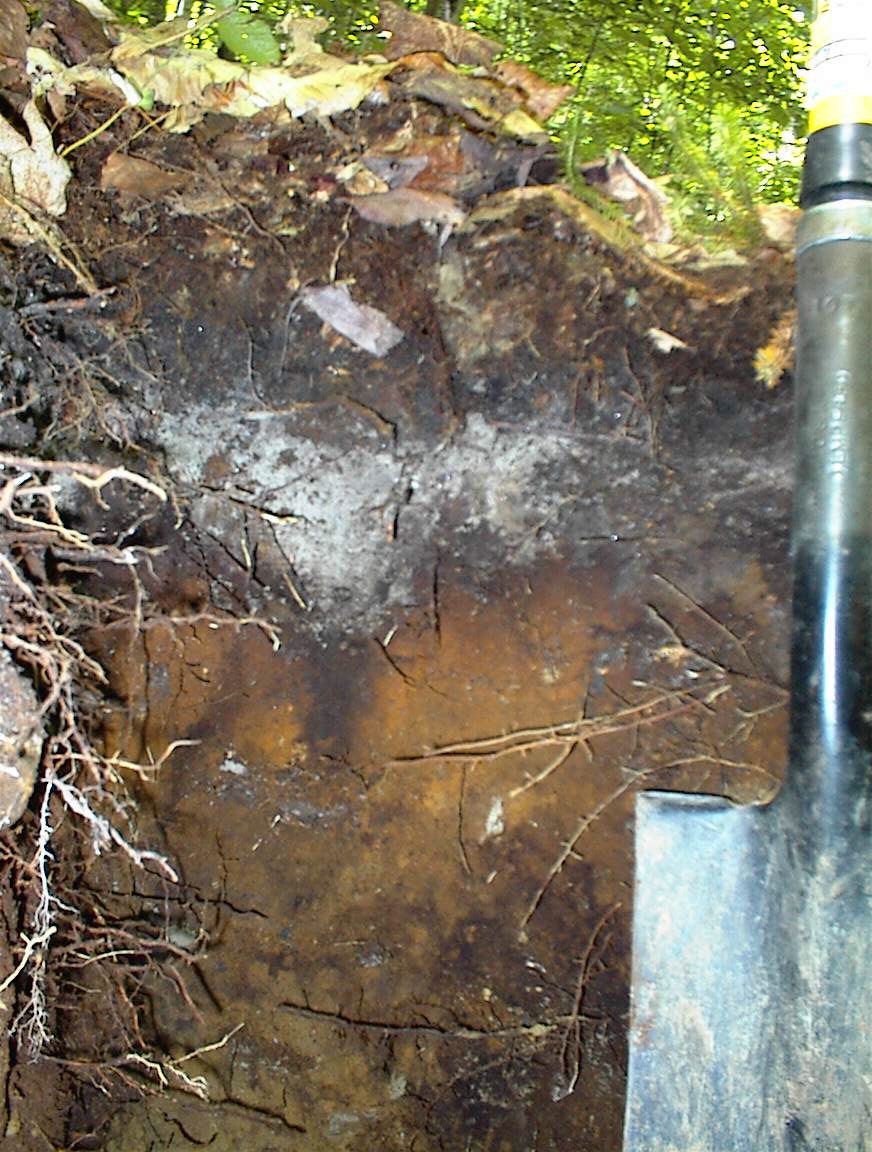
The three forest soil orders (i.e., Spodosol, Ultisol, and Andisol shown in Figures 7-9) account for 9,680-20,529 square miles of the Core and Intermediate O&G ROCs, which is 22 and 17% of those ROC’s, respectively. If we assume future exploration into the Periphery and Watershed ROC we see that forest soils will become less of a concern, dropping to 14-15% of these outlying potential plays, with the same being true for the two Miscellaneous soil types. The latter will decline from 28% to 25% of potential O&G ROCs.
Figure 7. Ultisol – Courtesy of the University of Georgia
Figure 8. Spodosol – Courtesy of the Hubbard Brook Experimental Forest
Figure 9. Andisol – Courtesy of USDA’s NRCS
Figure 10. Histosol, – Courtesy of Michigan State University
If peripheral exploration were to be realized, another soil type will have to fill this gap. Our analysis demonstrates this gap would be filled by either Organic Wetlands or Histosols, which currently constitute <200 and 529 square miles of the Core and Intermediate ROCs, respectively (Figure 10). For so many reasons wetland soils are crucial to the maintenance and enhancement of ecosystem services, wildlife migration, agricultural productivity, and the capture and storage of greenhouse gases. However, if O&G exploration does expand to the Periphery ROC and beyond we would see reliance on wetland soils increase nearly 15 fold (i.e., 16% of Lower 48 wetland soil acreage).
The quality of these wetlands is certainly up for debate. However, what is fact is that these wetlands would be altered beyond even the best reclamation techniques. We know from the reclamation literature that the myriad difficulties associated with reassembling prior plant wetland communities. Finally, it is worth noting that a similar uptick in O&G reliance on arid (i.e., extremely unproductive but unstable) soils is may occur with future industry expansion. These soils will, as a percent of all ROCs, increase from 7% to 9% (i.e. 10-11% of all lower 48 arid soil acreage).
What do these changes mean for the agriculture industry in OH?
If these future O&G exploration scenarios were to play out, we estimate 20-22% of Southern Acidic Forest, Prairie-Forest Transition, Miscellaneous Recent Origin, and Carbon-Rich Grassland soils will have been effected or dramatically altered due to O&G land-use/land-cover (LULC) change nationally (Figure 11). This decline in productivity is likely familiar to communities currently grappling with how to manage a dramatically different landscape post-shale introduction in counties like Bradford in PA and Carroll in OH. The effects that such alteration has had and will have on landscape productivity, wildlife habitat fragmentation, and hydrological cycles is unknown but worthy of significant inquiry.
These questions are important enough to have received a session at Ohio Ecological Food and Farming Association’s (OEFFA) 2015 conference in Granville last month and were deemed worthy of a significant grant to The FracTracker Alliance from the Hoover Foundation aimed at quantifying the total LULC footprint of the shale gas industry across three agrarian OH counties. Early results indicate that every acre of well-pad requires 5.3 acres of gathering lines along with nearly 14 miles of buried pipelines – most of which are beneath high quality wetlands. This study speaks to the potential for 20-30% of the state’s Core Utica Region – or 10-15% of the Expanded Utica Region4 – being altered by shale gas activity.
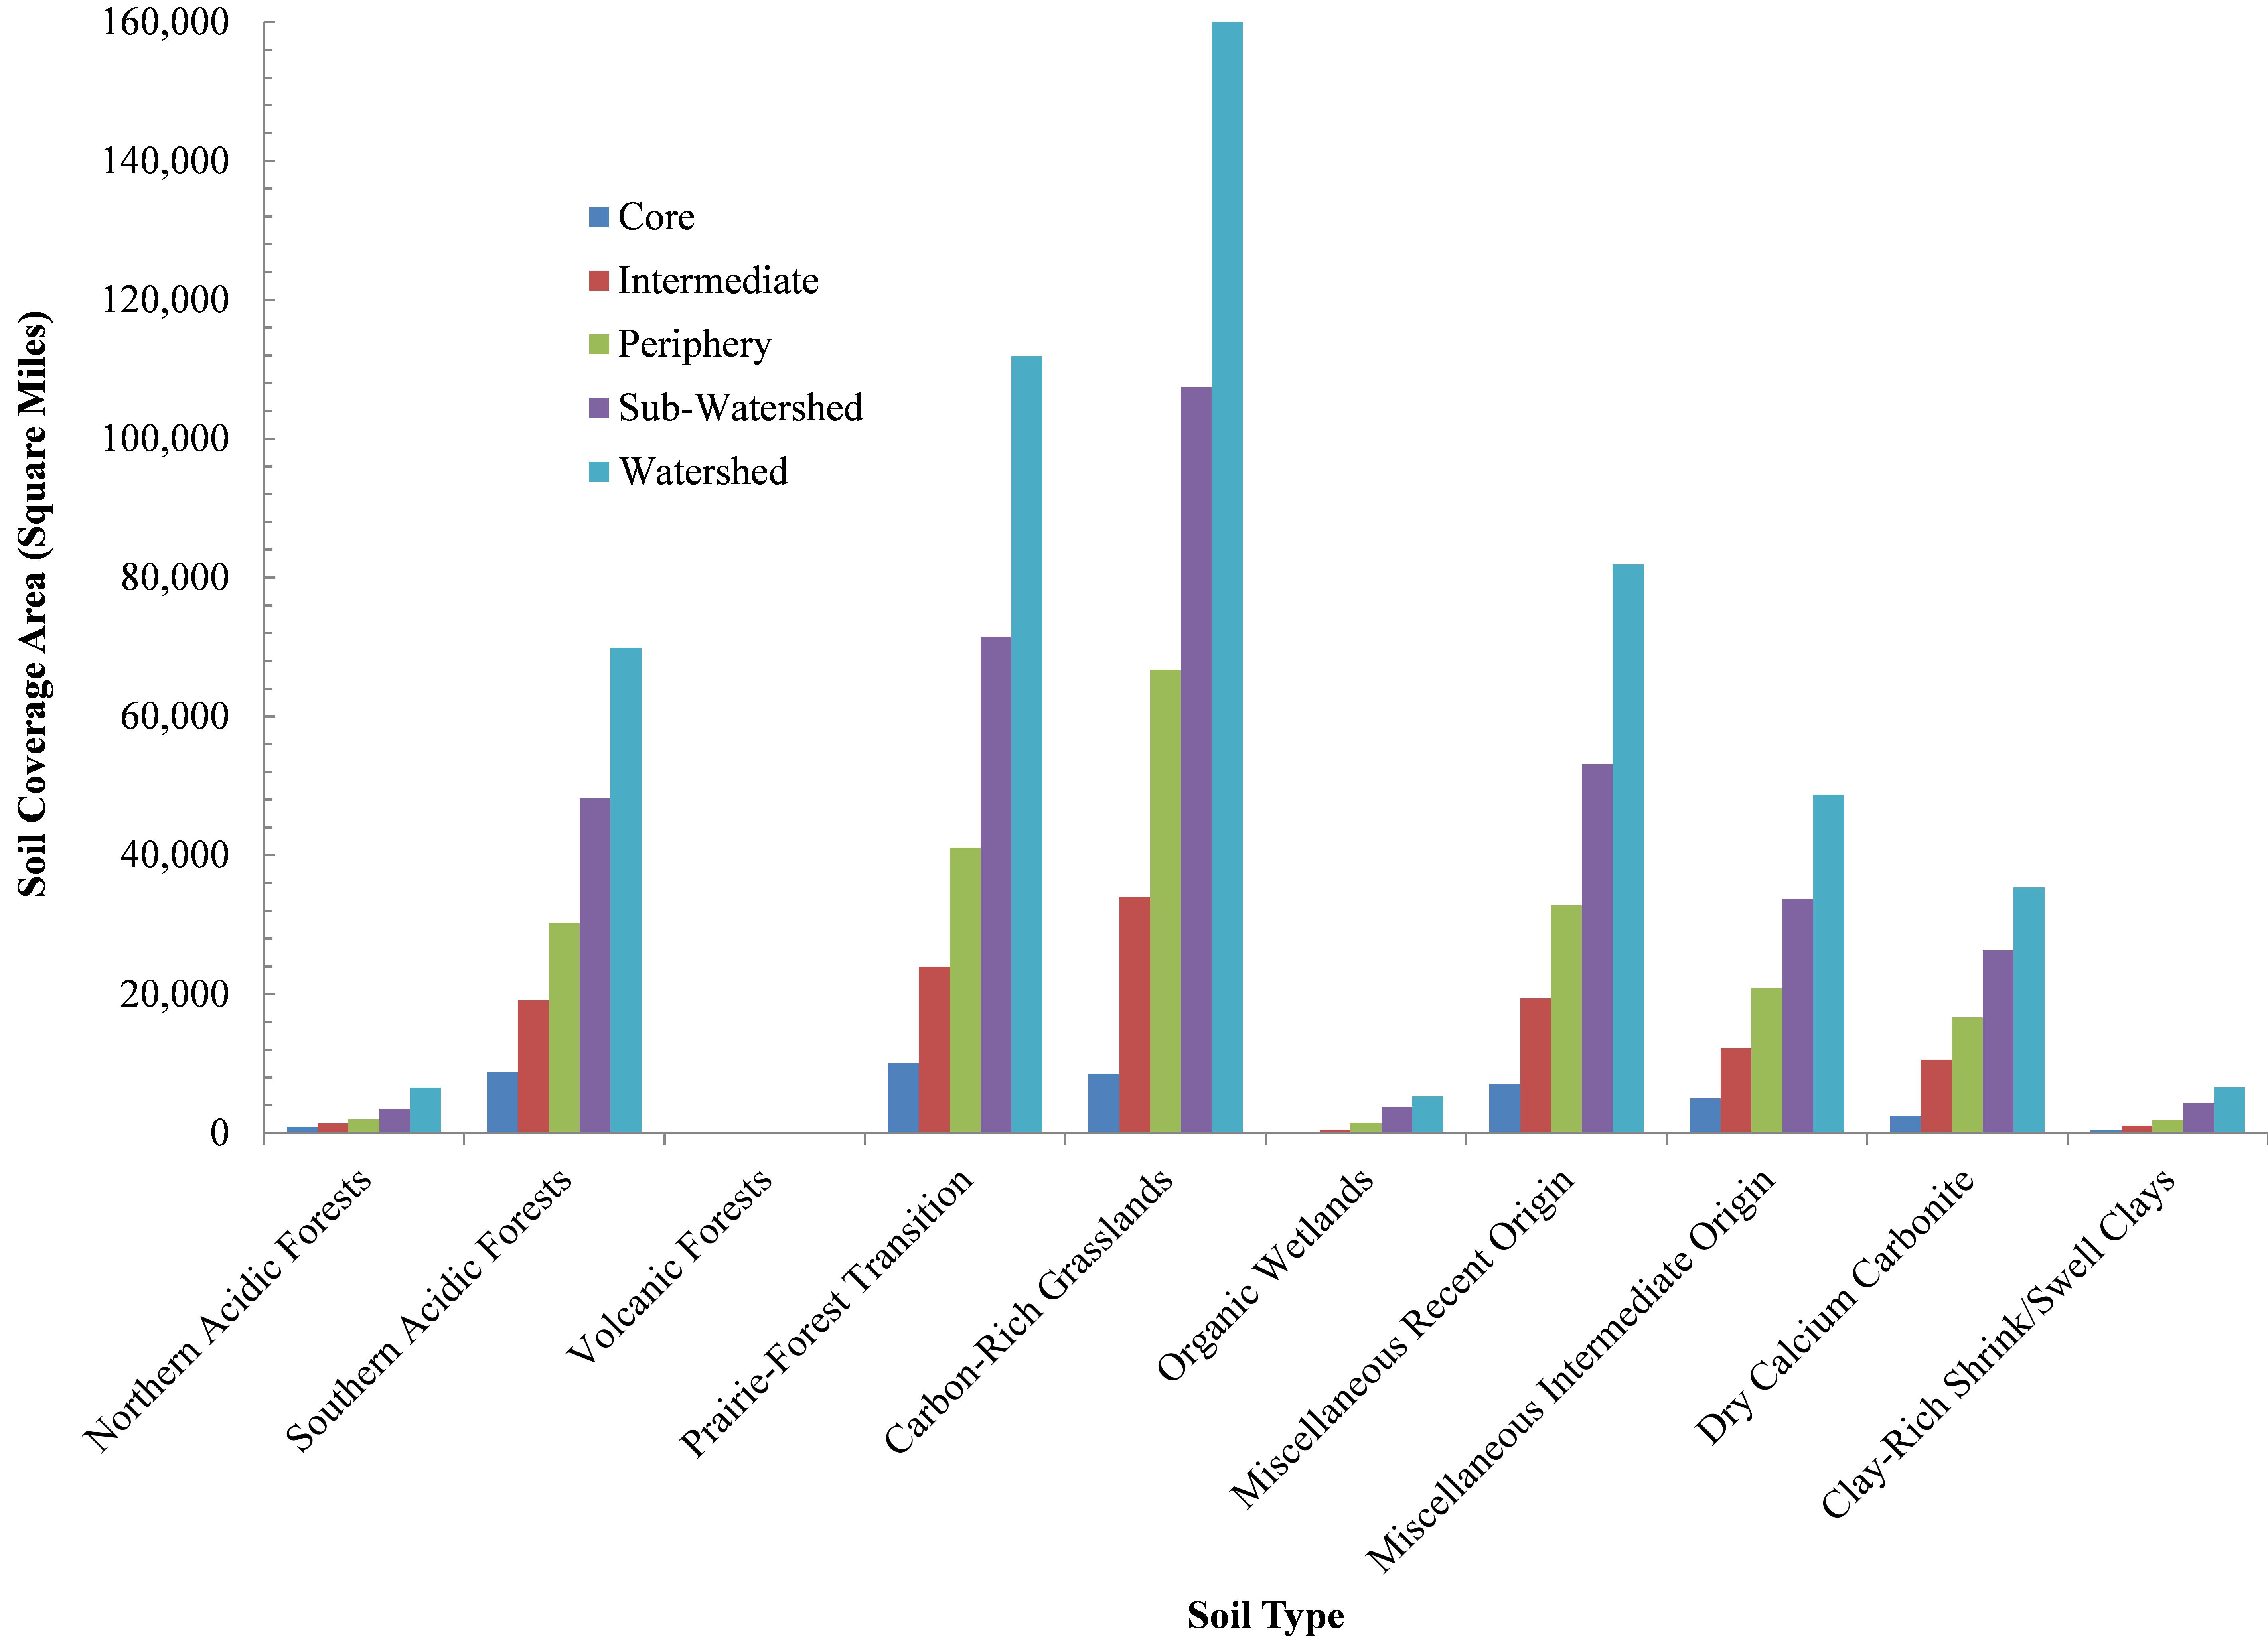
Figure 11. National distribution of soil types within the 5 ROCs under consideration: 1) Forest Soils, 2) Prairie/Agriculture soils, 3) Organic Wetlands, 4) Miscellaneous soils, 5) Dry Soils.
Figure 11 Description:
Forest Soils – Northern and Southern Acidic Forests, Volcanic Forests,
Prairie/Agriculture – Prairie-Forest Transition and Carbon-Rich Grasslands,
Organic Wetlands
Miscellaneous – Recent and Intermediate Origins,
Dry Soils – Dry Calcium Carbonite and Clay-Rich Shrink/Swell Clays
Conclusion
The current and potential interaction(s) between the O&G and organic farming industries is nontrivial. Currently 11% of US organic farms are within what we are calling O&G ROCs. However, this number has the potential to balloon to 15-31% if our respective shale plays and basins are exploited, either partially or in full. Most of these (68-74%) are crop producers in states like California, Ohio, Michigan, Pennsylvania, and Texas.
Issues such as soil quality – specifically Prairie-Forest, Carbon Rich Grasslands, and Wetland soils – watershed resilience, and water rights are likely to become of more acute regional concern as the FEW interactions become increasingly coupled. How and when this will play out is anyone’s guess, but its play out is indisputable. Agriculture is going to face many staunch challenges in the coming years, as the National Science Foundation5 wrote:
The security of the global food supply is under ever-increasing stress due to rises in both human population and standards of living world-wide. By the end of this century, the world’s population is expected to exceed 10 billion, about 30% higher than today. Further, as standards of living increase globally, the demand for meat is increasing, which places more demand on agricultural resources than production of vegetables or grains. Growing energy use, which is connected to water availability and climate change, places additional stress on agriculture. It is clear that scientific and technological breakthroughs are needed to produce food more efficiently from “farm to fork” to meet the challenge of ensuring a secure, affordable food supply.
An additional 69 organic farms were geo-referenced in Canada and 7,524 across the globe for a similar global analysis to come.
Description of STATSGO2 Database and associated metadata here.
Core Utica Regions include any county that has ≥10 Utica permits to date and Expanded Utica Region includes any county that has 1 or more Utica permits.
By the Mathematical and Physical Sciences Advisory Committee – Subcommittee on Food Systems in “Food, Energy and Water: Transformative Research Opportunities in the Mathematical and Physical Sciences”
https://www.fractracker.org/a5ej20sjfwe/wp-content/uploads/2015/03/OrganicFarms-Feature.jpg400900Ted Auch, PhDhttps://www.fractracker.org/a5ej20sjfwe/wp-content/uploads/2025/09/2025-Wordmark-Logo.pngTed Auch, PhD2015-03-11 15:00:572020-07-21 10:32:10Organic farms near drilling activity in the U.S. and Ohio


