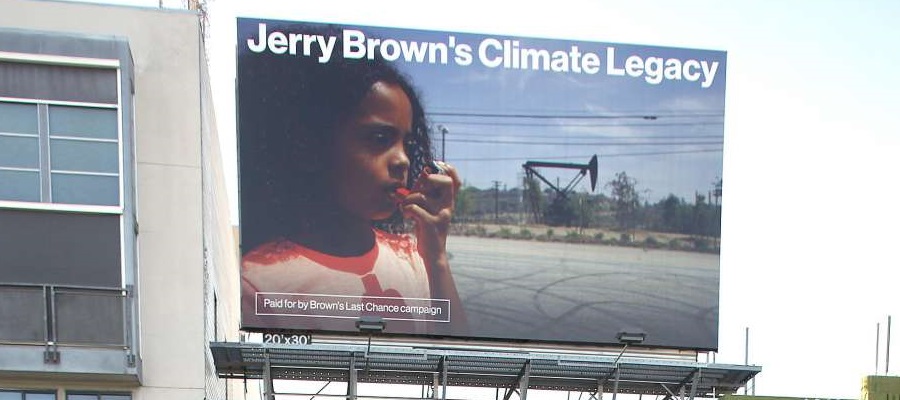
California has become a battleground for real climate action. The state Governor, Jerry Brown prides himself in his own climate leadership, and California has pushed EU nations and countries worldwide to take climate change seriously. As a final tribute to his own tenure as a term-limited governor, Brown has organized and hosted a Global Climate Action Summit, September 12-14th. The summit convenes an international invitation list of “climate leaders” to, in their words:
“Take Ambition to the Next Level.” It will be a moment to celebrate the extraordinary achievements of states, regions, cities, companies, investors and citizens with respect to climate action. It will also be a launchpad for deeper worldwide commitments and accelerated action from countries—supported by all sectors of society—that can put the globe on track to prevent dangerous climate change and realize the historic Paris Agreement.
Meanwhile, frontline communities, community organizers, and grassroots organizations contest the perspective that real change has been made. While investors and green capitalists celebrate, frontline communities fight daily for clean air and water. In solidarity with and led by frontline communities, activists have protested the summit, in an attempt to hold policy makers accountable to those most affected by the fossil fuel industry.
Rise for Climate, Jobs, and Justice
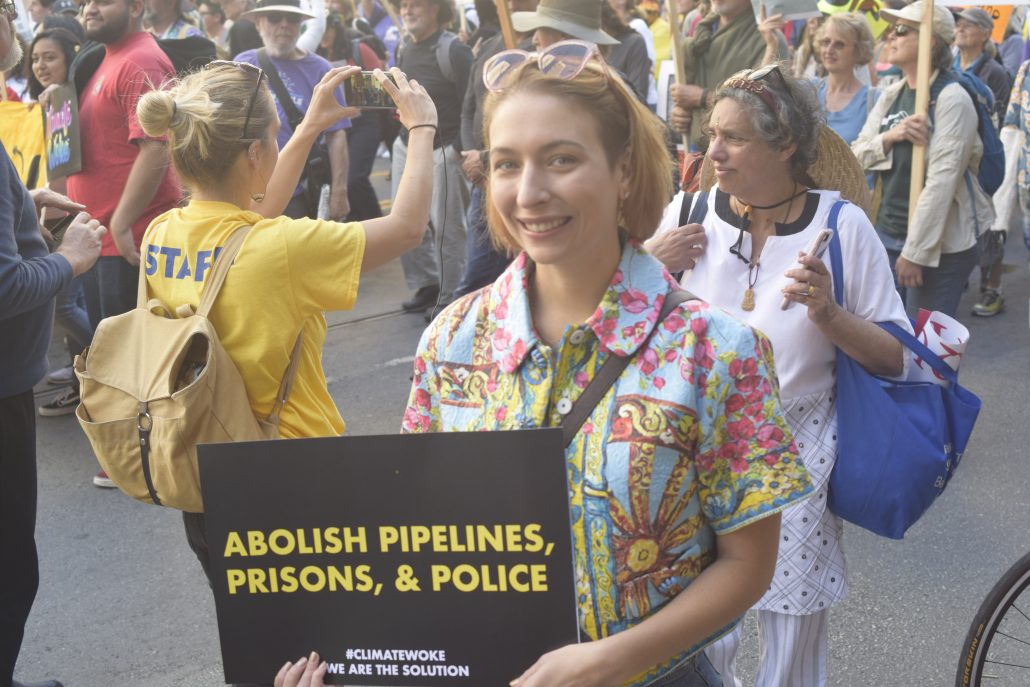
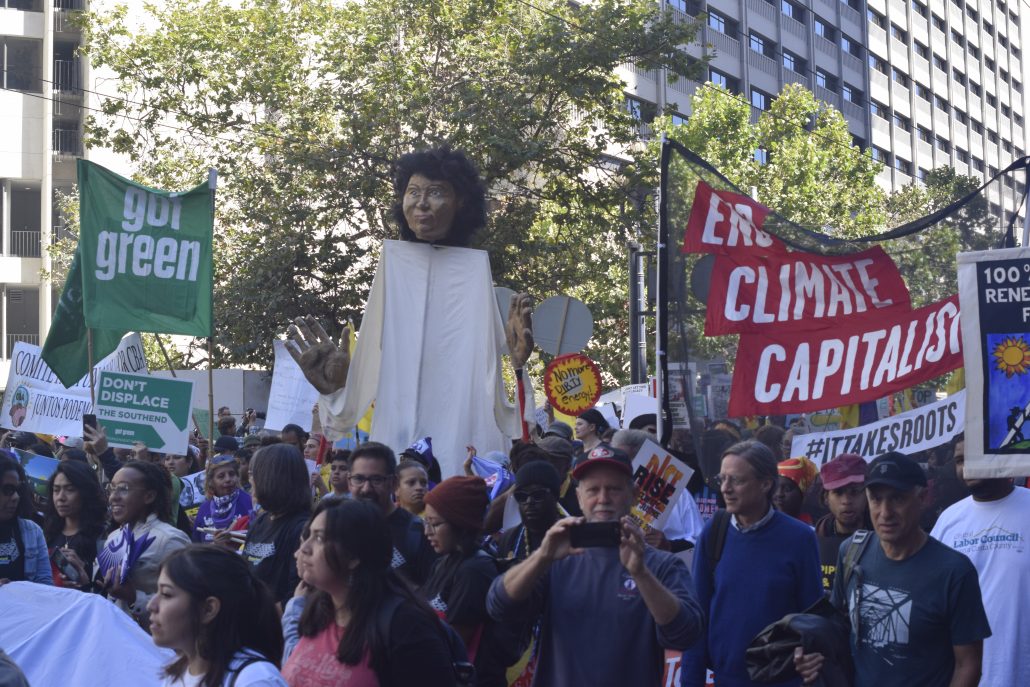
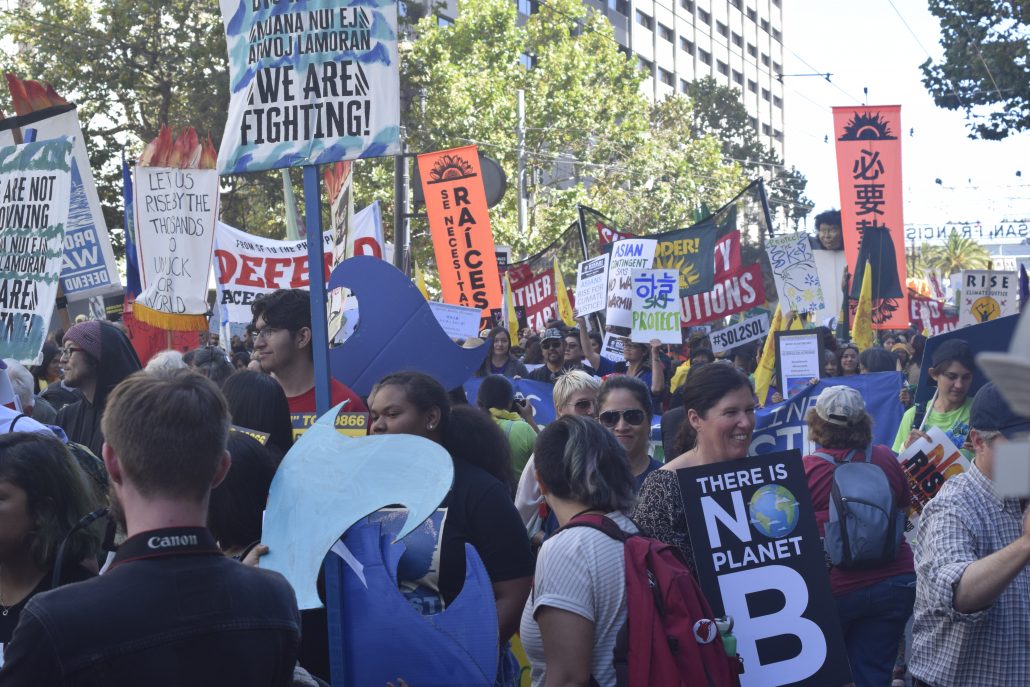
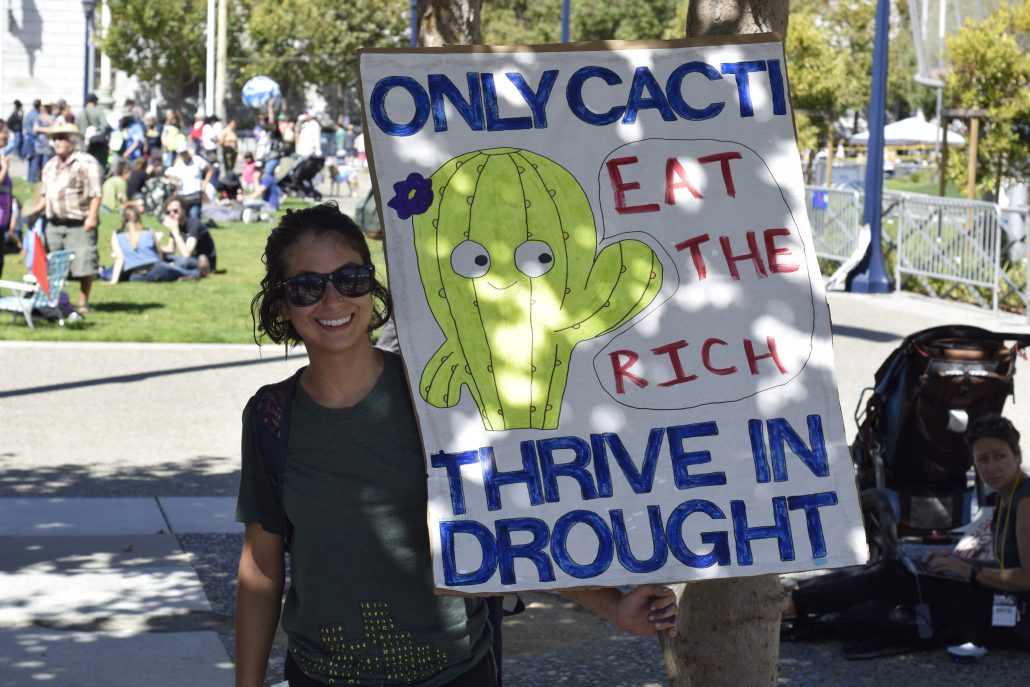
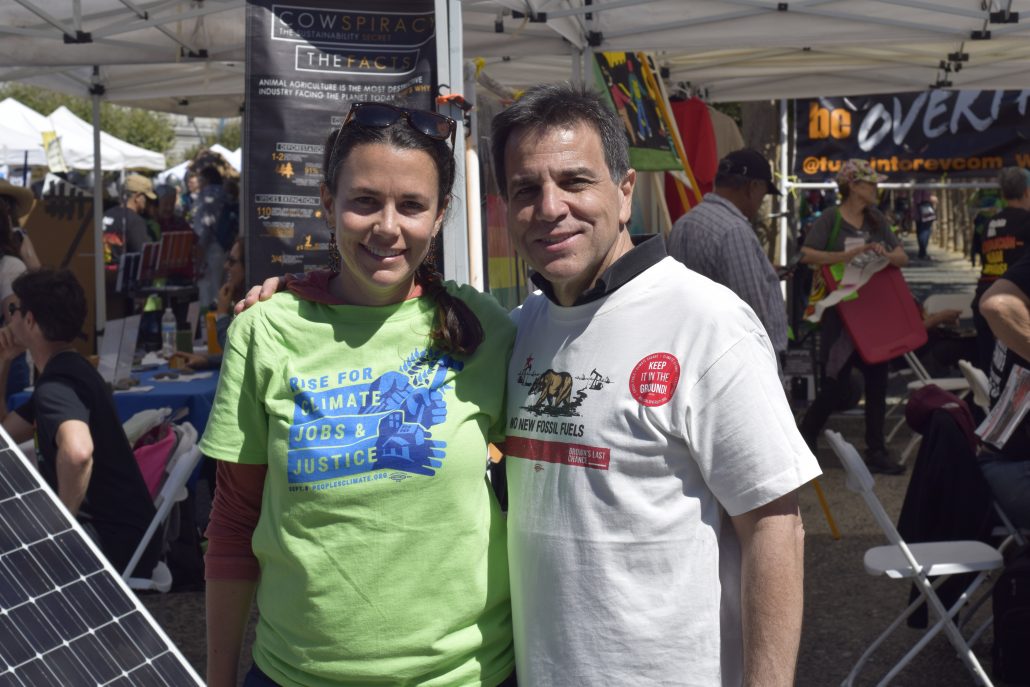
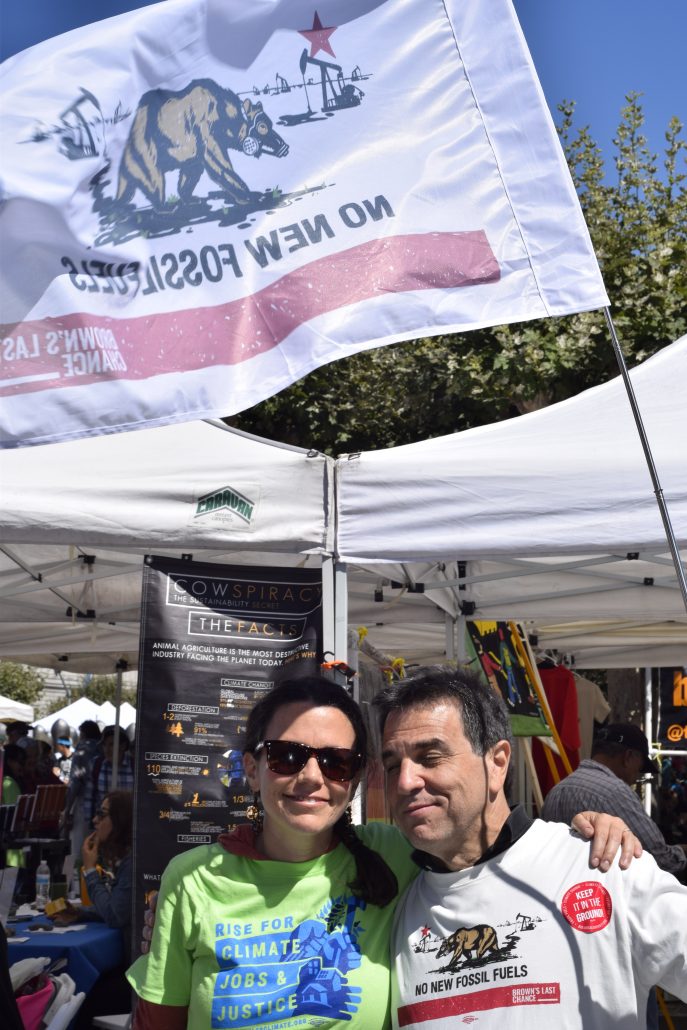
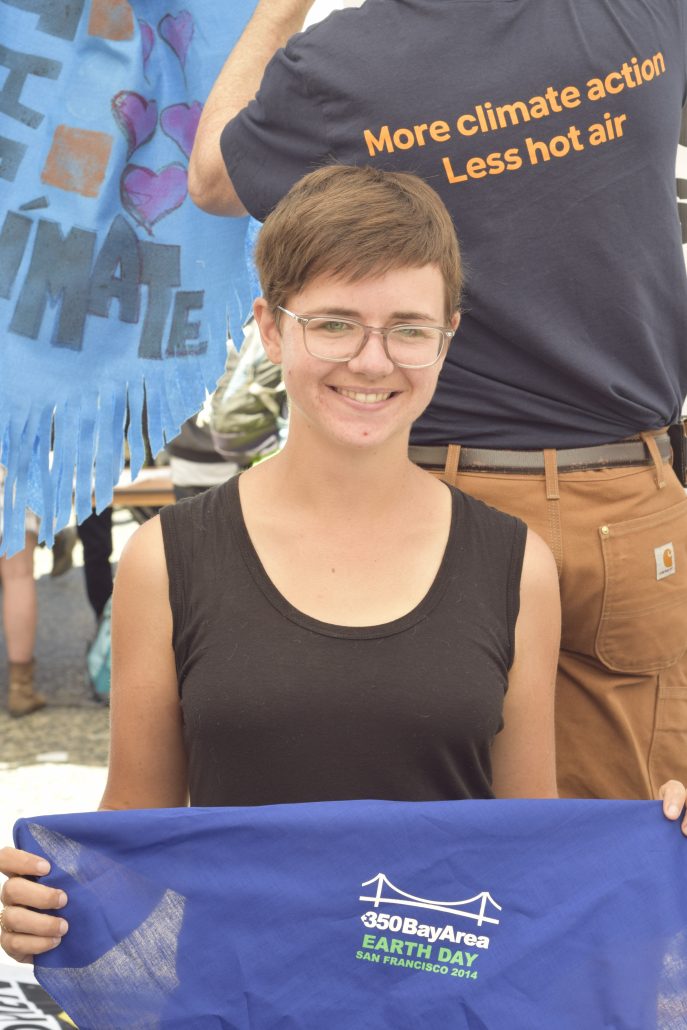
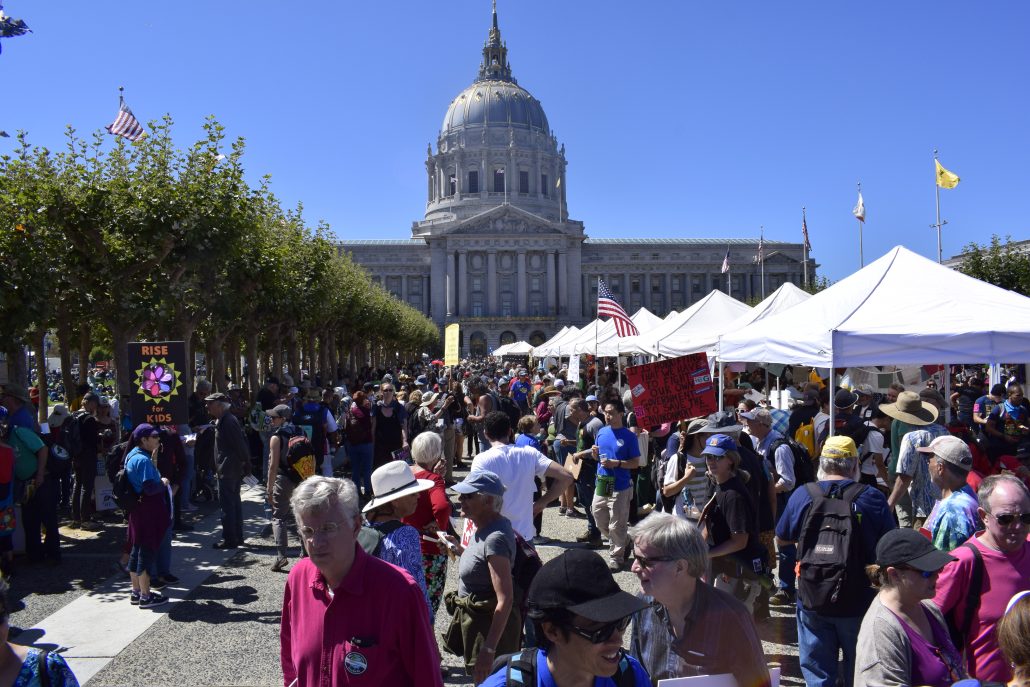
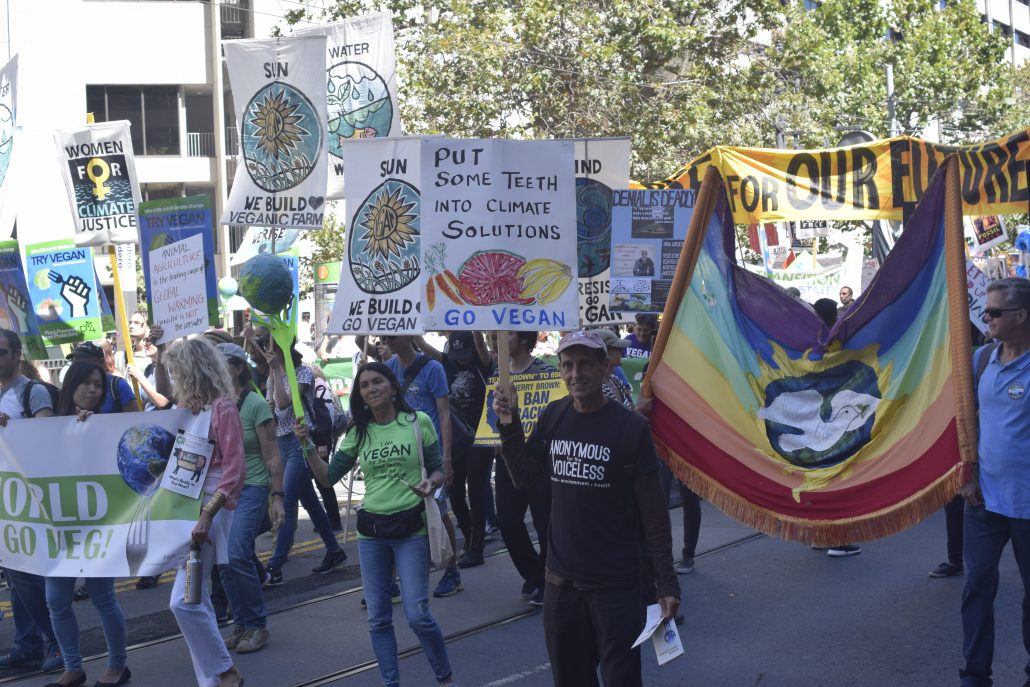
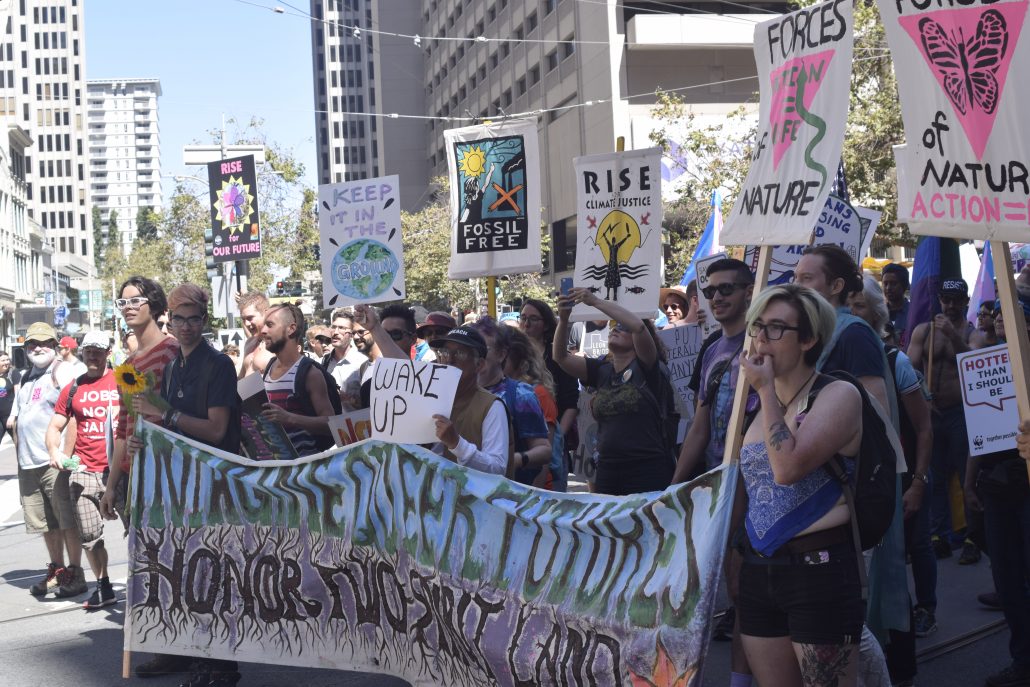
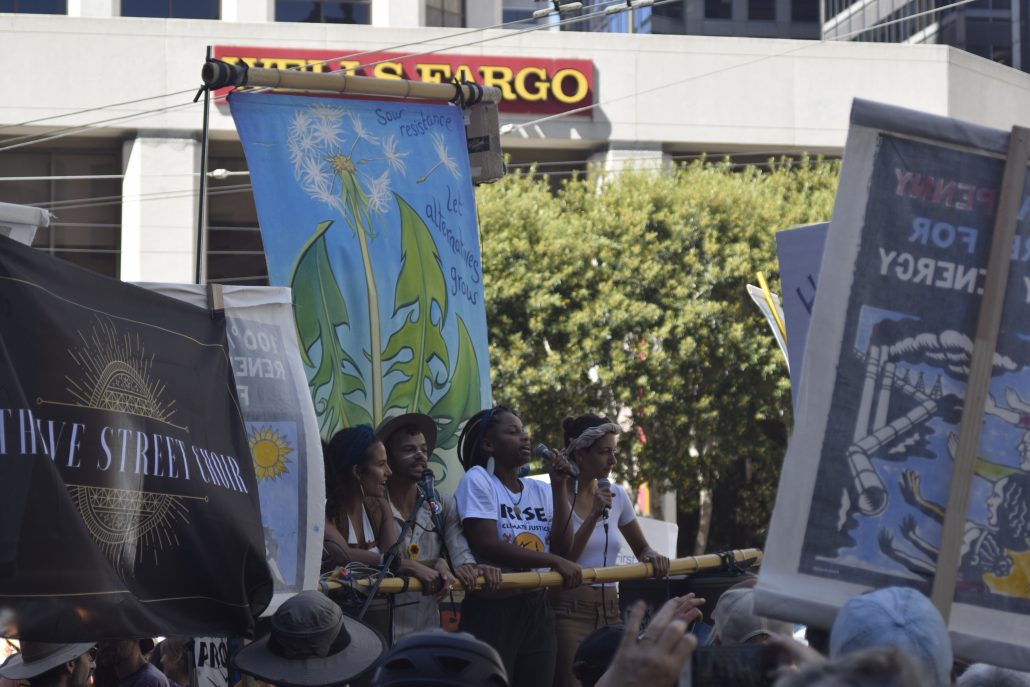
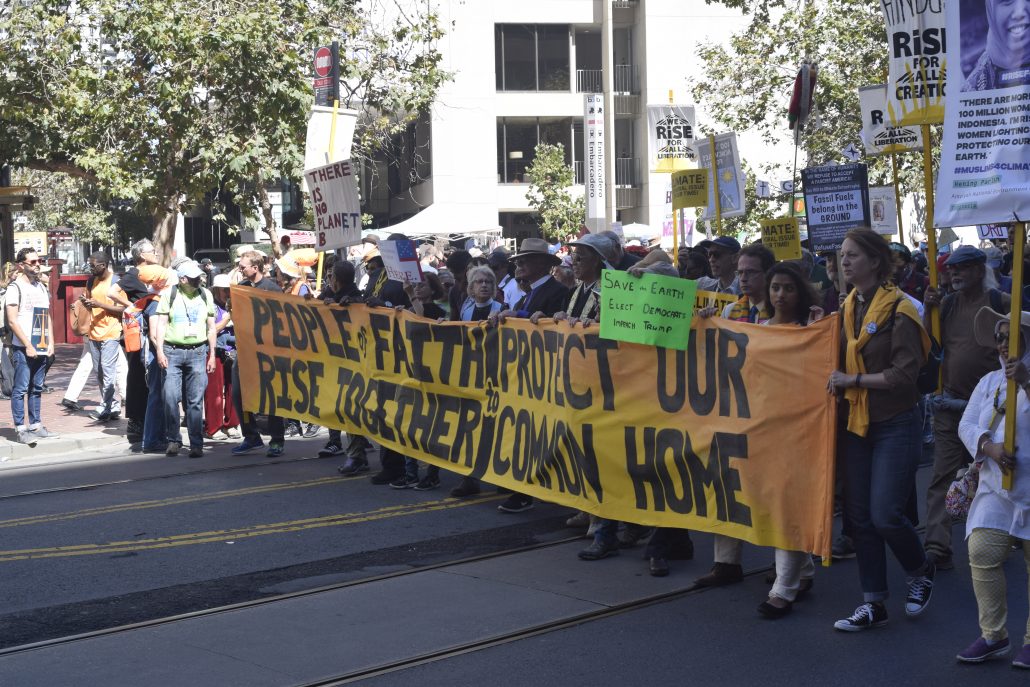
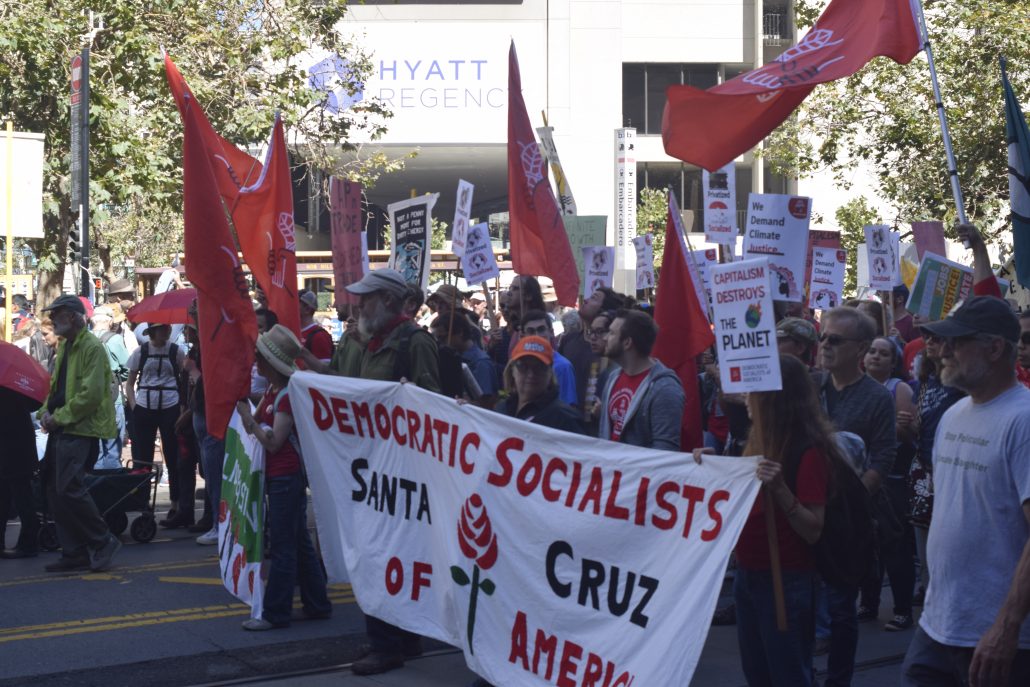
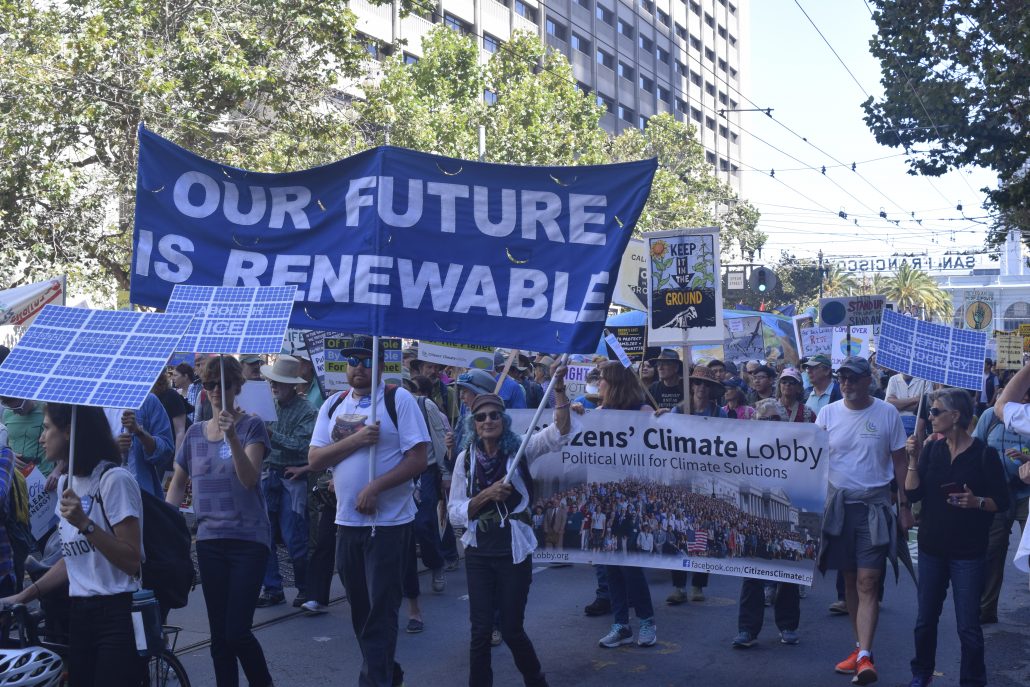
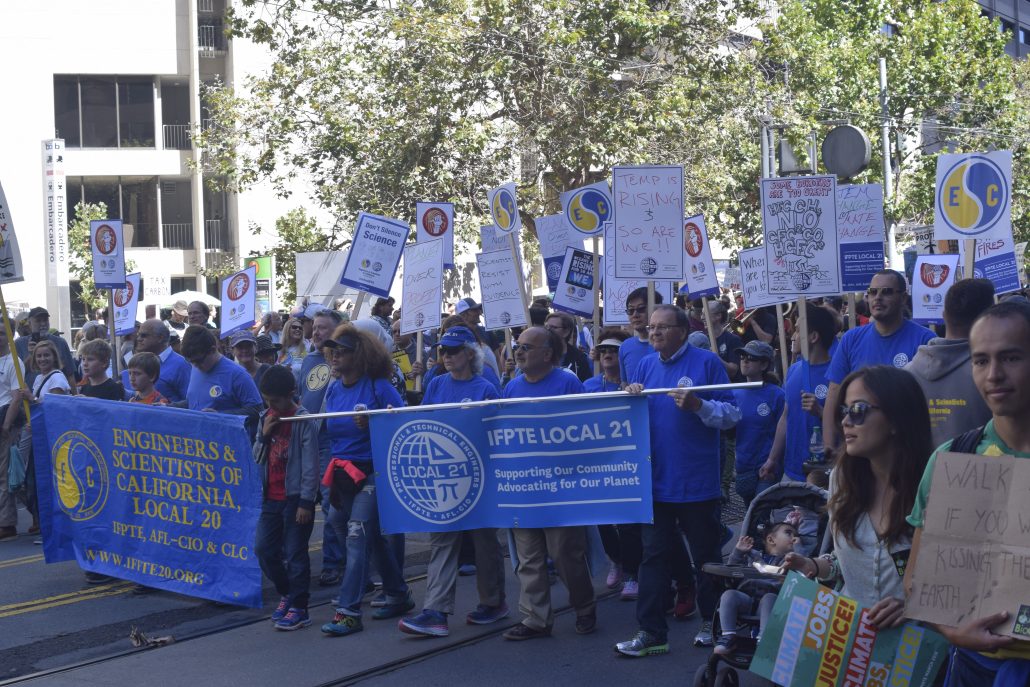
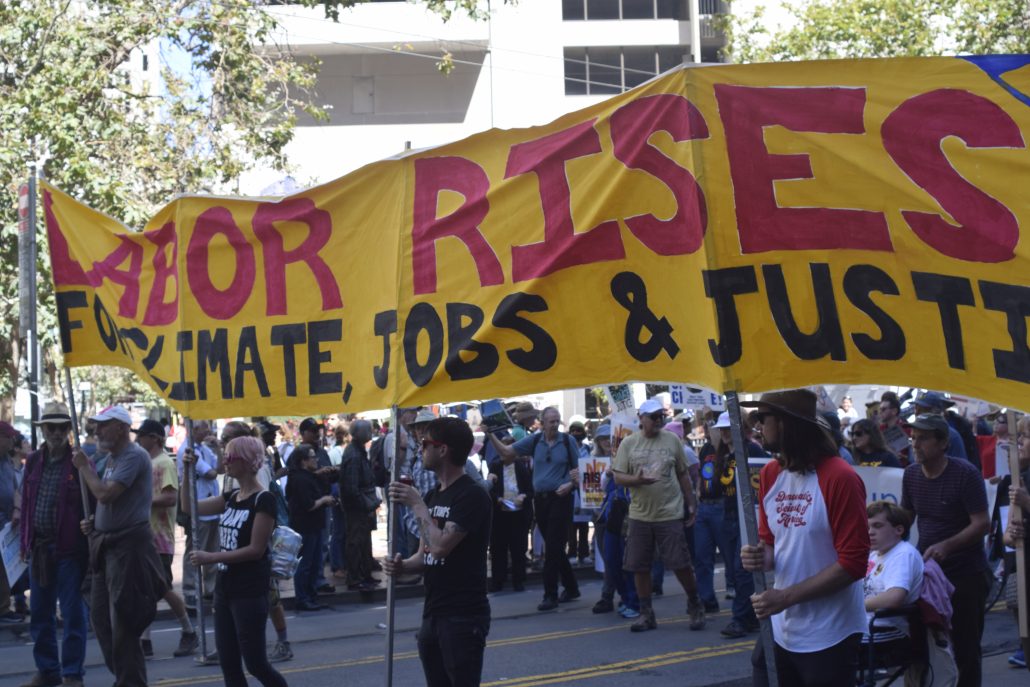
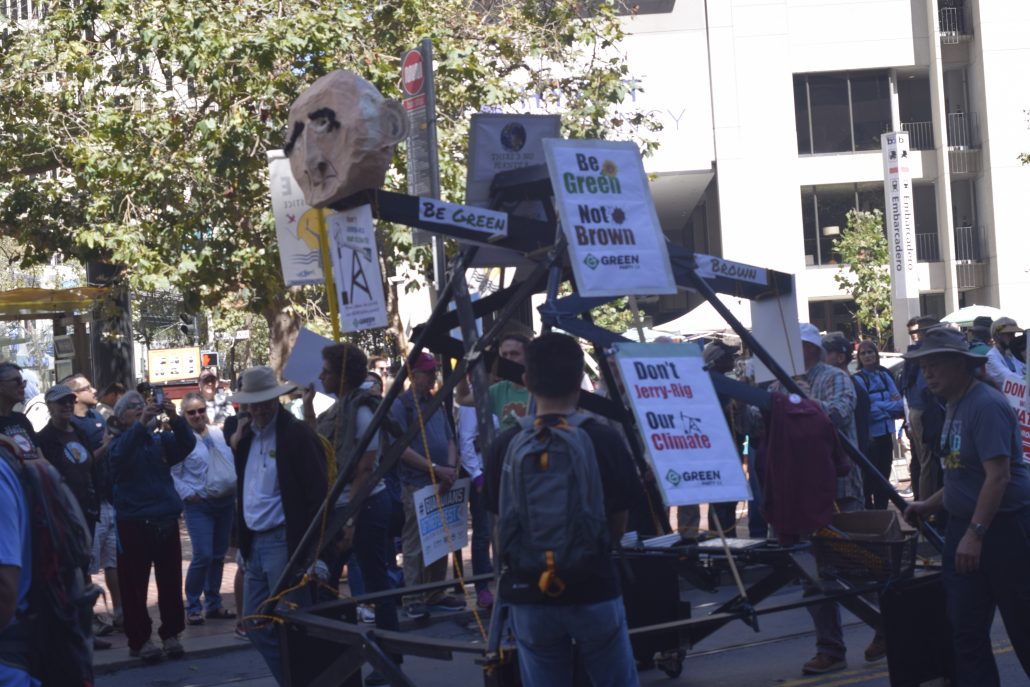
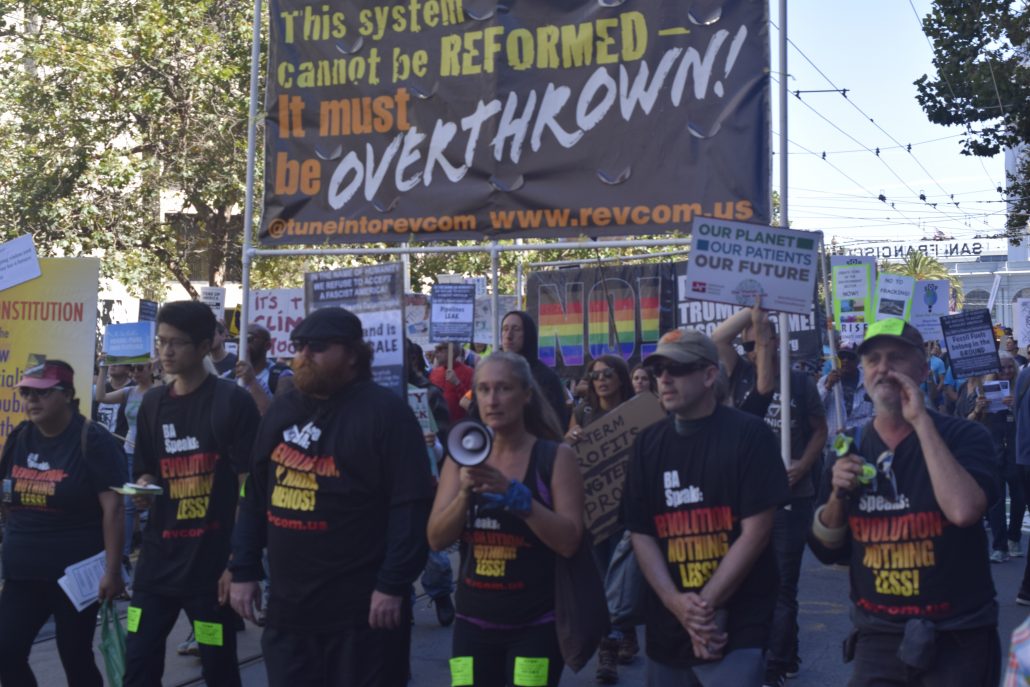
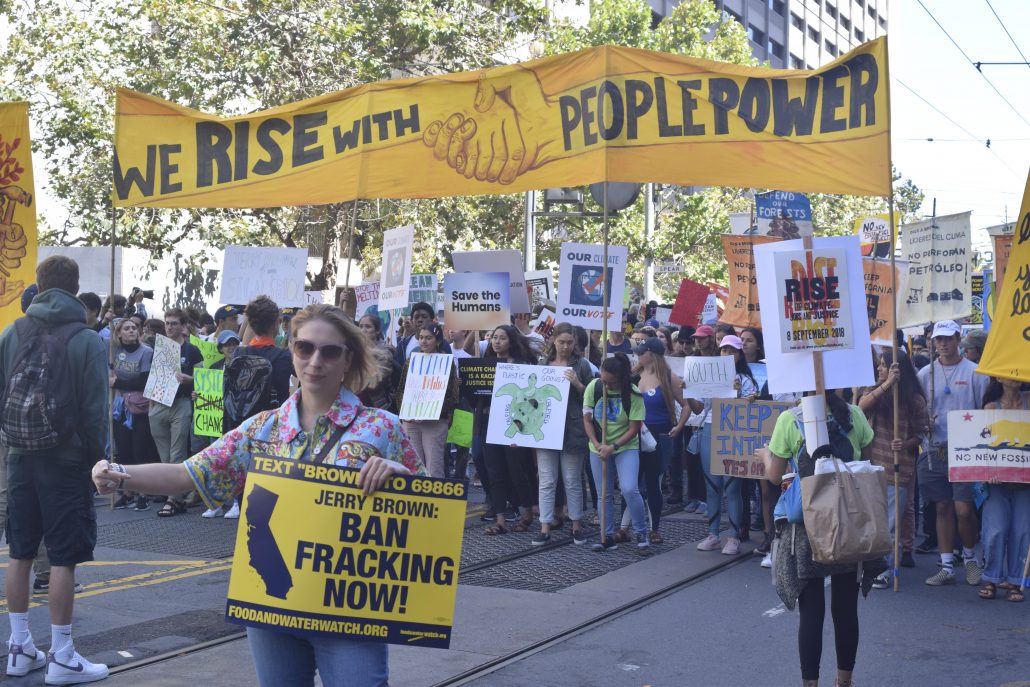
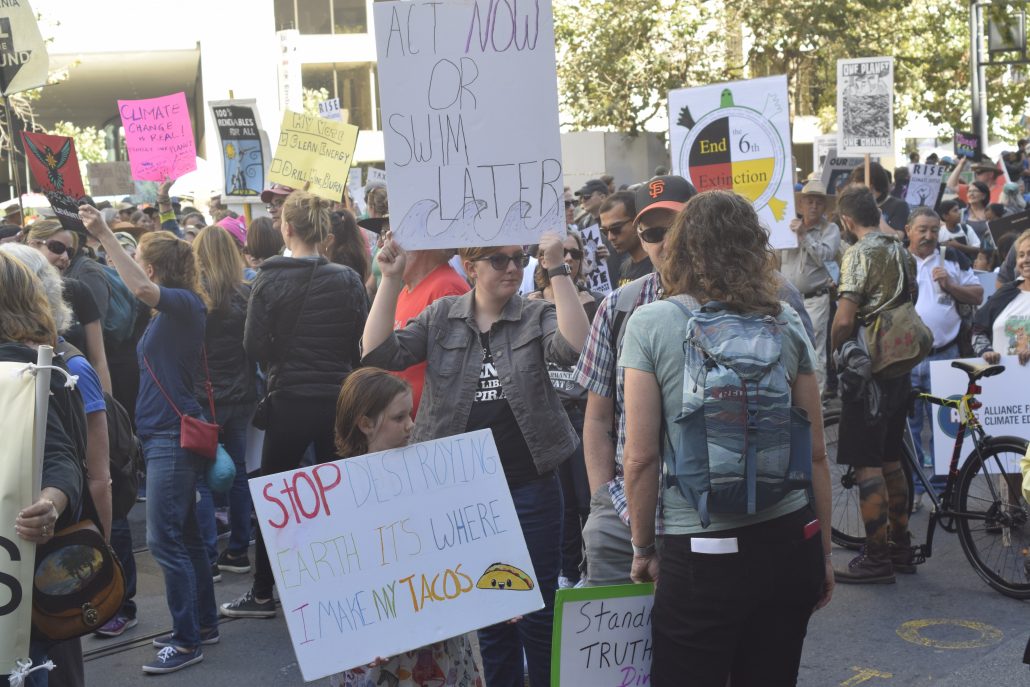
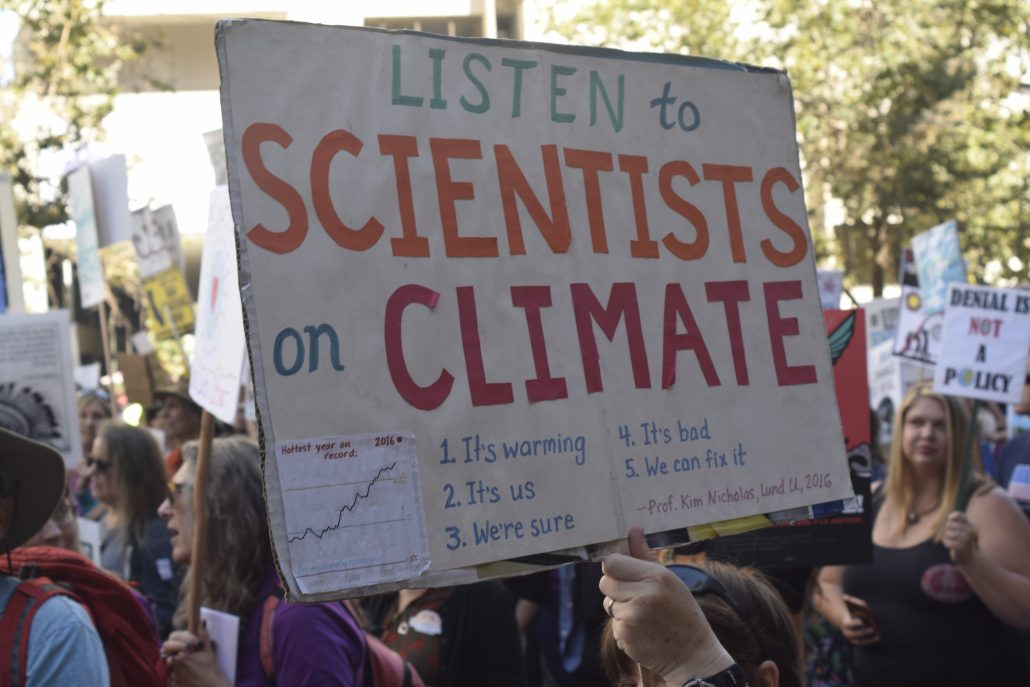
One quarter of a million people worldwide, and well over 30,000 in San Francisco hit the streets during the Rise for Climate last Saturday, September 8th. With over 900 actions taking place simultaneously people worldwide demanded real climate action from their local leaders. FracTracker Alliance staff helped coordinate and participated in events nationwide.
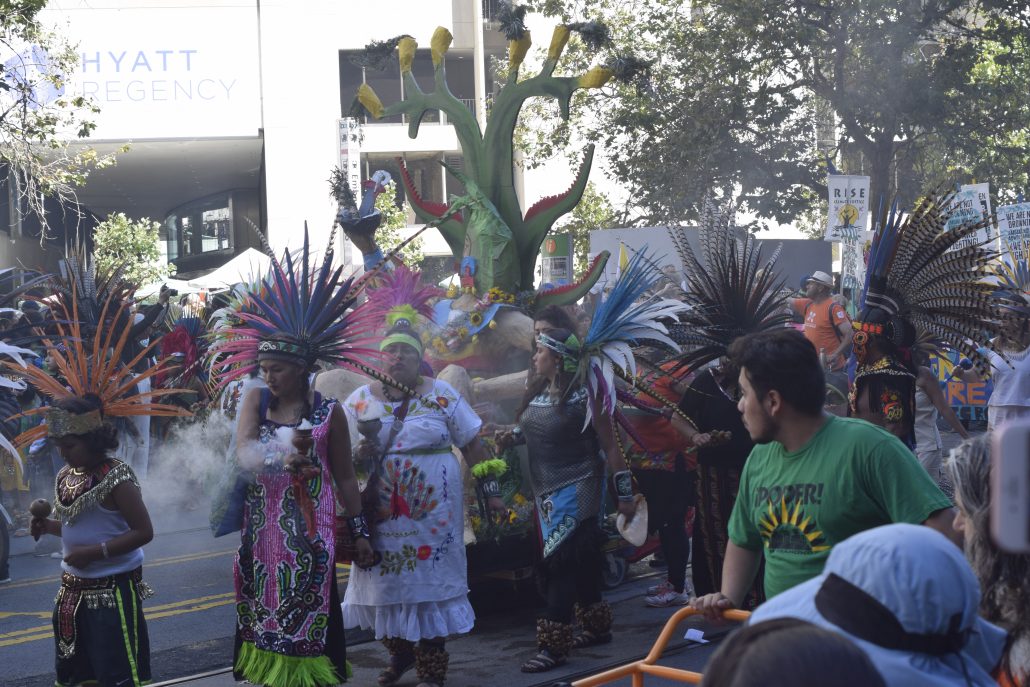
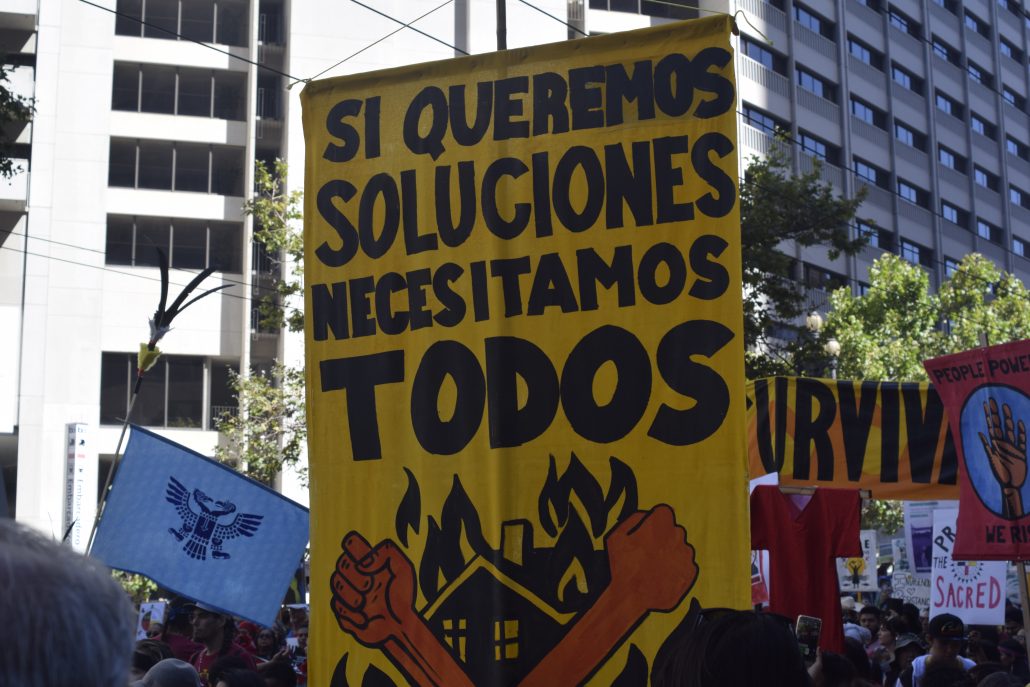
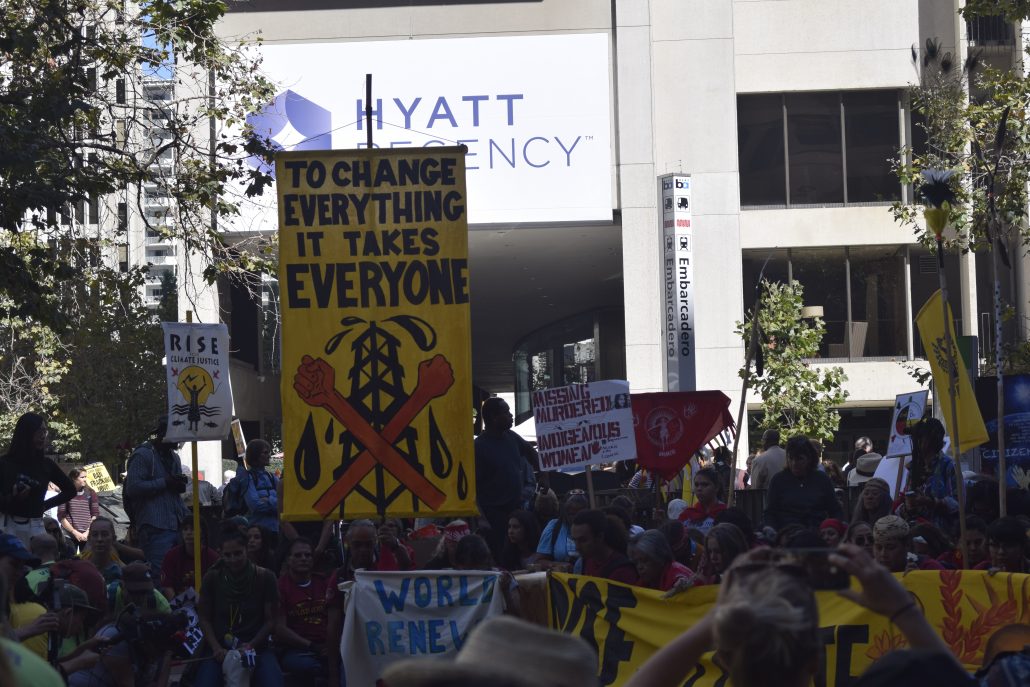
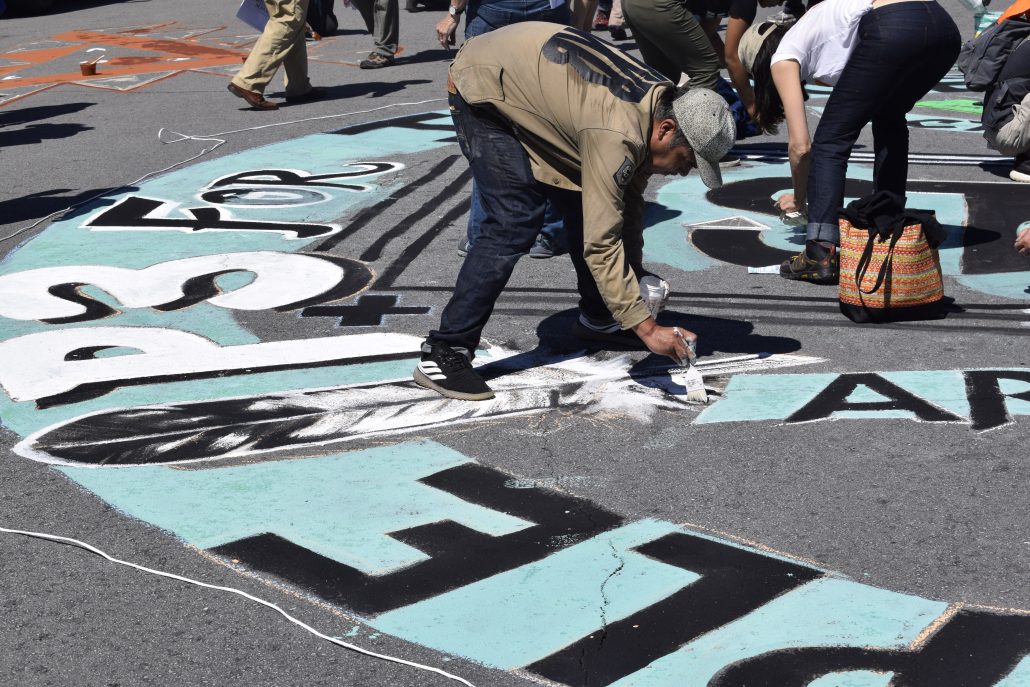
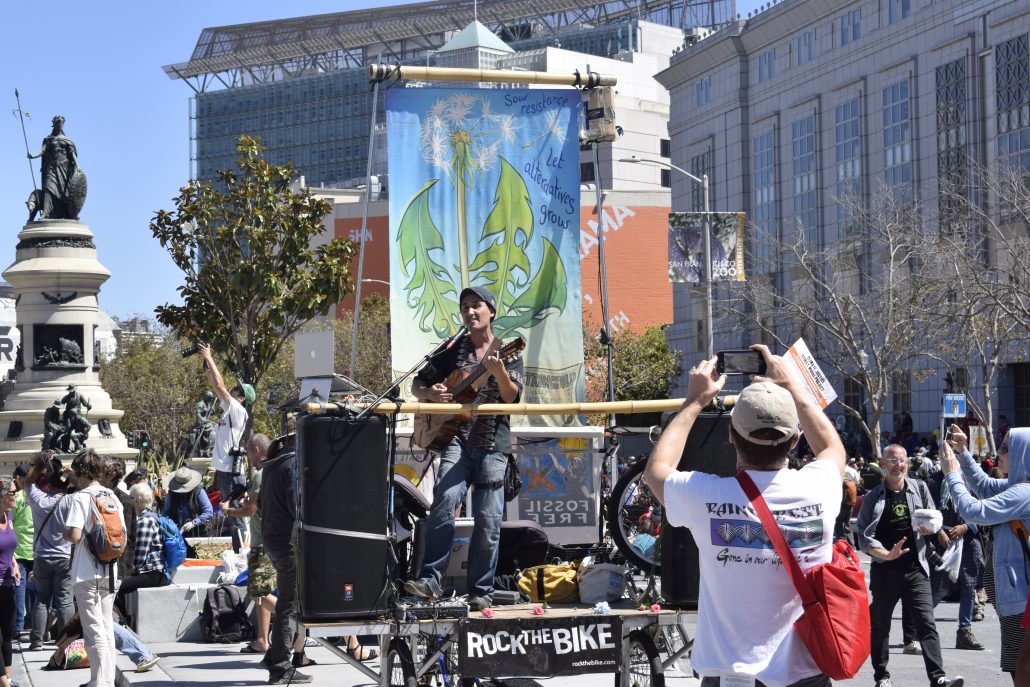
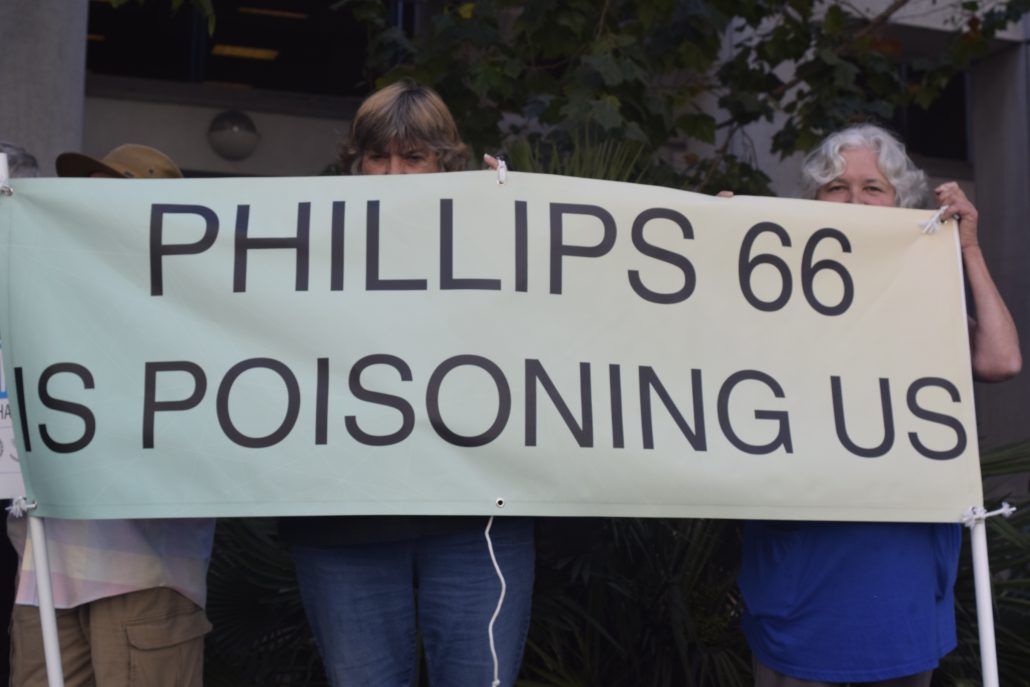
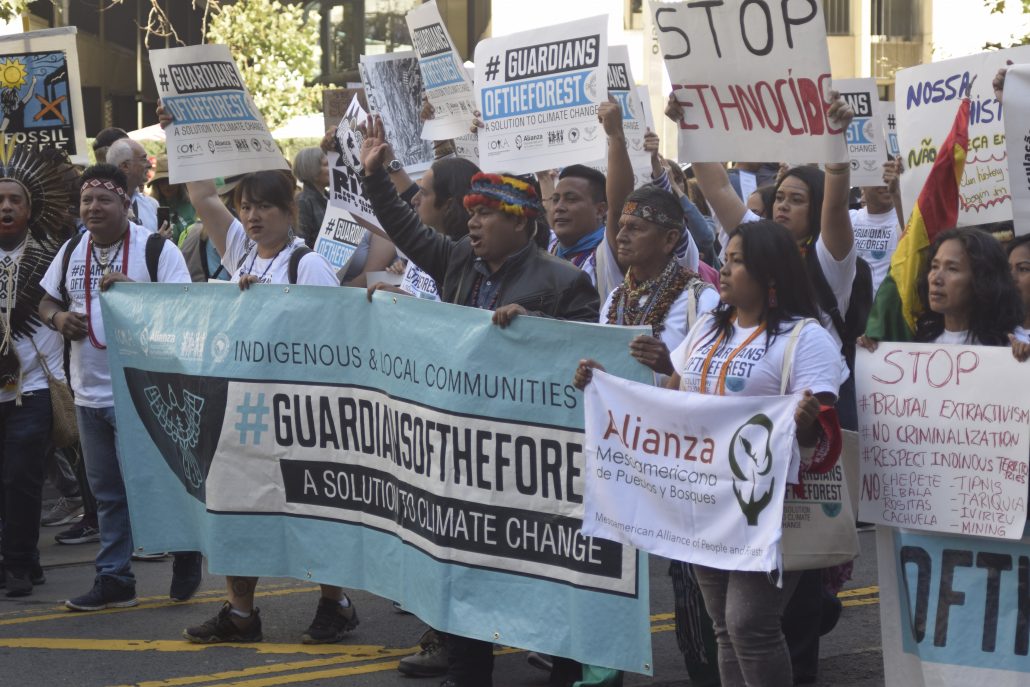
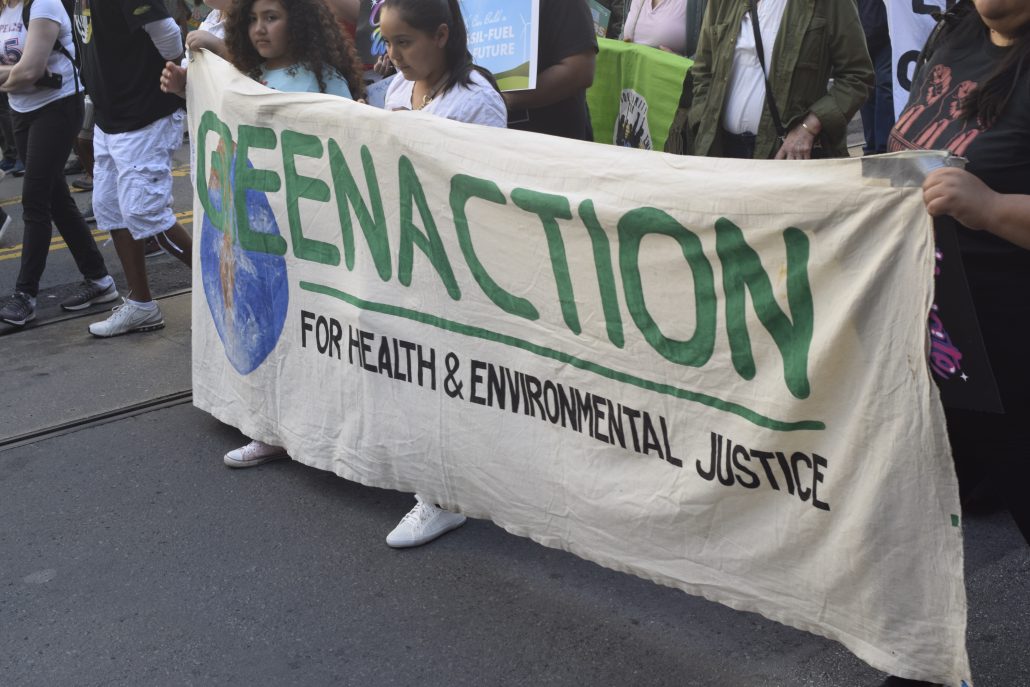
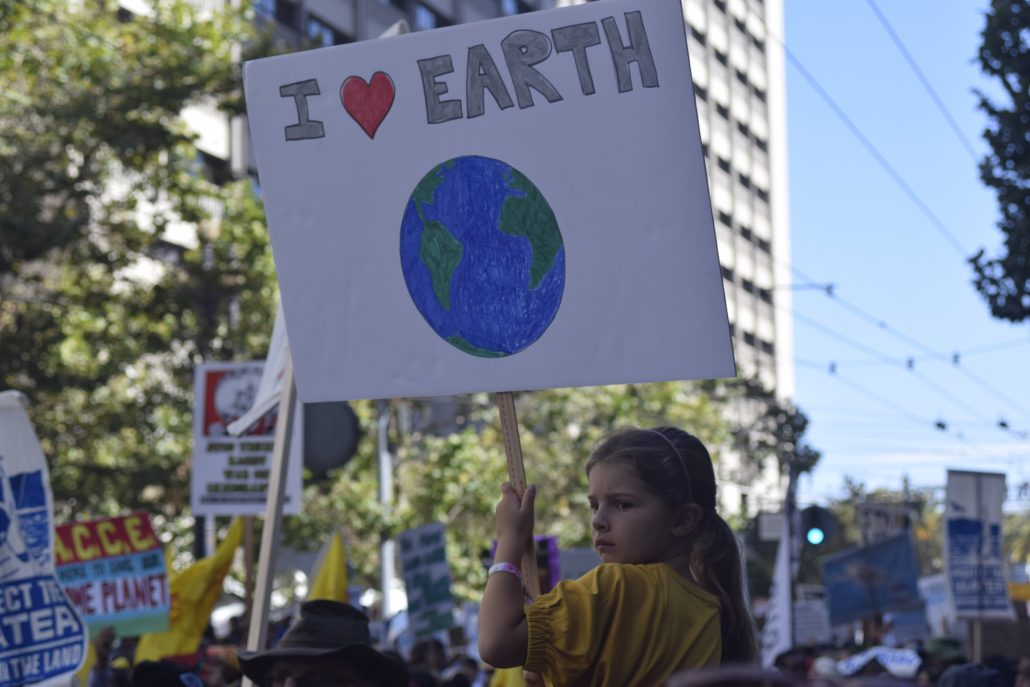
In San Francisco, the march was led by members of the Indigenous community, making up the Indigenous Bloc, on the frontlines of the action. The day officially started with prayers from Indigenous leaders and a moment of silence for Indigenous Peoples that have been most harmed by the effects of climate change. Dozens of various other movements followed the Indigenous Bloc in a parade of support. FracTracker took the opportunity to document this monumental event, and photos from the march are shown below.
March Photos
For California and international “climate leaders” in attendance, Rise kicked off a long week of climate action culminating with the Global Action Climate Summit. The week is full of activities geared towards movement building, including the Solidarity to Solutions Summit (#sol2sol) by It Takes Roots; Women’s Assembly for Climate Justice, hosted by Women’s Earth and Climate Action Network; and mass actions including a march and occupation of the Global Climate Action Summit!
SB100
To mark such a momentous movement, the Brown administration signed a new bill into law, SB100. The new law, authored by Kevin De León (D-Los Angeles), pledges that all of California’s electricity will come from clean power sources by 2045. Brown said, “California is committed to doing whatever is necessary to meet the existential threat of climate change.” This is the most ambitious state climate policy in the U.S. The legislation barely passed the state Legislature after nearly two years of debate, with opponents arguing that it would lead to higher electric bills for all Californians.
Opposition from Eco-Activists
In opposition to the feel-good, pat-yourself-on-the-back feelings from delegates at the summit, frontline communities and activists respond that the SB100 legislation does nothing to stop harms to frontline communities caused by extraction and the supply side of the fossil fuel economy. The Against Climate Capitalism campaign is a coalition of Diablo Rising Tide teamed up with Idle No More SF Bay, the Ruckus Society, It Takes Roots, Indigenous Environmental Network and the Brown’s Last Chance. Members of the coalition have been outspoken proponents organizing in support of real climate leadership. The coalition is pushing for Governor Jerry Brown and the California legislature to end the extraction of new fossil fuels in California. The green groups making up these larger coalition networks encompass a broad range research and advocacy groups, from international groups like Greenpeace to local grassroots movements from Los Angeles and California’s Central Valley. FracTracker Alliance is also a campaign member.
The goal of the campaign is to keep fossil fuels in the ground, and supports a just transition from a fossil fuel economy to clean energy sources. A petition to pressure California Governor Jerry Brown to end fossil fuel extraction can be found on their website. The California legislature and the Brown administration has consistently failed to address the impacts of extraction in its own backyard. While frontline communities are suffering, the Brown administration continues to take the easy way out with future legislation such as SB100, which does nothing to address the environmental justice spector of actual oil drilling and production. In response to SB100, the campaign has issued response:
Governor Brown has consistently failed to address the supply side of oil and the drilling in California, which is an indispensable step to avoid the worst effects of climate destruction.
Some 5.4 million Californians live within a mile of at least one oil or gas well, and this includes hundreds of thousands of children. Many suffer illnesses from toxic exposure and cannot wait for action.
Brown’s failure to act on this issue is a massive moral failure from which no bill signing can distract. Despite his signing of an important and historical bill he did nothing to draft or support, Governor Brown can expect to be greeted with energetic and committed protest at the Global Climate Action summit this week.
With these poignant criticisms, it begs the question; how can Governor Jerry Brown continue to ignore the actual cause of climate change? Brown has passed legislation ensuring that everyday Californians will bear the costs for clean energy utilities, but has done nothing to hold accountable the actual culprits responsible for climate change, the oil and gas corporations extracting the 5.7 million barrels of oil per year from California soil.
Talking about fracking all day, every day, can be a bit of a downer. Here at FracTracker, we find hope in the advances of clean energy across the country and around the world. This time around, let’s see how Missouri’s clean energy sector is fairing. Long story short – while it seems their clean energy is a bit behind in the game, at least they are trying.
In collaboration with our partners at Environmental Entrepreneurs (E2), FracTracker Alliance produced a series of maps investigating current clean energy businesses and sites where renewable energy is and can be generated. They aim to describe Missouri’s clean energy economy – and how much room it has to grow. Here is a sneak peak at some of these maps, below:
Map 1, above, shows clean renewable energy generation in Missouri. Solar and wind are the most dominant forms of renewable energy in Missouri. Missouri’s clean energy generating capacity is highest in the northwest corner of the state, where several large wind-energy projects are located. The state has 6 wind farms in this region including the newly-announced 100 MW Hawthorne Wind Farm and 49 MW High Prairie Wind Farm. In total, Missouri produces 1,000 MW of wind energy from about 500 turbines. Solar power is more dominant across the rest of the state, especially with schools’ solar energy generation around Kansas City and St. Louis and solar farms throughout the rest of the state, including Pulaski, Macon, and Bates counties. All in all, about 702 megawatts of wind and solar capacity are installed currently, with another 458 megawatts currently proposed to be built.
However, much more potential remains to be tapped as shown in Map 2, above. This holds true across solar, wind, and other renewable energy sources – particularly in the southwest corner of the state, where solar energy potential is the highest.
Missouri has up to 275,000 MW of wind potential energy, and these maps of energy potential show that overall, approximately 75% of the state has above-average potential for solar power. This is an important statistic since coal fueled 81% of Missouri’s electricity in 2017; only two other states burned more in 2017. Also, the new addition of bidirectional natural gas flow to the Rockies Express Pipeline means stiffer competition for renewables from the natural gas market.
It looks like the transition to clean energy in Missouri is happening, but there is always work to be done (nerdy “energy” joke). According to the E2 Missouri Clean Jobs Report, there is a lot of room for the clean energy sector to develop.
The potential does exist for the sector to drive economic growth in the state by being a major contributor to job growth. According the Environmental Entrepreneur’s Midwest Advocate Micaela Preskill, the industry in Missouri is slated to grow another 4.5% through 2019. Recent hires in the sector show that the workforce is very ethnically diverse, with the percentage of minority new hires doubling the average state demographics. Also 14% of new hires are veterans. Map 3, above, displays over 400 businesses, including energy efficiency contractors and renewable energy installers, which cover all 34 state senate districts. Surveys indicate that 80 percent of businesses working in clean energy in Missouri employ fewer than 25 individuals, illustrating the importance of small businesses in the clean-energy sector.
With the new state policies that support the transition from fossil fuels and the growing clean energy economy, Missouri is on a path to becoming more sustainably focused. This is particularly important because of the state’s past and present reliance on coal, and the availability of natural gas. More investment of state and federal resources in the clean energy sector could provide the boost that benefits state’s health, environment and economy through new jobs and manufacturing.
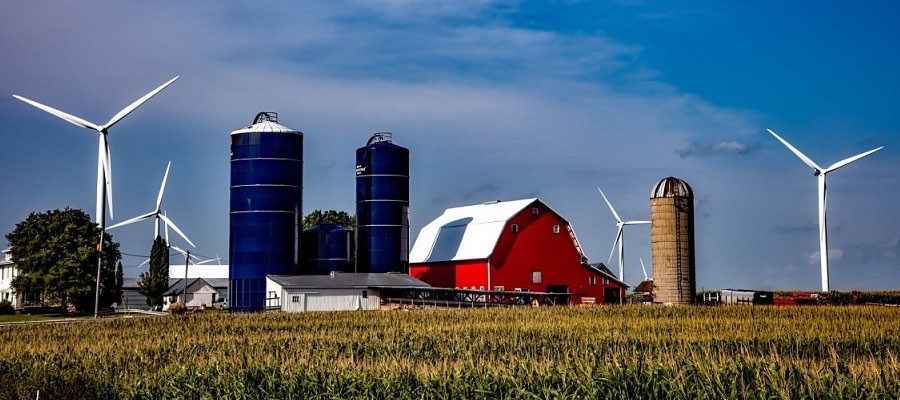
Behind in the Game Feature Image: Wind and farm. Creative Commons license.
https://www.fractracker.org/a5ej20sjfwe/wp-content/uploads/2018/08/FarmWind-Feature.jpg400900Kyle Ferrar, MPHhttps://www.fractracker.org/a5ej20sjfwe/wp-content/uploads/2025/09/2025-Wordmark-Logo.pngKyle Ferrar, MPH2018-08-22 11:30:442021-04-15 14:57:40Missouri’s clean energy is behind in the game, but at least they’re trying
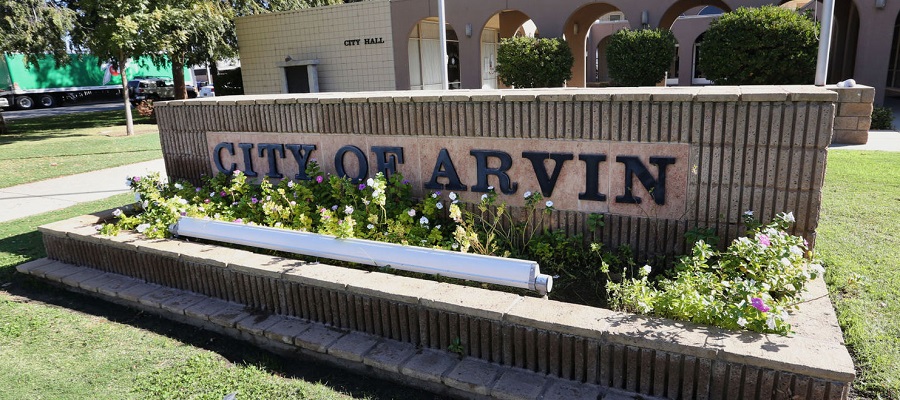
The small city of Arvin, CA has succeeded in taking a brave step forward to protect the public health of its community.
On July 17, 2018 the Arvin City Council voted 3-0 (two members were absent) in support of a setback ordinance. This is the first California oil and gas ordinance that has an actual effect, as it is the first in a region where drilling and fracking are actively occurring. The Arvin, CA setback ordinance prevents wells from being drilled in residential or commercially-zoned spaces. Also, setback distances of 300 feet for new development and 600 feet for new drilling operations have been established for sensitive sites, such as parks, hospitals, and schools.
(To see where other local actions have been taken in California, check out our coverage of local actions and map, which was recently updated.)
More details and maps of the setback ordinance and its development can be found in the initial FracTracker coverage of the proposal, below:
The measure was supported by Arvin Mayor Jose Gurrola. He described the front-lines experience of Arvin citizens:
The road to the update has been difficult for this community. Eight Arvin families were evacuated after a toxic gas leak from an underground oilfield production pipeline located near their homes in 2014. Some have now been re-occupied by concerned residents with no other options; other homes still stand empty. Meanwhile, a short distance away an older pump jack labors day and night next to homes pumping oil mixed with water to a nearby tank. Despite multiple complaints to state agencies of odors and noise by the residents, they are told by the agencies that there is nothing that can be done under the current regulations. The pump jack continues to creak along as children walk nearby on their way to school, covering their faces as the smell occasionally drifts their direction. – Jose Gurrola, Mayor of the City of Arvin
Fugitive Emissions Monitoring
In anticipation of the city council’s vote, FracTracker collaborated with Earthworks and the grassroots organization Central California Environmental Justice Network to visit the urban well sites within the city limits. Using Infrared FLIR technology, the sites were assessed for fugitive emissions and leaks. Visualizing emissions of volatile organic compounds (VOCs) at these sites provides a glimpse to what the community living near these wells are continually exposed. The infrared cameras used in these videos are calibrated to the wavelengths of the infrared spectrum where VOC hydrocarbons of interest are visible.
The map below shows the locations that were visited, as indicated by the three stars. Videos of each site are shown below the map.
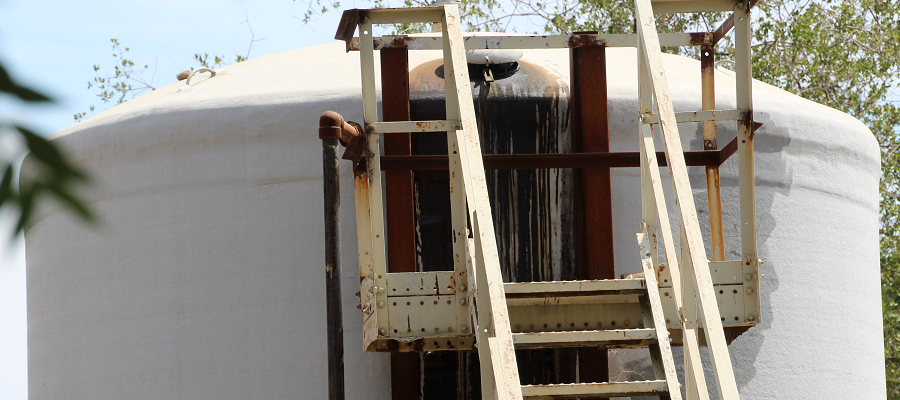
In this FLIR video of Sun Mountain Simpson-1, fugitive emissions are obvious. The emissions are coming from the PV vent at the top of the produced water tank. These emissions are a mixture of a variety of volatile organic compounds, such as BTEX compounds and methane. This well site is located between homes, a small apartment complex, and a playground. While on the ground operating the FLIR camera I felt light headed, dizzy, and developed a headache. The emissions were reported to the San Joaquin Valley Air District (SJVAD), who sampled and found VOC concentrations at dangerous levels. The well operator was notified but refused to respond. Unfortunately, because this particular well produces under 50 barrels of oil/day, the site is exempt from any health related emissions regulations.
Sun Mountain Jewett 1-23 Lease
This well site is located near a number of single family homes and next two a park. The well site is also on the future location of the Arvin Community College. The FLIR video below is particularly interesting because it shows fugitive emissions from four different locations. The leaks include one at the well head that is potentially underground, one on separator equipment, and leaks from each of the tank PV hatches. When regulators were notified, they visited the site and fixed two of the leaks immediately. Fugitive emissions from the PV hatches were not addressed because this site is also exempt from regulations.
ABA Energy Corporation Richards Facility Tank Farm
The Richards Facility Tank Farm is a well site located outside the city limits on farmland. The facility is regulated as a point source of air pollution, therefore enforcement action can require the operator to fix leaks even from PV hatches on tanks. This FLIR video shows leaks from PV hatches, and a major leak from a broken regulator valve. A complaint was submitted to the SJVAD, and the operator was required to replace the broken regulator valve.
By Vivian Underhill, Data and GIS Intern; and Kyle Ferrar, Western Program Coordinator, FracTracker Alliance
California and New York are not the only states supporting the transition from harmful fossil fuels such as natural gas to more sustainable and less polluting clean, renewable energy sources. In collaboration with Environmental Entrepreneurs (E2), FracTracker has produced a series of maps investigating current clean energy businesses, existing renewable energy infrastructure, and renewable energy potential. These maps show where growth of the renewable economies is growing and even identifies the many renewable contractors and projects that are planned and already active across the country.
Michigan’s Clean Energy Sector
According to the Clean Jobs Midwest Report, growth of the renewable sector has been a strong boon for local Michigan economies, in addition to reducing green-house gas emissions. Michigan increased clean energy jobs by 5.3 percent, or 4,655, outpacing other job sectors in the state by a factor of three. According to a new Union of Concerned Scientists Report, Michigan utilities could create 10 times more jobs in renewables than natural gas. Another report by the Union of Concerned Scientists notes that:
… using the latest wind turbine technologies, Michigan’s onshore wind resource has the potential to generate nearly five times the state’s 2012 electricity demand, even after a variety of competing land uses are accounted for. Solar photovoltaic (PV) resources in urban areas — including large ground-mounted and smaller rooftop systems — could provide another 71 percent of the state’s 2012 electricity demand.
FracTracker’s maps below show plenty of potential for additional renewable energy generation, and highlight where Michigan’s clean energy sector is already paving the way to a healthier future. But first, let’s give you some background on this story.
Legislation
In 2008, Michigan passed legislation requiring utilities to generate 10% of their electricity from renewables by 2015. In 2014, The Michigan Public Service Commmission (MPSC) reported that this legislation would save the state over $4 billion dollars; as the MPSC Chairman John D. Quackenbush wrote in conjunction with a 2014 report on the state’s energy optimization activities: “The cheapest energy is the energy never used… For every dollar spent on these programs in 2014, customers can expect to realize $4.38 in savings – more than any year since 2010.” In addition, the statute’s focus on renewables has brought nearly $3 billion in renewable energy investment to the state.
In 2016, legislators built on this track record and improved aspects of the state’s clean energy standards with Public Acts 341 and 342; among other things, these acts increase the percentage of renewable energy to 15% by 2021, and otherwise incentivize clean energy sources.
Below we have embedded the maps FracTracker created with E2, showing clean energy potential, generation capacity, and the location of clean energy businesses in Michigan.
As shown in the map above, solar and wind are the most dominant forms of renewable energy in Michigan, although there is also potential to take advantage of the geothermal energy. Approximately 75% of the state has potential for either wind, solar, or geothermal power.
Map 2, above, shows the current generating capacity in the state. Most of Michigan’s existing solar and wind infrastructure exists in the South and Southeast portions of the state, though not exclusively. Many schools also have solar capabilities on their roofs. Further, 32 counties already have large-scale renewable energy projects, and many more are in in the works.
Finally, a vibrant industry of over 1,200 businesses has developed to support the clean energy revolution in Michigan. Map 3 (above) shows the locations of these entreprenuers in fields that include both energy efficiency and renewable energy generation (solar, wind, and geothermal). Businesses include a range of operations including design, machining, installation, contracting, and maintenance – covering all 38 state senate districts and all 110 state house districts.
Room to Grow
While Michigan has come a long way in recent years, the field of clean renewable energy generation is still in its infancy. This geographical assessment, in addition to the numerous economic reports showing the profitability of the clean energy sector, paint a brighter future for Michigan and the climate. However, much more potential remains to be tapped, across solar, wind, and other renewable energy sources. It is imperative that policies are put in place to prioritize clean energy growth over natural gas.
Cover photo: MI Wind Farm. Photo by Michelle Froese | Windpower Engineering and Development
Explore additional state analyses: IL | MI | MO | NY | OH | PA
https://www.fractracker.org/a5ej20sjfwe/wp-content/uploads/2018/06/windfarm_re.jpg400900Kyle Ferrar, MPHhttps://www.fractracker.org/a5ej20sjfwe/wp-content/uploads/2025/09/2025-Wordmark-Logo.pngKyle Ferrar, MPH2018-06-04 15:00:242021-04-15 15:01:17Michigan’s budding renewable clean energy sector has room to grow
The head of Murray Energy Corporation, Robert Murray, is very close to the highest office in the land. Such an association demands a close look at the landscape from which this corporation and its founder arouse.
Belmont County, Ohio’s most famous tycoon Robert Murray has established a close relationship with the Trump administration. This connection dates back to his $300,000 contribution to Trump’s inauguration. The intimacy of this relationship has been given new weight recently when it was revealed that a hug between Mr. Murray and the Department of Energy’s Secretary Rick Perry preceded a meeting where Mr. Murray presented the administration with a memo outlining a 16-point plan for removing some of the burdensome regulations put in place by Mr. Murray’s least favorite person former President Barack Obama.
Among the few consistent themes from this most inconsistent of presidents has been a fondness for coal and steel, where brawny men do essential work and are threatened not by shifting economics, but by greenies and weenies who want to shut them down. Mr Trump and Mr Murray both want environmental rules rolled back—Mr Murray because it would be good for his bottom line, and Mr Trump because a second consistent aim of his presidency is to reverse anything done by Barack Obama. It is doubtful whether policy shifts alone could revive coal mining, but the attempt to do so says much about how vested interests operate in this administration… Mr Trump played a hard-nosed businessman on TV, but Mr Murray is the real thing. – The Economist, 2018
Not only has Mr. Murray succeeded in capturing the hearts and minds of the Trump administration, he has demanded that his $300,000 contribution get his longtime Oklahoman lawyer, and former aide to the senate’s chief climate skeptic James M. Inhofe of Oklahoma, the #2 spot behind Scott Pruitt at the EPA. Mr. Murray is so powerful that he managed to get Perry & Co. to fire the photographer that took the photo of the tender moment between Messrs. Perry and Murray.
Awkwardness aside, these situations could reasonably lead one to conclude that Perry and Pruitt are competing for Murray’s favor in the event they choose to run for higher office and need a patron with deep pockets. Mr. Murray would be in a real pickle if they both chose to run for the highest office in the land, with two fawning candidates potentially offering to one-up the other in terms of incentives and/or regulatory carve outs for Mr. Murray’s beloved King Coal.
Once the heart of Ohio Coal Country, Belmont Co. is now a major player on the hydraulic fracturing landscape, as well.
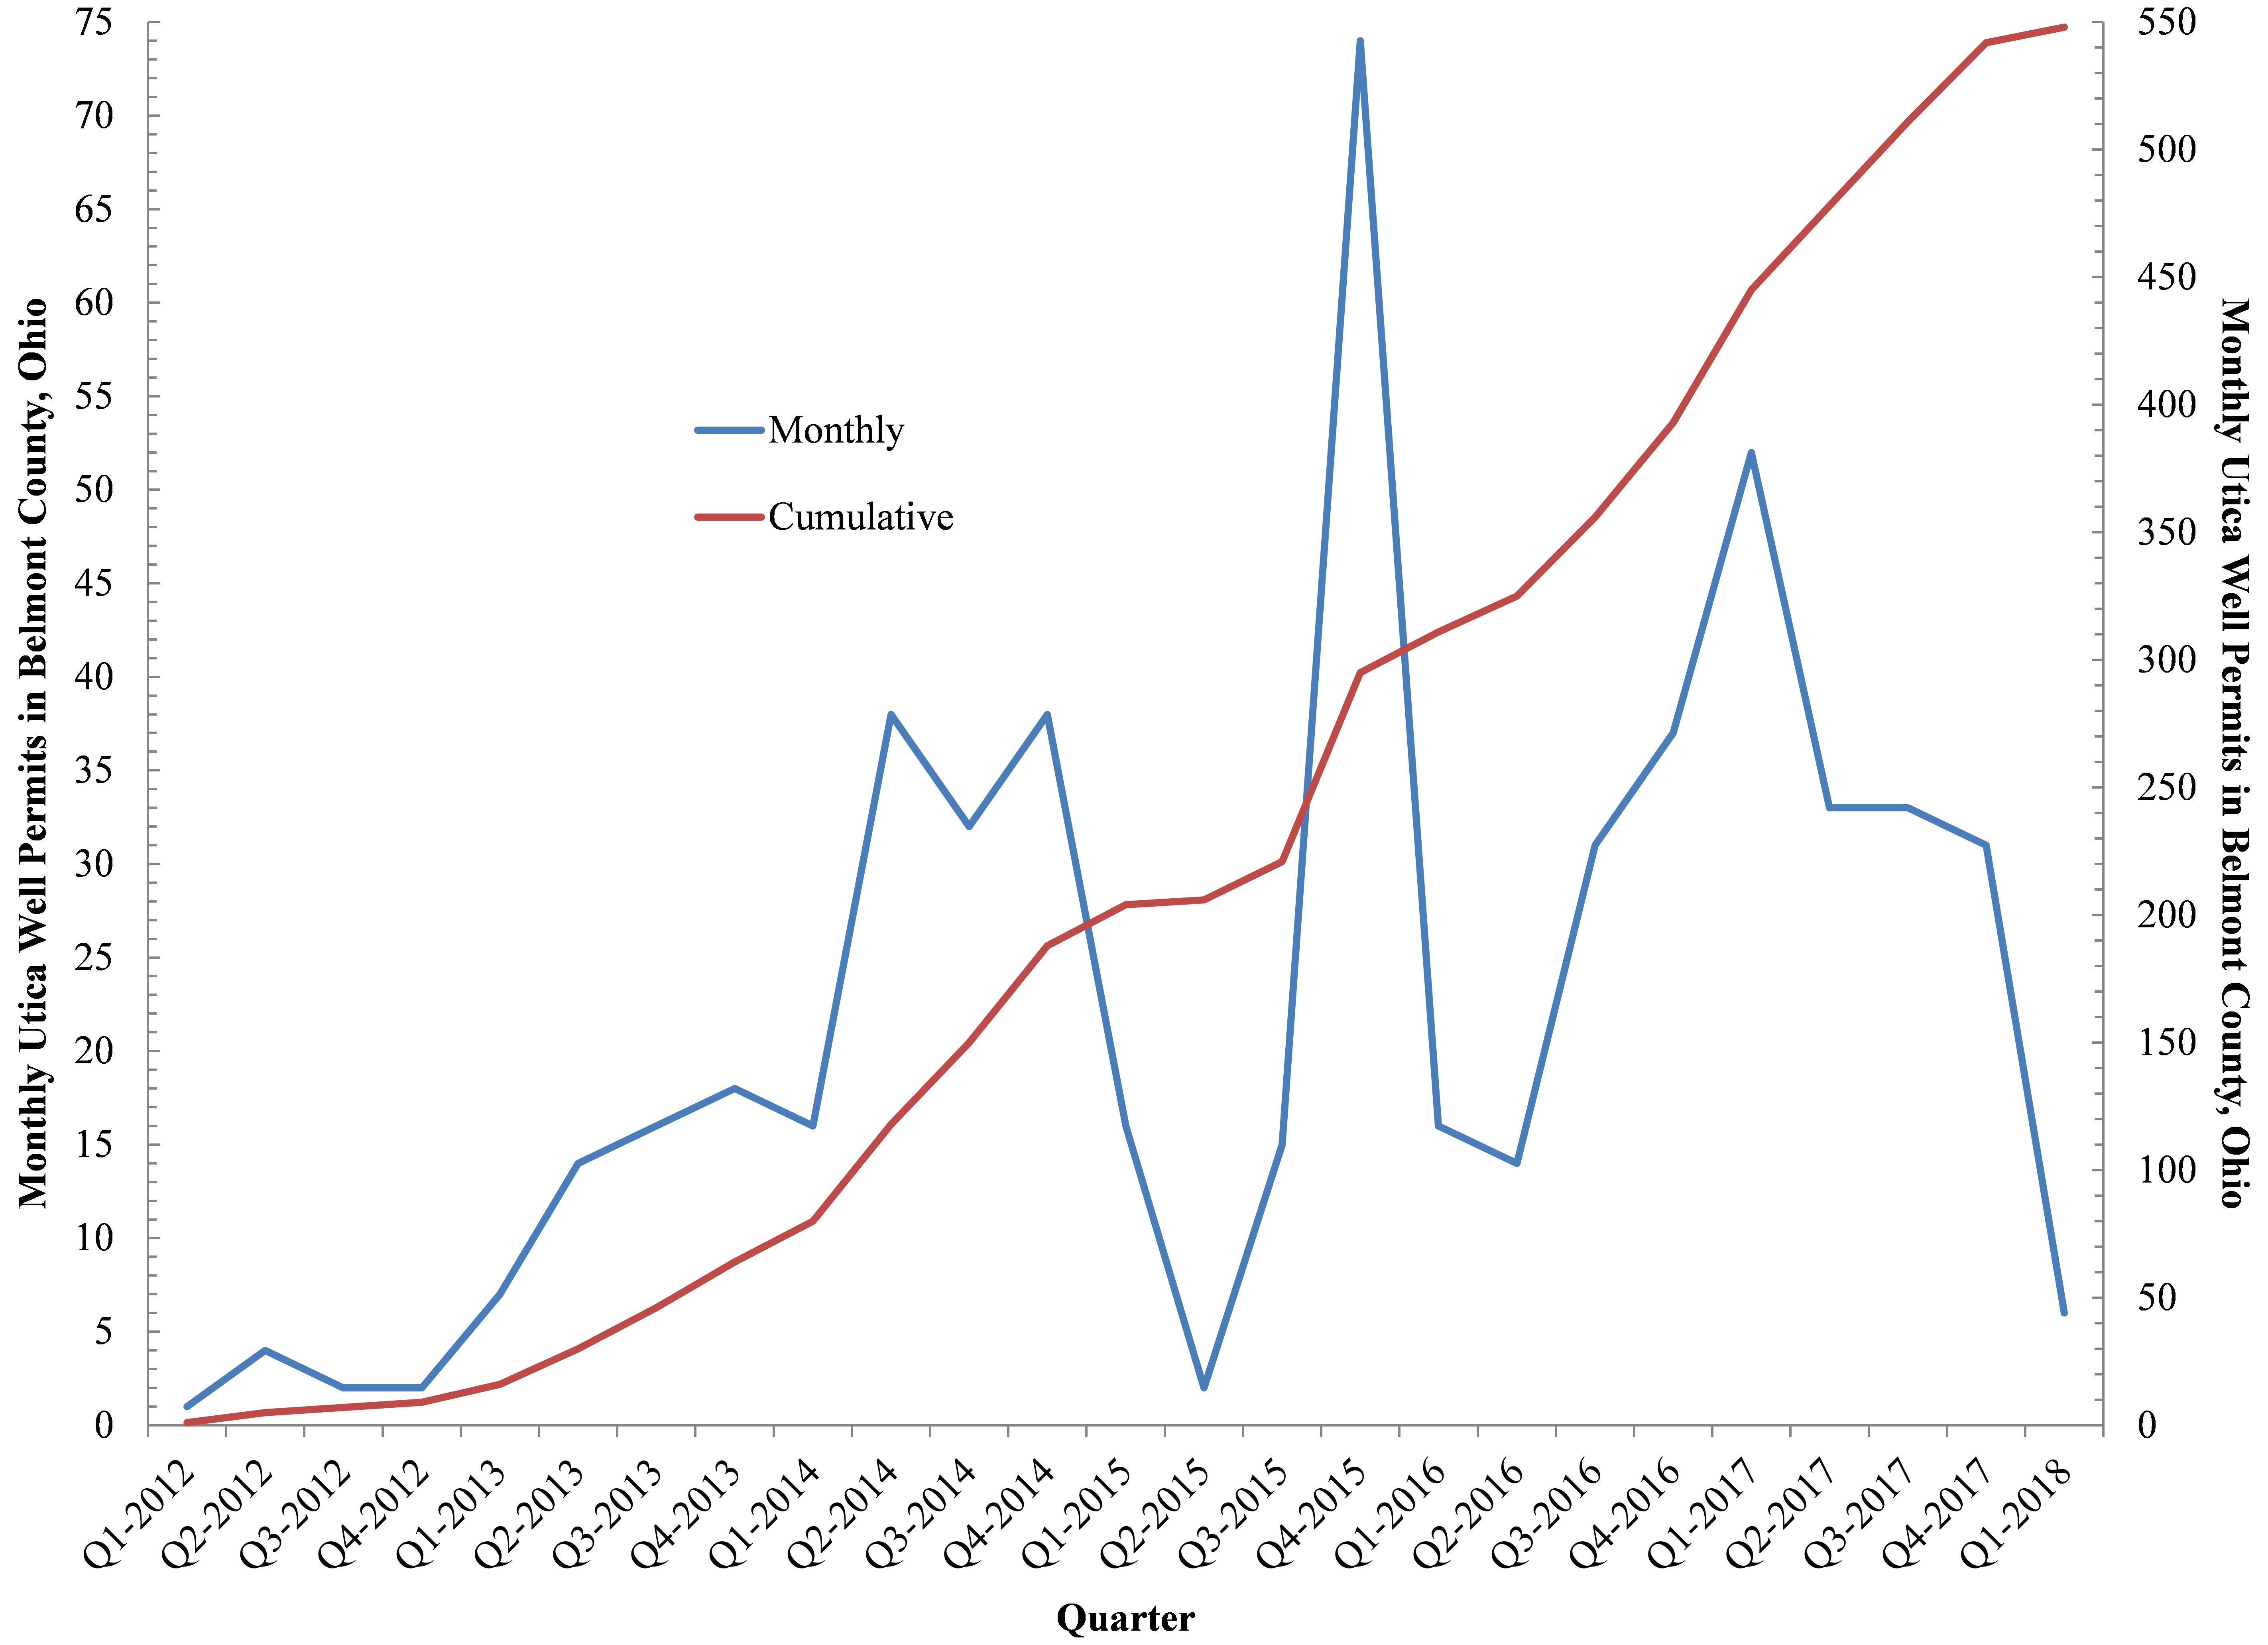
Given the growing influence of Mr. Murray and the coal industry writ large we thought it was time to do a deep dive into how Mr. Murray’s Appalachian Ohio home county of Belmont and surrounding counties have been altered by coal mining. We were also interested in how the coal industry has come to interact with the hydraulic fracturing industry, which has drilled 542 Utica wells in Belmont County alone since March 2012. These wells amount to 20% of all fracked wells in Ohio as of January 2018. The rate at which Utica wells are being permitted in Belmont County is actually increasing by about 1.5 to 2 permits per month or 5.5 to 7.8 times the statewide average (Figure 1).
Belmont County also happens to be the “all-time leader in coal production in Ohio” having produced 825 million tons since 1816 (ODNR, 2005). All of this means that the Ohio county that produces the most coal is also now The Buckeye State’s most actively drilled county.
Figure 1. Monthly and cumulative hydraulically fractured wells in Belmont County, Ohio between Q1-2012 and Q1-2018
However, the days of coal’s dominance – and easily mineable coal – in Ohio appear to be coming to an end.
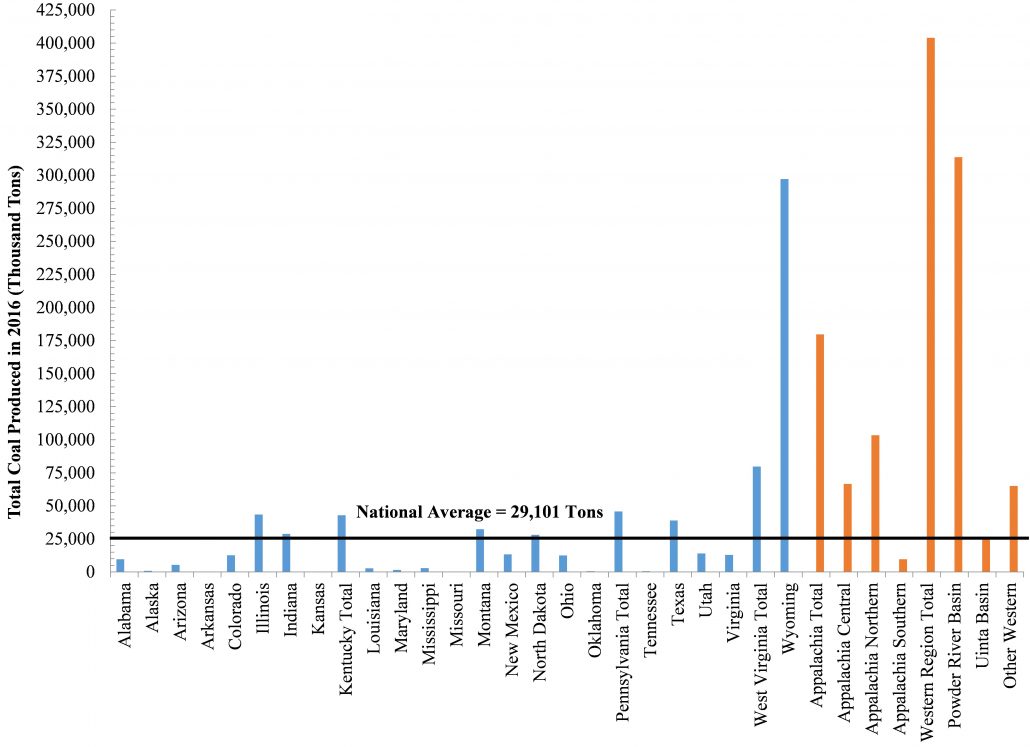
Per mine, Ohio’s mines produce about 30% of the national average and 43% of the state averages (Figure 2). Ohio’s mines only produce about 10% of what the mega Western mines produce on a per-mine basis, and much less than states like New Mexico and Texas, as well.
Even with automation, the barriers to a return of coal in Appalachia are formidable given that most of the easily recoverable coal has already been mined. Additionally, the landscape is more formidable and not as conducive to the large strip-mine and dragline operations of the Powder River Basin, which produce roughly 8.5 million tons of coal per mine, compared to an average of 330,000 tons per mine in Appalachia. (Figure 2).
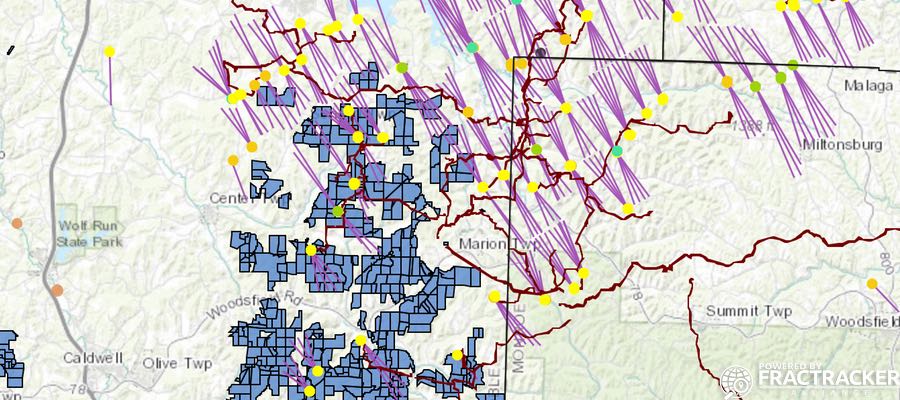
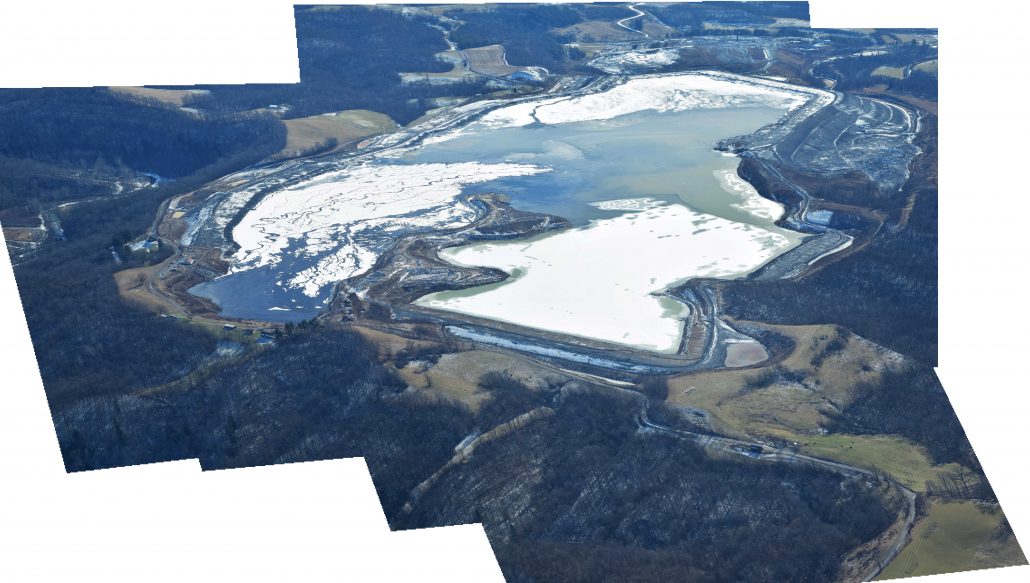
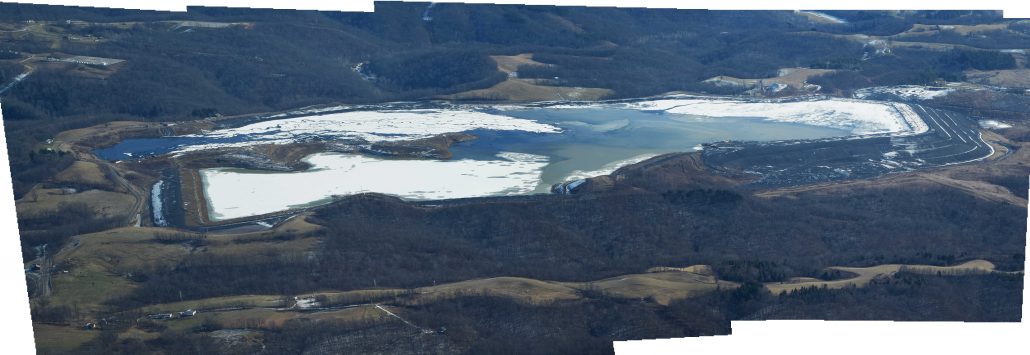
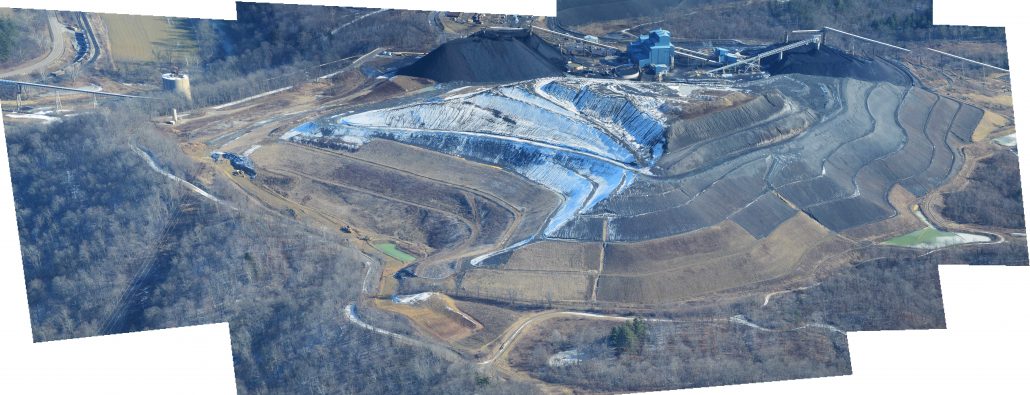
The below map depicts parcels owned by coal mining companies in the Ohio counties of Belmont, Noble, Guernsey, and Muskingum, as well as previously mined and/or potential parcels based on owner and proximity to existing mines.
We also incorporated production data (2001 to 2016) for 116 surface and strip coal mines in these and surrounding counties, natural gas pipelines, hydraulically fractured laterals, and Class II Salt Water Disposal (SWD) injection wells as of January 2018.
There are few areas in the United States where underground coal mining and fracking are taking place simultaneously and on top of each other. What could possibly go wrong when injecting massive amounts of fracking waste at high pressures into the geology below, while simultaneously pumping billions of gallons of water into hydraulically fractured laterals and mining coal at similar depths?
In the coming months and years we will be monitoring Belmont County, Ohio as an unfortunate case-study in determining the answer to such a unique question.
At the present time:
Murray Energy, its subsidiaries, and other coal companies own approximately 15% of Belmont County.
Coal companies and their associated real-estate firms and subsidiaries have mined or own approximately 5,615 square miles across the Noble, Belmont, Guernsey, and Muskingum counties.
The 116 mines in this map have mined an average of 3.22 million tons of coal since 2001 and more than 373 million tons in total. Mr. Murray’s mines account for 50% of this amount, producing nearly 15 times more coal per mine than the other 112 mines.
Collectively, these mines have contributed 1.09 billion tons of CO2 and CH4+N2O in CO2 equivalents to atmospheric climate change, or 68 million tons per year (MTPY). This volume is equivalent to the annual emissions of nearly 60 million Americans or 19% of the population.
Murray’s mines alone have contributed enough greenhouse gases (CO2+CH4+N2O) to account for the emissions of 9.2% of the US population since 2001. Each Murray mine is belching out 8.41 million tons of greenhouse gases per year or roughly equivalent to the emissions of 463,489 Americans.
Relevant data for this map can be found at the end of this article.
Broader Implications
Robert Murray’s influence and mining impacts extend well beyond Appalachian Ohio.
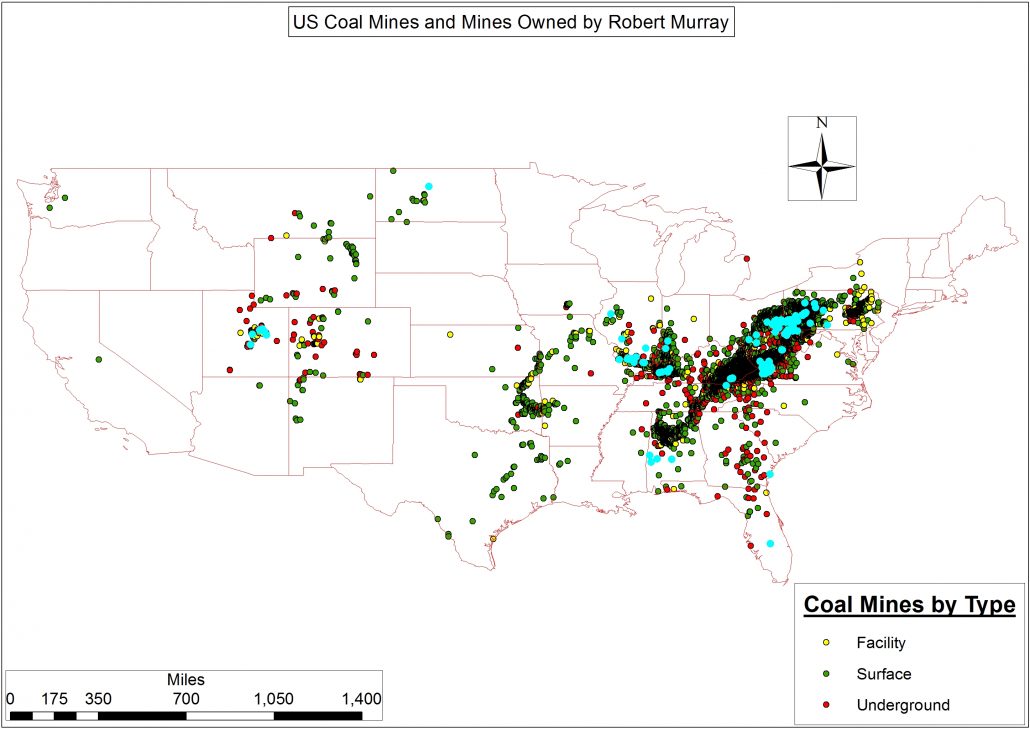
Mr. Murray’s is the primary owner of 157 mines and associated facilities1 across eleven states – and five of the six major Lower 48 coal provinces – from Utah and North Dakota to Alabama, Georgia, and Florida (Figure 3). Mr. Murray likes to highlight his sage purchases of prime medium and high volatility bituminous coal real-estate over the years on his company’s website. However, nowhere in his corporate overview does he mention his most notorious mine: the abandoned and sealed underground Crandal Canyon Mine, Emery County, Utah. It was at this mine on August 6, 2007 that a collapse trapped six miners and resulted in their deaths, along with the deaths of three rescue workers. Mr. Murray told the BBC that he had had an emotional breakdown and hadn’t deserted anyone living in a little trailer adjacent to the mine’s entrance every day following the collapse. Furthermore, Mr. Murray blames such events on subsidiaries like Grenwal Resources Inc., which happens to be the owner of record for the Crandal Canyon Mine and is one of thirty-three unique subsidiaries owned by Mr. Murray (data download).
Figure 3. US Coal Mines by type and Mines Owned by Robert Murray highlighted in turquoise
Table 1. Robert Murray coal mine ownership by mine status
Status
Number of Mines
Abandoned
68
Abandoned and Sealed
62
Active
12
Non-Producing
10
Temporarily Idled
5
Total
157
The Politics of Energy
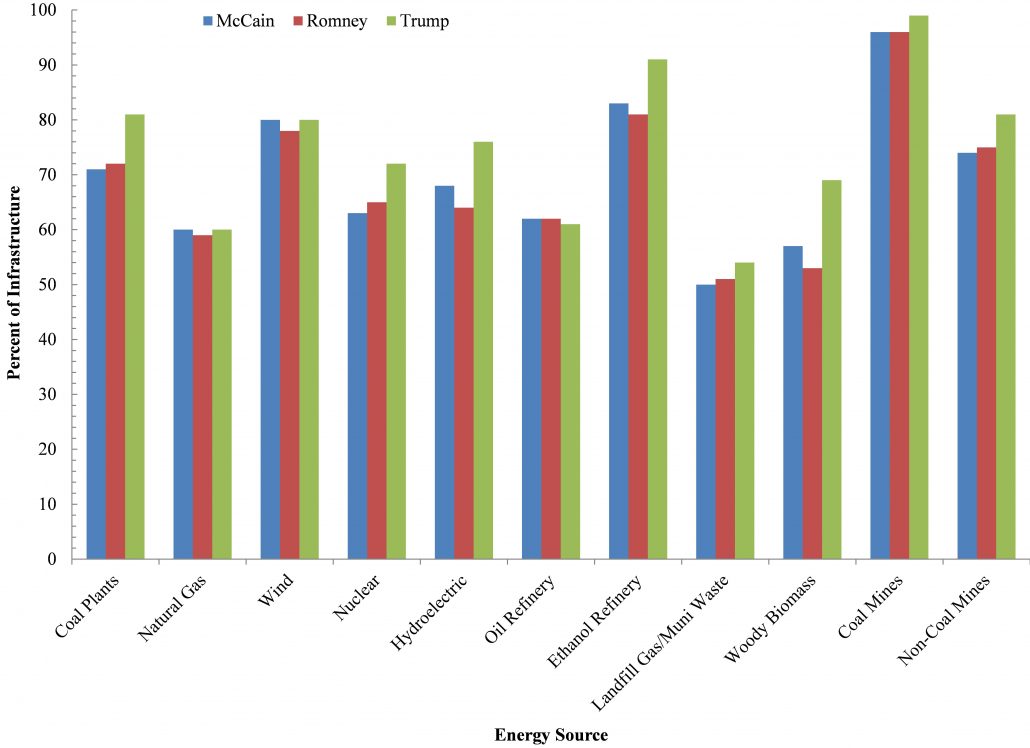
Robert Murray and his fellow fossil fuel energy brethren’s bet on Trump paid off, with Trump winning 99% of the vote in congressional districts where coal mines exist (Figure 4). Such a performance bested the previous GOP candidates of McCain and Romney even though they had achieved an impressive 96% of the vote. Interestingly, Trump did nearly as well in congressional districts dominated by wind farms and ethanol refineries where more than 87% of the electorate was white.
Figure 4. Presidential election results for GOP candidates in voting districts where various forms of energy are produced and/or processed, 2016, 2012, and 2008
Trump & Co. promised these districts that his administration would breathe life into the fossil fuel industry. True, Trump, Pruitt, Perry, and Interior Secretary Ryan Zinke are greasing the skids for the industry’s revival. In terms of annual production, however, it is far from certain that such moves will translate into the types of boost in employment promised by Trump during the 2016 campaign. Even if production does return, executives like Murray admit that the advent of efficiencies and extraction technologies means that the industry is mining more coal per miner than ever before:
“Trump has consistently pledged to restore mining jobs, but many of those jobs were lost to technology rather than regulation and to competition from natural gas and renewables, which makes it unlikely that he can do much to significantly grow the number of jobs in the industry,” said Murray. “I suggested that he temper his expectations. Those are my exact words,” said Murray. “He can’t bring them back.” – The Guardian, March 27, 2017
Conclusions and Next Steps
It remains to be seen how the coal mining and fracking industry’s battle for supremacy will play out from a socioeconomic, health, environmental, and regulatory perspective. While many people understand that coal jobs aren’t coming back, we shouldn’t doubt the will of the Trump administration and friends like Robert Murray to make sure that profits can still be extracted from Appalachia.
Will the fracking industry and coal barons agree to get along, or will they wage a war on multiple fronts to marginalize the other side? Will this be another natural resource conflagration? If so, how will the people – and species like the “near-threatened” Hellbender Salamander (Cryptobranchus alleganiensis) or the region’s recovering Bald Eagle (Haliaeetus leucocephalus) population that live in the disputed Appalachian communities respond? How will their already stressed day-to-day existence be affected? To this point, the fossil fuel industry has managed to blame everyone but itself for the tepid to non-existent job growth in their sectors.
The Appalachian landscape has been deeply scarred and fragmented by coal mining, and now it is experiencing a new colonizing force in the form of the hydraulic fracturing industry. When Appalachia realizes that automation, globalization, and natural gas, are the key drivers to the downfall of coal, will they bring fire, brimstone, and pitchforks to the doorstep of Murray Energy of the fracking companies? Or is Appalachia’s future merely that of an extraction colony?
The City of Arvin, with a population of about 20,000, is located in Kern County, California just 15 miles southeast of Bakersfield. Nicknamed ‘The Garden in the Sun,’ Arvin is moving forward with establishing new regulations that would limit oil and gas development within the city limits.
Setback Map
The new ordinance proposes setback distances for sensitive sites including hospitals and schools, as well as residentially and commercially zoned parcels. The proposal establishes a 300-foot buffer for new development and 600’ for new operations.
In the map below, FracTracker Alliance has mapped out the zoning districts in Arvin and mapped the reach of the buffers around those districts. The areas where oil and gas well permits will be blocked by the ordinance are shown in green, labeled “Buffered Protected Zones.” The “Unprotected Zones” will still allow oil and gas permits for new development.
There are currently 13 producing oil and gas wells within the city limits of Arvin, 11 of them are located in the protected zones. Those within the protected zones are operated by Sun Mountain Oil and Gas and Petro Capital Resources. They were all drilled prior to 1980, and are shown in the map below.
Information on the public hearings and proposals can be found in the Arvin city website, where the city posts public notices. As of January 24, 2018, these are the current documents related to the proposed ordinance that you will find on the webpage:
In December of 2016, Committee for a Better Arvin, Committee for a Better Shafter, and Greenfield Walking Group, represented by Center for Race, Poverty and the Environment, sued Kern County. The lawsuit was filed in coordination with EarthJustice, Sierra Club, Natural Resources Defense Council, and the Center for Biological Diversity.
The Importance of Local Rule
Self-determination by local rule is fundamental of United States democracy, but is often derailed by corporate industry interests by the way of state pre-emption. There is a general understanding that local governments are able to institute policies that protect the interests of their constituents, as long as they do not conflict with the laws of the state or federal government. Typically, local municipalities are able to pass laws that are more constrictive than regional, state, and the federal government.
Unfortunately, when it comes to environmental health regulations, states commonly institute policies that preserve the rights of extractive industries to access mineral resources. In such cases, the state law “pre-empts” the ability of local municipalities to regulate. Local laws can be considered the mandate of the people, rather than the influence of outside interest on representatives. Therefore, when it comes to land use and issues of environmental health, local self-determination must be preserved so that communities are empowered in their decision making to best protect the health of their citizens.
https://www.fractracker.org/a5ej20sjfwe/wp-content/uploads/2018/01/Arvin_bakersfield_re.jpg400900Kyle Ferrar, MPHhttps://www.fractracker.org/a5ej20sjfwe/wp-content/uploads/2025/09/2025-Wordmark-Logo.pngKyle Ferrar, MPH2018-01-30 11:59:072021-04-15 15:01:28Arvin, CA – a City in the Most Drilled County in the Country – files for a Setback Ordinance
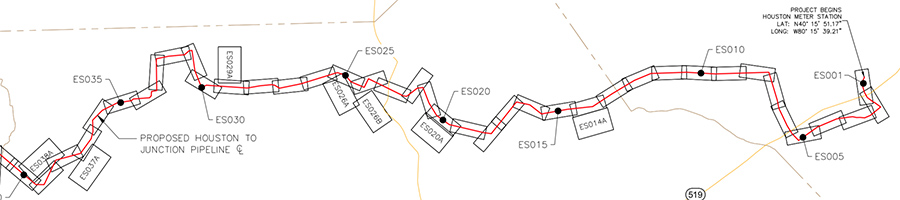
Pipelines are categorized by what they carry — natural gas, oil, or natural gas liquids (NGLs) — and where they go — interstate or intrastate. The regulatory system is complicated. This primer is a quick guide to the agencies that may be involved in Falcon’s permit reviews.
Regulating Pipelines
The siting of natural gas pipelines crossing state or country boundaries is regulated by the Federal Energy Regulatory Commission (FERC). Meanwhile, determination of the location of natural gas routes that do not cross such boundaries are not jurisdictional to FERC, instead determined by the owner pipeline company. Hazardous liquids and NGL pipelines are not regulated for siting by FERC regardless of their location and destination. However, FERC does have authority over determining rates and terms of service in these cases. The U.S. Army Corps of Engineers gets involved when pipelines cross navigable waters such as large rivers and state Environmental Protection Agencies.
Pipeline design, operation, and safety regulations are established by the Pipeline and Hazardous Materials Safety Administration (PHMSA), but these regulations may vary state-by-state as long as minimal federal standards are met by the pipeline project. Notably, PHMSA’s oversight of safety issues does not determine where a pipeline is constructed as this is regulated by the different agencies mentioned above – nor are PHMSA’s safety considerations reviewed simultaneously in siting determinations done by other agencies.
An excerpt from the U.S. Army Corps’ EIS of the Atlantic Sunrise pipeline
An EIS is based on surveying and background research conducted by the company proposing the project, then submitted to agencies as an Environmental Impact Assessment (EIA). An EIS can exceed hundreds of pages and can go through many drafts as companies are asked to refine their EIA in order to qualify for approval.
An excerpt from the PA DEP’s review of water crossings for the Mariner East 2 pipeline
Pipeline proposals are also evaluated by state and local agencies. In Pennsylvania, for instance, the PA DEP is responsible for assessing how to minimize pipeline impacts. The DEP’s mission is to protect Pennsylvania’s air, land and water from pollution and to provide for the health and safety of its citizens through a cleaner environment. The PA Fish and Boat Commission oversees the avoidance or relocation of protected species. Local township zoning codes can also apply, such as to where facilities are sited near zoned residential areas or drinking reservoirs, but these can be overruled by decisions made at the federal level, especially when eminent domain is granted to the project.
Regulating the Falcon
For the Falcon pipeline, an interstate pipeline that will transport ethane (an NGL), FERC will likely have authority over determining rates and terms of service, but not siting. Construction permitting will be left state agencies and PHMSA will retain its federal authority with the Pennsylvania Public Utilities Commission (PUC) acting as PHMSA’s state agent to ensure the project complies with federal safety standards and to investigate violations. The Army Corps will almost certainly be involved given that the Falcon will cross the Ohio River. As far as we know, the Falcon will not have eminent domain status because it supplies a private facility and, thus, does not qualify as a public utility project.
Questioning Impact Assessments
The contents of EIAs vary, but are generally organized along the lines of the thematic categories that we have created for assessing the Falcon data, as seen above. However, there is also much that EISs fail to adequately address. The Army Corp’s assessment of the Atlantic Sunrise is a good example. The final EIS resulting from the operators EIA includes considerations for socioeconomic impacts, such effects on employment and environmental justice, as seen in the excerpt below. But potential negative impact in these areas are not necessarily linked to laws requiring special accommodations. For instance, federal regulations mandate achieving environmental justice by “identifying and addressing, as appropriate, disproportionately high and adverse human health or environmental effects” of projects subject to NEPA’s EIS requirement. However, there are no laws that outline thresholds of unacceptable impact that would disallow a project to proceed.
An excerpt from the Atlantic Sunrise EIS addressing environmental justice concerns
Furthermore, the narratives of EIAs are almost always written by the companies proposing the project, using sources of data that better support their claims of minimal or positive impact. This is again seen in the Atlantic Sunrise EIS, where several studies are cited on how pipelines have no affect on property values or mortgages, with no mention of other studies that contradict such findings. Other factors that may be important when considering pipeline projects, such as concerns for sustainability, climate change, or a community’s social well-being, are noticeably absent.
Complicating matters, some pipeline operators have been successful in skirting comprehensive EIAs. This was seen in the case of the Mariner East 2 pipeline. Despite being the largest pipeline project in Pennsylvania’s history, a NEPA review was never conducted for ME2.
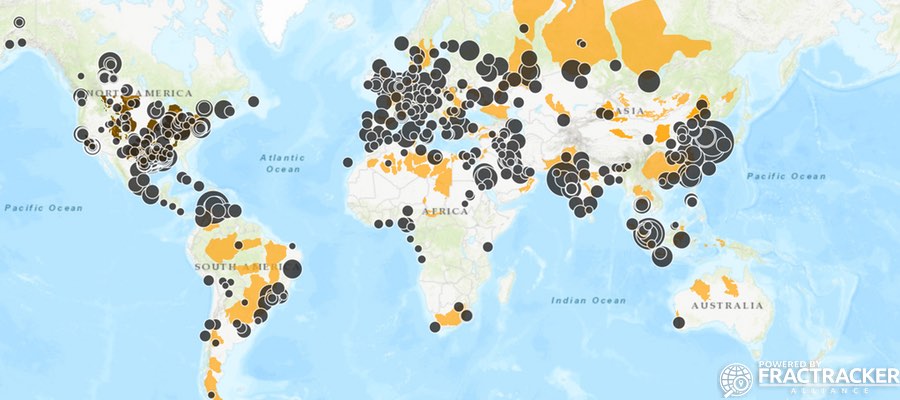
Potential Conflict Hotspots and Global Productivity Choke Points
Today, FracTracker is releasing a complete inventory of all 536 global oil refineries, along with estimates of daily capacity, CO2 emissions per year, and various products. These data have also been visualized in the map below.
Total productivity from these refineries amounts to 79,372,612 barrels per day (BPD) of oil worldwide, according to the data we were able to compile. However, based on the International Energy Agency, global production is currently around 96 million BPD, which means that our capacity estimates are more indicative of conditions between 2002 and 2003 according to BP’s World Oil Production estimates. We estimate this disparity is a result of countries’ reluctance to share individual refinery values or rates of change due to national security concerns or related strategic reasons.
Assuming the planet’s 7.6 billion people emit 4.9-5.0 metric tons per capita of CO2 per year, emissions from these 536 refineries amounts to the CO2 emissions of 52-57 million people. If you include the facilities’ methane and N2O emissions, this figure rises to 61-66 million people equivalents every year, essentially the populations of the United Kingdom or France.
Across the globe, countries and companies are beginning to make bold predictions about their ability to refine oil.
Nigeria, for example, recently claimed they would be increasing oil refining capacity by 13% from 2.4 to 2.7 million BPD. Currently, however, our data indicate Nigeria is only producing a fraction of this headline number (i.e., 445,000 BPD). The country’s estimates seem to be more indicative of conditions in Nigeria in the late 1960s when oil was first discovered in the Niger Delta. Learn more.
Is investing in – and doubling down on – oil refining capacity a smart idea for Nigeria’s people and economy, however? At this point, the country’s population is 3.5 times greater than it was in the 60’s and is growing at a remarkable rate of 2.7% per year. Yet, Nigeria’s status as one of the preeminent “Petro States” has done very little for the majority of its population – The oil industry and the Niger Delta have become synonymous with increased infant mortality and rampant oil spills.
Sadly, the probability that the situation will improve in a warming – and more politically volatile – world is not very likely.
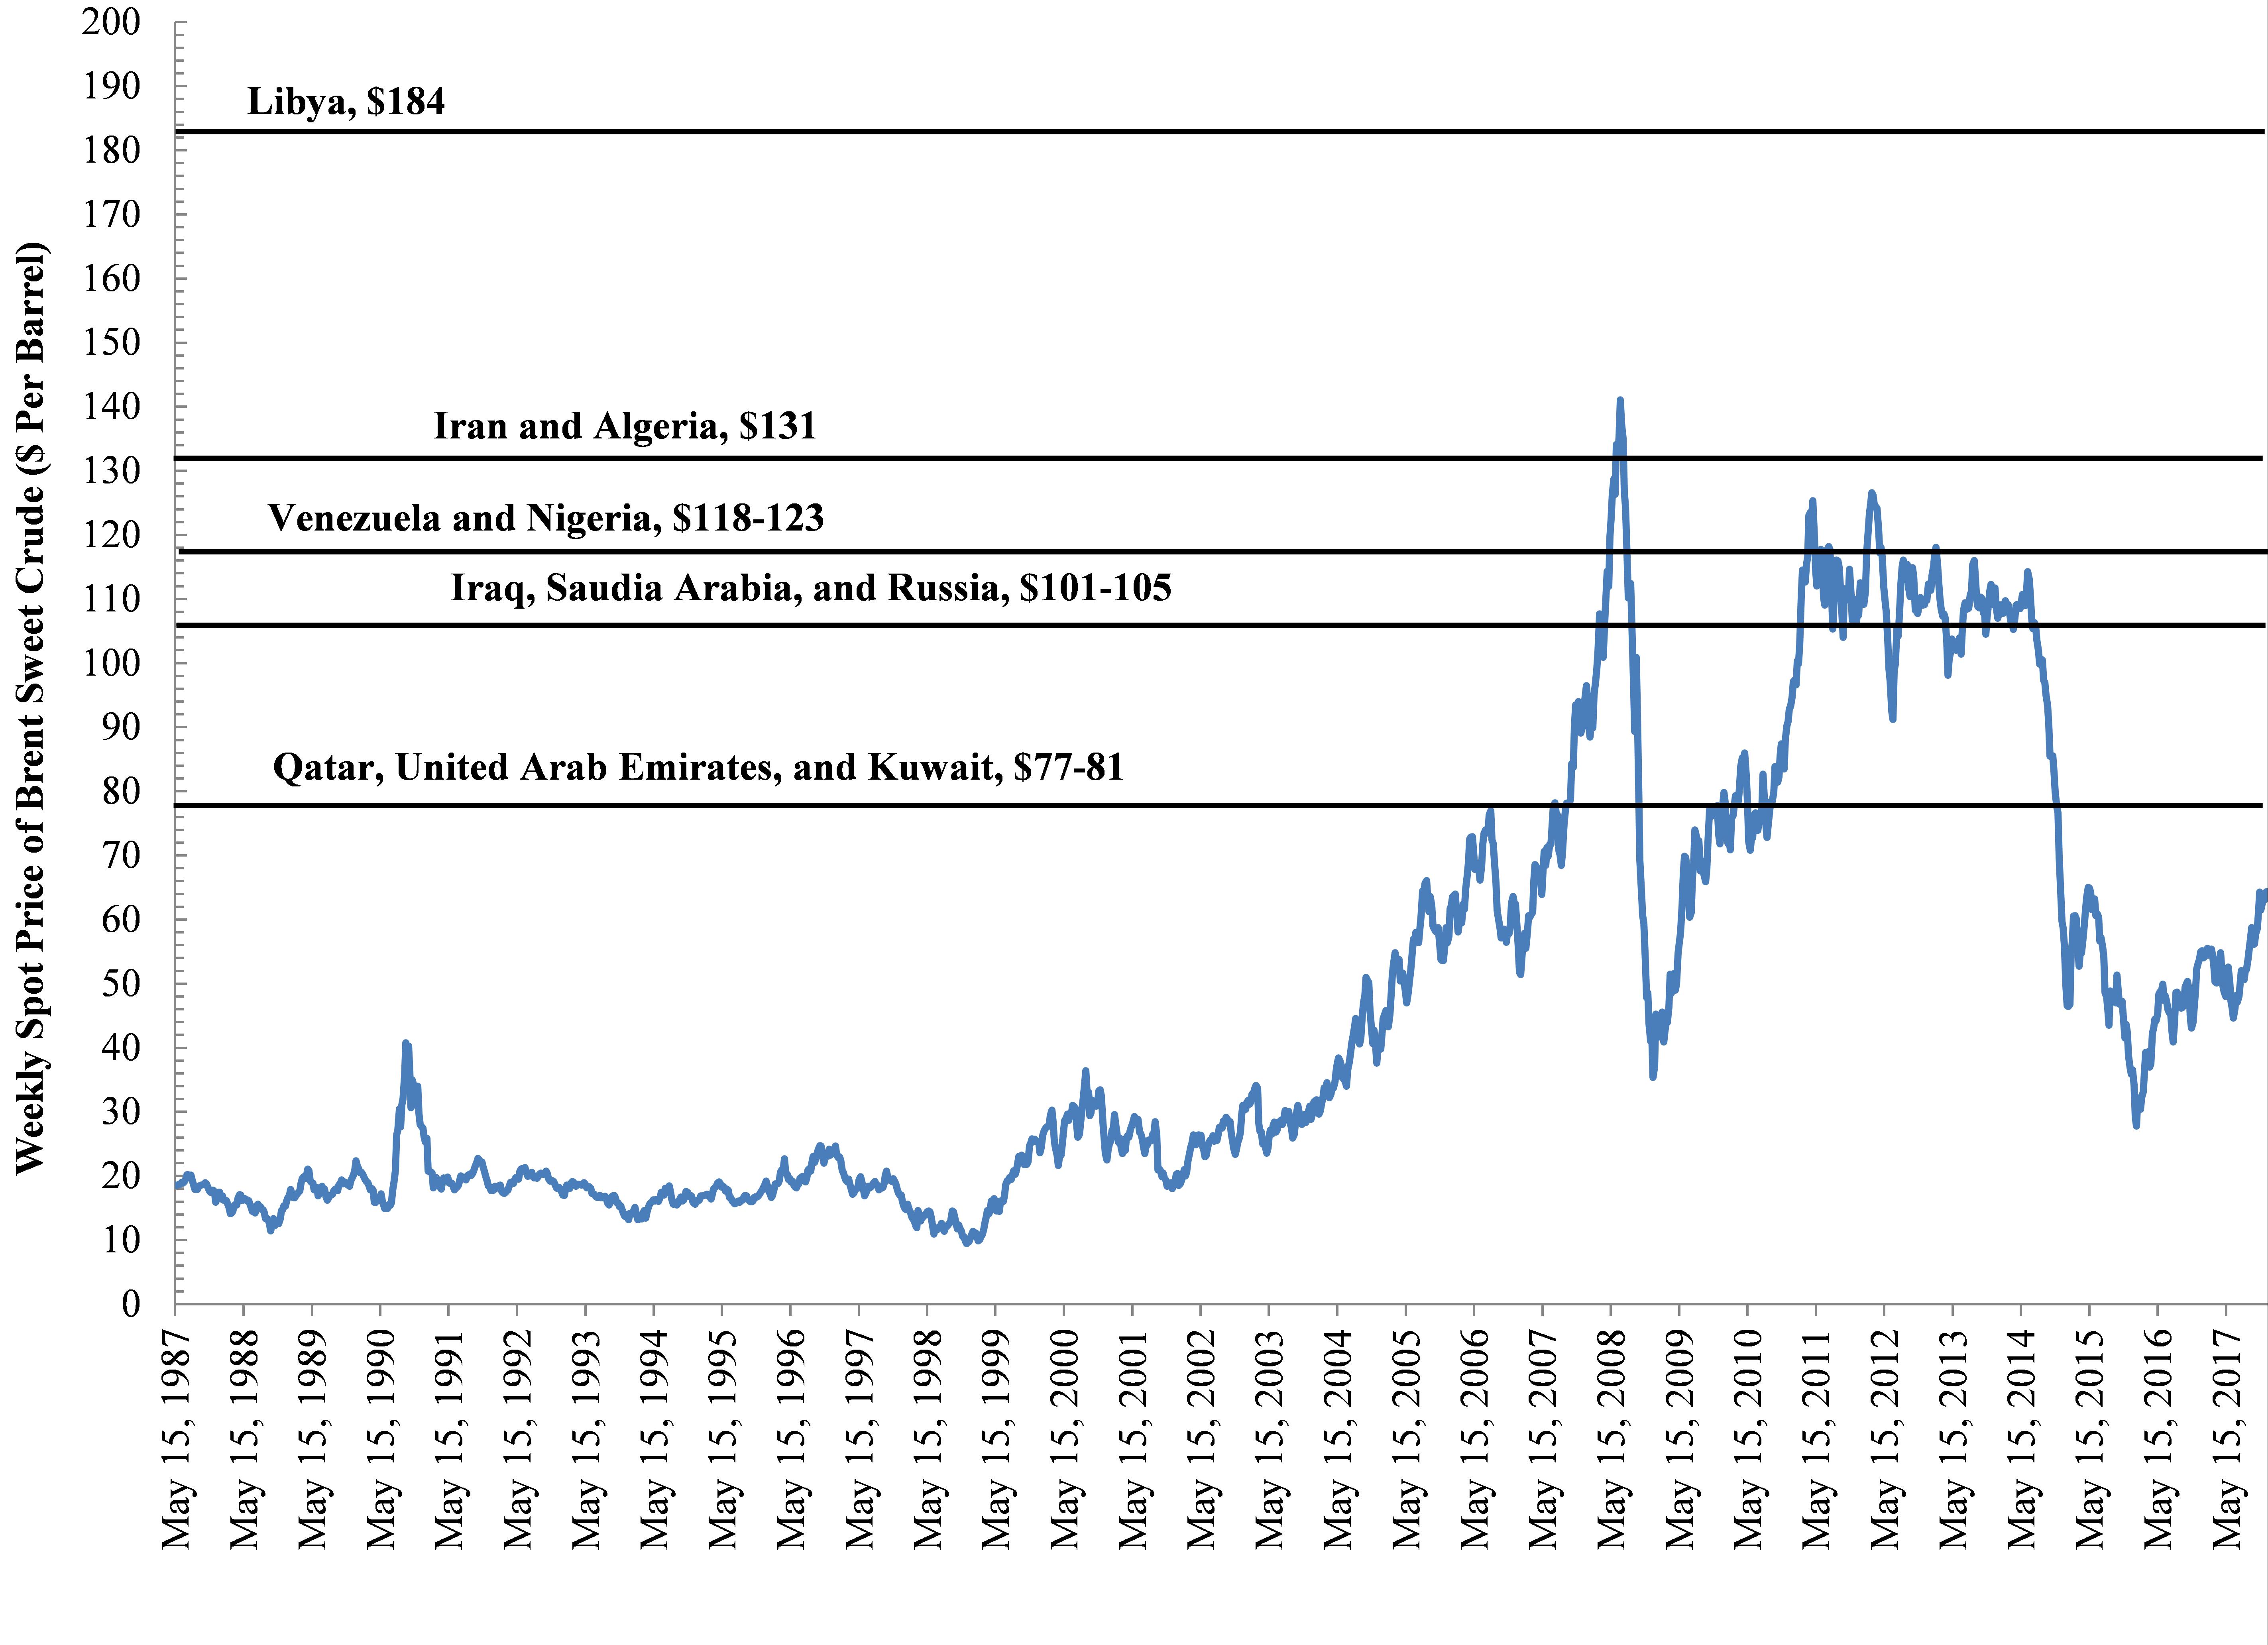
Such a dependency on oil price has been coupled to political instability in Nigeria, prompting some to question whether the discovery of oil was a cure or a curse given that the country depends on oil prices – and associated volatility – to balance its budget: Of all the Organization of Petroleum Exporting Countries (OPEC) countries, Nigeria is near the top of the list when it comes to the price of oil the country needs to balance its budget – Deutsche Bank and IMF estimate $123 per barrel as their breaking point. This is a valuation that oil has only exceeded or approached 4.4% of the time since 1987 (See Figure 2).
Former Central Bank of Nigeria Governor, Charles Soludo, once put this reliance in context:
… For too long, we have lived with borrowed robes, and I think for the next generation, for the 400 million Nigerians expected in this country by the year 2050, oil cannot be the way forward for the future.
Other regions are also at risk from the oil market’s power and volatility. In Libya, for example, the Ras Lanuf oil refinery (with a capacity of 220,000 BPD) and the country’s primary oil export terminal in Brega were the focal point of the Libyan civil war in 2011. Not coincidentally, Libya also happens to be the Petro State that needs the highest per-barrel price for oil to balance its budget (See Figure 2). Muammar Gaddafi and the opposition, National Transitional Council, jostled for control of this pivotal choke point in the Africa-to-Europe hydrocarbon supply chain.
The fact that refineries like these – and others in similarly volatile regions of the Middle East – produce an impressive 10% (7,166,900 BPD) of global demand speaks to the fragility of these Hydrocarbon Industrial Complex focal points, as well as the planet’s fragile dependence on fossil fuels going forward.
Figure 2. Weekly Spot Price of Brent Sweet Crude ($ Per Barrel) and estimates of the prices OPEC/Petro States need to balance their budgets.
Dividing Neighbors
These components of the fossil fuel industry, and their associated feedstocks and pipelines, will continue to divide neighbors and countries as political disenfranchisement and inequality grow, the climate continues to change, and resource limitations put increasing stress on food security and watershed resiliency worldwide.
Not surprisingly, every one of these factors places more strain on countries and weakens their ability to govern responsibly.
Thus, many observers speculate that these factors are converging to create a kind of perfect storm that forces OPEC governments and their corporate partners to lean even more heavily on their respective militaries and for-profit private military contractors (PMCs) to prevent social unrest while insuring supply chain stability and shareholder return.[2,3] The increased reliance on PMCs to provide domestic security for energy infrastructure is growing and evolving to the point where in some countries it may be hard to determine where a state’s sovereignty ends and a PMC’s dominance begins – Erik Prince’s activities in the Middle East and Africa on China’s behalf and his recent aspirations for Afghanistan are a case in point.
To paraphrase Mark Twain, whiskey is for drinking and hydrocarbons are for fighting over.
The international and regional unaccountability of PMCs has added a layer of complexity to this conversation about energy security and independence. Countries such as Saudi Arabia and Venezuela provide examples of how fragile political stability is, and more importantly how dependent this stability is on oil refinery production and what OPEC is calling ‘New Optimism.’ To be sure, PMCs are playing an increasing role in political (in)stability and energy production and transport. Since knowledge and transparency are essential for peaceful resolutions, we will continue to map and chronicle the intersections of geopolitics, energy production and transport, social justice, and climate change.
By Ted Auch, Great Lakes Program Coordinator, FracTracker Alliance; and Bryan Stinchfield, Associate Professor of Organization Studies, Department Chair of Business, Organizations & Society, Franklin & Marshall College
Assuming a tons of CO2 to barrels of oil per day ratio of 8.99 to 9.78 tons of CO2 per barrel of oil based on an analysis we’ve conducted of 146 refineries in the United States.
B. Stinchfield. 2017. “The Creeping Privatization of America’s Armed Forces”. Newsweek, May 28th, 2017, New York, NY.
R. Gray. “Erik Prince’s Plan to Privatize the War in Afghanistan”. The Atlantic, August 18th, 2017, New York, NY.
https://www.fractracker.org/a5ej20sjfwe/wp-content/uploads/2017/12/OilRefineries-Global-Feature.jpg400900Ted Auch, PhDhttps://www.fractracker.org/a5ej20sjfwe/wp-content/uploads/2025/09/2025-Wordmark-Logo.pngTed Auch, PhD2017-12-29 14:18:292021-04-15 15:02:03Tracking Global Oil Refineries and their Emissions
Oil and gas operators are polluting groundwater in Colorado, and the state and U.S. EPA are granting them permission with exemptions from the Safe Drinking Water Act.
FracTracker Alliance’s newest analysis attempts to identify groundwater risks in Colorado groundwater from the injection of oil and gas waste. Specifically, we look at groundwater monitoring data near Class II underground injection control (UIC) disposal wells and in areas that have been granted aquifer exemptions from the underground source of drinking water rules of the Safe Drinking Water Act (SDWA). Momentum to remove amend the SDWA and remove these exemption.
Aquifer exemptions are granted to allow corporations to inject hazardous wastewater into groundwater aquifers. The majority, two-thirds, of these injection wells are Class II, specifically for oil and gas wastes.
The results of this assessment provide insight into high-risk issues with aquifer exemptions and Class II UIC well permitting standards in Colorado. We identify areas where aquifer exemptions have been granted in high quality groundwater formations, and where deep underground aquifers are at risk or have become contaminated from Class II disposal wells that may have failed.
Of note: On March 23, 2016, NRDC submitted a formal petition urging the EPA to repeal or amend the aquifer exemption rules to protect drinking water sources and uphold the Safe Drinking Water Act. Learn more
Research shows injection wells do fail
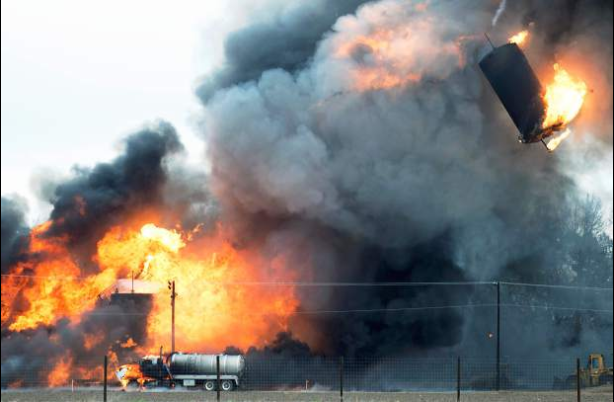
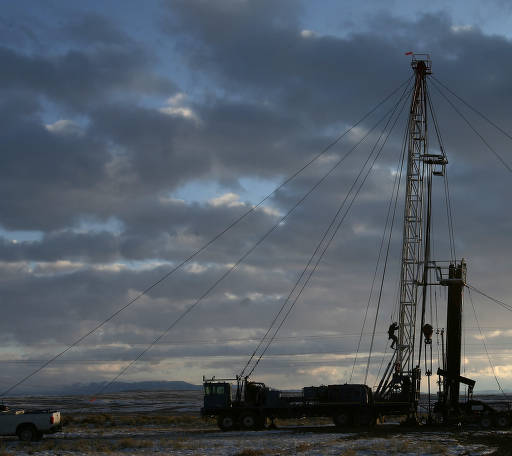
Class II injection well in Colorado explodes and catches fire. Photo by Kelsey Brunner for the Greeley Tribune.
Disposal of oil and gas wastewater by underground injection has not yet been specifically researched as a source of systemic groundwater contamination nationally or on a state level. Regardless, this issue is particularly pertinent to Colorado, since there are about 3,300 aquifer exemptions in the US (view map), and the majority of these are located in Montana, Wyoming, and Colorado. There is both a physical risk of danger as well as the risk of groundwater contamination. The picture to the right shows an explosion of a Class II injection well in Greeley, CO, for example.
Applicable and existing research on injection wells shows that a risk of groundwater contamination of – not wastewater – but migrated methane due to a leak from an injection well was estimated to be between 0.12 percent of all the water wells in the Colorado region, and was measured at 4.5 percent of the water wells that were tested in the study.
A recent article by ProPublica quoted Mario Salazar, an engineer who worked for 25 years as a technical expert with the EPA’s underground injection program in Washington:
In 10 to 100 years we are going to find out that most of our groundwater is polluted … A lot of people are going to get sick, and a lot of people may die.
Also in the ProPublic article was a study by Abrahm Lustgarten, wherein he reviewed well records and data from more than 220,000 oil and gas well inspections, and found:
Structural failures inside injection wells are routine.
Between 2007-2010, one in six injection wells received a well integrity violation.
More than 7,000 production and injection wells showed signs of well casing failures and leakage.
…groundwater contamination problems related to the subsurface disposal of liquid wastes by deep-well injection have been reviewed in the literature since 1950 (Morganwalp, 1993) and groundwater contamination accordingly is a serious problem.
According to his textbook, a 1974 U.S. EPA report specifically warns of the risk of corrosion by oil and gas waste brines on handling equipment and within the wells. The potential effects of injection wells on groundwater can even be reviewed in the U.S. EPA publications (1976, 1996, 1997).
As early as 1969, researchers Evans and Bradford, who reported on the dangers that could occur from earthquakes on injection wells near Denver in 1966, had warned that deep well injection techniques offered temporary and not long-term safety from the permanent toxic wastes injected.
Will existing Class II wells fail?
For those that might consider data and literature on wells from the 1960’s as being unrepresentative of activities occurring today, of the 587 wells reported by the Colorado’s oil and gas regulatory body, COGCC, as “injecting,” 161 of those wells were drilled prior to 1980. And 104 were drilled prior to 1960!
Wells drilled prior to 1980 are most likely to use engineering standards that result in “single-point-of-failure” well casings. As outlined in the recent report from researchers at Harvard on underground natural gas storage wells, these single-point-of-failure wells are at a higher risk of leaking.
It is also important to note that the U.S. EPA reports only 569 injection wells for Colorado, 373 of which may be disposal wells. This is a discrepancy from the number of injection wells reported by the COGCC.
Aquifer Exemptions in Colorado
According to COGCC, prior to granting a permit for a Class II injection well, an aquifer exemption is required if the aquifer’s groundwater test shows total dissolved solids (TDS) is between 3,000 and 10,000 milligrams per liter (mg/l). For those aquifer exemptions that are simply deeper than the majority of current groundwater wells, the right conditions, such as drought, or the needs of the future may require drilling deeper or treating high TDS waters for drinking and irrigation. How the state of Colorado or the U.S. EPA accounts for economic viability is therefore ill-conceived.
Data Note: The data for the following analysis came by way of FOIA request by Clean Water Action focused on the aquifer exemption permitting process. The FOIA returned additional data not reported by the US EPA in the public dataset. That dataset contained target formation sampling data that included TDS values. The FOIA documents were attached to the EPA dataset using GIS techniques. These GIS files can be found for download in the link at the bottom of this page.
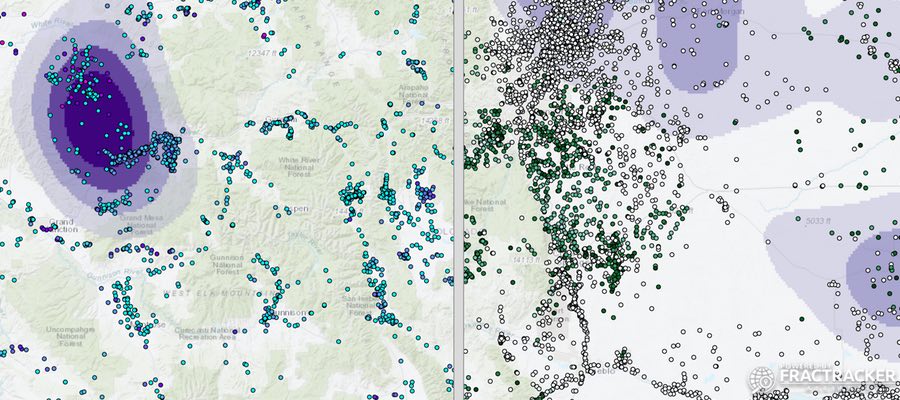
Map 1 above shows the locations of aquifer exemptions in Colorado, as well as the locations of Class II injection wells. These sites are overlaid on a spatial assessment of groundwater quality (a map of the groundwater’s quality), which was generated for the entire state. The changing colors on the map’s background show spatial trends of TDS values, a general indicator of overall groundwater quality.
In Map 1 above, we see that the majority of Class II injection wells and aquifer exemptions are located in regions with higher quality water. This is a common trend across the state, and needs to be addressed.
Our review of aquifer exemption data in Colorado shows that aquifer exemption applications were granted for areas reporting TDS values less than 3,000 mg/l, which contradicts the information reported by the COGCC as permitting guidelines. Additionally, of the 175 granted aquifer exemptions for which the FOIA returned data, 141 were formations with groundwater samples reported at less than 10,000 mg/l TDS. This is half of the total number (283) of aquifer exemptions in the state of Colorado.
When we mapped where class II injection wells are permitted, a total of 587 class II wells were identified in Colorado, outside of an aquifer exemption area. Of the UIC-approved injection wells identified specifically as disposal wells, at least 21 were permitted outside aquifer exemptions and were drilled into formations that were not hydrocarbon producing. Why these injection wells are allowed to operate outside of an aquifer exemption is unknown – a question for regulators.
You can see in the map that most of the aquifer exemptions and injection wells in Colorado are located in areas with lower TDS values. We then used GIS to conduct a spatial analysis that selected groundwater wells within five miles of the 21 that were permitted outside aquifer exemptions. Results show that groundwater wells near these sites had consistently low-TDS values, meaning good water quality. In Colorado, where groundwater is an important commodity for a booming agricultural industry and growing cities that need to prioritize municipal sources, permitting a Class II disposal well in areas with high quality groundwater is irresponsible.
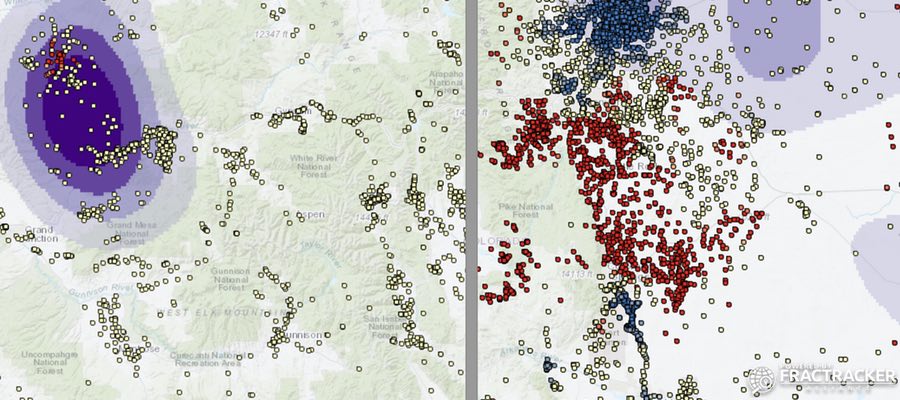
In Map 2, above, the locations of groundwater wells in Colorado are shown. The colors of the dots represent the concentration of TDS on the right and well depth on the left side of the screen. By sliding the bar on the map, users can visualize both. This feature allows people to explore where deep wells also are characterized by high levels of TDS. Users can also see that areas with high quality low TDS groundwater are the same areas that are the most developed with oil and gas production wells and Class II injection wells, shown in gradients of purple.
Statistical analysis of this spatial data gives a clearer picture of which regions are of particular concern; see below in Map 3.
In Map 3, above, the data visualized in Map 2 were input into a hot-spots analysis, highlighting where high and low values of TDS and depth differ significantly from the rest of the data. The region of the Front Range near Denver has significantly deeper wells, as a result of population density and the need to drill municipal groundwater wells.
The Front Range is, therefore, a high-risk region for the development of oil and gas, particularly from Class II injection wells that are necessary to support development.
Methods Notes: The COGCC publishes groundwater monitoring data for the state of Colorado, and groundwater data is also compiled nationally by the Advisory Committee on Water Information (ACWI). (Data from the National Groundwater Monitoring Network is sponsored by the ACWI Subcommittee on Ground Water.) These datasets were cleaned, combined, revised, and queried to develop FracTracker’s dataset of Colorado groundwater wells. We cleaned the data by removing sites without coordinates. Duplicates in the data set were removed by selecting for the deepest well sample. Our dataset of water wells consisted of 5,620 wells. Depth data was reported for 3,925 wells. We combined this dataset with groundwater data exported from ACWI. Final count for total wells with TDS data was 11,754 wells. Depth data was reported for 7,984 wells. The GIS files can be downloaded in the compressed folder at the bottom of this page.
Site Assessments – Exploring Specific Regions
Particular regions were further investigated for impacts to groundwater, and to identify areas that may be at a high risk of contamination. There are numerous ways that groundwater wells can be contaminated from other underground activity, such as hydrocarbon exploration and production or waste injection and disposal. Contamination could be from hydraulic fracturing fluids, methane, other hydrocarbons, or from formation brines.
From the literature, brines and methane are the most common contaminants. This analysis focuses on potential contamination events from brines, which can be detected by measuring TDS, a general measure for the mixture of minerals, salts, metals and other ions dissolved in waters. Brines from hydrocarbon-producing formations may include heavy metals, radionuclides, and small amounts of organic matter.
Wells with high or increasing levels of TDS are a red flag for potential contamination events.
Methods
Groundwater wells at deep depths with high TDS readings are, therefore, the focus of this assessment. Using GIS methods we screened our dataset of groundwater wells to only identify those located within a buffer zone of five miles from Class II injection wells. This distance was chosen based on a conservative model for groundwater contamination events, as well as the number of returned sample groundwater wells and the time and resources necessary for analysis. We then filtered the groundwater wells dataset for high TDS values and deep well depths to assess for potential impacts that already exist. We, of course, explored the data as we explored the spatial relationships. We prioritized areas that suggested trends in high TDS readings, and then identified individual wells in these areas. The data initially visualized were the most recent sampling events. For the wells prioritized, prior sampling events were pulled from the data. The results were graphed to see how the groundwater quality has changed over time.
Case of Increasing TDS Readings
If you zoom to the southwest section of Colorado in Map 2, you can see that groundwater wells located near the injection well 1 Fasset SWD (EPA) (05-067-08397) by Operator Elm Ridge Exploration Company LLC were disproportionately high (common). Groundwater wells located near this injection well were selected for, and longitudinal TDS readings were plotted to look for trends in time. (Figure 1.)
The graphs in Figure 1, below, show a consistent increase of TDS values in wells near the injection activity. While the trends are apparent, the data is limited by low numbers of repeated samples at each well, and the majority of these groundwater wells have not been sampled in the last 10 years. With the increased use of well stimulation and enhanced oil recovery techniques over the course of the last 10 years, the volumes of injected wastewater has also increased. The impacts may, therefore, be greater than documented here.
This area deserves additional sampling and monitoring to assess whether contamination has occurred.
Figures 1a and 1b. The graphs above show increasing TDS values in samples from groundwater wells in close proximity to the 1 Fassett SWD wellsite, between the years 2004-2015. Each well is labeled with a different color. The data for the USGS well in the graph on the right was not included with the other groundwater wells due to the difference in magnitude of TDS values (it would have been off the chart).
Groundwater Contamination Case in 2007
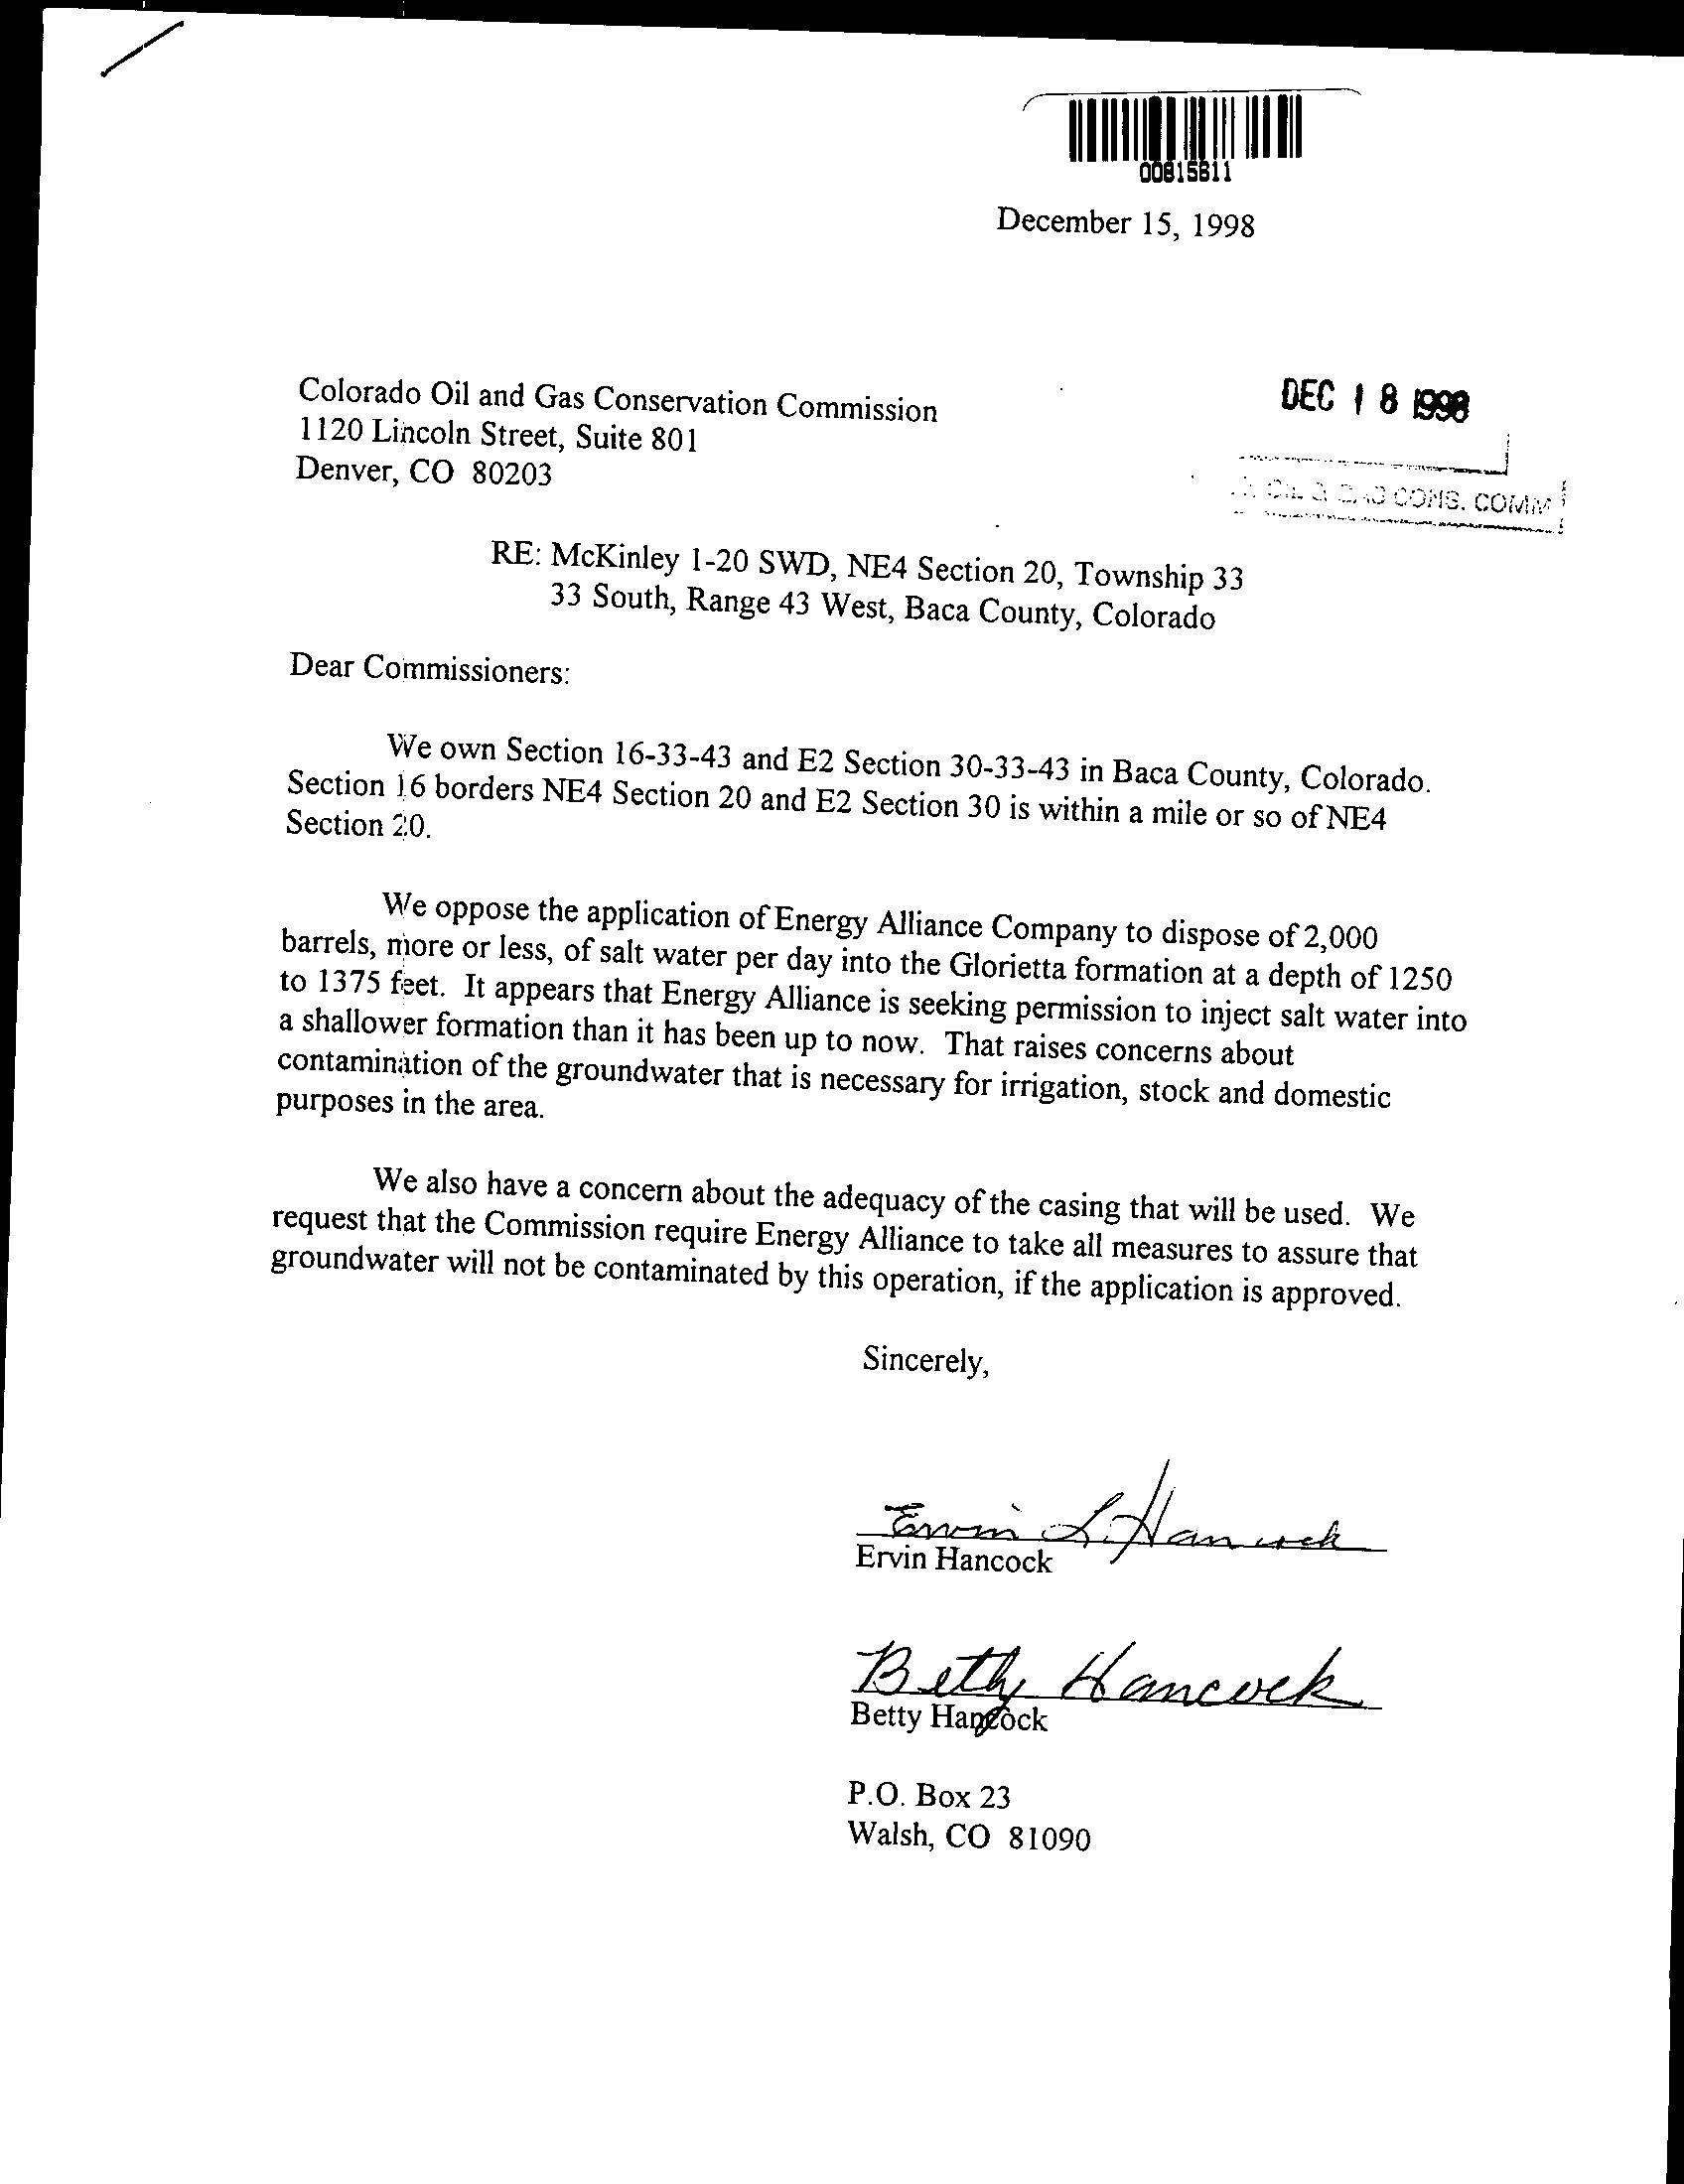
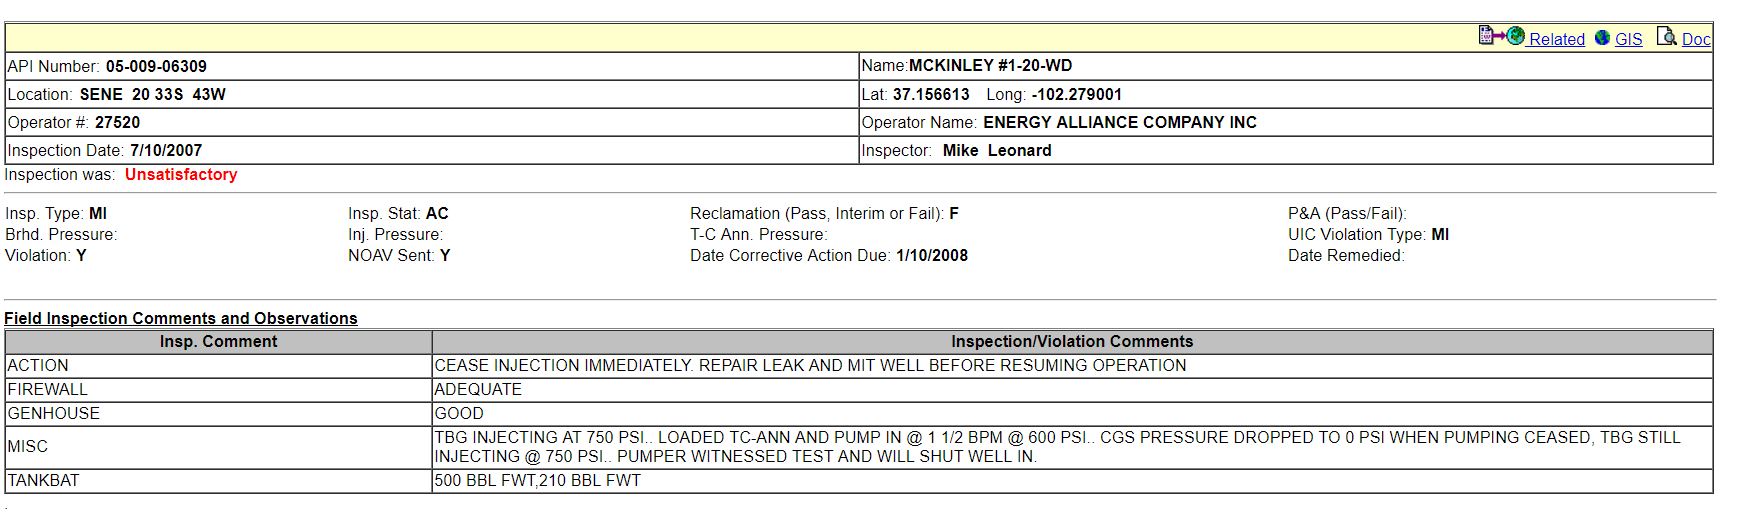
We also uncovered a situation where a disposal well caused groundwater contamination. Well records for Class II injection wells in the southeast corner of Colorado were reviewed in response to significantly high readings of TDS values in groundwater wells surrounding the Mckinley #1-20-WD disposal well.
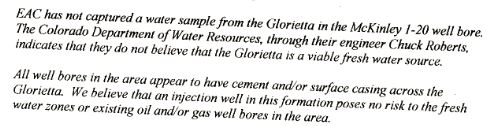
When the disposal well was first permitted, farmers and ranchers neighboring the well site petitioned to block the permit. Language in the grant application is shown below in Figure 2. The petitioners identified the target formation as their source of water for drinking, watering livestock, and irrigation. Regardless of this petition, the injection well was approved. Figure 3 shows the language used by the operator Energy Alliance Company (EAC) for the permit approval, which directly contradicts the information provided by the community surrounding the wellsite. Nevertheless, the Class II disposal well was approved, and failed and leaked in 2007, leading to the high TDS readings in the groundwater in this region.
Figure 2. Petition by local landowners opposing the use of their drinking water source formation for the site of a Class II injection disposal well.
Figure 3. The oil and gas operation EAC claims the Glorietta formation is not a viable fresh water source, directly contradicting the neighboring farmers and ranchers who rely on it.
Figure 4. The COGCC well log report shows a casing failure, and as a result a leak that contaminated groundwater in the region.
Areas where lack of data restricted analyses
In other areas of Colorado, the lack of recent sampling data and longitudinal sampling schemes made it even more difficult to track potential contamination events. For these regions, FracTracker recommends more thorough sampling by the regulatory agencies COGCC and USGS. This includes much of the state, as described below.
Southeastern Colorado
Our review of the groundwater data in southeastern Colorado showed a risk of contamination considering the overlap of injection well depths with the depths of drinking water wells. Oil and gas extraction and Class II injections are permitted where the aquifers include the Raton formation, Vermejo Formation, Poison Canyon Formation and Trinidad Sandstone. Groundwater samples were taken at depths up to 2,200 ft with a TDS value of 385 mg/l. At shallower depths, TDS values in these formations reached as high as 6,000 mg/l, and 15 disposal wells are permitted in aquifer exemptions in this region. Injections in this area start at around 4,200 ft.
In Southwestern Colorado, groundwater wells in the San Jose Formation are drilled to documented depths of up to 6,000 feet with TDS values near 2,000 mg/l. Injection wells in this region begin at 565 feet, and those used specifically for disposal begin at below 5,000 feet in areas with aquifer exemptions. There are also four disposal wells outside of aquifer exemptions injecting at 5,844 feet, two of which are not injecting into active production zones at depths of 7,600 and 9,100 feet.
Western Colorado
In western Colorado well Number 1-32D VANETA (05-057-06467) by Operator Sandridge Exploration and Production LLC’s North Park Horizontal Niobara Field in the Dakota-Lokota Formation has an aquifer exemption. The sampling data from two groundwater wells to the southeast, near Coalmont, CO, were reviewed, but we can’t get a good picture due to the lack of repeat sampling.
In Northwestern Colorado near Walden, CO and the McCallum oil field, two groundwater wells with TDS above 10,000 ppm were selected for review. There are 21 injection wells in the McCallum field to the northwest. Beyond the McCallum field is the Battleship field with two wastewater disposal wells with an aquifer exemption. West of Grover, Colorado, there are several wells with high TDS values reported for shallow wells. Similar trends can be seen near Vernon. The data on these wells and wells from along the northern section of the Front Range, which includes the communities of Fort Collins, Greeley, and Longmont, suffered from the same issue. Lack of deep groundwater well data coupled with the lack of repeat samples, as well as recent sampling inhibited the ability to thoroughly investigate the threat of contamination.
Trends and Future Development
Current trends in exploration and development of unconventional resources show the industry branching southwest of Weld County towards Fort Collins, Longmont, Broomfield and Boulder, CO.
These regions are more densely populated than the Front Range county of Weld, and as can be seen in the maps, the drinking water wells that access groundwaters in these regions are some of the deepest in the state.
This analysis shows where Class II injection has already contaminated groundwater resources in Colorado. The region where the contamination has occurred is not unique; the drinking water wells are not particularly deep, and the density of Class II wells is far from the highest in the state.
Well casing failures and other injection issues are not exactly predictable due to the variety of conditions that can lead to a well casing failure or blow-out scenario, but they are systemic. The result is a hazardous scenario where it is currently difficult to mitigate risk after the injection wells are drilled.
Allowing Class II wells to expand into Front Range communities that rely on deep wells for municipal supplies is irresponsible and dangerous.
The encroachment of extraction into these regions, coupled with the support of Class II injection wells to handle the wastewater, would put these groundwater wells at particular risk of contamination. Based on this analysis, we recommend that regulators take extra care to avoid permitting Class II wells in these regions as the oil and gas industry expands into new areas of the Front Range, particularly in areas with dense populations.
Feature Image: Joshua Doubek / WIKIMEDIA COMMONS
Article by: Kyle Ferrar, Western Program Coordinator, FracTracker Alliance
October 31, 2017 Edit: This post originally cited the Clean Water Act instead of the Safe Drinking Water Act as the source that EPA uses to grant aquifer exemptions.
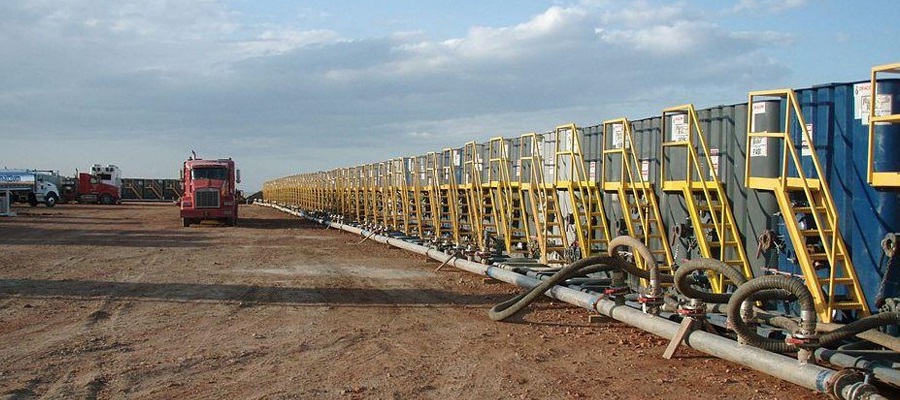
https://www.fractracker.org/a5ej20sjfwe/wp-content/uploads/2017/10/kansas_wellpad.jpg400900Kyle Ferrar, MPHhttps://www.fractracker.org/a5ej20sjfwe/wp-content/uploads/2025/09/2025-Wordmark-Logo.pngKyle Ferrar, MPH2017-10-26 14:55:032021-04-15 15:02:07Groundwater risks in Colorado due to Safe Drinking Water Act exemptions
We’d like to give our readers a bit of background on aquifer exemptions, because we’re going to be covering this topic in a few upcoming blog posts. Stay tuned!
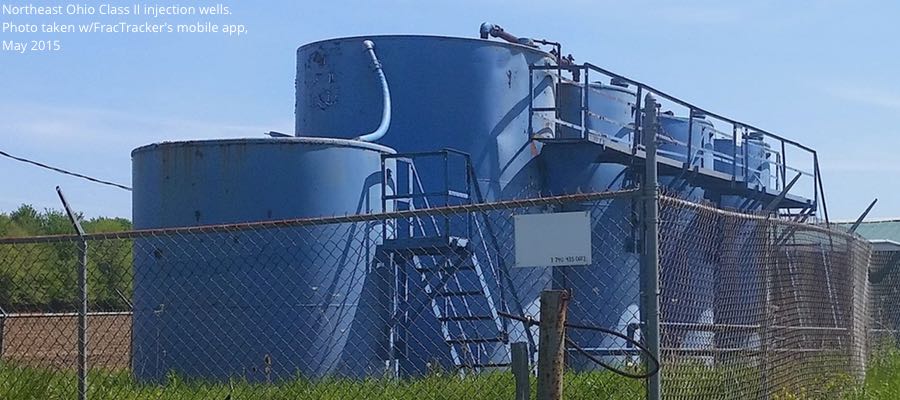
Liquid Waste Disposal
Drilling for oil and gas produces both liquid and solid waste that must be disposed of. The liquid waste from this industry is considered a “Class II waste” according to the US EPA. Aquifers are places underground capable of holding or transmitting groundwater. To dispose of Class II waste, operators are granted aquifer exemptions, by the EPA based on the state’s recommendations. The term “exemption,” specifically, refers to the Safe Drinking Water Act, which protects underground sources of drinking water (USDWs).
Therefore, these exemptions grant oil and gas operators the right to contaminate groundwaters, albeit many of the groundwater formations used for disposal in Class II wells are very deep.
There are several qualifiers for a USDW to be granted exempt from the Safe Drinking Water Act. Aquifer exemptions are granted for underground formations that are not currently used as a source of drinking water and meet one of the following criteria:
The formation contains commercially producible minerals or hydrocarbons;
The formation is so deep that recovery of water for drinking water purposes is economically or technologically impractical; or,
The formation is so contaminated that it would be economically or technologically impractical to render the water fit for human consumption.
In some states, aquifer exemptions are not approved for formations with Total Dissolved Solids (TDS*) equal to or less than 3,000 mg/l TDS.
If an underground formation qualifies for an exemption, it does not mean that groundwater cannot be used for drinking water, just that it is not currently a source of drinking water. The most precarious criteria requirement, therefore, is the determination that a USDW is simply not “economically viable” or it is “technologically impractical,” meaning that the cost of drilling a groundwater well to the depth of the aquifer (under the condition of the current need for water) may make the investment impractical. In the near future, this water may be needed and highly valued, however.
TDS = Total dissolved solids are inorganic salts (e.g. calcium, magnesium, potassium, sodium, bicarbonates, chlorides, and sulfates), as well as some organic matter, dissolved in water.
The Lay of the Land
Below, we have put together a map of aquifer exemptions in the U.S. Click on the dots and shaded areas to learn more about a particular aquifer.
By Kyle Ferrar, Western Program Coordinator, FracTracker Alliance
https://www.fractracker.org/a5ej20sjfwe/wp-content/uploads/2015/07/Injection-Feature.jpg400900Kyle Ferrar, MPHhttps://www.fractracker.org/a5ej20sjfwe/wp-content/uploads/2025/09/2025-Wordmark-Logo.pngKyle Ferrar, MPH2017-10-26 09:31:202021-04-15 15:02:09What are aquifer exemptions? Permitted exemptions from the Safe Drinking Water Act


