Nationally treasured federal lands face threats by oil, gas, and other extractive uses
The United States is blessed with some of the most diverse natural landscapes in the world. Through foresight of great leaders over the decades, starting in 1906 — Theodore Roosevelt, Franklin Roosevelt, Benjamin Harrison, and Jimmy Carter – to name just a few — well over a half billion acres of wilderness have been set aside as national parks, refuges, monuments, and roadless areas. Some of the most famous of these protected areas include the Grand Canyon, Acadia, and Grand Tetons National Parks. In all, the federal government owns 28% of the 2.27 billion acres of land that the United States comprises. These federal lands are administered by the Bureau of Land Management (BLM): 248.3 million acres, the US Forest Service: 192.9 million acres, US Fish and Wildlife Service: 89.1 million acres, and National Park Service: 78.9 million acres. In addition, the US Department of Defense administers 11.4 million acres.
Why are federal lands at risk?
While most people assume that federal wild lands are forever protected from development and commercial exploitation, quite the opposite is true. For most of the past century, federal lands have hunted, fished, logged and grazed by private individuals and enterprises. In addition, and in the cross-hairs of discussion here, is the practice of leasing lands to industrial interests for the purpose of extracting minerals, oil, and gas from these public lands.
Provisions for land conservation and restrictions on oil and gas extraction, in particular, became more stringent since the inception of the Environmental Protection Agency (EPA) in 1970. However, environmentalists have watched in horror as the current administration in Washington has gutted the EPA, and installed climate change-deniers and corporate executives in high levels of office throughout a range of federal agencies. Notable is the appointment of Ryan Zinke as US Secretary of the Interior. Zinke, a former businessman, has a long record of opposing environmental viewpoints around extraction of oil, coal, and gas and cutting regulations. The League of Conservation Voters gives his voting record a lifetime score of 4 percent on environmental issues. As recently as this week, Joel Clement–one of Zinke’s senior advisors–resigned his post, citing, Zinke’s poor leadership, wasting of tax-payer dollars, and denial of climate change science.
Early in his tenure as Secretary of the Interior, Zinke initiated a review of 27 national monuments, a move that environmentalists feared could lead to the unraveling of protections on millions of acres of federal land, and also relaxed regulations on oil and gas exploration in those areas. Public comment on the plans to review these national monuments was intense; when the public comment period closed on July 10, 2017, the Interior Department had received over 2.4 million comments, the vast majority of which supported keeping the existing boundaries and restrictions as they are.
Federal lands under threat by Trump Administration
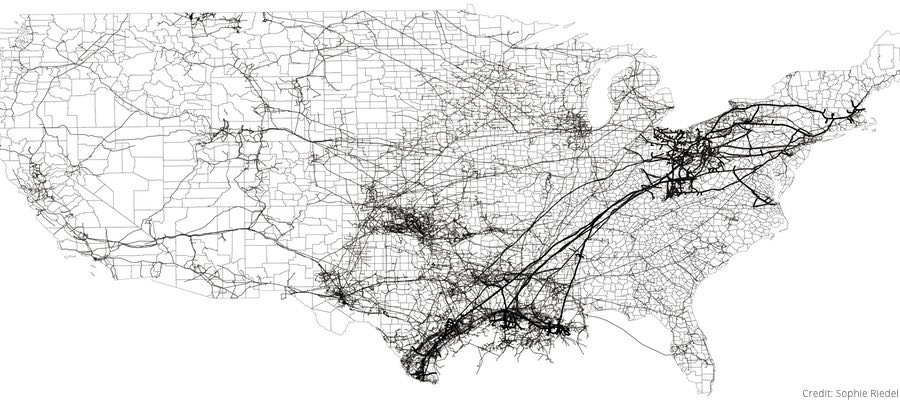
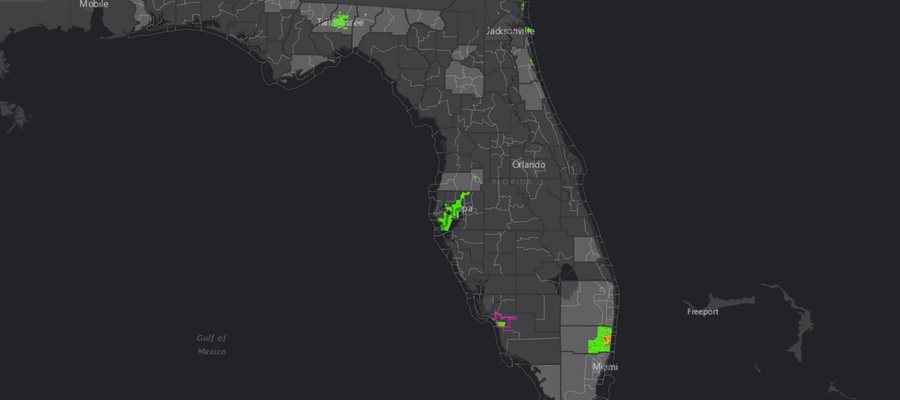
View map fullscreen | How FracTracker maps work
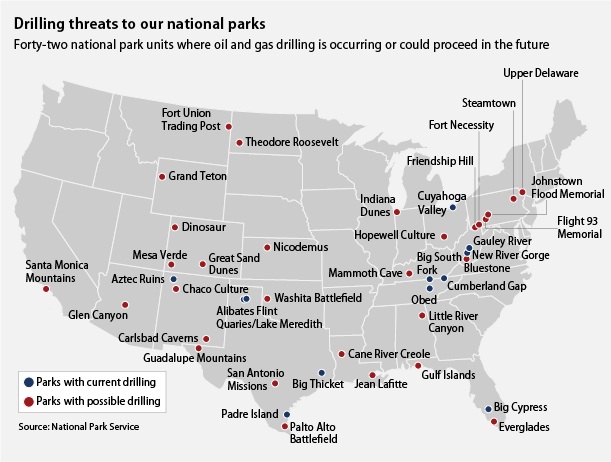
The above map shows which sites are under consideration for oil, gas, or coal extraction, or face boundary reduction of up to 88%. Click here to view this map full-screen with a legend, zoom in and click on areas of interest, etc.
Who should be allowed to use these resources?
Ranchers, loggers, and recreational hunters and anglers felt that the 1906 Antiquities Act had been over-interpreted, and therefore advocated for Zinke’s proposal. (The Act was the first U.S. law to provide protection for any general kind of cultural or natural resource.)
However, environmental advocates such as the National Parks Conservation Association (NPCA), the Natural Resources Defense Council (NRDC), and others were adamantly opposed to opening up federal lands resources for extraction, citing the need for environmental protection, public access, and, importantly, concerns that the lands would be more easily transferred to state, local, or private interests. Environmentalists also argue that the revenue generated by tourism at these pristine sites would far exceed that generated by extractive resource activities. Attorneys and staff from NPCA and NRDC argued legislation in effect since the 1970s requires role for Congress in changing the boundaries of existing monuments. The President or his cabinet do not have that sole authority.
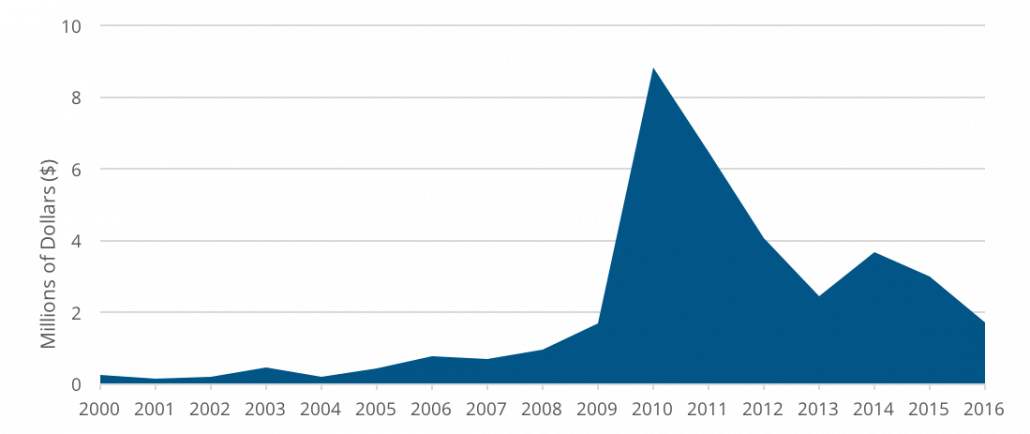
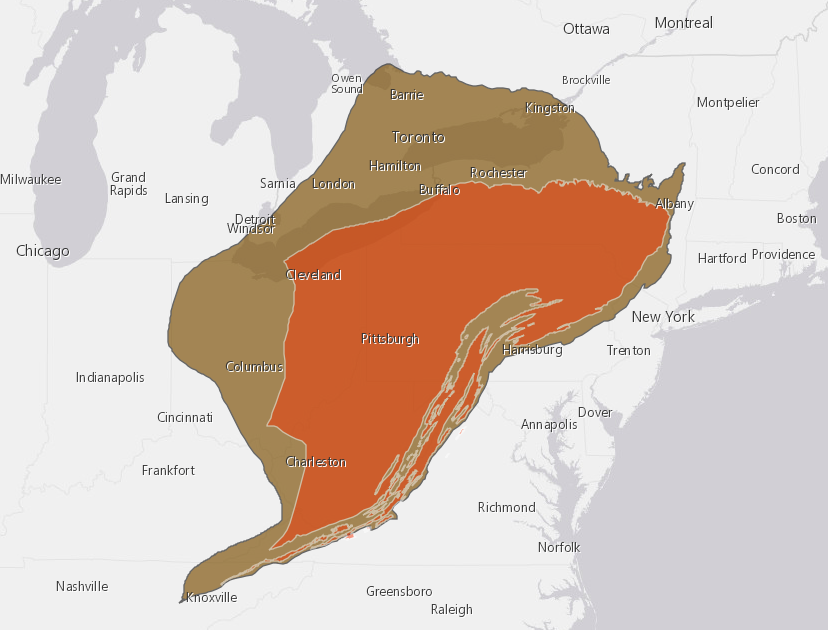
The Wilderness Society estimates that already, 90% of the land in the US West, owned by the Bureau of Land Management, is open for oil and gas leasing, while only 10% is set aside for other uses (Figure 2). According to information from Sourcewatch, in 2013, these lands included 12 National Monuments, Parks, Recreation Areas, and Preserves that had active drilling, and another 31 that might see possible drilling in the future.
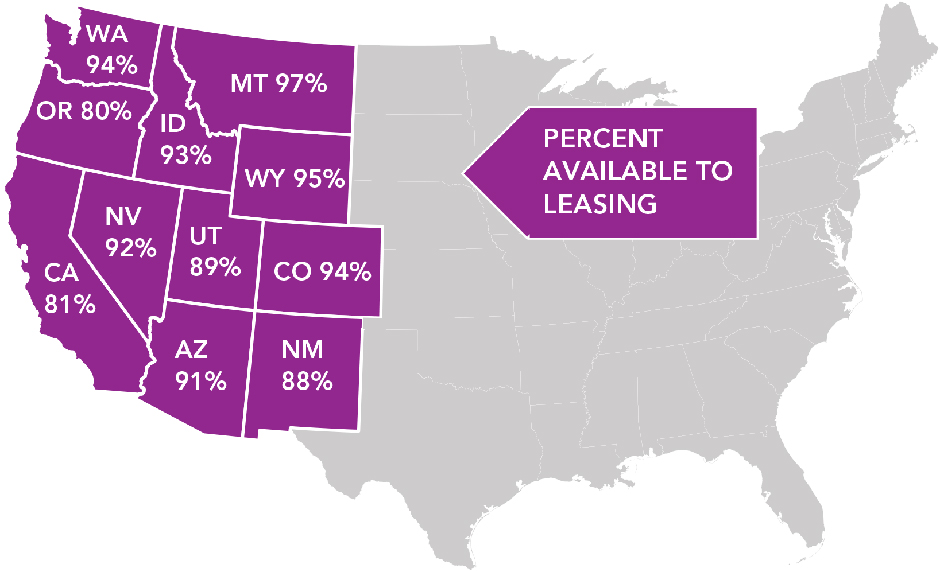
Figure 2. Percent of land already available for oil and gas leasing in the West. Source: The Wilderness Society
What Zinke has Proposed
True to expectation, in August of 2017, Zinke issued a recommendation to shrink the boundaries of several national monuments to allow coal mining and other “traditional uses” — which appear to include large-scale timbering, as well as potentially oil and gas drilling. Sites include Bears Ears and Grand Staircase-Escalante in Utah (encompassing more than 3.2 million acres in lands considered sacred to Dine/Navajo people), Cascade-Siskiyou in Oregon, and Gold Butte in Nevada. According to Zinke’s report, Grand Staircase-Escalante contains “an estimated several billion tons of coal and large oil deposits”. Zinke lifted Obama-era restrictions on coal leasing on federal lands this past March, 2017. However, just last week, a federal judge ruled that the current Administration’s efforts to suspend methane emission restrictions from pipelines crossing public lands were illegal. These are merely a few of the Obama-era environmental protections that Zinke is attempting to gut.
Zinke has proposed decreasing the size of Bears Ears National Monument from the current 1.35 million acres to a mere 160,000, a reduction of 88%. The Bears Ears Inter-Tribal Coalition, made up of thirty Native American tribes, condemned the recommendation as a “slap in the face to the members of our Tribes and an affront to Indian people all across the country.” The Navajo Nation intends to sue the President’s administration if this reduction at Bears Ears is enacted.
Bears Ears National Monument, designated by President Barack Obama, contains tens of thousands of cultural artifacts, and is facing not only a threat of boundary shrinkage, but also a relaxing use restrictions within the Monument area. The current President has referred to Obama’s designation of the monument as “an egregious abuse of power.” Grand Staircase-Escalante was designated by President Bill Clinton, and the Cascade-Siskiyou National Monument was designated by Clinton and expanded by President Obama.
The recommendation details were not made public in August, however, and only came to light in September through a leaked memo, published in The Washington Post. In the memo, Secretary Zinke noted that the existing boundaries were “arbitrary or likely politically motivated or boundaries could not be supported by science or reasons of resource management.” The memo goes on to say that “[i]t appears that certain monuments were designated to prevent economic activity such as grazing, mining and timber production rather than to protect specific objects.” In addition, Zinke is advocating for the modification for commercial fishing uses of two marine national monuments: the Pacific Remote Islands, and Rose Atoll.
Lacking Specificity
According to the Washingon Post, Zinke:
… plans to leave six designations in place: Colorado’s Canyons of the Ancients; Idaho’s Craters of the Moon; Washington’s Hanford Reach; Arizona’s Grand Canyon-Parashant; Montana’s Upper Missouri River Breaks; and California’s Sand to Snow.
Perplexingly, the report is silent on 11 of the 27 monuments named in the initial proposal. One of which is the Papahanaumokuakea Marine National Monument — over 725,000 square miles of ocean — in the northwestern Hawaiian Islands.
The report also requests tribal co-management of “cultural resources” at Bears Ears, Rio Grande del Norte, and Organ Mountain-Desert Peaks. While one could imagine that greater involvement of indigenous people in the federal government’s management of the sacred landscapes to be a potentially positive improvement, the report is silent on the details. More information on tribal co-management and other options can be gleaned from a series of position papers written by the Property and Environment Research Center.
Of other note: Zinke is also suggesting the establishment of three new national monuments, including the 130,000-acre Badger-Two Medicine area in Montana, a sacred site of the Blackfeet Nation. Badger-Two Medicine was the site of a more than 30-year battle to retire 32,000 acres of oil and gas leases. The tribe prevailed, and the leases were canceled in November, 2016.
With potential lawsuits pending about boundary changes, galvanized push-back from environmental and tribal interests on resource management definitions for the targeted monuments, and general unpredictability on policy details and staffing in Washington, the trajectory of how this story will play out remains uncertain. FracTracker will continue to monitor for updates, and provide additional links in this story as they unfold.
Federal Lands Map Data Sources
National Monuments under consideration for change by Secretary Zinke:
Accessed from ArcGIS Online by FracTracker Alliance, 28 August 2017. Data apparently from federal sources, such as BLM, NPS, etc. Dataset developed by Kira Minehart, GIS intern with Natural Resources Defense Council.0=not currently targeted for policy or boundary change1= targeted for expanded resource use, such as logging, fishing, etc. 2=targeted for shrinkage of borders, and expanded resource use.
National Park Service lands with current or potential oil and gas drilling:
Downloaded by FracTracker Alliance on 9 November 2016, from National Park Service. Drilling information from here. List of sites threatened by oil and gas drilling from here (23 January 2013).
Badger-Two Medicine potential Monument:
Shapefile downloaded from USGS by FracTracker Alliance on 28 August 2017. This map layer consists of federally owned or administered lands of the United States, Puerto Rico, and the U.S. Virgin Islands. For the most part, only areas of 320 acres or more are included; some smaller areas deemed to be important or significant are also included. There may be private inholdings within the boundaries of Federal lands in this map layer. Some established Federal lands which are larger than 320 acres are not included in this map layer, because their boundaries were not available from the owning or administering agency. Complete metadata available here.


