Updated Pennsylvania Marcellus Shale Production Information
Updated Marcellus Shale well production data for the period between July 1, 2010 and December 31, 2010 is now available on the DEP website and FracTracker’s DataTool. This data is self-reported by the drilling operators, and includes production in the following categories:
- Natural Gas: Production in thousands of cubic feet (Mcf)
- Condensate: Production in barrels
- Oil: Production in barrels
Let’s take a look at some of the numbers.
Gas Production and Well Status
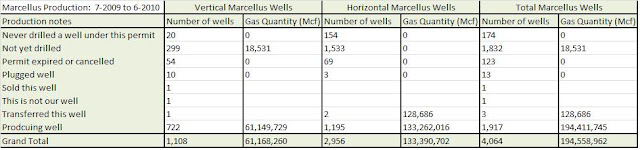 |
Table 1: Production notes and values for Pennsylvania Marcellus Shale wells, July 1 2009 to June 30, 2010
 |
Table 2: Production notes and values for Pennsylvania Marcellus Shale wells, July 1 2010 to December 31, 2010
Although gas production is the focus of the six month production report, there is enough useful data to learn a few other things about the industry as well:
- As with the waste report, there is more production reported in the last half of 2010 than the entire preceding year. Although there are more producing wells, my suspicion is that the real reason is poor reporting for the July 2009 to June 2010 report.
- As corroborating evidence of poor reporting, the earlier report includes significant production from wells that are “Not yet drilled”. This issue has been corrected for the last half of 2010.
- Only 26 Marcellus Shale wells are reported as plugged. This is fairly impressive, as the earliest Marcellus well in Pennsylvania was from 2006.
- Over half of the Marcellus Shale wells which have been permitted in Pennsylvania have not yet been drilled. Almost all of these are horizontal wells.
Gas, Condensate, and Oil Production
 |
Table 3: Gas, condensate, and oil production values for Pennsylvania Marcellus Shale wells, July 1 2009 to June 30, 2010
 |
Table 4: Gas, condensate, and oil production values for Pennsylvania Marcellus Shale wells, July 1 2010 to December 31, 2010
The Marcellus Shale is well known as a gas producing black shale formation, but condensate and oil are also produced from these wells in Pennsylvania. There are a couple of trends of note here as well:
- Although the more recent report is for only half the length of time as the older one, this cannot account for the tenfold decrease in oil production.
- The amount of condensate nearly doubled, despite the fact that the reporting period was only half as long.
- Almost all oil and condensate production now comes from horizontal wells.
Location
Now let’s take a look at the geographical distribution of this data. Here, in rapid succession, are the data in table, chart, and map formats:
 |
Table 5: Pennsylvania Marcellus Shale production by county, July 1, 2010 to December 31, 2010
 |
Chart 1: Pennsylvania Marcellus Shale gas production by county, July 1, 2010 to December 31, 2010
PA Marcellus Shale Oil, Gas, and Condensate Production, July 1, 2010 to December 31, 2010. Please click the gray compass rose and double carat (^) to hide those menus.
There are a couple of key points about the location information as well:
- Although Washington county is one of several major producers of natural gas, the vast majority of the Marcellus Shale oil and condensate production in the Commonwealth comes from that county.
- The leading producers in the state by county are (percentage of statewide total in parentheses):
- Bradford (25.7%)
- Susquehanna (23.7%)
- Washington (14.2%)
- Greene(12.3%)
- Tioga (8.8%)
Marcellus Shale natural gas, condensate, and oil production in Southwestern Pennsylvania, July 1, 2010 to December 31, 2010
Production by Operator
 |
Table 6: Natural gas produced by operator in Pennsylvania’s Marcellus Shale formation, 7-1-10 to 12-31-10.
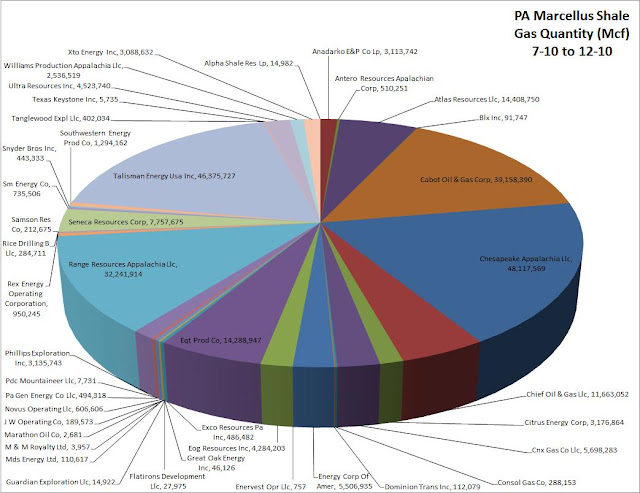 |
Chart 2: Natural gas produced by operator in Pennsylvania’s Marcellus Shale formation, 7-1-10 to 12-31-10.
The leading producers in the state by operator are (percentage of statewide total in parentheses):
- Chesapeake Appalachia Llc (18.8%)
- Talisman Energy Usa Inc (18.1%)
- Cabot Oil & Gas Corp (15.3%)
- Range Resources Appalachia Llc (12.6%)
- Atlas Resources Llc (5.6%)