The majority of FracTracker’s posts are generally considered articles. These may include analysis around data, embedded maps, summaries of partner collaborations, highlights of a publication or project, guest posts, etc.
Over the last decade, operators in the natural gas industry have developed highly sophisticated methods and materials for the exploration and production of methane from unconventional reservoirs. In spite of the technological advances made to date, these activities pose significant chemical and biological hazards to human health and ecosystem stability.
If future impacts may be inferred from recent historical performance, then:
Approximately two percent of shale gas well projects in New York will pollute local ground-water over the short term. Serious regulatory violations will occur at more than one of every ten new shale gas projects.
More than one of every six shale gas wells will leak fluids to surrounding rocks and to the surface over the next century.
Each gas well pad, with its associated access road and pipeline, will generate a sediment discharge of approximately eight tons per year. If not sequestered from local waterways, these sediments will further threaten federally endangered mollusks and other aquatic organisms.
Construction of access roads and pipelines will fragment field and forest habitats, further threatening plants and animals which are already species of concern.
Some chemicals in ubiquitous use for shale gas exploration and production, or consistently present in process wastes, constitute human health and environmental hazards when present at extremely low concentrations. Potential exposure effects for humans include poisoning of susceptible tissues, endocrine disruption syndromes, and elevated risks for certain cancers.
Exposures of gas field workers and neighbors to toxic chemicals and noxious bacteria are exacerbated by certain common practices, such as air/foam-lubricated drilling and the use of impoundments for flowback fluids. These methods, along with the intensive use of diesel-fueled equipment, will degrade air quality and may cause a recently described “down-winder’s syndrome” in humans, livestock and crops.
State officials have not effectively managed oil and gas exploration and production in New York, evidenced by thousands of undocumented or improperly abandoned wells and numerous incidents of soil and water contamination. Human health impacts from these incidents may include abnormally high death rates from glandular and reproductive system cancers in men and women. Improved regulations and enhanced enforcement may reasonably be anticipated to produce more industry penalties, but not necessarily better industry practices, than were seen in the past.
Overall, proceeding with any new projects to extract methane from unconventional reservoirs by current practices in New York State is highly likely to degrade air, surface water and ground-water quality, to harm humans, and to negatively impact aquatic and forest ecosystems. Mitigation measures can partially reduce, but not eliminate, the anticipated harm.
Ronald E. Bishop, Ph.D., CHO
Chemistry & Biochemistry Department
State University of New York, College at Oneonta Sustainable Otsego
https://www.fractracker.org/a5ej20sjfwe/wp-content/uploads/2025/09/2025-Wordmark-Logo.png00Guest Authorhttps://www.fractracker.org/a5ej20sjfwe/wp-content/uploads/2025/09/2025-Wordmark-Logo.pngGuest Author2011-04-05 10:43:002020-07-21 10:37:41Chemical and Biological Risk Assessment for Natural Gas Extraction in New York
All oil and gas violations issued by the PA DEP in 2010, divided by the number of wells drilled in the same time frame, by county. Please click the map for a larger, dynamic view.
Two new violation datasets are up on FracTracker’s DataTool: 2010 Oil and Gas Violations in PA and 2010 Violations by County. The first set includes the raw data from the Pennsylvania Department of Environmental Protection (DEP)(1), and the second set includes violation and other oil and gas data at the county level.
Well Violation Data
See the legend for description of well type. Please click the gray tabs with the compass rose and the double carat (^) to hide those menus. for information on specific wells, click the “i” tool then any map feature.
There are a number of problems with this dataset. Altogether, there were 3,273 violations, but the total number of unique wells that represents is not known, because 271 of the violations didn’t even have a valid well API number associated with it. Since this data does not contain longitude, latitude, well type, or any indicators as to whether the violating wells were Marcellus Shale wells or horizontally drilled, none of this information can be known about these 271 violations.
2010 Oil and Gas Violations: Marcellus Shale, Other Formations, and Unknown Wells
In fact, of the remaining 3,011 violations, 665 are from wells where the API number do not match a compilation of over 40,000 permits from 1998 to 2010 which has been published on the DEP website. It’s a pity, since the rate of violations per offending well is lower than either of the other category then we must say that this value for both Marcellus Shale and non Marcellus Shale wells are overstated. We just don’t know by how much.
Violations per offending well type, January 2007 to September 2010
However, in a previous analysis over a 40 month period (including a nine month overlap with this data), the number of violations per offending wells were fairly comparable to the 2010 data. In the older dataset, offending Marcellus Shale wells were likely to have 1.47 times as many violations as their non Marcellus counterparts, and in the current data, that number is 1.44.
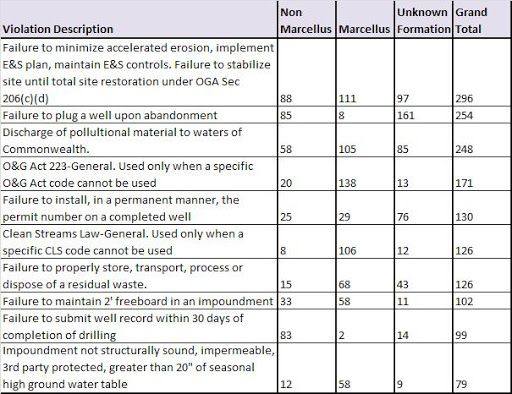
The most frequent violations are as follows:
Most frequently cited oil and gas violations in 2010 (2)
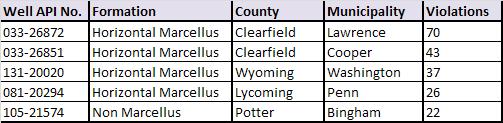
Here are the five wells which were issued the most citations in 2010:
Wells with most violations issued by the PA DEP in 2010
County Level Violation Data
The 2010 Violations by County dataset linked to above contains a wealth of county level oil and gas data for Pennsylvania. Also included are the number of drilled wells in 2010, July 2010 to December 2010 Marcellus Shale production data (3), as well as ratios of violations to both categories.
2010 Marcellus Shale (MS) violations per 2010 MS well drilled. Please click the image for a dynamic view.
2010 non MS violations per 2010 non MS drilled well. Please click the image for a dynamic view.
To my mind, it is notable that Washington and Green Counties in Southwestern Pennsylvania both have relatively few violations per well, despite the fact that they are both in the top five counties in terms of Marcellus Shale production.
Speaking of production, let’s take a look at that. While violations per well can give you an idea of what to expect for any new well in a geographic area, production from the Marcellus Shale is uneven. Some may argue that industry violations are more permissible in areas that yield more gas. Whether that argument holds water for you or not, violation per production amount is still a useful cost-benefit tool.
2010 MS violations per billion cubic feet (Bcf) produced by the MS between July 2010 and December 2010. Counties with at least 5 Bcf of production in that period are outlined in red. Please click the image for a dynamic view.
As was the case in Utah, a pattern is emerging where the most violations come from areas where drilling is relatively less well established or productive. None of the seven counties with at least 5 Bcf produced (outlined in red) are near the top of the violations per Bcf map.
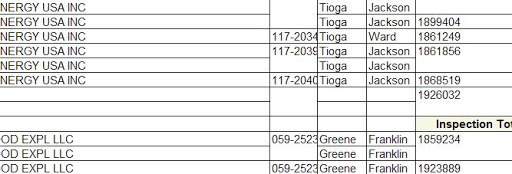
The dataset required heavy formatting to be transformed into a usable file. If you look at the original data linked above, you will note that there are boxes, in which values listed at the top apply to all boxes in that range. There are Excel tricks to allow for automatically filling these boxes, yet those could lead to significant error. There are instances where the box ends, but the spaces below are blank as well. My interpretation of this is that that values outside of the box are intended to be blank. It would be preferable if the DEP output filled in all of these cells appropriately, not only saving time, but reducing the chance for errors, and removing viewer interpretation as a factor in the dataset.
The large number of “Failure to plug a well upon abandonment” for the “Unknown Formation” category may suggest that most of these wells are non Marcellus Shale, as many of those wells are older and more likely to be abandoned. In retrospect, I might have gotten more well number matches if I had used the PASDA list, which includes wells older than 1998, and last I checked, has over 120,000 wells in their database. PASDA data includes location, but no indication of whether the wells are Marcellus Shale or horizontally drilled.
Unfortunately, there is no way to separate out Marcellus Shale production for the first half of the year, the data for which had been formatted to reflect a July to June fiscal year. Also, as of this writing, no production data for non Marcellus Shale wells for any part of 2010 is available.
https://www.fractracker.org/a5ej20sjfwe/wp-content/uploads/2025/09/2025-Wordmark-Logo.png00Matt Kelso, BAhttps://www.fractracker.org/a5ej20sjfwe/wp-content/uploads/2025/09/2025-Wordmark-Logo.pngMatt Kelso, BA2011-04-05 10:25:002020-07-21 10:37:41Pennsylvania 2010 Oil and Gas Violation on FT’s DataTool
In an unprecedented policy shift, inspectors in Pennsylvania have been ordered to stop issuing violations against drillers without prior approval from Gov. Corbett’s new environmental chief.The change, ordered last week in response to complaints by the drilling industry and its supporters in the Pennsylvania legislature, dismayed ground-level staff in the Department of Environmental Protection and drew a chorus of outrage from environmental advocates. Read more.
May 3, 2011 Update: The DEP has completely rolled back the need for the chief’s approval prior to citing violations. Read more.
https://www.fractracker.org/a5ej20sjfwe/wp-content/uploads/2025/09/2025-Wordmark-Logo.png00FracTracker Alliancehttps://www.fractracker.org/a5ej20sjfwe/wp-content/uploads/2025/09/2025-Wordmark-Logo.pngFracTracker Alliance2011-03-31 21:02:002020-07-21 10:37:40PA environment chief now must approve any shale-drilling citations
Susquehanna River Basin Commission water withdrawal permits issued on March 10, 2011. Please click the image for a larger, more dynamic view.
Water Withdrawals
On March 24th, the Susquehanna River Basin Commission released notes about the public portion of their quarterly Commission meeting, which included a variety of water withdrawal permits. Specific locations were not included in the report, so the geographic information available on our DataTool is approximate.
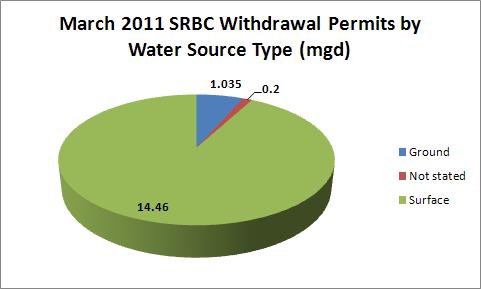
March 2011 SRBC Water Withdrawals by Source Type. Please click the information tool (“i” button) then a map feature for more information. Please click on the gray compass rose and double carat (^) to hide those menus.
Water permits issued by the Susquehanna River Basin Commission at their March 2011 quarterly meeting by water source type, in millions of gallons per day.
March 2011 SRBC Water Withdrawals by Industry Type. Please click the information tool (“i” button) then a map feature for more information. Please click on the gray compass rose and double carat (^) to hide those menus.
Water permits issued by the Susquehanna River Basin Commission at their March 2011 quarterly meeting by applicant’s industry type, in millions of gallons per day.
The financial sector in the chart above is represented by Peoples Financial Services. Their own company website is almost completely useless, but the New York Times explains that they are a commercial and retail bank, primarily active in Susquehanna and Wyoming counties. There is no reason to think that a regional bank would go through a million gallons of water a day, so their permit request seems likely to be on behalf of one of their clients.
The total permitted amount approved on March 10, 2011 is 15.695 million gallons per day. According to the American Water Works Association, the average daily per capita residential water usage is 69.3 gallons, meaning that the water permits approved in the Susquehanna River Basin this month is the equivalent to the water usage of 226,479 people.
Remote Water Quality Monitoring Network
While we are discussing the Susquehanna River Basin Commission, they have an interesting tool called the Remote Water Quality Monitoring Network, which is a collection of solar powered water monitoring stations, and provides real time data for pH, conductance, dissolved oxygen, and turbidity. In browsing this for a moment or two, the pH level for Canacadea Creek near Almond, NY stuck out. It’s value of 3.87 is acidic enough to kill most fish and macroinvertebrates. The tool also has historic data, which shows that a month and a half ago, the pH from the same location was up at 8.79 pH units.
While I certainly hope that the SRBC and other authorities in New York figure out what’s going on in Canacadea Creek, I applaud the transparency that the Remote Water Quality Monitoring Network brings to the table. In the 21st Century, residents should have access to tools of this nature to alert them to real-time environmental challenges in their own communities.
https://www.fractracker.org/a5ej20sjfwe/wp-content/uploads/2025/09/2025-Wordmark-Logo.png00Matt Kelso, BAhttps://www.fractracker.org/a5ej20sjfwe/wp-content/uploads/2025/09/2025-Wordmark-Logo.pngMatt Kelso, BA2011-03-31 12:55:002020-07-21 10:37:40SRBC Water Withdrawal Permits and Water Quality Monitoring
By Matthew S. Freiberg, MD, MSc, Assistant Professor of Medicine and Epidemiology, University of Pittsburgh
First and foremost, the issue at stake here is Pittsburgh’s need to have clean water for overall public health as well as for economic viability now and in the future. It should go without saying that if Pittsburgh is labeled a city with contaminated or polluted water, Pittsburgh will have an impossible time recruiting new businesses to the area, maintaining the businesses it does have, and it will be saddled with the economic burden of clean up plus health care costs.
Therefore, it is essential that Pittsburgh acts to ensure that its water sources remain clean.Pittsburgh should be vigilant about its water supply because recent events suggest industry has not always been correct.
Not so long ago, the American public was told by the Tobacco Industry that “nicotine is not addictive” and “smoking does not cause lung cancer.” We, of course, now know this is not true, but the damage has been and continues to be done every day all over the world. As a physician in Pittsburgh, I can tell you first hand that our community continues to pay a huge price for these huge mistakes.
More recently, the American public was told that the banking industry did not require intense regulation or oversight because “the market” would correct any problems. Is there is any one in America right now who believes that the banking industry should oversee itself?We are now told that our drinking water is “safe” based on recent testing in our local rivers, and our newly elected officials are suggesting that additional regulations for the Natural gas industry are not necessary.
My response to these comments is that history often repeats itself, but it does not have to.So, how should Pittsburgh approach this problem?
Consider the following story about a patient named Mr. Pittsburgh
Mr. Pittsburgh presents to the hospital with chest pain. Mr. Pittsburgh smokes, has high blood pressure, and high cholesterol. Mr. Pittsburgh and his family are concerned he is having a heart attack. The doctor agrees and decides to check his blood for evidence of damage to his heart. After an hour of waiting, the doctor returns with good news: Mr. Pittsburgh has not had a heart attack. However, the doctor does tell Mr. Pittsburgh that checking his blood is not the way to prevent a heart attack. Checking his blood only tells him if he has had a heart attack. The way to prevent the heart attack is to quit smoking and to lower his blood pressure and cholesterol. The doctor also explains to Mr. Pittsburgh that if he continues to smoke and have high blood pressure and high cholesterol that he will likely have a heart attack. This heart attack may kill him. If Mr. Pittsburgh survives his heart attack, he may still have a permanently damaged heart. At the very least, the doctor says that Mr. Pittsburgh will require medication that can be very expensive for the rest of his life.
The case of Mr. Pittsburgh is exactly what we are facing with drilling for natural gas and protecting our drinking water. While I applaud the initiative to check the water, the answer to protecting our drinking water for the good of our public health and economic viability lies in prevention. The keys to prevention are ensuring that the processes by which natural gas is extracted, the chemicals used in the process of FRACKING, and the disposal of waste water associated with FRACKING are safe.
How does Mr. Pittsburgh ensure safety?
Well, let’s take a look at the some of the regulations that are required for a new medicine to be used on patients.
When physicians conduct clinical trials involving patients to determine if a new medicine is safe and effective for people, the physicians and scientists conducting the trial are NEVER allowed to be in charge of overseeing the safety issues involving their own trial. There is a completely separate group of physicians and scientists who serve on a Data Safety Monitoring Board (DSMB). The DSMB’s job and responsibility is to ensure the safety of the patients in the study and the DSMB has the authority to stop any trial that is a danger to the patients in the trial. This is a good system because it reduces the possibility that a conflict of interest will occur between the physicians and the outcome of the trial. Allowing physicians to run studies while also determining whether the study is safe for the participants is a clear conflict of interest and it compromises the integrity of the science.
So if medicine requires this level of oversight to protect patient safety, why should the natural gas industry not be subject to the same strict oversight? Ensuring clean drinking water is just as vital to a person’s health as is ensuring that the medication a patient takes is safe. Given what is at stake, public health and sustained economic viability of Mr. Pittsburgh’s city, Mr. Pittsburgh should demand the same level of independent oversight of the natural gas industry as is currently practiced and strictly enfored for clinical trials involving new medications.
Why should we consider re-evaluating the FRACKING Mechanism or any part of the drilling process for that matter?
In medicine, we are always reviewing, re-evaluating, and reconsidering patient treatment guidelines. The reason we do this is because new science is always happening and sometimes new science suggests a better way to care for people or that our current way of caring for patients may not be as safe as we once thought. In the case of FRACKING, recent documents provided by the New York Times suggest that this process poses more than a reasonable risk to our drinking water supply. Like science, laws, policies, and regulations need to be constantly revisited and changed when appropriate. In Mr. Pittsburgh’s case, it is no longer clear, based on the new science that our current laws, regulations, and policies are adequately providing the necessary protections to ensure clean and safe drinking water.
Final Thoughts
Pittsburgh and SW Pennsylvania are sitting on one of the largest sources of natural gas anywhere. Companies are going to want to drill here, and they will make large amounts of money doing so. While there may be benefits for Pittsburgh and SW Pennsylvania in terms of jobs and revenue, there are clearly risks associated with this drilling. There is very little doubt the current situation is a “win” for industry. What we (Mr. Pittsburgh’s community) need is to be sure of that there is a win for us, our children, grand children and future generations long after the natural gas is gone and the natural gas companies have left. It is precisely the “win” for us that I am concerned about and I believe is not being adequately addressed.How might we “win” in this situation?
We can only “win” if the water supply remains undamaged. We will surely lose our health and our economic viability if our water is polluted. We will not be the only “loser” either. Our families, children, and future generations will also “lose” if we don’t “win.”
To help us “win,” we should demand of our U.S. Senators, U.S. Representatives. Director of the EPA, Governor, Legislature, local officials, and the industry itself the following:A true preventive strategy: continue regular random checks of drinking water sources—both rivers and well water for those closest to the drilling PLUS regular random checks of the drilling wells, waste water, and waste water disposal processes—checking water only tells us that a “heart attack” has happened. What we need is to prevent “the heart attack.”
Stricter oversight of the natural gas industry by a “Data Safety Monitoring Board”, preferably not affiliated with the state of Pennsylvania in order to minimize any conflict of interest: Clean water is just as important as safe medicine and it requires the same level of oversight as a new medicine in order to protect us, our family, friends and neighbors from having “a heart attack.”
An efficient and expedited review of the FRACKING materials and procedures and processes for monitoring waste water and waste water disposal. New information requires new evaluations. Our health and the area’s economic viability for the future requires that all procedures associated with natural gas drilling be safe and present no threat to the drinking water supply. The determination of whether FRACKING and other procedures are safe should again be conducted by a Data Safety Monitoring Board.
Because no one can possibly tell everyone who needs to know about this issue, we should ask for the following help:
The local newspapers, radio stations, and television stations should continue to follow this topic understanding that this process of drilling will last years.
The Carnegie museums should have an exhibit on the Marcellus Shale. This exhibit should clearly state the potential benefits and clear risks affecting the region of SW PA and Pittsburgh by drilling for natural gas.
Universities, colleges, and school districts in SW PA should educate students about the Marcellus Shale and how this natural gas drilling will affect their everyday lives. This information will be essential as they decide how to deal with this process including who to vote for and on what policies to vote for so that our drinking water and economic viability remain secure.
In my opinion, the current conditions are NOT a “win win” situation for us. Without a true preventive strategy, stricter oversight, a serious review of the FRACKING procedure, waste water, and waste water disposal, and sustained community involvement, I think we are all in danger of losing our clean drinking water and with it our health and the economically viability of our community for now and for future generations. We all understand that the decisions of today will impact several future generations, and the impact of these decisions will be present long after the natural gas and the natural gas industry are gone.
Matthew S. Freiberg, MD, MSc
Assistant Professor of Medicine and Epidemiology
Division of General Internal Medicine and Center for Research on Health Care
University of Pittsburgh
230 McKee Place, Suite 623
Pittsburgh, PA 15213
telephone 412 586 9847
fax 412 692 4838
email: freibergms@upmc.edu
https://www.fractracker.org/a5ej20sjfwe/wp-content/uploads/2025/09/2025-Wordmark-Logo.png00Guest Authorhttps://www.fractracker.org/a5ej20sjfwe/wp-content/uploads/2025/09/2025-Wordmark-Logo.pngGuest Author2011-03-31 09:40:002020-07-21 10:37:40Natural Gas Drilling, Clean Water, and Mr. Pittsburgh
Increasingly, bright Republicans strain to save their party from its “know-nothing” fringe.Particularly key is climate change, on which both Republicans for the Environment, and formerRepublican EPA Administrators William D. Ruckelshaus and Christine Todd Whitman, haverecently lambasted the GOP’s climate change knuckle-draggers.
Their success is critical, as governing our nation will long remain a bipartisan affair. When allserious climatologists—and the National Academy of Sciences, America’s most prestigiousscientific body—insist human-caused climate change is real and menaces Earth’s survival,science-denying partisanship has no good excuse.
Regrettably for our planet, Republican “fossil fools” steer Pennsylvania’s ship of state. Thinkthat’s harsh? Then you missed the maiden voyage of Governor Corbett’s Marcellus Shale Advisory Commission. Virtually adrool for Marcellus gold, not one of Corbett’s handpickedcrew let the clouds of climate reality dim their gas-fueled sunshine. Yet the best available sciencesuggests “lifecycle” natural gas has a dirtier greenhouse imprint than coal.
Corbett’s science—and economics—apparently derive from witch doctors.
Fossil fuels—all of them—have almost outlived useful days, but Corbett’s “voodoo economics”would make these ghouls twitch another 100 years. Enlightened Republicans—like Democrats—will resist voodoo’s lethal spell, and slay the gas zombies before it’s too late.
Submitted to FracTracker by Patrick Walker. Contact information: pjwalkerzorro@yahoo.com, or (570) 945-7621.
Municipal level census data in Pennsylvania for the year 2010. Click the image to see a larger, dynamic snapshot.
Municipal level census data is now available to visualize or download from FracTracker’s DataTool. Categories of note include:
2010 US Census count
2000 US Census count
Net change from 2000 to 2010
Percent change from 2000 to 2010
Among other uses, this dataset allows for some basic explorations of how the Marcellus Shale industry affects communities throughout the Commonwealth.
Pennsylvania population and Marcellus Shale gas production by municipality. For information on a specific municipality, please zoom in and click the “i” button in the blue circle, then the map feature of your choice. Please click on the gray compass rose and double carat (^) to hide those menus.
Without doing any serious number crunching, this map shows that gas from the Marcellus Shale is being extracted in more sparsely populated areas of the state. Let’s take a closer look at Southwestern Pennsylvania.
Southwestern Pennsylvania population and Marcellus Shale gas production by municipality. For information on a specific municipality, please zoom in and click the “i” button in the blue circle, then the map feature of your choice. Please click on the gray compass rose and double carat (^) to hide those menus.
Note the ring of Marcellus Shale production around the heavily populated municipalities surrounding Pittsburgh.
We can also take a look to see whether the Marcellus Shale gas industry had any obvious effect on populations in Pennsylvania.
Population change and the Marcellus Shale in Pennsylvania. Please zoom in and click the “i” button in the blue circle, then the map feature of your choice. Please click on the gray compass rose and double carat (^) to hide those menus.
Areas with the most population loss are white, and those with the largest gains are black. In addition, municipalities with Marcellus Shale production in the last half of 2010 are outlined in red, while those without are outlined in blue. With a cursory look, it appears that the areas with Marcellus Shale production are actually more likely to lose population–a topic that merits further analysis.
The municipal spatial data is from PennDOT (via PASDA), while the population data is of course from the US Census Bureau.
https://www.fractracker.org/a5ej20sjfwe/wp-content/uploads/2025/09/2025-Wordmark-Logo.png00Matt Kelso, BAhttps://www.fractracker.org/a5ej20sjfwe/wp-content/uploads/2025/09/2025-Wordmark-Logo.pngMatt Kelso, BA2011-03-28 16:13:002020-07-21 10:37:39Municipal Level Census Data Now on FT’s DataTool
As the unconventional development of natural gas from shale drum keeps beating “jobsand money”, I find myself perplexed and dismayed by the lack of media attentiondevoted to the disastrous environmental havoc and potential serious health issues createdby this activity.
Over the last year, my wife and I have had our lives turned upside down by Marcellusshale development near our rural home in Mt. Jewett. We have been forced to educateourselves on a daily basis about the many complex issues associated with this activity.
As a physician, I am extremely concerned about the health of all citizens and futuregenerations due to adverse events and toxic water and air exposures associated with shaledevelopment. Unfortunately, our political leaders and gas industry executives do notappear to share this concern. They have effectively blocked access to information aboutthe multitude of poisonous chemicals in fracking fluid by exempting it from the SafeDrinking Water Act.
DEP permits massive volumes of inadequately treated residual wastewater from thesewells containing large amounts of total dissolved solids, volatile cancer-causing organiccompounds, and radioactive substances to be discharged daily into our rivers, includingthe Allegheny and Clarion. These chemicals travel downstream and can seep intosuperficial aquifers along the watershed banks, or are taken up directly at communitydrinking water intakes for public consumption. Everyone “in charge” seems content to sitacross the table from us and offer a neighborly fracking fluid/residual waste cocktail todrink, bathe in, and inhale.
Governor Corbett just announced a streamlining of gas well permitting, cut backs in stateemployees (most likely decreasing oversight by DEP), and is refusing to tax the naturalgas industry, while cutting state budgets in all areas. As our communities are strappedeconomically and the roads and infrastructure destroyed by the parade of trucks carryingdrilling equipment, fracking fluid, water, and residual waste to and from well sites, wecontinue to welcome the gas companies into our homes and on our land like they are theSecond Coming of the Christ.
Deep shale natural gas drilling is spreading like a fast-growing uncontrolled cancerthroughout Pennsylvania with hundreds of thousands of wells predicted to be drilledover the next few decades. A massive campaign by multinational gas companies,consulting “experts”, politicians, and now our universities is attempting to transformmuch of the northeast U.S. into the “next Saudi Arabia”. Our exposure to the chemicalsused in the hydrofracturing process will most likely cause a marked increase in cancerand other illnesses. Our environment, drinking water, air quality, property values,roadways, and quality of life are being destroyed at a rapid pace.
What the gas companies and politicians aren’t telling us is that this development isn’t justfor our own energy sustainability, but for export to other countries. Natural gas is alreadybeing shipped to China, India, and elsewhere.
We need to wake up and stop burying our heads in the sand regarding these issues. Weall need to educate ourselves about the myriad of problems, and stop being sweet-talkedby the politicians, media, radio and TV commercials. It is already too late for residentsin Bradford, Dimock, Hickory Township and other communities who have had theirdrinking water, and possibly their homes, destroyed by gas drilling. It is too late forcitizens who have seen their property values drop by 85% once their well or spring hasbecome polluted.
We collectively need to take a stand NOW and urge our state and federal representativesto enact a ban on further unconventional deep shale development until the issues can beappropriately researched, addressed and resolved–and before it is too late for the rest ofPennsylvania. Our future depends on it!
For information about gas drilling, permits, violations, spills, residual waste dumpingat water treatment plants, and health and environmental issues, I urge you to go towww.fractracker.org. This is a website maintained by the University of PittsburghGraduate School of Public Health. I also urge you to go to the New York Times website,www.nytimes.com and read the series of “Drilling Deep” articles published fromFebruary 27-March 8, 2011 about the Pennsylvania debacle.
Jan Hendryx, DO, maintains a clinical practice in Erie, and is a native Bradfordian.
The above article was originally published in the Bradford Era on 3/14/11.
If you would like something you have written or pictures you have taken regarding natural gas drilling to be published on FracTracker.org, please send us the document in an easily accessible file format (such as Word) to malone@fractracker.org. If you would like photographs to be included, include them in individual files (JPG’s or PNG’s) along with the email. Please provide your name and affiliation upon the submission of your piece.
https://www.fractracker.org/a5ej20sjfwe/wp-content/uploads/2025/09/2025-Wordmark-Logo.png00Guest Authorhttps://www.fractracker.org/a5ej20sjfwe/wp-content/uploads/2025/09/2025-Wordmark-Logo.pngGuest Author2011-03-27 17:02:002020-07-21 10:37:39Bradford Era Guest Commentary – Drilling is Spreading like Cancer
The Ohio River Valley Water Sanitation Commission (ORSANCO) has been testing the main stem of the Ohio River for the presence of a variety of metals for some time, with results since 1998 published at their website. Mappable versions (1) of this data from 2010 are now posted on FracTracker’s DataTool as well. Over the years, the scope of the ORSANCO sampling efforts has broadened, both in the number of sampling locations as well as sampling frequency. In recent years, there are seventeen (2) locations, from which samples are obtained every odd numbered month. Currently, the most recent data available is July 2010. Given the rapid surge in Marcellus Shale oil and gas drilling activity within the ORSANCO drainage basin and the millions of gallons of wastewater that ultimately finds its way into the Ohio River by way of numerous treatment plants and road deicing, I wanted to see if the impact of this industrial activity was reflected in the data.
[map archived]
I decided to take a look at barium concentrations. According to the Environmental Protection Agency, background levels of barium are not especially high in this region (3), noting:
…[Barium] occurs naturally in almost all (99.4%) surface waters examined, in concentration of 2 to 340 ug/l, with an average of 43 ug/l. The drainage basins with low mean concentration of barium (15 ug/l) occur in the western Great Lakes, and the highest mean concentration of 90 ug/l is in the southwestern drainage basins of the lower Mississippi Valley. In stream water and most groundwater, only traces of the element are present.
Barium is also a signature constituent of sorts of Marcellus Shale wastewater. According to this industry report, barium values range from 2,000 to 6,500 milligrams per liter in the wastewater.
[map archived]
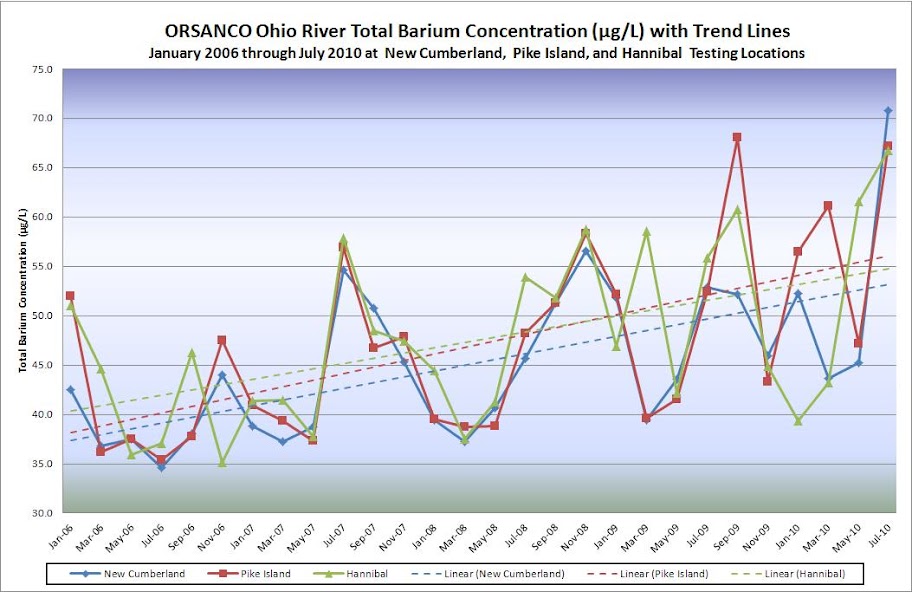
This gives us an idea of how concentrations vary in space, at least on this occasion. Note that each of the first four testing locations downstream from the confluence of the Allegheny and Monongahela Rivers in Pittsburgh are among the highest group, with barium values in the 56.7 to 70.8 micrograms per liter (µg/L)range. These values are at once notably above the average background level and well below the EPA drinking water standard for barium of 2 milligrams per liter (4).
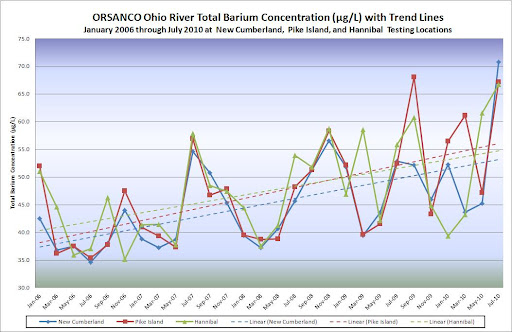
But what about changes over time? Marcellus Shale drilling activity has been increasing exponentially since the first well was drilled in 2006. Could this activity have any long term effects? To investigate this point, I compiled the barium amounts since 2006, and selected the three testing locations closest to Pennsylvania: New Cumberland Locks and Dam, Pike Island Locks and Dam, and Hannibal Locks and Dam. ORCANCO barium values at New Cumberland, Pike Island, and Hannibal testing locations. Please click here for a larger view.
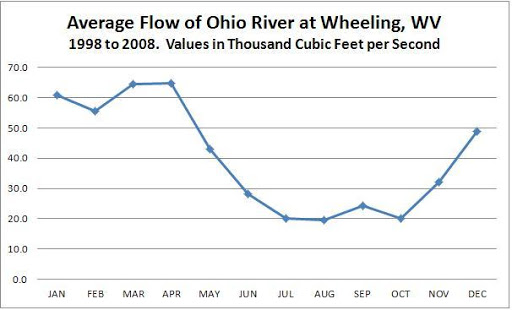
Right off the bat, we can see that there are significant seasonal variances, with peaks in late summer, and troughs in the late spring. That appears to be inversely proportional to the average flow rate of the Ohio River.
Average annual flow rate of the Ohio River at Wheeling, WV. Units are in Thousands of cubic feet per second (KCBS), and represent values between 9-1-98 and 2-29-08. Detailed flow data is available here.
Since barium values are clearly lower when there is more water in the river, it seems likely that such fluctuations would be due to dilution of pollution rather than natural circumstances.
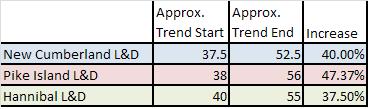
Seasonal differences aside, the dashed trendlines of barium concentration show another story. Barium values are going up at all three locations. Significantly.
Approximate start and end values for the trendlines representing barium content in micrograms per liter at three testing locations on the Ohio River.
So while the recorded values themselves in the main stem of the northeastern portion of the Ohio River are not alarming, the fact that they are increasing so rapidly is a concern. It is worth bearing in mind that the values in some tributaries might be much higher, and that barium is only one of many pollutants associated with Marcellus Shale wastewater disposal.
Of course, none of this amounts to establishing causation between the Marcellus Shale industry and the elevated barium levels, but the circumstantial evidence is strong: barium values are very high in the wastewater, which is finding its way in large amounts into the Ohio River, where barium values are rising sharply.
Locations were found with Google Maps, based on location description. In most cases, samples were taken from specific locks and dam structures, allowing for a fairly exact location. Some other locations are designated by the name of a small town, in which case, the mapped locations may be off by a mile or so.
There is now an eighteenth testing location, McAlpine, 0.2 miles downstream of the Louisville testing station.
While surface water is typically low in barium here, well water can be a significant issue:
The drinking water of many communities in Illinois, Kentucky, Pennsylvania, & New Mexico contains concentrations of barium that may be 10 times higher than the drinking water standard. The source of these supplies is usually well water. Currently 60 ground water supplies and 1 surface water supply exceeds 1000 ug/l.
While these numbers are not alarming, it is worth noting that they are measured at an extremely well mixed area (locks and dams) of a massive river; at the time of this writing, the flow at Wheeling, WV was 134,700 cubic feet per second. Barium values on some tributaries could be much higher.
This article has been archived and is provided for reference purposes only.
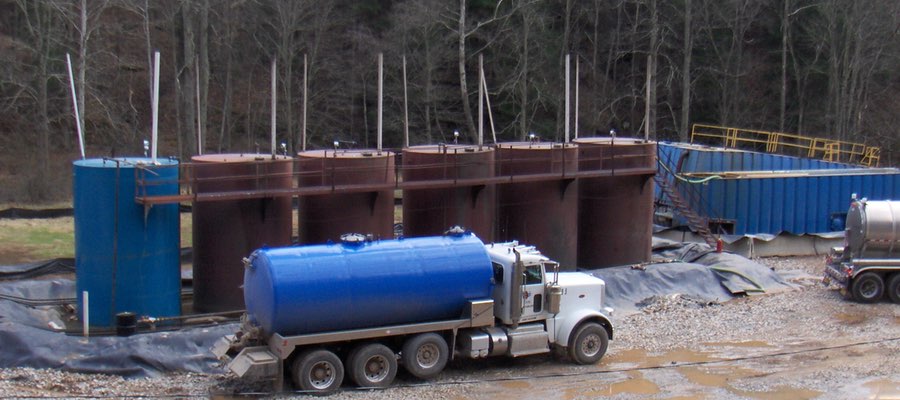
The Pennsylvania Attorney General’s office released a statement yesterday, saying that criminal charges have been filed against Robert Allen Shipman from Green County and his company, Allen’s Waste Water Services, Inc., for allegedly dumping millions of gallons of waste, including gas drilling waste, in six southwestern Pennsylvania counties between 2003 and 2009. There are 98 charges against him personally, and an addtional 77 counts against his company.
The grand jury and Acting Pennsylvania Attorney General William H. Ryan, Jr. allege that Mr. Shipman’s company operated in the following manner:
Drivers were instructed to mix several waste types, obscuring the actual contents, allowing for easier disposal
Destroying original manifests with forged ones, in order to overcharge customers
Leaving valves open on trucks at gas wells after dark or in rainy periods, in order to illegally dump wastewater onto the ground
Dumping into a drain at a Allan’s Waste Water Services facility, which drains directly into a stream
According to the Post Gazette, Mr. Shipman has posted a $50,000 bond, and Allan’s Waste Water Services is open for business.
If convicted, Mr. Shipman could face jail time and fines up to $1.5 million and another $1.2 million for his company. According to the Post-Gazette article, Mr. Shipman’s operation earned him up to $7 million per year.
A preliminary hearing has been set for March 25th in Greene County.
https://www.fractracker.org/a5ej20sjfwe/wp-content/uploads/2015/02/Storage-containers-feature.jpg400900Matt Kelso, BAhttps://www.fractracker.org/a5ej20sjfwe/wp-content/uploads/2025/09/2025-Wordmark-Logo.pngMatt Kelso, BA2011-03-18 10:38:002020-07-21 10:37:38Greene County Man Charged with Wastewater Dumping


