PA Marcellus Shale Violations by Operator and County
Earlier this month, I examined 2010 oil and gas violation data for Pennsylvania on a summary level. Now I’m going to focus just on Marcellus Shale wells, and from the perspective of trying to determine the extent that drilling operators and location have on the likelihood of increased violations for any given well.
There are a number of ways in which this could be done. Although I am interested to see if the number of wells drilled in an area or by a drilling operator has a noticeable effect on violations, I have limited both investigations to 10 or more Marcellus Shale wells, both to avoid the erratic results of small sample sizes, and because the large number of results tends to make for crowded data displays.
Violations are only for 2010, both because it is current, and with 1,544 records, it is sufficiently large to make some generalizations about. As for wells, I decided to go for all drilled Marcellus Shale wells rather than just the 2010 wells, because wells that were spudded between 2006 and 2009 might well be included on the violations list. Also, the overall number of wells is a handy way to gauge the relative weight of a given operator or county on the industry as a whole.

2010 Marcellus Shale (MS) violations per total MS well, for counties with 10 or more MS wells.
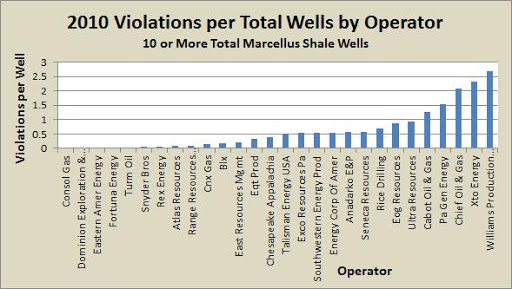
2010 MS violations per total MS well, for operators with 10 or more MS wells.
There are, of course, a number of issues once we start looking at the data in detail. One of the biggest challenges is that many of these wells change hands, or else the companies that drill them change hands or are no longer active in the Marcellus Shale drilling industry in Pennsylvania. For example, in a previous analysis, I noted that Turm Oil had a large number of violations per well, and now they had none at all. I checked to see when their most recent well was drilled, and found my answer:
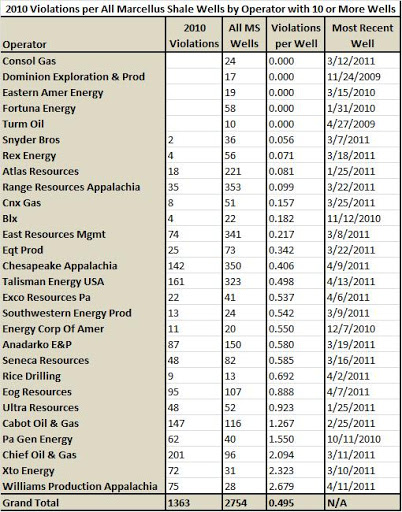
List of operators with 10 or more MS wells, with 2010 violations, frequencies per well, and the date of the most recent well drilled
Turm Oil hasn’t drilled a Marcellus well in almost two years. Looking at the chart above, Turm and Dominion don’t really belong in this analysis, and Eastern American and Fortuna may not for 2011. These four operators account for everyone with 10 or more total Marcellus Shale wells and no violations in 2010 except for Consol—kudos to Consol!
Does the number of wells impact violations?
Clearly, there is a tremendous range of violations per well, both in regards to who the operator is, as well as where the well is located. My hypothesis going into this analysis was that the more wells an operator drilled or the more wells drilled in a county, the fewer violations per well there would be.
I had several reasons for suspecting this to be the case. First of all, think of what must be done for a drilling operation without violations being issued. The site must be carefully placed, in accordance with all applicable regulations. The site must be prepared, taking into account all ground disturbing regulations. Then you have to drill through thousands of feet of rock, making sure that there is a structurally sound casing and cementing job to prevent gas migrations. Then there is the horizontal drilling, and the hydraulic fracturing. All along the way, not a drop of fracing fluid, diesel fuel, brine, or really anything else can touch the ground or enter Pennsylvania’s waters in any way. And when the drilling is done, the site must be restored in a timely fashion. And those are just a few of the regulations that the drilling operators agree to when they undertake drilling operations in Pennsylvania.
Let’s face it—that’s a lot to achieve. In order to consistently come in and out of a site with a clean record has got to take some practice. I’ve heard from industry sources that Marcellus Shale wells cost about $5 million to drill, so to do it right without cutting corners clearly takes significant resources as well.
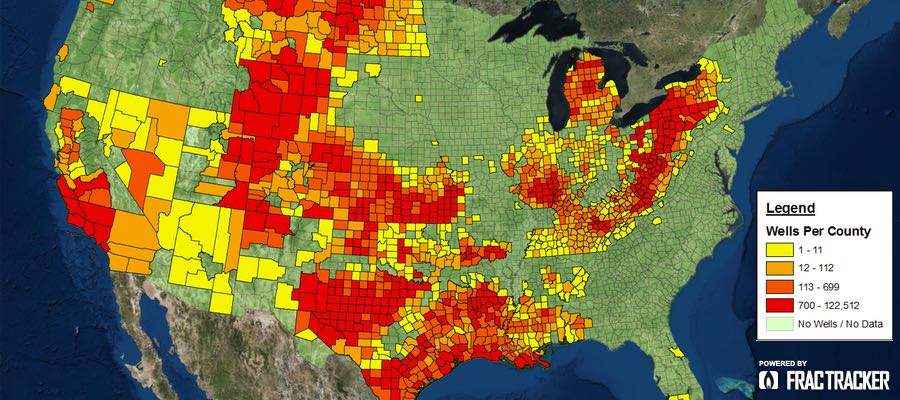
In addition to all of that, a county level map of Marcellus Shale violations per well shows that the counties which produce the most Marcellus Shale gas wells are not the ones with the highest number of violations per well.
Map showing Marcellus Shale violations per county. Counties outlined in red have 100 or more Marcellus Shale wells. Click the gray compass rose and double carat (^) to hide those menus.
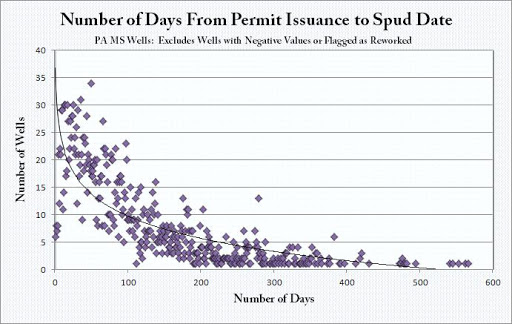
So is there then any correlation between the number of wells drilled and the violations issued? Let’s take a look (1).
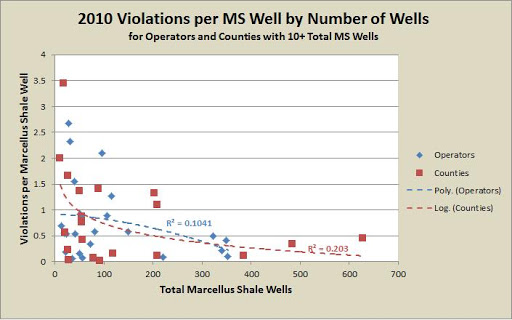
The equations for the trendlines were calculated by Excel, and I selected the ones with the highest R-squared values. I was surprised that the best fit for operators was a convex polynomial. In the graph above, there is indeed a cluster of operators with between 300 and 400 wells, and with about 0.5 violations per well or less, but on the other end of the spectrum, the violations per well are spread far apart. There are so many operators big and small with around 0.5 violations per well or less that it seems some other factors must be at play for all of the operators that exceed that value by a significant margin. Perhaps not everyone will achieve zero violations like Consol did in 2010, but it doesn’t seem reasonable that Williams Production Appalachia should have more than twice the amount of violations as Range Resources Appalachia, despite having only 8 percent of the number of wells as the gas extraction giant.
The correlation was a bit stronger for the counties than for the operators. I’m not entirely sure what factors are at play here, other than perhaps having a crew that is well familiar with the geology of the region and all the specific challenges associated with that. Again though, that doesn’t seem to explain why Wyoming County would have 3.44 violations for every Marcellus Shale well, while those in Washington county can only expect a violation for less than one well out of eight drilled.
[photo removed]
Again, I’m sure that the way this analysis was set up had an effect on some of these numbers, and Wyoming is certainly a smaller sample size than Washington. I also don’t want to infer that there aren’t problems when large operators drill in well established portions of the Marcellus Shale. What’s more, while over 1,500 Marcellus Shale violations in a year is a huge number, it likely doesn’t account for all of the actual incidents, just the ones that the DEP can demonstrate, apparently beyond a shadow of a doubt (2). And even in the best scenario, there are significant impacts upon the land and neighboring residents near the well site.
I am suggesting, however, that there are companies that need to do better in their efforts to comply with laws designed to protect Pennsylvanians from pollution and other deleterious effects of oil and gas drilling. Excuses that environmental regulations are too strict don’t hold water, as their competitors are closer to compliance, sometimes dramatically so.
- In order for Excel to be able to calculate all of the various regression lines, counties and operators with zero violations per well had to be excluded from this analysis.
- I have personally talked to numerous residents who feel that their well water was spoiled by gas operations on neighboring lands. A common theme in their complaints is that the DEP places the burden of proof on residents that their wells were not spoiled before drilling operations began–an almost impossible situation for the residents to predict and be proactive about.