The majority of FracTracker’s posts are generally considered articles. These may include analysis around data, embedded maps, summaries of partner collaborations, highlights of a publication or project, guest posts, etc.

GASP Position on DEP Air Studies

What We Can Learn From Pennsylvania DEP’s Marcellus Air Monitoring Studies

By Joe Osborne, Legal Director, Group Against Smog and Pollution

Last week the Pennsylvania Department of Environmental Protection released a study of air quality around Marcellus Shale operations in northeastern Pennsylvania. Here are some typical headlines from articles on the study: “Pa. DEP study finds Marcellus air emissions OK,” “DEP Says Air Near Marcellus Drilling Sites Is Safe,” or even “DEP finds no health threat from Marcellus air emissions.”

If those headlines are accurate, why do GASP and other environmental organizations keep going on and on and on and on about the massive quantities of air pollution that result from natural gas production? Both can’t be true, right? So what explains the discrepancy?

Limitations of the DEP Studies

First, as DEP acknowledges, the data collected during this study simply is not sufficient to support the bold, sweeping claims found in headlines like those I listed above. This study, as well as a similar study from southwestern Pennsylvania.

DEP released last fall, selected a few sites where natural gas activity was occurring and conducted air monitoring at each of these sites for no more than 5 days. The goal was to determine if any of 44 specific pollutants DEP selected were present in the atmosphere in sufficient concentrations that breathing that air for a short period (generally somewhere between 1 hour and 24 hours) would pose a threat to human health. So already some of the studies’ limitations are clear: between these two studies DEP has conducted monitoring at only 8 natural gas sites, never monitored at any one site for more than 5 days, and ignored the risks of long-term exposure to these pollutants. Are these studies useful? Absolutely, but they don’t justify a sweeping conclusion that natural gas operations pose no risk to our air.

In fairness to the journalists who reported on the DEP’s study, I should also note that the majority of news stories on the DEP’s studies also mention these limitations, but you have to make it most of the way through the typical article before they’re mentioned. And while I’m being fair, I should also mention that DEP acknowledges these limitations in the executive summaries to both of these studies (though press releases and public statements are another matter, which I’ll get to in a moment):

“Due to the limited scope and duration of the sampling and the limited number of sources and facilities sampled, the findings only represent conditions at the time of the sampling and do not represent a comprehensive study of emissions. While this short-term sampling effort does not address the cumulative impact of air emissions from natural gas operations . . . the sampling results do provide basic information on the type of pollutants emitted to the atmosphere during selected phases of gas extraction operations in the Marcellus Shale formation.”

There are also problems with these studies that DEP does not acknowledge… Read more by GASP


Additional Resources

EPA Releases Draft of Hydraulic Fracturing Study Plan

The Environmental Protection Agency has submitted a draft of its Hydraulic Fracturing Study Plan, which is to be reviewed by the Science Advisory Board (SAB), a group of independent scientists that works with the agency.  According to the EPA’s news release, the focus of the study will be the lifespan of the water, from extraction to disposal of the waste water.

The 140 page draft has been made to the public. The SAB is scheduled to review the plan March 7th and 8th, and the plan will likely be edited based on their input.

Initial results of this study are expected by 2012, with an additional report due by 2014.

Salt mining and gas production: how are they related?

Archived

This article has been archived and is provided for reference purposes only.

By Karen Edelstein, New York State FracTracker Liaison

One of New York State’s important industries has been the production of salt. Thick, uniform layers of salt were laid down hundreds of millions of years ago when ancient seas covered our region. When the seas receded or dried up, these salt beds were left behind. Beginning in 1812, salt production began along the shores of Onondaga Lake in Syracuse, New York, “The Salt City.” By the mid- to late-1800s, large-scale salt mining operations sprang up across the state; salt was discovered in the strata below Watkins Glen, NY in 1882. Using the process of solution mining, salt was brought to the surface by drilling wells into the Devonian rock strata. Hot water was pumped into the hole, and the resulting brine was brought to the surface to be evaporated. Over time, each bore hole enlarged into a cavern as more of the solid salt layer was dissolved and pumped out. Over time, over 600 brine solution wells have been drilled in New York State.By Karen Edelstein, New York State FracTracker Liaison


Today, salt is mined through more modern-style solution mining that uses sonar and other technologies to predict the inner dimensions and stability of the caverns created by the solution mining. In addition, salt is extracted from the ground as solid halite (primarily for road salt) at the Cargill Salt facility in Lansing, NY, along the shores of Cayuga Lake. The Cargill mine in Lansing is the deepest rock salt mine in North America, with more than 40 miles of horizontal tunnels all 2300 feet beneath Cayuga Lake. 2.5 million tons of rock salt is mined from this facility each year.

In and around Watkins Glen, NY, there are several salt mining operations, all of which are removing salt as brine. The combined layers of nearly pure salt beneath Watkins Glen are about 450 feet thick, and occur between 1500 and 1900 feet below the surface. The large plant at the south end of Seneca Lake is owned by Cargill. Further up the west side of the lake is the US Salt facility. Along this part of the Seneca Lake shore there are 62 brine wells, all but 6 of which are plugged and abandoned. Some of these abandoned wells date from prior to 1900.

But how is salt production tied to gas production? Brine wells have an additional use beyond the production of salt. They are also used for the storage of liquid petroleum gas. Because in its gaseous state, hydrocarbon fuel takes up a lot more space than it does as a liquid, the gas is pressurized for storage, and held underground until it’s ready to be used.

The proposed LP gas storage site, owned by the Kansas City-based company Inergy, is less than 3 miles north of Watkins Glen (population 2200), and will hold up to 2.1 million barrels of LP gas, pressurized at about 1000 psi. The property is in close proximity to existing gas and hazardous liquid pipeline infrastructure.

Soultion Brine Wells North of Watkins Glen, NY. Click on the blue “i” icon and then on one of the map features for more information.

Depending on demand, brine in the well will be drawn down to make room for the additional storage need, and pumped back down during the months of less demand. Critics of the project are strongly concerned about the construction of the impoundment that will contain the brine. Currently, the planned 92-million-gallon (2.19 million barrel) storage lagoon—1000 feet long, 382-608 feet wide and 32 feet deep, will be perched on a steep slope above Seneca Lake, the largest and deepest of the Finger Lakes. A 50-foot high wall on the downward sloping (8-12% grade) hillside will contain the brine.

A recent public information meeting on the project was held in Ithaca, NY on January 27, with presentations by Peter Mantius, a locally-based investigative journalist, and Thomas Shelley, a retired chemical safety and hazardous materials specialist. Mantius, a 3-time Pulitzer Prize nominee, lives in the Town of Burdett, just across Seneca Lake from the proposed LP gas storage facility. Finger Lakes LPG Storage, LLC proposes to construct and operate a new underground liquefied petroleum gas (LPG) facility there for the storage and distribution of propane and butane. The 576-acre site is located on NYS Routes 14 and 14A west of Seneca Lake in the Town of Reading, New York.

Mantius, who published his findings in October 2010 in the online blog DCbureau.org, noted that while LP gas is commonly stored underground, “…salt caverns have been more prone to catastrophic accidents than the other more common types of underground storage for natural gas or liquified petroleum gas, or LPG. A 2008 report by the British Geological Survey cited several salt cavern accidents, including an explosion caused by an LPG leak in Texas that registered 4 on the Richter Scale and killed three people.”

The New York State Department of Environmental Conservation determined that a draft supplemental environmental impact statement (DSEIS) would be necessary for this project, and in advance of that process, published a draft scoping outline to guide the DSEIS on January 5, 2011. Interestingly, at least 2 individuals who own property adjacent to the proposed facility had only learned of the project within days of the January 27th meeting in Ithaca, barely affording them the opportunity to comment on the project within the allotted time window. The public comment period on the scoping document ended on January 31, 2011.

Clearly, there are concerns about catastrophic failures of both the brine pond impoundment, and the stability of the pressurized cavern itself. Education about the project has been strikingly slow to permeate the surrounding rural community and nearby Village of Watkins Glen. We’ll keep following this issue as it develops.

When Messages are in Opposition, Risk Communication Difficult

By Samantha Malone, MPH, CPH – Communications Specialist, Center for Healthy Environments and Communities of the University of Pittsburgh Graduate School of Public Health (GSPH); Doctoral Student, GSPH

Two reports were issued yesterday by credible sources regarding the safety of natural gas drilling in shale formations. The one was issued by the Pennsylvania Department of Environmental Protection (PA DEP) on the air emissions from natural gas operations. The other by the House Energy Commerce Committee focused on the use of diesel fuel in hydraulic fracturing fluid. While these reports do not contradict one another, they certainly do not contribute to an overall consensus on the public safety of shale gas extraction.

Report 1 – PA Department of Environmental Protection

The PA DEP’s report was based on a four-week air quality study that they conducted in northeastern PA near Marcellus Shale natural gas operations. This report states that the emission levels they surveyed would not constitute a health concern for nearby residents, acknowledging that the study’s purpose was not to address the cumulative impacts that could result from long term exposure.

Report 2 – House Energy and Commerce Committee

The Energy and Commerce Committee within the House of Representatives sent a letter to the Environmental Protection Agency’s Administrator, Lisa Jackson, stating that between ’05 and ’09 oil and gas companies injected over 32 million gallons of diesel fuel or hydraulic fracturing fluids containing diesel fuel in wells in 19 states. This letter noted that at no point in time were these companies officially permitted to use diesel fuel in the hydraulic fracturing process – citing the behavior as a violation of the Safe Drinking Water Act.

The Message

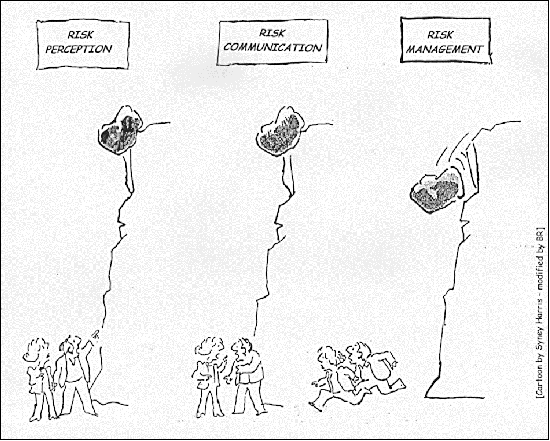
The intention for this post is not to debate whether air contamination is worse than ground or water pollution, whether one report is right/wrong, or to discuss how difficult it is to accurately measure air emissions when companies know when and where you are testing. The true intention of writing this is to stress that the opposing reports only stand to ‘muddy the water’ on America’s viewpoint of the issue. Risk communication is hard enough to do properly without such inconsistency. The fact that these – and many other credible sources – cannot agree on whether natural gas drilling poses an environmental or public health threat further demonstrates that additional, unbiased research should be conducted.

Tracking the Effects on Farms

By Samantha Malone, MPH, CPH – Communications Specialist, Center for Healthy Environments and Communities (CHEC), University of Pittsburgh Graduate School of Public Health (GSPH); and Doctorate of Public Health (DrPH) Student, GSPH

If done improperly (or in excess), shale gas drilling has the potential to contaminate ambient air, surface water, drinking water, and/or ground water. A healthy agricultural system relies upon all of those media in varying degrees.On any given day, I receive roughly 50 emails from people concerned about the effects of natural gas drilling. Check out this document as an example. The topics of conversation are incredibly diverse, and yet the discussion surrounding the effects that drilling may have on our local farms is occurring more and more frequently. One of the reasons for this ‘boom’ in concern about our farms, in my opinion, is that the scientific evidence that connects drilling and hydraulic fracturing to the potential contamination of the food supply is lacking – while the anecdotal evidence is not.

As a result, people have even begun to compile ‘evidence’ suggesting that drilling has affected local agriculture, or will. I believe this is a research issue of great importance, and would welcome suggestions of additional resources (either pro or con) from readers. What are the concerns or questions that people have, you might ask? In a very simplified nutshell:

  • How is the health of farm animals affected by industrial processes occurring nearby? (e.g. by accidentally drinking frac pond fluids or by the stress caused by noise pollution)
  • How will shale gas drilling and forced pooling affect farmers who are applying for or trying to keep their organic farm certifications?
  • Do the communities burdened with gas drilling truly ‘reap’ the rewards?
  • Will the royalties some farmers receive cause them to produce more or less food on their property? And as a result, will access to local and fresh foods improve or decline? (Of the many benefits, access to local, fresh foods improves health by minimizing truck traffic used to ship the products, reducing farming’s carbon footprint – which affects climate change, and providing access to seasonal foods so that consumers do not rely upon packaged, nutritionally deficient food.)
We are just beginning to understand the breadth and depth of this issue. Unfortunately, some effects caused by events today may not surface for years to come. That is a major challenge to epidemiology. We at CHEC, including many other organizations across the Marcellus Shale region, are working to conduct baseline and field research, identify areas of key concern, and prevent negative health and environmental consequences to the highest degree possible. If you are interested in learning more, please email us at chec@pitt.edu.Below is one snapshot created using FracTracker’s DataTool that highlights some of the issues raised by this new industry – and how it may affect our agricultural system:

Working with this map:

  • Minimize the legend by clicking on the button that looks like a compass.
  • Use the magnifying glasses on the left side of the gray toolbar to zoom in and out of the map.
  • You can pan the map to different regions by clicking on the image and dragging your cursor.
  • The “i” on the toolbar allows you to inspect a record (dot or colored area).
  • You can change the background of the map to show roads or a Google Earth view using the three boxes on the right side of the toolbar.
  • Clicking on the button with the arrows on the right-most edge of the toolbar will take you into FracTracker’s DataTool so that you can do more with the map, including share it!

Additional Resources

Vulnerable Populations and the Shale Gas Boom

What is a vulnerable population? For a term used so often, a clear definition from an authoritative source is surprisingly hard to come by. For example, the term has over 2.5 million Google hits, but no Wikipedia page. The National Institute of Health has almost 5,000 references, but the handful of pages that I looked at assumed the reader already knew the definition. In a sense, of course, it is fairly self-explanatory. The UCSF Center for Vulnerable Populations(CVP) tells us that they serve:

…populations for whom social conditions often conspire to both promote various chronic diseases and make their management more challenging.


OK, that makes sense, but from the perspective of someone trying to map the effects of the natural gas industry on vulnerable populations, the term is still hopelessly vague. Who exactly are we talking about, and where do we find them?

There are probably many groups that would qualify as a vulnerable population, but for this analysis, I have included hospitals and schools as a place to start, because those are the places where those who are already sick and children congregate, respectively (1). These groups unquestionably apply to the CVP definition, above.


Vulnerable populations and the Marcellus Shale gas industry. Click on the tabs with the gray compass rose and double carat (^) to hide those menus. Click on the “i” button and then one of the map icons for more information.

There’s a lot of information on that map, and, frankly, it is difficult to determine the proximity of problematic wells to these centers of vulnerable populations at this scale. For this reason, CHEC Director Dr. Volz made a series of regional snapshots, which can be found here.


  1. A fuller list might include parks, daycare facilities, nursing care facilities, etc.

Wells in Quebec Along the St. Lawrence

Wells along the St. Lawrence River in Quebec, Canada. Please click the map for a larger, dynamic view.
The United States isn’t the only place where the gas drilling industry is adversely affecting the environment. I have recently uploaded a dataset from Quebec’s Bureau d’audiences publiques sur l’environnement, which includes over 600 wells, including 31 which have recently been inspected.

The CBC has correctly noted that 19 of these inspected wells–more than half–were shown to be have natural gas emissions, which is a violation in Quebec for wells that are supposed to be temporarily capped.

Even though the 31 inspected wells is a small sample size, there were other problems.

[Edit – Map removed; URL expired]

Problems identified with inspected wells along the St. Lawrence River in Quebec. Click the “i” and then click on one of the map icons for more information.

In fact, of the 31 wells, there were only three that didn’t have any reported problems at all (1). While this report doesn’t provide a lot of detail on these violations, repeated violations such as, “bolted joints in water” or , “no surface casing” makes it seem like either the drilling operators don’t care about the law, or they actually don’t have someone on site who knows what is permissible in the area that they are drilling in.

With almost every well having a violation and some having more than one, the violations per well in Quebec seem roughly in line with the 0.96 violations per Marcellus well in Pennsylvania.

Although many of the wells in this report are quite old, the natural gas industry is starting to accelerate their efforts there as Canada begins to explore the Utica shale.

  1. One of those wells erroneously appears to be in Maine, an error that probably occurred on my end when I converted from one coordinate system to another.  I will try to address that problem shortly.

The Utica Shale

The Marcellus and Utica Shale Gas Plays (small)
The Marcellus and Utica Shale Gas Plays. Please click the image for a larger, zoomable view.

By now, most everyone in the Mid-Atlantic states is aware of the gas-rich geologic formation known as the Marcellus Shale.  After all, it has led to thousands of productive (and often problematic) gas wells in Pennsylvania and West Virgina, and has had some activity in New York, Ohio, and Virginia as well. Compared to other major shale gas plays such as the Barnett in Texas and the Fayetteville in Arkansas, the Marcellus covers a huge area, and several million people live right on top of it. Over the past several years, the Marcellus Shale has become big news, but there is another shale gas play in the area that is even bigger–the Utica Shale. All the gas industry has to do to get there is drill a little deeper.

Since the Marcellus is more accessible, it has rightly received much of the early attention, but the industry has already been looking ahead to the next shale gas “boom” for some time, as is evidenced by this 2002 report from New York.

And in Quebec (1), drilling in the Utica Shale has already begun. So, too, have the problems. This CBC News article reports that 19 of the 31 exploratory wells inspected by Quebec’s Ministry of Natural Resources were leaking natural gas. That ministry report is available here, in French.

This impact is really just the tip of the iceberg for the Utica Shale. After all, the formation is underneath seven US states and two Canadian provinces. But since, like the Marcellus Shale, the Utica requires hydraulic fracturing and each well produces millions of gallons of waste water, the entire effect of the future Utica Shale natural gas industry will be huge.


The Utica Shale and Major US Hydrologic Units. Please click on the gray compass rose to see the full extent.

The implications of this map are significant. Considering that pollutants flow downstream with the water, one can see how discharges in the Delaware River Basin in New York could affect municipal water sources in New Jersey, and how discharges in Ohio could have a similar impact in Indiana. These effects are, of course, already being felt with the efforts in the Marcellus Shale. In the months ahead, as talk of the Utica Shale begins to heat up, keep in mind that the formation is every bit as problematic as–but more widespread than–the Marcellus Shale.

The Utica Shale:  Differing Shapefiles (small)

  1. There are several different boundary files for the Utica Shale available online, all from reputable sources. This map, for example, show an extension of the Utica near the mouth of the St. Lawrence River in Quebec. We know this to be accurate, because the formation is actually being drilled there.

Upcoming Event: “Fracking” Our Food: A New Threat to Sustainable Farming


Speaker: Sandra Steingraber

Speaker: Sandra Steingraber – “Morgan Lecturer”
World Renowned Ecologist, Author and Cancer Survivor
A reception and book signing will follow.

New Date! February 3, 2011 — 7pm
Dickinson College, Anita Tuvin Schlechter Auditorium, Carlisle, PA

In this lecture, Steingraber will explore the tangled relationship between petrochemicals and farming, with a special focus on how the extraction of natural gas from shale bedrock threatens the ecological conditions of our food system.

The event is co-sponsored by the Women’s Center, the Office of Institutional and Diversity Initiatives, and the Departments of Biology, American Studies and Environmental Studies.

Biography (provided by the speaker)

A world renowned ecologist, Sandra Steingraber is an expert on the links between cancer and the environment; reforming chemical policy and contamination without consent.

Ecologist, author, and cancer survivor, Sandra Steingraber, Ph.D. is an internationally recognized expert on the environmental links to cancer and human health. Steingraber’s highly acclaimed book, Living Downstream: An Ecologist’s Personal Investigation of Cancer and the Environment presents cancer as a human rights issue. Originally published in 1997, it was the first to bring together data on toxic releases with data from U.S. cancer registries. Read more.

The Clarke Forum’s Annual Theme

Each year The Clarke Forum devotes a major portion of its resources to activities organized around an annual theme. All members of the Dickinson community, including students, are invited to propose topics for annual themes. Annual themes have included: Democratization, Race & Ethnicity, The Politics of Identity, Environmental Sustainability, Citizenship, Corporations & Globalization, War, Crossing Borders, For Richer or for Poorer: Globalization under Attack, Religion and Political Power, Energy, A Gendered World and Human Rights. The theme for 2010-11 is Thought for Food.

Click here for more information.

Talisman and Chief Fined by DEP


who-got-fined

In response to separate incidents, the Pennsylvania Department of Environmental Protection (DEP) issued fines to two of the larger natural gas companies in the Commonwealth: Talisman Energy USA, Inc. and a subsidiary of Chief Oil and Gas.

Talisman’s $24,608 fine was announced on January 6, 2011 in reaction to a large diesel spill at a Marcellus Shale site. According to the DEP, the March 2010 spill contaminated 3,800 tons of soil and 132,000 gallons of water.

Chief Gathering LLC, a subsidiary of Chief Oil and Gas, was fined a $34,000 for illegally discharging hydrostatic water on August 11, 2010. According to the DEP report, hydrostatic water is used to test for leaks in gas pipelines before they are used for gas. There were five related violations with the incident, including:

  • Failure to minimize the flow rate from the discharge point and allowing the formation of a 150-foot erosion channel
  • Failure to submit accurate, detailed Notice of Intent project information
  • Discharging hydrostatic test water with a total chlorine residual greater than 0.05 parts per million
  • Allowing an unknown industrial waste to co-mingle in five storage tanks with the hydrostatic test water, which was subsequently discharged
  • A failure to monitor the discharge for the specified effluent parameters at the minimum frequency required.

In my earlier analysis of violations per drilling operator, both of these companies were fairly high in terms of violations per well, but relatively low in terms of violations per million cubic feet of natural gas produced.

From fractracker

Violations per Marcellus Shale gas well, 1-1-07 to 9-30-10.

From fractracker

Violations per million cubic feet (MMcf) of natural gas produced, All violations are from 1-1-07 to 9-30-10, while all production values are from 7-1-09 to 6-30-10.