Resistance Mounts to Northeast Energy Direct Pipeline Across MA and NH
By Karen Edelstein, NY Program Coordinator
As the pressure to move domestic natural gas to market from sources in Pennsylvania and beyond, residents in Massachusetts have been learning about a planned project that would cross the northern portion of the state.
Gas infrastructure build-out on the radar
The proposed Kinder Morgan/Tennessee Gas Pipeline Expansion, known as the “Berkshire Pipeline,” or more recently as “Northeast Energy Direct,” would link existing pipeline infrastructure near the New York-Massachusetts border and Dracut, MA, north of Boston. TX-based Tennessee Gas Pipeline Co. says that the 250-mile-long, 36-inch diameter pipeline construction would temporarily create about 3000 jobs, and deliver upwards of 2.2 billion cubic feet per day of natural gas to the northeastern United States. Along the course of the proposed pipeline, 50 miles of the run would use existing Tennessee Gas Pipeline rights-of-way. Nevertheless, 129 miles of the new pipeline would be located in “greenfield” areas: locations that had previously not seen disruption by pipeline infrastructure. If approved, construction would begin in April 2017, with a targeted completion date of November 2018.
In addition to the main pipeline, the project would also include meter stations, at least two new compressor stations in Massachusetts and one in New Hampshire, and modifications to existing pipeline infrastructure. Part of a growing web of pipelines that are moving Marcellus Shale and other gas across the continent, this project would have further connections to the Spectra Energy’s Maritimes and Northeast Pipeline that goes through Maine to the Canadian Maritime provinces, to terminals on the Atlantic coast. In addition, six lateral lines off the main pipeline include:
- Nashua Lateral (Pepperell, MA into Hollis, NH)
- Worcester Lateral
- Pittsfield Lateral
- Haverhill Lateral
- Fitchburg Lateral Extension
- Lynnfield Lateral
Municipalities React, Resistance Mounts
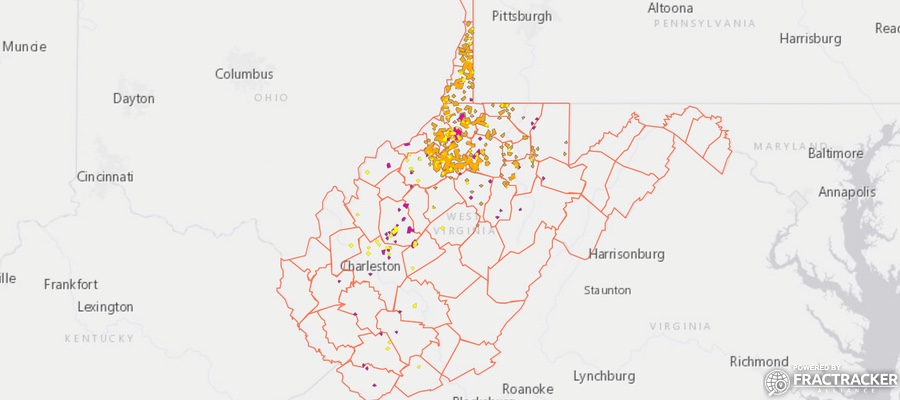
The plan was announced in late January 2014. Despite the endorsements of governors in six states in the Northeast to increase the region’s supply of natural gas, more than three dozen Massachusetts towns in the path of the pipeline have passed resolutions opposing the project (map below). After the December 8, 2014 release of a substantially revised route that would run 71 miles of the pipeline through New Hampshire rather than northern Massachusetts, Granite State municipalities have also raised their voices in opposition. Residents have cited concerns about the accidental releases of gas or chemicals used in during hydraulic fracturing in general, as well as the direct impacts that the pipeline would have on sensitive wetlands, conservation lands, state parks, private properties, and other critical habitats in Massachusetts, including crossing under or over the Connecticut River. We’ve also included point locations of federally designated National Wetlands Inventory sites on or adjacent to the current and newly-described pipeline routes, as well as other environmental assets such as waterways, lakes, state parks and forest lands.
Proposed Pipeline Paths and Opposition Resolutions
For a full-screen view of this map, with a legend, click here.
Currently, approximately 37% of residents contacted by Tennessee Gas for the pipeline rights-of-way have agreed to surveys of their lands. Massachusetts towns likely to be in the path of the pipeline include Richmond, Lenox, Pittsfield, and Dalton. In addition, Hancock, Hinsdale, Peru, Savoy, Stockbridge, Washington, West Stockbridge and Windsor counties are expected to be in the path.
According to the US Energy Information Administration (EIA), 50% of New England’s electric power supply comes from natural gas, with a mere 9.3% sourced from renewable resources. Opponents of the project, such as the citizen group No Fracked Gas in Mass, are pushing for more resources and policy-planning to focus on alternative, renewable energy, rather than enhancing fossil fuel dependencies.
Additional concern has come from the Massachusetts Land Trust Coalition (MLTC). MLTC sent a letter to Governor Deval Patrick expressing their alarm that while Tennessee Gas has asserted that they will be using existing gas pipeline rights-of-way, landowners across the northern tier of Massachusetts have received letters from the gas company asking for permission to use their land. Were the pipeline to go this route, MLTC says, it would also run directly through public- and privately-owned stretches of conservation land.
In early August 2014, Massachusetts Governor Deval Patrick indicated to opponents of the pipeline his growing skepticism about the plan. A few days later, the New England States Committee on Electricity filed for an extension of a schedule looking at a proposal that would levy new tariffs on electric customers in order to finance projects such as this pipeline.
Additional Resources
- Burden of Proof: The case against the proposed Northeast Energy Direct (NED) fracked gas pipeline
- Berkshire County Fights Pipeline Proposal
- Proposed Pipeline to Cross Northern MA
- List of MA Resolutions
- Information on the proposed pipeline’s impact in New Hampshire
- Second Version of Resource Report (reroute through New Hampshire), December 8, 2014
NOTE: This article was updated on December 27, 2014, to include information about the revised pipeline route that we were not aware of when this article was originally released earlier in the month.


 Ted Auch, FracTracker Alliance, 2024.