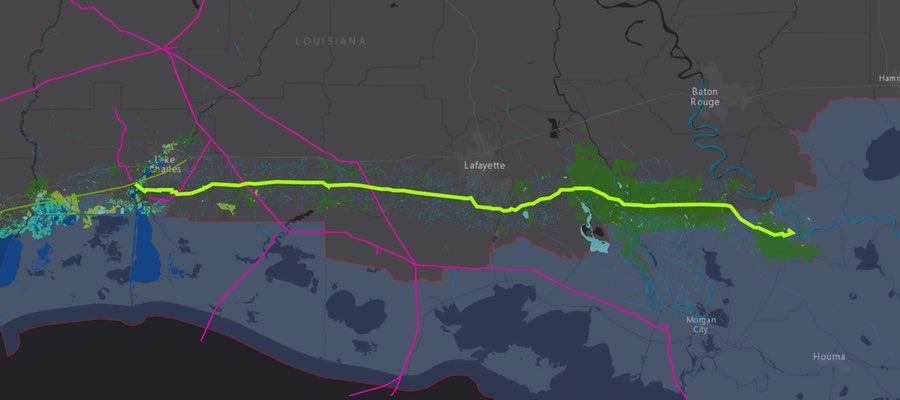
The 30-inch Bayou Bridge Pipeline began operations in April of 2016, with a short leg of pipeline that ran from Nederland, Texas to refineries in Lake Charles, Louisiana. But this 60-mile long pipeline, operated by Sunoco Logistics Partners, was just the first step in a much lengthier, and more controversial, 24-inch diameter pipeline project (jointly owned by Sunoco Logistics Partners, as well as Phillips 66 Partners and Energy Transfer Partners). Nonetheless, Bayou Bridge Pipeline, LLC argues that transport of crude oil by pipeline rather than by tanker or train, is the safest transportation option, as they continue to advocate and justify more pipeline construction in the name of “energy independence.” They compare its necessity to that of FedEx, a mere “delivery system”—one that would carry 280,000 barrels of light or heavy crude across the Acadiana terrain. The company building the pipeline, in fact, distances itself from problems that could result after oil starts flowing:
The pipeline is merely a delivery system, similar to FedEx, to help fill a need that already exists to ship the crude to refiners and market. We do not own the crude in the pipeline,” Alexis Daniel, of Granado Communications Group, a public relations firm in Dallas, wrote in an email response to questions posed to Energy Transfer Partners. Source
Developers hope that second phase of the proposed Bayou Bridge Pipeline will be put into operation during the second half of 2017. It would run 162 miles from Lake Charles, LA to refineries in St James, LA. It would cross the 11 Louisiana parishes and over 700 acres of fragile wetlands, and watersheds that supply drinking water for up to 300,000 people. Pump stations are planned for Jefferson Davis and St. Martin parishes. St. James is located on the western bank of the Mississippi River, about 50 miles upstream of New Orleans. In addition, the proposed pipeline crosses the state-designated Coastal Zone Boundary, an area targeted by Louisiana for special consideration relating to ecological and cultural sustainability.
Zoom in closer to the area around the Bayou Bridge Pipeline, and the National Wetlands Inventory data should appear. Use the “Bookmarks” tab to zoom in close to the refinery sites, and also to zoom back out to the full extent of the proposed Bayou Bridge Pipeline.
What’s the connection to the DAPL?
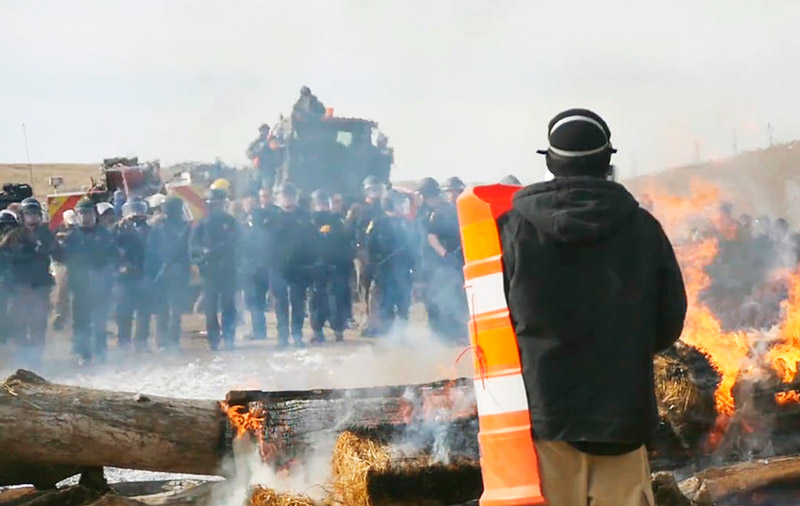
The 2010 BP Gulf oil spill resulted in $18 billion in settlements and penalties. With protests in the news about the impacts the Dakota Access Pipeline (DAPL) could pose to drinking water for the Standing Rock Sioux Reservation should another oil spill occur along the Missouri River, it’s no surprise that environmentalists are also calling for an environmental impact statement about the proposed extension of the Bayou Bridge Pipeline.
Acadiana is already criss-crossed by a dense network of pipelines leading to Gulf Coast refineries. Nonetheless, the process of building the proposed Bayou Bridge pipeline, the Atchafalaya Basin, a major watershed of the Gulf of Mexico, will see additional and significant impacts. Even if the construction process happens without a hitch, 77 acres of wetlands would be permanently affected, and 177 acres would be temporarily affected, along with the wildlife and aquatic species that live there. Within a 5-mile buffer area of the pipeline, National Wetlands Inventory has mapped over 600 square miles of forested wetlands, nearly 300 square miles of estuarine wetlands, and 63 square miles of freshwater emergent wetlands. Essential ecosystem services that the wetlands provide, absorbing floodwaters, could be compromised, leading to increased erosion and sedimentation downstream. Impacts to these wetlands could be greatly magnified into the already environmentally stressed Gulf.
The connection between DAPL and Bayou Bridge is both figurative and literal. Like most new pipelines, concerns about spills loom large in the minds of many. A new pipeline represents more money that is not being directed toward clean energy alternatives.
Energy Transfer Partners, the same company building DAPL, is also building the Bayou Bridge, which the final leg of the Dakota Access Pipeline, 1300 miles to the north. The two pipelines would be connected by a 700+-mile-long stretch of Energy Transfer Partner’s 30-inch Trunkline. This pipeline, which has been a gas transmission line, was proposed in 2012 for conversion from gas to crude transport. The project was cancelled in 2014, and reworked to use 678 miles of the original Trunkline, and also add 66 miles of new pipeline. When it is online, the flow direction of the Trunkline pipeline would reversed to accommodate the south-flowing crude.
Other unanticipated impacts
Interestingly, if crude oil transport to Gulf Coast refineries is diverted to pipelines rather than traditional rail or barge transport, some industry analysts predict that transportation using those modes of conveyance will shift more to the Atlantic and Pacific coasts.
A chance for public input
Environmental groups, including a coalition the comprises the Sierra Club, the Gulf Restoration Network, and the Louisiana Bucket Brigade, the Atchafalaya Basinkeeper, as well as concerned citizens, and landowners (some of whom already have multiple pipelines crossing their properties) are making their resistance to the pipeline heard, loud and clear about the need for a full environmental impact statement that will address the cumulative and indirect impacts of the project.
Note
In response to public outcry, the Louisiana Department of Environmental Quality has agreed to hold a public hearing about the Bayou Bridge Pipeline extension. The meeting will take place at 6 p.m. on January 12 in the Oliver Pollock Room of the Galvez Building, 602 North 5th St. in Baton Rouge.
Update, 6 February 2017. Here’s an article that features information about the January 12 public meeting, which was packed to capacity.
By Karen Edelstein, Eastern Program Coordinator, FracTracker Alliance
https://www.fractracker.org/a5ej20sjfwe/wp-content/uploads/2017/01/Louisiana-Bayou-Pipeline-Feature.jpg400900Karen Edelsteinhttps://www.fractracker.org/a5ej20sjfwe/wp-content/uploads/2025/09/2025-Wordmark-Logo.pngKaren Edelstein2017-01-03 16:20:392023-05-12 10:47:38Pipeline Under Debate in Louisiana Bayou
By Kyle Ferrar, Western Program Coordinator, FracTracker Alliance
Eliza Czolowski, Program Associate, PSE Healthy Energy
Since April 2016, demonstrators in North Dakota have been protesting a section of the Dakota Access Pipeline (DAPL) being built by Dakota Access LLC, a construction subsidiary of Energy Transfer Partners LP. The proposed pipeline passes just 1.5 miles north of the Standing Rock Sioux Tribal Lands, where it is planned to cross Lake Oahe, the largest Army Corps of Engineers reservoir created on the Missouri River. The tribe argues that the project will not only threaten their environmental and economic well-being, but will also cut through land that is sacred.
Given how quickly circumstances have changed on the ground, we have received numerous requests to post an overview on the issue. This article examines the technical aspects of the DAPL proposal and details the current status of protests at Standing Rock. It includes a discussion of what the Army Corps’ recent denial of DAPL’s permits means for the project as well as looks towards the impacts of incoming Trump administration. We have also created the below map to contextualize DAPL and protest activities that have occurred at Standing Rock.
DAPL is a $3.78 billion dollar project that was initially slated for completion on January 1, 2017. The DAPL is a joint venture of Phillips 66, Sunoco Logistics, and other smaller fossil fuel companies including Marathon Petroleum Corporation, and Enbridge Energy Partners. Numerous banks and investment firms are supporting the project and financing the related infrastructure growth, including Citi Bank, JP Morgan Chase, HSBC, PNC, Community Trust, Bank of America, Morgan Stanley, ING, Tokyo-Mitsubishi, Goldman Sachs, Wells Fargo, SunTrust, Us Bank, UBS, Compass and others.
Its route travels from Northwestern North Dakota, south of Bismarck, and crosses the waterway made up of the Missouri River and Lake Oahe just upriver of the Standing Rock Sioux Tribal Area. From North Dakota the pipeline continues 1,172 miles to an oil tank farm in Pakota, Illinois. DAPL would carry 470,000 barrels per day (75,000 m3/d) of Bakken crude oil with a maximum capacity up to 570,000 barrels per day. That’s the CO2 equivalent of 30 average sized coal fired power plants.
As documented by the NY Times map, in addition to the Missouri River and Lake Oahe, the pipeline crosses 22 other waterways that also require the pipeline to be drilled deep under these bodies of water. But Standing Rock portion is the only section disputed and as of yet unfinished. Now the pipeline project, known by the protesters as “the black snake,” is over 95% complete, despite having no official easement to cross the body of water created by the Missouri River and Lake Oahe. The easement is required for any domestic pipeline to cross a major waterway and because the land on either side of the Army Corps Lake Oahe project is managed by the Army Corps (shown in the protest map). An easement would allow Dakota Access LLC to drill a tunnel for the pipeline under the federally owned lands, including the lake and river.
Safety & Environmental Racism
Proponents of the project tout the opinion that pipelines are the safest method of moving oil large distances. Trucking oil in tankers on highways has the highest accident and spill rates, whereas moving oil by railways presents a major explosive hazard when incidents do occur. Pipeline spills are therefore considered the “safe” alternative. On November 11, Kelcy Warren was interviewed on CBS News, claiming Dakota Access, LLC takes every precaution to reduce leaks and that the likelihood of a leak is highly unlikely. The problem with comparing the risk for each of these transportation methods is that rates of incidence are the only comparison. The resulting hazard and impact is ignored. When pipelines rupture, they present a much larger hazard than trucks and trains. Large volumes of spilled oil result in much greater water and soil contamination.
We know that pipelines do rupture, and quite often. An analysis by the U.S. DOT Pipeline and Hazardous Materials Safety Administration in 2012 shows that there have been 201 major incidents (with volumes over 1,000 gallons) related to liquid leaks in the U.S. over the last ten years that were reported to the Department of Transportation. The “average” pipeline therefore has a 57% probability of experiencing a major leak, with consequences over the $1 million range, in a ten-year period. FracTracker’s recent analysis of PHMSA data shows the systemic issue of pipeline spills: there have been 4,215 pipeline spill incidents just since 2010 resulting in 100 reported fatalities, 470 injuries, and property damage exceeding $3.4 billion! The recent (December 12) spill of 176,000 gallons of crude oil into a stream just 150 miles from the Standing Rock protest site highlights the Tribes’ concerns.
A previously proposed route for the DAPL would have put Bismarck—a city that is 92% white—just downriver of its Missouri River crossing. This initial route was rejected due to its potential threat to Bismarck’s water supply, according to the Army Corps. In addition to being located upriver of Bismarck’s water intake, the route would have been 11 miles longer and would have passed through “wellhead source water protection” areas that are avoided to protect municipal water supply wells. Passing through this “high consequence area” would have required further actions and additional safety measures on the part of Dakota Access LLC. The route would also have been more difficult to stay at least 500 feet away from homes, as required by the North Dakota Public Service Commission. The route was changed and pushed as close to Sioux County as possible, the location of the Standing Rock Indian Reservation.
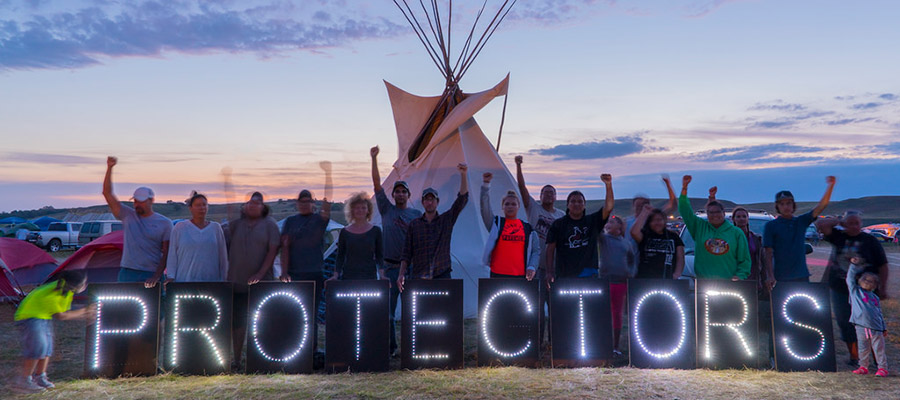
Protests: The Water Protectors
The Standing Rock Sioux Tribe has taken an active stance against Bakken Oil Development in the past. In 2007, the Reservation passed a resolution to prevent any oil and gas development or pipelines on the Tribal Lands. However, deep concerns about the safety of DAPL led protesters to begin demonstrations at Standing Rock in April, 2016. The Standing Rock Sioux Tribe then sued the Army Corps in July, after the pipeline was granted most of the final permits over objections of three other federal agencies. Construction of it, they say, will “destroy our burial sites, prayer sites and culturally significant artifacts.” A timeline of The Standing Rock Sioux Tribe’s litigation addressing DAPL through this period can be found on the EARTHJUSTICE website.
In August, a group organized on the Standing Rock Indian Reservation called ReZpect Our Water brought a petition to the Army Corps in Washington, D.C. stating that DAPL interferes with their ancestral land and water rights. The Tribe sued for an injunction citing the endangerment of water and soil, cultural resources, and the improper use of eminent domain. The suit argued that the pipeline presents a risk to Sioux Tribe communities who live near or downstream of the pipeline. The Missouri River is the main water source for the Standing Rock Sioux Tribe. In September, members of the Standing Rock Sioux tribe in North Dakota finally made headlines.
Federal Injunction
On September 9, District Judge James Boasberg denied the Standing Rock Sioux Tribes preliminary injunction request to prevent the Army Corps from granting the easement. The Judge ordered Dakota Access to stop work only on the section of pipeline nearest the Missouri river until the Army Corps granted the crossing easement. The excavation of Standing Rock burial grounds and other sacred sites, where direct action demonstrators were clashing with Dakota Access security and guard dogs, was allowed to continue. Later that same day, a joint statement was released by the U.S. Department of Justice, the Department of the Interior, and the U.S. Army:
“We request that the pipeline company voluntarily pause all construction activity within 20 miles east or west of Lake Oahe.”
In the map above the 20-mile buffer zone is shown in light green. Regardless of the request from the three federal agencies to pause construction, Dakota Access’s parent company Energy Transfer Partners LP ignored requests to voluntarily halt construction. Dakota Access LLC has also disregarded the instructions of the federal judge. The Army Corps declared Dakota Access LLC would not receive the easement required to cross the waterway until after 2016, but that has not stopped the company from pushing forward without the necessary permits. The pipeline has been built across all of Cannonball Ranch right up to Lake Oahe and the Missouri River, which can be seen in the map above and in drone footage taken November 2, 2016 showing the well pad for the drill rig has been built.
On November 4 the Army Corps requested Dakota Access LLC voluntarily halt construction for 30 days; then on November 8 (Election Day), Dakota Access ignored the request and announced they would begin horizontally drilling under the waterway within weeks. On November 14 Dakota Access filed a lawsuit against the Army Corps arguing that permits are not legally required. Later that day, the Army Corps responded with a statement that said any construction on or under Corps land bordering Lake Oahe cannot occur because the Army has not made a final decision on whether to grant an easement. In the issued statement, Assistant Secretary of the Army Jo-Ellen Darcy said “in light of the history of the Great Sioux Nation’s dispossession of lands [and] the importance of Lake Oahe to the Tribe,” the Standing Rock Sioux tribe would be consulted to help develop a timetable for future construction plans. The Army Corps has since denied the easement entirely.
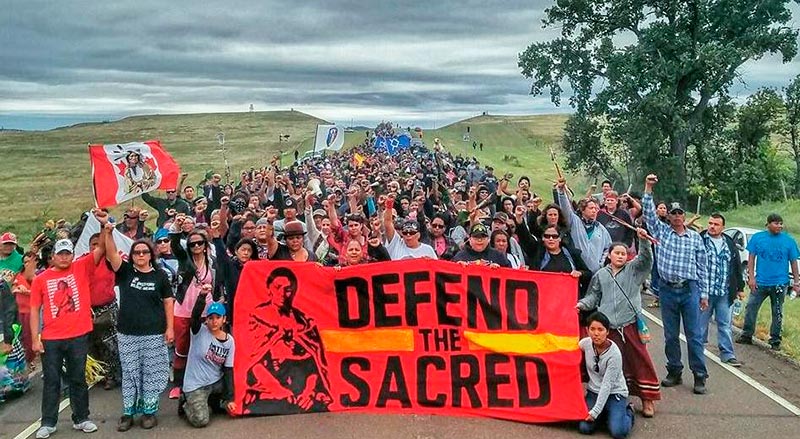
Violence Against Protesters
Law enforcement has used physical violence to disrupt demonstrations on public lands and to prevent direct action activities as protesters aim to shut down construction on private land held by Energy Transfer Partners LP. Since September 4, law enforcement agencies led by the Morton County Sheriff’s Department have maintained jurisdiction over the protests. Officers from other counties and states have also been brought in to assist. Morton County and the State of North Dakota do not have the jurisdiction to evict protesters from the camps located on Army Corps land. Well over 500 activists have been arrested.
The majority of clashes with law enforcement have occurred on the roadways exiting the Army Corps lands, or at the access points to the privately owned Cannonball Ranch (shown on the map). Morton County has spent more than $8 million keeping direct action protesters from shutting down excavation and construction activities along the path of the pipeline. Meanwhile, the state of North Dakota has spent over $10 million on additional law enforcement officials to provide assistance to Morton County.
The first violent confrontation occurred on September 3 after Dakota Access bulldozed an area of Cannonball Ranch identified by the Tribe as a sacred site hosting burial grounds. At that time, the site was actively being contested in court and rulings still had not been made. The Tribe was seeking a restraining order, known as a “preliminary injunction” to protect their cultural heritage. Direct action demonstrators put themselves in the way of bulldozers to stop the destructive construction. In response, Dakota Access LLC security personnel assaulted protesters with pepper spray and attack dogs. The encounter was documented by Democracy Now reporter Amy Goodman.
October 27, the Morton County Sheriff’s Department reinforced with 300 police from neighboring counties and states, raided the frontline camp site making mass arrests. In response, demonstrators reinforced a blockade of the 1806 bridge, shown in the map above. The most violent clash was witnessed on public lands on November 20, 2016 at this bridge, which demarcates Army Corps land. The Police forces’ use of “non-lethal” bean bag rounds, rubber bullets, tear gas, pepper spray, water hoses, LRAD, and explosive flash grenades on peaceful demonstrators has been criticized by many groups. Fire hoses were used on protesters in freezing conditions resulting in dozens of demonstrators needing treatment for hypothermia. In total 300 people were injured according to a release from the standing rock medic and healer council.
Most recently, the Army Corps has targeted the Standing Rock Demonstration by determining that it is no longer safe to stay at the Sacred Stone and Oceti Sakowin camps located on Army Corps property. North Dakota Governor Jack Dalrymple has frequently blasted the Army Corps for not removing the protesters.
As of December 5th, federal authorities consider the protesters to be trespassing on federal lands, leaving protesters vulnerable to various citations and possible arrest. The Army Corps has also said that emergency services may no longer be provided in the evacuation area. The Army Corps has jurisdiction on Army Corps lands, and only federal authorities can remove the protesters from federal lands. There are now more than 5,000 activists demonstrating at Standing Rock, and an additional 2,000 U.S. veterans joined the protest this past week for an action of solidarity. Nevertheless, U.S. authorities have said that there are no plans to forcibly remove activists, despite telling them to leave.
Victory and an Uncertain Future
Perhaps as a result of this mass outcry, the Army Corps announced on December 4th—only a day before trespassing claims would be imposed—that Dakota Access LLC’s permit application to cross under the Missouri River and Lake Oahe had been denied. Jo-Ellen Darcy, the Army’s Assistant Secretary for Civil Works, announced:
“Although we have had continuing discussion and exchanges of new information with the Standing Rock Sioux and Dakota Access, it’s clear that there’s more work to do…The best way to complete that work responsibly and expeditiously is to explore alternate routes for the pipeline crossing.”
To determine alternate routes, the Army Corps has announced it will undertake an environmental impact statement which could take years to complete. While this is a major victory for the “water protectors” demonstrating at Standing Rock, it is not a complete victory. Following the Army Corps’ announcement, the two main pipeline investors, Energy Transfer Partners LP and Sunoco Logistics, responded that they:
“…are fully committed to ensuring that this vital project is brought to completion and fully expect to complete construction of the pipeline without any additional rerouting in and around Lake Oahe. Nothing this Administration has done today changes that in any way.”
In fact, prior to the Army Corps denying the easement, numerous democrats in congress called for President Obama to shut down the pipeline. While President Obama has not heeded these calls to shut down the project entirely, he also has not given the green light for the project either. Instead the President stated that the situation needed to be handled carefully and urged the Army Corps to consider rerouting the pipeline. “We’re monitoring this closely and I think, as a general rule, my view is that there’s a way for us to accommodate sacred lands of Native Americans…. I think right now the Army Corps is examining whether there are ways to reroute this pipeline,” the President said.
The Corps decision to conduct a lengthy environmental impact statement is encouraging but, ultimately, the Trump administration may have the final say on the DAPL easement. President-elect Trump has voiced support for the easement in the past, and on December 5th, just one day following the Army Corps’ decision, Trump spokesman Jason Miller commented:
“That’s something we support construction of, and we will review the full situation in the White House and make an appropriate determination at that time.”
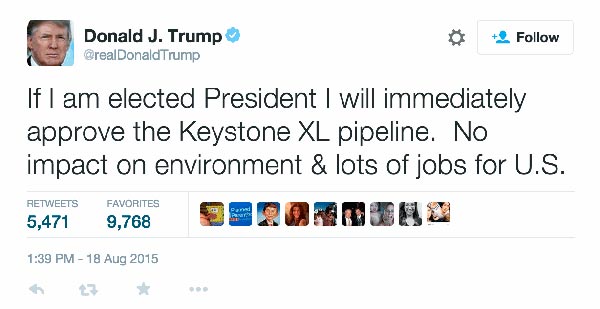
Energy Transfer Partners LP CEO Kelcy Warren donated $103,000 to the Trump campaign and the President-elect has investments in Energy Transfer Partners LP totaling up to $1 million according to campaign financial disclosures. President-elect Trump has made it clear that pipeline projects, specifically the Keystone Access Pipeline rejected by President Obama, will be allowed to move forward along with additional fossil fuel extraction projects.
If the construction company, Dakota Access LLC, continues building the pipeline they are liable to be fined. It is not yet clear whether Dakota Access LLC will “eat” the fine to continue building and drilling, or whether the Army Corps will forcefully stop DAPL. Analysts say the expense of changing the route, such as to the south of the tribal lands, would make the economics of the pipeline a total loss. It is cheaper for Dakota Access LLC to continue to fight the protest despite overwhelming disapproval of the project.
Meanwhile, protestors have refused to leave Standing Rock in fear that the Army Corp will reverse its decision and allow DAPL to proceed, despite requests by the chairman of the Sioux Tribe that demonstrators go home. Many are hopeful that, by stalling the project past January 1st—the deadline by which Energy Transfer Partners LP promised oil companies it would complete construction—the possibility exists that contracts will expire and DAPL loses support from investors.
Other Mapping Resources
This web map shows the current construction progress of the pipeline.
The New York Times website is hosting a map focusing on the many water crossings of the pipeline route.
The Guardian has a static map on their website similar to our interactive map.
by Kirk Jalbert, Manager of Community-Based Research & Engagement with technical assistance from Seth Kovnant
In September, the Pennsylvania Department of Environmental Protection (DEP) rejected a number of permits for wetland crossings and sedimentation control that were required for Sunoco Pipeline’s proposed “Mariner East 2” pipeline. According to Sunoco, the proposed Mariner East 2 is a $2.5 billion, 350-mile-long pipeline that would be one of the largest pipeline construction projects in Pennsylvania’s history.
If built, Mariner East 2 could transport up to 450,000 barrels (18,900,000 gallons) per day of propane, ethane, butane, and other liquefied hydrocarbons from the shale fields of western Pennsylvania to export terminals in Marcus Hook, located just outside Philadelphia. A second proposed pipeline, if constructed, could carry an additional 250,000 barrels (10,500,000 gallons) per day of these same materials. Sunoco submitted revised permit applications to PADEP on Tuesday, December 6th.
The industry often refers to ethane, propane and butane collectively as “natural gas liquids.” They are classified by the federal government as “hazardous, highly volatile liquids,” but that terminology is also misleading. These materials, which have not been transported through densely populated southeast Pennsylvania previously, are liquid only at very high pressure or extremely cold temperatures. At the normal atmospheric conditions experienced outside the pipeline, these materials volatilize into gas which is colorless; odorless; an asphyxiation hazard; heavier than air; and extremely flammable of explosive. This gas can travel downhill and downwind for long distances while remaining combustible. It can collect (and remain for long periods of time) in low-lying areas; and things as ordinary as a cell phone, a doorbell or a light switch are capable of providing an ignition source.
Many who have followed the proposed Mariner East 2 project note that, while much has been written about the likely environmental impacts, insufficient investigation has been conducted into safety risks to those who live, work and attend schools in the proposed pipeline’s path. We address these risks in this article, and, in doing so, emphasize the importance of regulatory agencies allowing public comments on the project’s resubmitted permit applications.
The Inherent Risks of Artificially Liquified Gas
Resident of Pennsylvania do not need to look far for examples of how pipeline accidents pose serious risk. For instance, the 2015 explosion of the Enterprise ATEX (Appalachia to Texas) pipeline near Follansbee, WV, provides a depiction of what a Mariner East 2 pipeline failure could look like. This 20-inch diameter pipeline carrying liquid ethane is similar in many ways to the proposed Mariner East 2. When it ruptured in rural West Virginia, close to the Pennsylvania border, it caused damage in an area that extended 2,000 feet—about ½ square mile—from the place where the pipeline failed.
In another recent instance, the Spectra Energy Texas Eastern methane natural gas pipeline ruptured in Salem, PA, this April as a result of corroded welding. The explosion, seen above (photo by PA NPR State Impact), completely destroyed a house 200ft. away. Another house, 800ft. away, sustained major damage and its owner received 3rd degree burns. These incidents are not unique. FracTracker’s recent analysis found that there have been 4,215 pipeline incidents nation-wide since 2010, resulting in 100 reported fatalities, 470 injuries, and property damage exceeding $3.4 billion (“incident” is an industry term meaning “a pipeline failure or inadvertent release of its contents.” It does not necessarily connote “a minor event”).
Calculating Immediate Ignition Impact Zones
It is difficult to predict the blast radius for materials like ethane, propane and butane. Methane, while highly flammable or explosive, is lighter than air and so tends to disperse upon release into the atmosphere. Highly volatile liquids like ethane, propane and butane, on the other hand, tend to concentrate close to the ground and to spread laterally downwind. A large, dispersed vapor cloud of these materials may quickly spread great distances, even under very light wind conditions. A worst-case scenario would by highly variable since gas migration and dispersion is dependent on topography, leak characteristics, and atmospheric conditions. In this scenario, unignited gas would be allowed to migrate as an unignited vapor cloud for a couple miles before finding an ignition source that causes an explosion that encompasses the entire covered area tracing back to the leak source. Ordinary devices like light switches or cell phones can serve as an ignition source for the entire vapor cloud. One subject matter expert recently testified before a Municipal Zoning Hearing board that damage could be expected at a distance of three miles from the source of a large scale release.
The federal government’s “potential impact radius” (PIR) formula, used for natural gas (methane) isn’t directly applicable because of differences in the characteristics of the material. It may however be possible to quantify an Immediate Ignition Impact Zone. This represents the explosion radius that could occur if ignition occurs BEFORE the gas is able to migrate.
The Pipeline and Hazardous Materials Safety Administration (PHMSA) provides instructions for calculating the PIR of a methane natural gas pipeline. The PIR estimates the range within which a potential failure could have significant impact on people or property. The PIR is established using the combustion energy and pipeline-specific fuel mass of methane to determine a blast radius: PIR = 0.69*sqrt(p*d^2). Where: PIR = Potential Impact Radius (in feet), p = maximum allowable operating pressure (in pounds per square inch), d = nominal pipeline diameter (in inches), and 0.69 is a constant applicable to natural gas
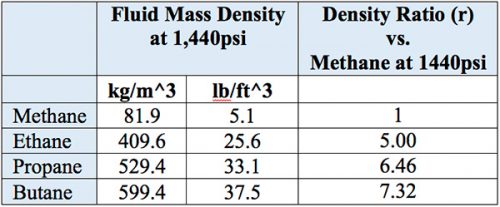
The Texas Eastern pipeline can use the PIR equation as-is since it carries methane natural gas. However, since Mariner East 2 is primarily carrying ethane, propane, and butane NGLs, the equation must be altered. Ethane, propane, butane, and methane have very similar combustion energies (about 50-55 MJ/kg). Therefore, the PIR equation can be updated for each NGL based on the mass density of the flow material as follows: PIR = 0.69*sqrt(r*p*d^2). Where: r = the density ratio of hydrocarbons with similar combustion energy to methane natural gas. At 1,440 psi, methane remains a gas with a mass density 5 times less than liquid ethane at the same pressure:
The methane density relationships for ethane, propane, and butane can be used to calculate an immediate-ignition blast radius for each hydrocarbon product. The below table shows the results assuming a Mariner East 2-sized 20-inch diameter pipe operating at Mariner East 2’s 1,440psi maximum operating pressure:
Using these assumptions, the blast radius can be derived as a function of pressure for each hydrocarbon for the same 20in. diameter pipe:
ME2 Immediate Ignition Blast Radius
Note the sharp increase in blast radius for each natural gas liquid product. The pressure at which this sharp increase occurs corresponds with the critical pressure where each product transitions to a liquid state and becomes significantly denser, and in turn, contains more explosive power. These products will always be operated above their respective critical pressures when in transport, meaning their blast radius will be relatively constant, regardless of operating pressure.
Averaging the “Immediate Ignition Blast Radius” for ethane, propane, and butane gives us a 1,300 ft (about 0.25 mile) potential impact radius. However, we must recognize that this buffer represents a best case scenario in the event of a major pipeline accident.
FracTracker has created a new map of the Mariner East 2 pipeline using a highly-detailed GIS shapefile recently supplied by the DEP. On this map, we identify a 0.5 mile radius “buffer” from Mariner East 2’s proposed route. We then located all public and private schools, environmental justice census tracts, and estimated number of people who live within this buffer in order to get a clearer picture of the pipeline’s hidden risks.
Proposed Mariner East 2 and At-Risk Schools and Populations
In order to estimate the number of people who live within this 0.5 mile radius, we first identified census blocks that intersect the hazardous buffer. Second, we calculated the percentage of that census block’s area that lies within the buffer. Finally, we used the ratio to determine the percentage of the block’s population that lies within the buffer. In total, there are an estimated 105,419 people living within the proposed Mariner East 2’s 0.5 mile radius impact zone. The totals for each of the 17 counties in Mariner East 2’s trajectory can be found in the interactive map. The top five counties with the greatest number of at-risk residents are:
Chester County (31,632 residents in zone)
Delaware County (17,791 residents in zone)
Westmoreland County (11,183 residents in zone)
Cumberland County (10,498 residents in zone)
Berks County (7,644 residents in zone)
Environmental Justice Areas
Environmental justice designations are defined by the DEP as any census tract where 20% or more of the population lives in poverty and/or 30% or more of the population identifies as a minority. These numbers are based on data from the U.S. Census Bureau, last updated in 2010, and by the federal poverty guidelines. Mariner East 2 crosses through four environmental justice areas:
Census Tract 4064.02, Delaware County
Census Tract 125, Cambria County
Census Tract 8026, Westmoreland County
Census Tract 8028, Westmoreland County
DEP policies promise enhanced public participation opportunities in environmental justice communities during permitting processes for large development projects. No additional public participation opportunities were provided to these communities. Furthermore, no public hearings were held whatsoever in Cambria County and Delaware County. The hearing held in Westmoreland County took place in Youngwood, nine miles away from Jeanette. Pipelines are not specified on the “trigger list” that determines what permits receive additional scrutiny, however the policy does allow for “opt-in permits” if the DEP believes they warrant special consideration. One would assume that a proposed pipeline project with the potential to affect the safety of tens of thousands of Pennsylvanians qualifies for additional attention.
At-Risk Schools
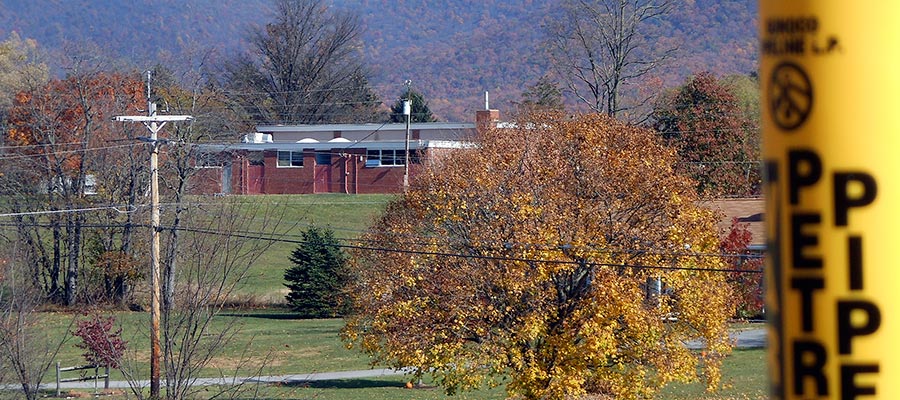
One of the most concerning aspects of our findings is the astounding number of schools in the path of Mariner East 2. Based on data obtained from the U.S. Department of Education on the locations of schools in Pennsylvania, a shocking 23 public (common core) schools and 17 private schools were found within Mariner East 2’s 0.5 mile impact zone. In one instance, a school was discovered to be only 7 feet away from the pipeline’s intended path. Students and staff at these schools have virtually no chance to exercise their only possible response to a large scale release of highly volatile liquids, which is immediate on-foot evacuation.
Middletown High School in Dauphin County in close proximity to ME2
One reason for the high number of at-risk schools is that Mariner East 2 is proposed to roughly follow the same right of way as an older pipeline built in the 1930s (now marketed by Sunoco as “Mariner East 1.”). A great deal of development has occurred since that time, including many new neighborhoods, businesses and public buildings. It is worth noting that the U.S. Department of Education’s data represents the center point of schools. In many cases, we found playgrounds and other school facilities were much closer to Mariner East 2, as can be seen in the above photograph. Also of note is the high percentage of students who qualify for free or reduced lunch programs at these schools, suggesting that many are located in disproportionately poorer communities.
Now that PADEP has received revised permit applications from Sunoco, presumably addressing September’s long list of technical deficiencies, the agency will soon make a decision as to whether or not additional public participation is required before approving the project. Given the findings in our analysis, it should be clear that the public must have an extended opportunity to review and comment on the proposed Mariner East 2. In fact, public participation was extremely helpful to DEP in the initial review process, providing technical and contextual information.
It is, furthermore, imperative that investigations into the potential impacts of Mariner East 2 extend to assess the safety of nearby residents and students, particularly in marginalized communities. Thus far, no indication has been made by the DEP that this will be the case. However, the Pennsylvania Sierra Club has established a petition for residents to voice their desire for a public comment period and additional hearings.
Seth Kovnat is the chief structural engineer for an aerospace engineering firm in Southeastern PA, and regularly consults with regard to the proposed Mariner East 2 pipeline. In November, Seth’s expertise in structural engineering and his extensive knowledge of piping and hazardous materials under pressure were instrumental in providing testimony at a Pennsylvania Senate and House Veterans Affairs and Emergency Preparedness Committee discussion during the Pennsylvania Pipeline Infrastructure Citizens Panel. Seth serves on the board of Middletown Coalition for Community Safety and is a member of the Mariner East 2 Safety Advisory Committee for Middletown Township, PA. He is committed to demonstrating diligence in gathering, truth sourcing, and evaluating technical information in pipeline safety matters in order to provide data driven information-sharing on a community level.
NOTE: This article was modified on 12/9/16 at 4pm to provide additional clarification on how the 1,300ft PIR was calculated, and the map was modified on 11/4/2021 to add the 1,300 ft Thermal Impact Zone Buffer, which was previously mislabeled as the half-mile Buffer
https://www.fractracker.org/a5ej20sjfwe/wp-content/uploads/2016/12/ME2_schools_header.jpg400900FracTracker Alliancehttps://www.fractracker.org/a5ej20sjfwe/wp-content/uploads/2025/09/2025-Wordmark-Logo.pngFracTracker Alliance2016-12-09 08:36:102021-11-04 15:58:45Mariner East 2: At-Risk Schools and Populations
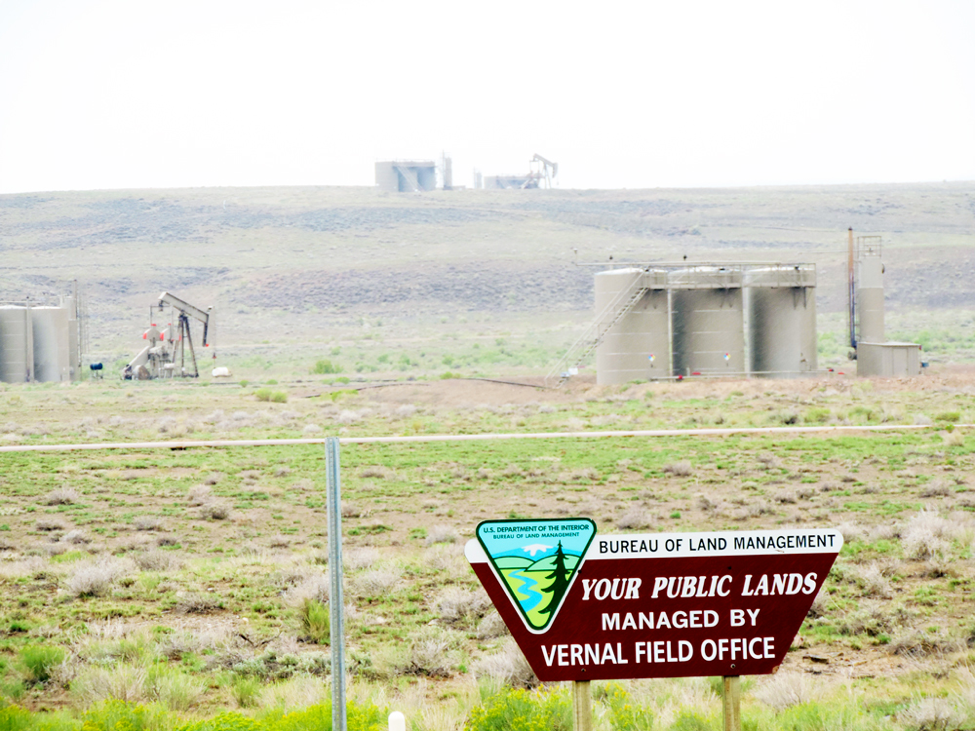
As an American, you are part owner of 640 million acres of our nation’s shared public lands managed by the federal government. And chances are, you’ve enjoyed a few of these lands on family picnics, weekend hikes or summer camping trips. But did you know that some of your lands may also be leading to toxic air pollution and poor health for you or your neighbors, especially in 5 western states that have high oil and gas drilling activity?
A set of new interactive maps created by FracTracker, The Wilderness Society, and partner groups show the threatened populations who live within a half mile of federal oil and gas wells – people who may be breathing in toxic pollution on a regular basis.
Altogether, air pollution from oil and gas development on public lands threatens at least 73,900 people in the 5 western states we examined. The states, all of which are heavy oil and gas leasing areas, include Colorado, New Mexico, North Dakota, Utah and Wyoming.
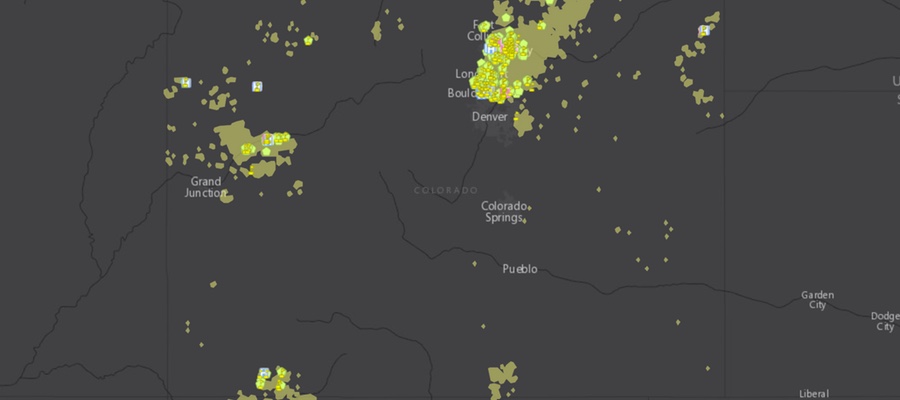
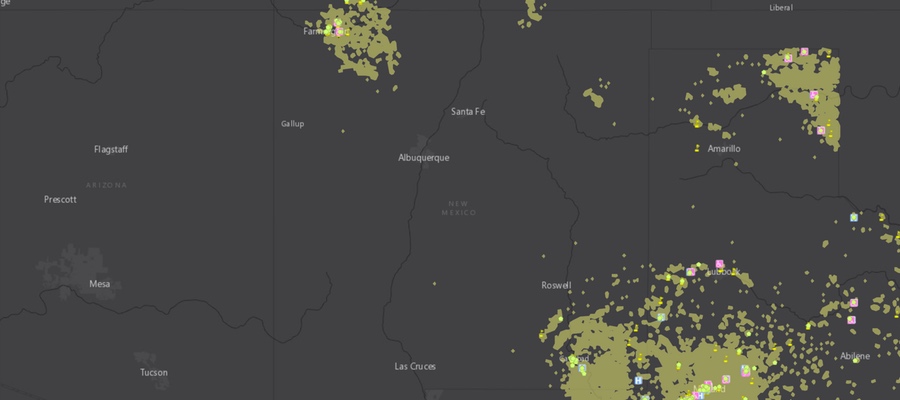
Figure 1. Close up of threat map in Colorado
In each state, the data show populations living near heavy concentrations of wells. For example just northeast of Denver, Colorado, in the heavily populated Weld County, at least 11,000 people are threatened by oil and gas development on public lands (Figure 1).
Western cities, like Farmington, New Mexico; Gillette, Wyoming; and Grand Junction, Colorado are at highest risk of exposure from air pollution. In New Mexico, especially, concentrated oil and gas activity disproportionately affects the disadvantaged and minorities. Many wells can be found near population centers, neighborhoods and even schools.
Colorado: Wells concentrated on Western Slope, Front Range
Note: The threatened population in states are a conservative estimate. It is likely that the numbers affected by air pollution are higher.
In 2014, Colorado became the first state in the nation to try to curb methane pollution from oil and gas operations through comprehensive regulations that included inspections of oil and gas operations and an upgrade in oil and gas infrastructure technology. Colorado’s new regulations are already showing both environmental and financial benefits.
But nearly 16,000 people – the majority living in the northwestern and northeastern part of the state – are still threatened by pollution from oil and gas on public lands.
Many of the people whose health is endangered from pollution are concentrated in the fossil-fuel rich area of the Western Slope, near Grand Junction. In that area, three counties make up 65% of the total area in Colorado threatened by oil and gas development.
In Weld County, just northeast of Denver, more than 11,000 residents are threatened by air pollution from oil and gas production on federal lands. But what’s even more alarming is that five schools are within a half mile radius of wells, putting children at risk on a daily basis of breathing in toxins that are known to increase asthma attacks. Recent studies have shown children miss 500,000 days of school nationally each year due to smog related to oil and gas production.
State regulations in Colorado have helped improve air quality, reduce methane emissions and promote worker care and safety in the past two years, but federal regulations expected by the end of 2016 will have a broader impact by regulating pollution from all states.
New Mexico: Pollution seen from space threatens 50,000 people
With more than 30,000 wells covering 4.6 million acres, New Mexico is one of the top states for oil and gas wells on public lands. Emissions from oil and gas infrastructure in the Four Corners region are so great, they have formed a methane hot spot that has been extensively studied by NASA and is clearly visible from space.
Nearly 50,000 people in northwestern New Mexico – 40% of the population in San Juan County – live within a half mile of a well.
Dangerous emissions from those wells in San Juan County disproportionately affect minorities and disadvantaged populations, with about 20% Hispanic, almost 40% Native American, and over 20% living in poverty.
Another hot spot of oil and activity is in southeastern New Mexico stretching from the lands surrounding Roswell to the southern border with Texas. Wells in this region also cover the lands outside of Carlsbad Caverns National Park, potentially affecting the air quality and visibility for park visitors. Although less densely populated, another 4,000 people in two counties – with around 50% of the population Hispanic – are threatened by toxic air pollution.
Wyoming: Oil and gas emissions add to coal mining pollution
Pollution from oil and gas development in Wyoming, which has about as many wells as New Mexico, is focused in the Powder River Basin. This region in the northeast of the state provides 40% of the coal produced in the United States.
Oil and gas pollution threatens approximately 4,000 people in this region where scarred landscapes and polluted waterways are also prevalent from coal mining.
With the Obama administration’s current pause on federal coal leasing and a review of the federal coal program underway, stopping pollution from oil and gas on public lands in Wyoming would be a major step in achieving climate goals and preserving the health of local communities.
Utah: Air quality far below federal standards
Utah has almost 9,000 active wells on public lands. Oil and gas activity in Utah has created air quality below federal standards in one-third of Utah’s counties, heightening the risk of asthma and respiratory illnesses. Especially in the Uintah Basin in northeastern Utah – where the majority of oil and development occurs – a 2014 NOAA-led study found oil and gas activity can lead to high levels of ozone in the wintertime that exceed federal standards.
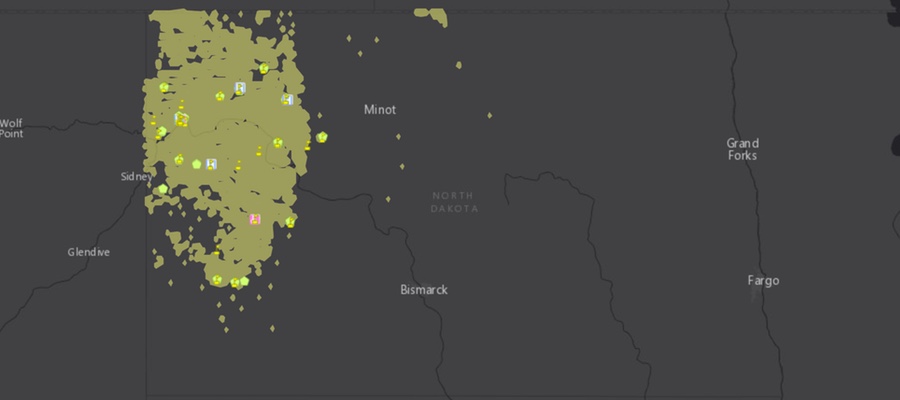
North Dakota: Dark skies threatened by oil and gas activity
The geology of western North Dakota includes the Bakken Formation, one of the largest deposits of oil and gas in the United States. As a result, high oil and gas production occurs on both private and public lands in the western part of the state.
Nearly 650 wells on public lands are clustered together here, directly impacting popular recreational lands like Theodore Roosevelt National Park.
The 70,000-plus-acre park – named after our president who first visited in 1883 and fell in love with the incredible western landscape – is completely surrounded by high oil and gas activity. Although drilling is not allowed in the park, nearby private and public lands are filled with active wells, producing pollution, traffic and noise that can be experienced from the park. Due to its remote location, the park is known for its incredible night sky, but oil and gas development increases air and light pollution, threatening visibility of the Milky Way and other astronomical wonders.
Now that we can see how many thousands of people are threatened by harmful emissions from our public lands, it is more important than ever that we finalize strong federal regulations that will help curb the main pollutant of natural gas – methane – from being leaked, vented, and flared from oil and gas infrastructure on public lands.
Federal oil and gas wells in western states produce unseen pollution that threatens populations at least a half mile away. Photo: WildEarth Guardians, flickr.
We need to clean up our air now
With U.S. public lands accounting for 1/5 of the greenhouse gas footprint in the United States, we need better regulations to reduce polluting methane emissions from the 96,000 active oil and gas wells on public lands.
Right now, the Bureau of Land Management is finalizing federal regulations that are expected by the end of 2016. These regulations are expected to curb emissions from existing sources – wells already in production – that are a significant source of methane pollution on public lands. This is crucial, since by 2018, it is estimated that nearly 90% of methane emissions will come from sources that existed in 2011.
Final regulations from the Bureau of Land Management will also add to other regulations from the EPA and guidance from the Obama administration to modernize energy development on public lands for the benefit of the American people, landscapes and the climate. In the face of a changing climate, we need to continue to monitor fossil fuel development on public lands and continue to push the government towards better protections for land, air, wildlife and local communities.
By The Wilderness Society – The Wilderness Society is the leading conservation organization working to protect wilderness and inspire Americans to care for our wild places. Founded in 1935, and now with more than 700,000 members and supporters, The Wilderness Society has led the effort to permanently protect 109 million acres of wilderness and to ensure sound management of our shared national lands.
https://www.fractracker.org/a5ej20sjfwe/wp-content/uploads/2016/10/ProdPublicLand-Feature.jpg400900Guest Authorhttps://www.fractracker.org/a5ej20sjfwe/wp-content/uploads/2025/09/2025-Wordmark-Logo.pngGuest Author2016-10-31 09:00:302021-04-15 15:04:23Interactive maps show nearness of oil and gas wells to communities in 5 states
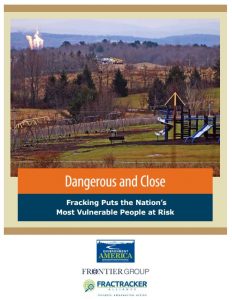
Cover of Dangerous and Close report. Click to view report
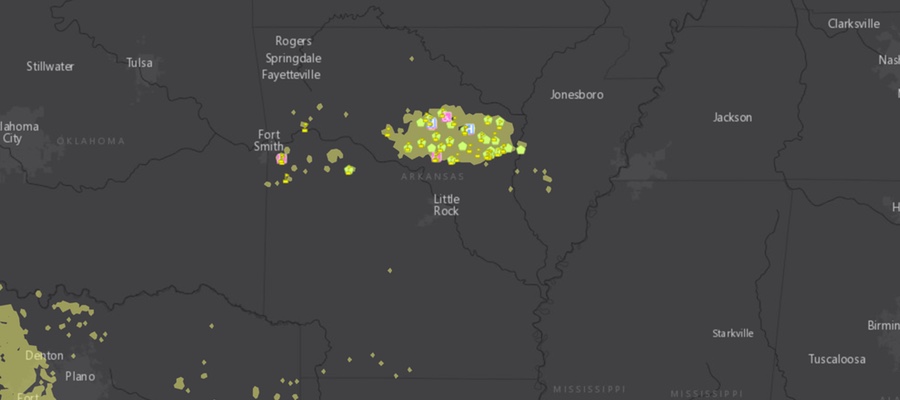
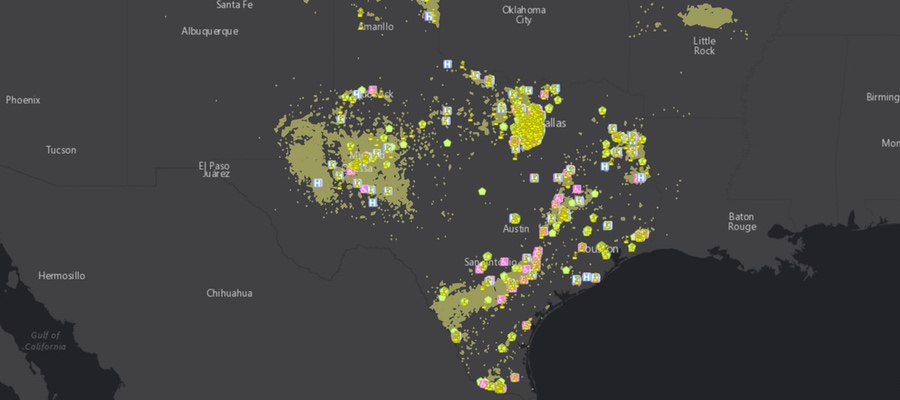
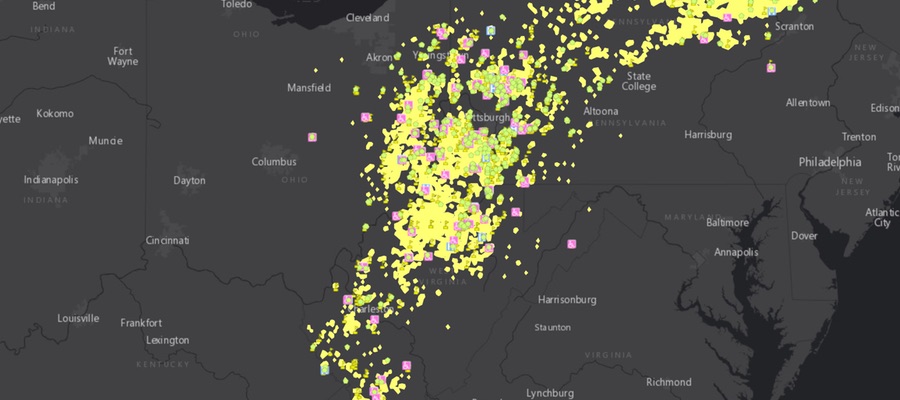
FracTracker Alliance has been working with the Frontier Group and Environment America on a nationwide assessment of “fracked” oil and gas wells. The report is titled Dangerous and Close, Fracking Puts the Nation’s Most Vulnerable People at Risk. The assessment analyzed the locations of fracked wells and identified where the fracking has occurred near locations where sensitive populations are commonly located. These sensitive sites include schools and daycare facilities because they house children, hospitals because the sick are not able to fight off pollution as effectively, and nursing homes where the elderly need and deserve clean environments so that they can be healthy, as well. The analysis used data on fracked wells from regulatory agencies and FracFocus in nine states. Maps of these nine states, as well as a full national map are shown below.
No one deserves to suffer the environmental degradation that can accompany oil and gas development – particularly “fracking” – in their neighborhoods. Fracked oil and gas wells are shown to have contaminated drinking water, degrade air quality, and sicken both aquatic and terrestrial ecosystems. Additionally, everybody responds differently to environmental pollutants, and some people are much more sensitive than others. In fact, certain sects of the population are known to be more sensitive in general, and exposure to pollution is much more dangerous for them. These communities and populations need to be protected from the burdens of industries, such as fracking for oil and gas, that have a negative effect on their environment. Commonly identified sensitive groups or “receptors” include children, the immuno-compromised and ill, and the elderly. These groups are the focus of this new research.
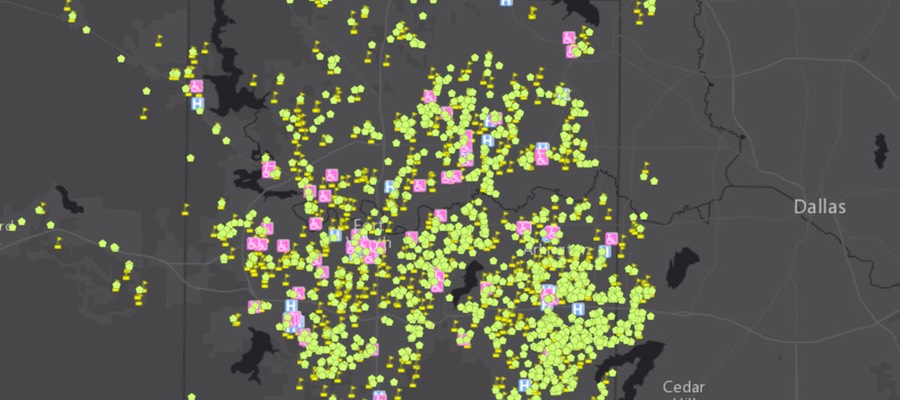
National Map
National interactive map of sensitive receptors near fracked wells
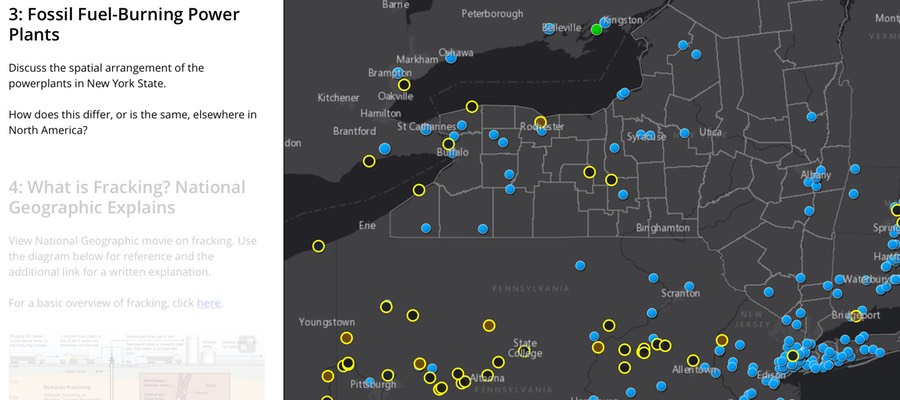
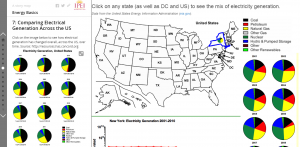
Over the past half year, FracTracker staffer Karen Edelstein has been working with a New York State middle school teacher, Laurie Van Vleet, to develop a series of interdisciplinary, multimedia story maps addressing energy issues. The project is titled “Energy Decisions: Problem-Based Learning for Enhancing Student Motivation and Critical Thinking in Middle and High School Science.” It uses a combination of interactive maps generated by FracTracker, as well as websites, dynamic graphics, and video clips that challenge students to become both more informed about energy issues and climate change and more critical consumers of science media.
Edelstein and VanVleet have designed energy-related story maps on a range of topics. They are targeted at 6th through 8th grade general science, and also earth science students in the 8th and 10th grades. Story map modules include between 10 and 20 pages in the story map. Each module also includes additional student resources and worksheets for students that help direct their learning routes through the story maps. Topics range from a basic introduction to energy use, fossil fuels, renewable energy options, and climate change.
The modules are keyed to the New York State Intermediate Level Science Standards. VanVleet is partnering with Ithaca College-based Project Look Sharp in the development of materials that support media literacy and critical thinking in the classroom.
Explore each of the energy-related story maps using the links below:
Screenshot from Energy Basics story map – Click to explore the live story map
This unique partnership between FracTracker, Project Look Sharp, and the Ithaca City School District received generous support from IPEI, the Ithaca Public Education Imitative. VanVleet will be piloting the materials this fall at Dewitt and Boynton Middle Schools in Ithaca, NY. After evaluating responses to the materials, they will be promoted throughout the district and beyond.
https://www.fractracker.org/a5ej20sjfwe/wp-content/uploads/2016/09/StoryMap-Feature.jpg400900Karen Edelsteinhttps://www.fractracker.org/a5ej20sjfwe/wp-content/uploads/2025/09/2025-Wordmark-Logo.pngKaren Edelstein2016-09-12 13:08:302026-04-28 15:41:00Energy-Related Story Maps for Grades 6-10
An Ottawa, IL resident’s letter to U.S. Silica regarding how the firm’s “frac” sand mines adjacent to Starved Rock State Park will alter the local economy.
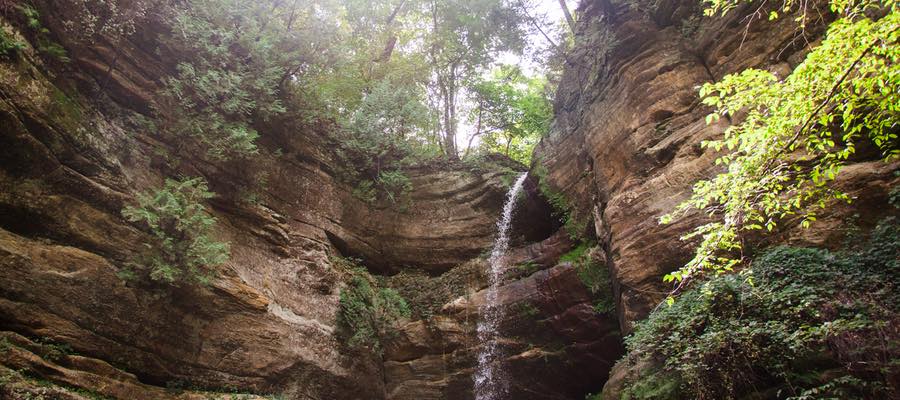
Starved Rock State Park
As is so often the case, we find that those things we have taken most for granted are usually the things we miss most when they are gone. The list of what our nation has lost to industrial and commercial concerns couldn’t possibly be compiled in a single article. The short-sighted habits of economic progress have often led to long-term loss and ecologic disaster. That is why it took a man like Abraham Lincoln, a man of long-term vision and wisdom, to sign into existence our first national park, preserving for antiquity what surely would have been lost to our American penchant for development and overuse.
With that in mind, I have always found it amazing how the gears of our own local and state governments have continually chosen the economic path of least resistance and allowed the areas surrounding Starved Rock State Park to be ravaged and destroyed for what is, ultimately, minimal gain. I am no expert but I suspect it could be argued that a full 1/3 of LaSalle County’s economic engine is funded by the simple existence of Starved Rock State Park. Beyond the 2 million plus visitors to the park each year, it cannot be forgotten that nearly every municipality in LaSalle County has directly or indirectly benefited from the countless number of businesses that prosper from the magnetism of the park’s tranquil canyons.
As the 4-year battle with Mississippi Sand over development of the Ernat property has proved, there are many rational souls who truly acknowledge the importance of maintaining a healthy and productive park environment. With the recent sale of the Ernat property to U.S. Silica, we are again confronted with the prospect of irrational development of the eastern boundaries of Starved Rock State Park.
Given the gravity of these decisions, I would like to share a letter recently sent on behalf of many of those who have fought so hard and so long for preservation of that same eastern boundary. This letter was sent to Brian Shinn, CEO of U.S. Silica Holdings, INC. (SLCA) in Frederick, Maryland nearly a month ago, and we have yet to receive a response. In sharing this information on FracTracker’s website, I hope this letter will contribute to further discussion among our local representatives over a far more long-term vision of what LaSalle County wishes to be and what qualities, both environmental and economic, that it wishes to maintain and protect:
Letter to US Silica
Dear Mr. Shinn,
I am writing this letter on behalf of dozens of LaSalle County, Illinois residents who have, for the past several years, been intimately involved in the active pursuit of rational use and conservation of our local natural environment. As I am sure you are aware, the debate over use of the Ernat property as a functional sand mining operation has been a long and hard-fought battle. Years of litigation by the Sierra Club and other local environmental groups helped stall it’s development by Mississippi Sand, and have now led to the sale of the Ernat acreage to U.S. Silica. As irrational as the previous proposals were, the sale putting that acreage under your control has not lessened our concerns over the damaging use of that property as it relates to historic Highway 71 and the entire Starved Rock State Park area.
Obviously, sand mining operations have been a long-standing component of LaSalle County economics. Decades of mining under U.S. Silica supervision have not substantially reduced the quality of life for county residents or the natural environment as a whole. However, as can be specified by many local experts, the development and spoilage of the Ernat property will most certainly have longstanding and drastic impacts on both the ecology of Starved Rock State Park and the economic engine that it sustains. Starved Rock State Park attracts over 2 million visitors each year, with an estimated half million visitors using the Hwy. 71 entrance paralleling the Ernat farm as their main gateway into the park. The Ernat property’s river frontage has long been the tranquil eastern entry into the Illinois Canyon area, as well as an active nesting site for countless birds amidst bountiful wetlands and flat, open prairies. The Ernat property’s shared access to Horseshoe Creek has also made it essential to the entire Illinois Canyon ecosystem within the park. In short, any development of this property will most certainly have long-term negative impacts on both the economics and ecology of the Illinois River Basin.
In writing this letter, we are hoping that U.S. Silica, under your guidance, may consider the opportunity to preserve this indispensable parcel of land and examine ways in which U.S. Silica might make this land available as a gift or negotiated property to the state of Illinois. It would certainly be an important addition to the entire Starved Rock State Park area. I have included the signatures of many of our own local coalition. We hope you will consider the long-term impacts that this development would have to one of Illinois premier natural areas. Thank you.
Inspiring Action
I hope those who have signed this letter will be inspired to further action, and those who have not will reconsider their years of inaction. The natural heritage and local economies of our entire Illinois River Basin are depending on it.
Sincerely,
Paul Wheeler
Only when the last tree has died… and the last river been poisoned… and the last fish been caught… will we realize we cannot eat money.
https://www.fractracker.org/a5ej20sjfwe/wp-content/uploads/2016/08/StarvedRock-McCray-Feature.jpg400900Guest Authorhttps://www.fractracker.org/a5ej20sjfwe/wp-content/uploads/2025/09/2025-Wordmark-Logo.pngGuest Author2016-08-29 16:47:202020-03-11 16:46:26How Frac Sand Mining is Altering an Economy Dependent on Starved Rock State Park, IL
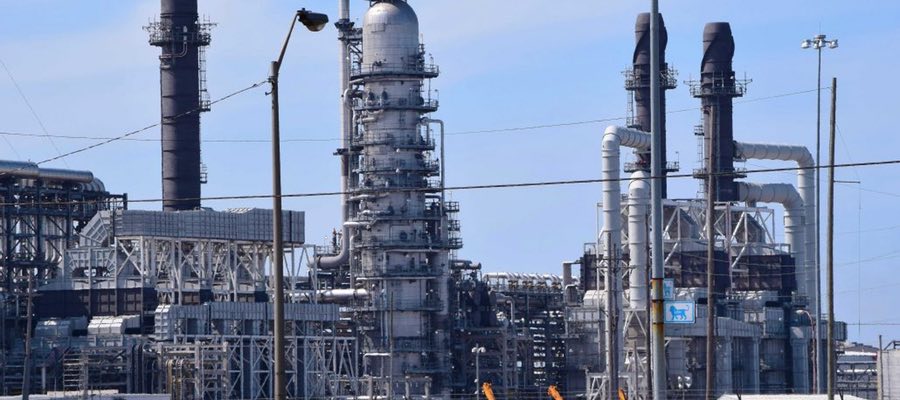
How annual incomes in the shadow of oil refineries compare to state and regional prosperity
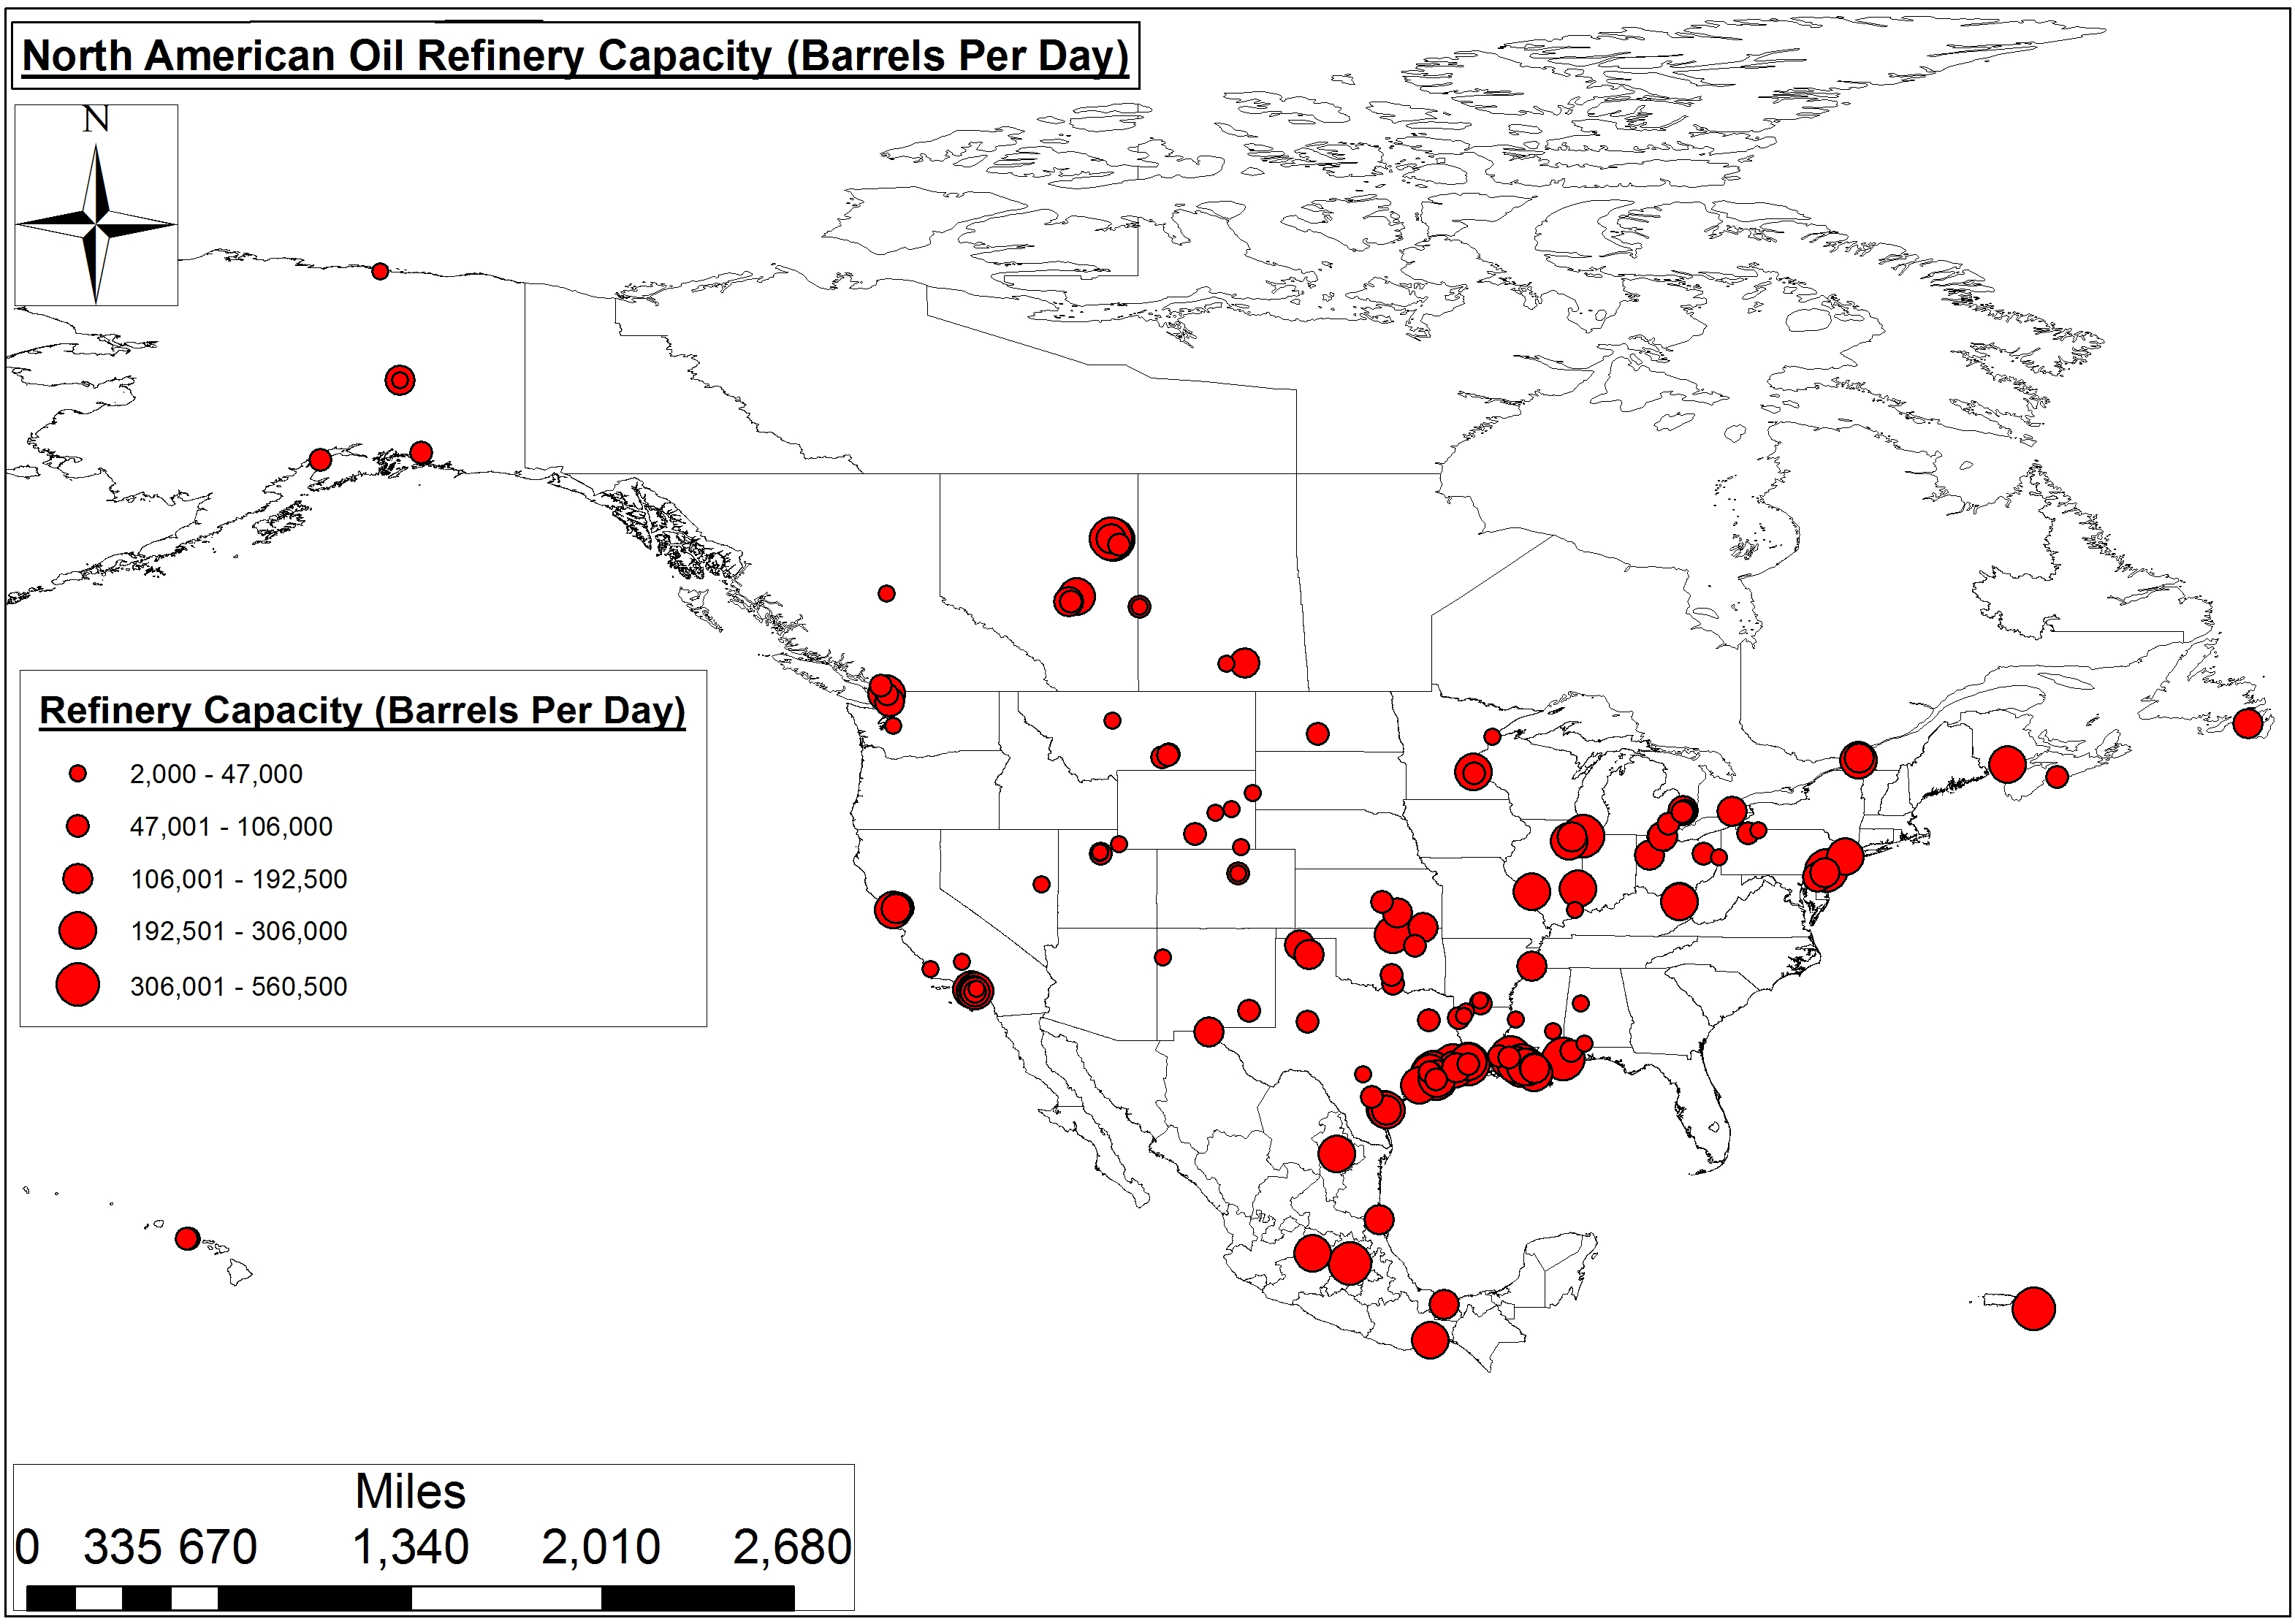
Figure 1. North American Oil Refinery Capacity
Typically, we analyze the potential economic impacts of oil refineries by simply quantifying potential and/or actual capacity on an annual or daily basis. Using this method, we find that the 126 refineries operating in the U.S. produce an average of 100,000-133,645 barrels per day (BPD) of oil – or 258 billion gallons per year.
In all of North America, there are 158 refineries. When you include the 21 and 27 billion gallons per year produced by our neighbors to the south and north, respectively, North American refineries account for 23-24% of the global refining capacity. That is, of course, if you believe the $113 dollar International Energy Agency’s 2016 “Medium-Term Oil Market Report” 4.03 billion gallon annual estimates (Table 1 and Figure 1).
Table 1. Oil Refinery Capacity in the United States and Canada (Barrels Per Day (BPD))
Prince George & Moose Jaw Refining in BC and SK, 12-15K BPD
Pemex’s Ciudad Madero Refinery, 152K BPD
—
High
Exxon Mobil in TX & LA, 502-560K BPD
Valero and Irving Oil Refining in QC & NS, 265-300K BPD
Pemex’s Tula Refinery, 340K BPD
—
Median
100,000 BPD
85,000 BPD
226,500
109,000
Total Capacity
16.8 MBPD
1.8 MBPD
1.4 MBPD
22.1 MBPD
Census Tract Income Disparities
However, we would propose that an alternative measure of a given oil refinery’s impact would be neighborhood prosperity in the census tract(s) where the refinery is located. We believe this figure serves as a proxy for economic justice. As such, we recently used the above refinery location and capacity data in combination with US Census Bureau Cartographic Boundaries (i.e., Census Tracts) and the Census’ American FactFinder clearinghouse to estimate neighborhood prosperity near refineries.
Methods
Our analysis involved merging oil refineries to their respective census tracts in ArcMAP 10.2, along with all census tracts that touch the actual census tract where the refineries are located, and calling that collection the oil refinery’s sphere of influence, for lack of a better term. We then assigned Mean Income in the Past 12 Months (In 2014 Inflation-Adjusted Dollars) values for each census tract to the aforementioned refinery tracts – as well as surrounding regional, city, and state tracts – to allow for a comparison of income disparities. We chose to analyze mean income instead of other variables such as educational attainment, unemployment, or poverty percentages because it largely encapsulates these economic indicators.
In today’s world, the enormous gap in the distribution of wealth, income and public benefits is growing ever wider, reflecting a general trend that is morally unfair, politically unwise and economically unsound… excessive income inequality restricts social mobility and leads to social segmentation and eventually social breakdown…In the modern context, those concerned with social justice see the general increase in income inequality as unjust, deplorable and alarming. It is argued that poverty reduction and overall improvements in the standard of living are attainable goals that would bring the world closer to social justice.
Environmental regulatory agencies like to separate air pollution sources into point and non-point sources. Point sources are “single, identifiable” sources, whereas non-point are more ‘diffuse’ resulting in impacts spread out over a larger geographical area. We would equate oil refineries to point sources of socioeconomic and/or environmental injustice. The non-point analysis would be far more difficult to model given the difficulties associated with converting perceived quality of life disturbance(s) associated with infrastructure like compressor stations from the anecdotal to the empirical.
Results
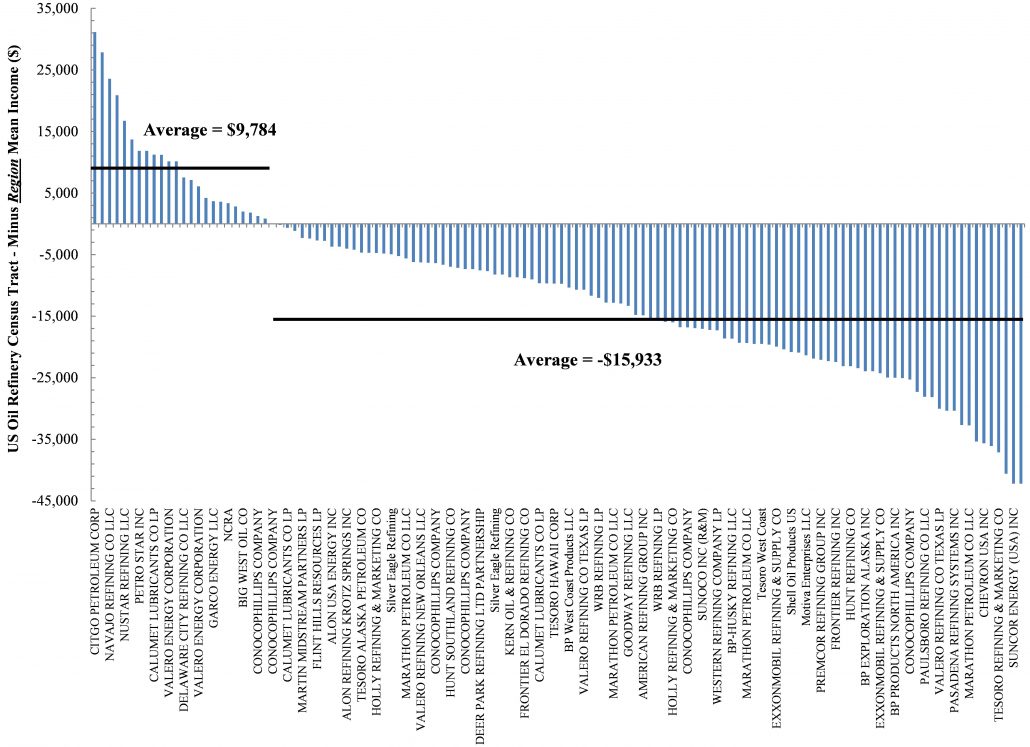
Primarily, residents living in the shadow of 80% of our refineries earn nearly $16,000 less than those in the surrounding region – or, in the case of urban refineries, the surrounding Metropolitan Statistical Areas (MSAs). Only residents living in census tracts within the shadow of 25 of our 126 oil refineries earn around $10,000 more annually than those in the region.
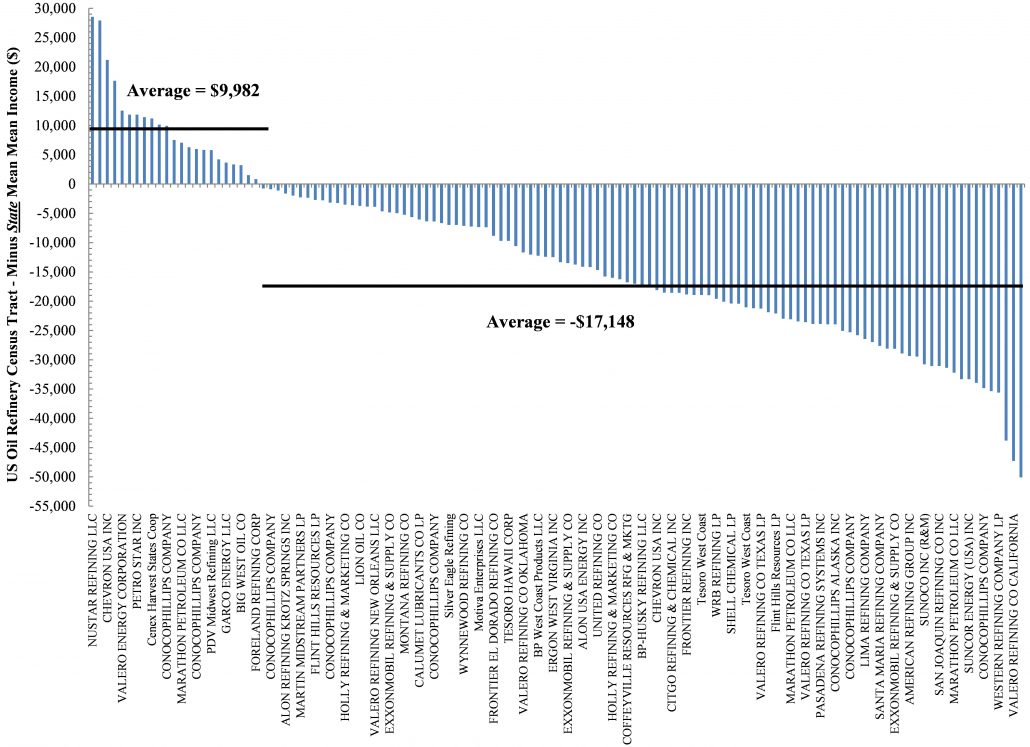
On average, residents of census tracts that contain oil refineries earn 13-16% less than those in the greater region and/or MSAs (Figure 2). Similarly, in comparing oil refinery census tract incomes to state averages we see a slightly larger 17-21% disparity (Figure 3).
Digging Deeper
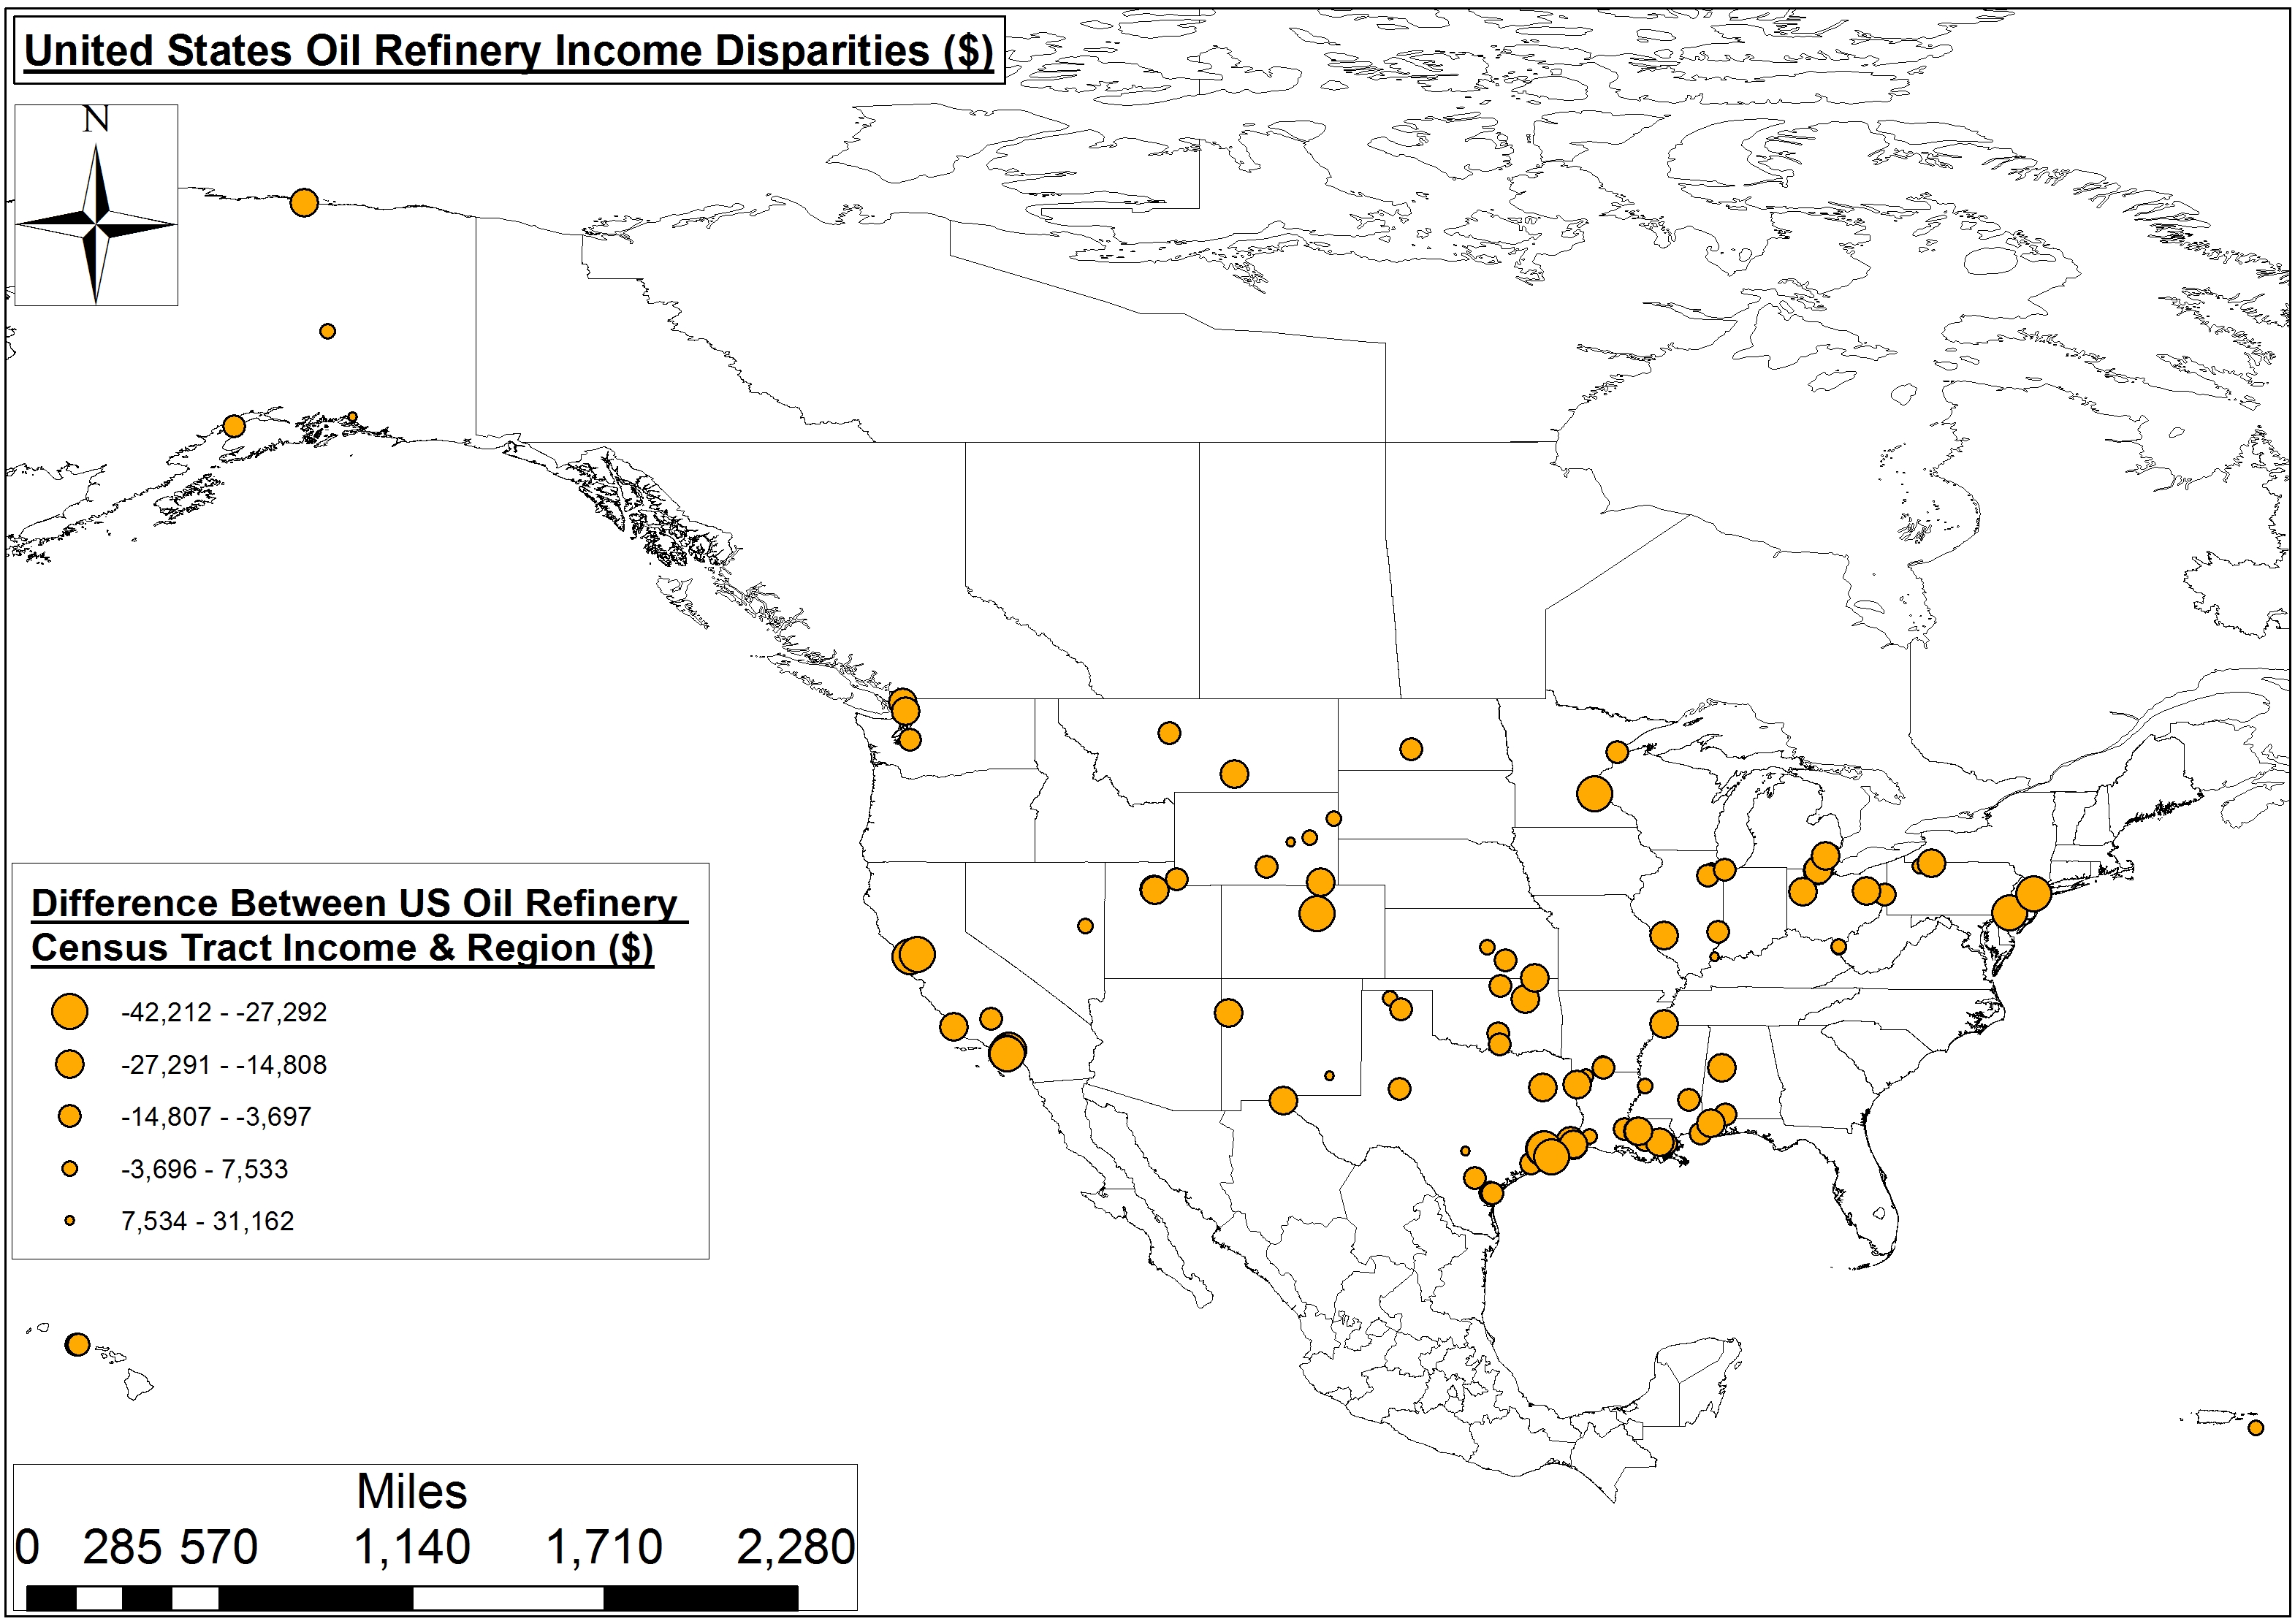
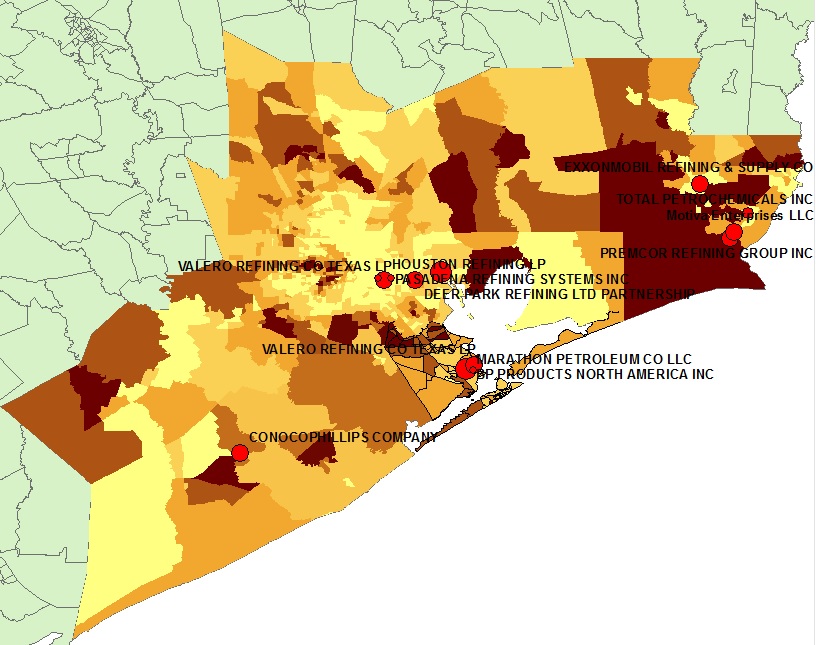
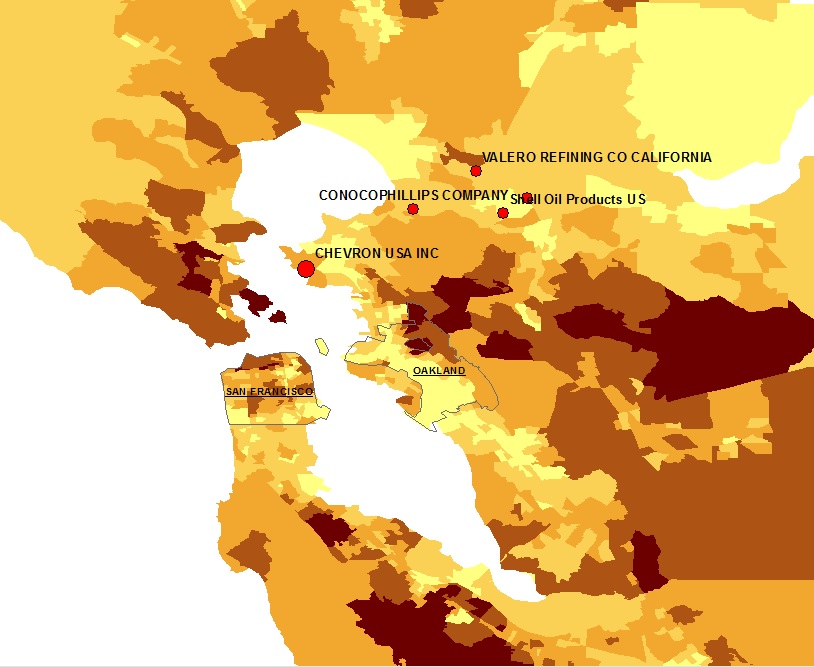
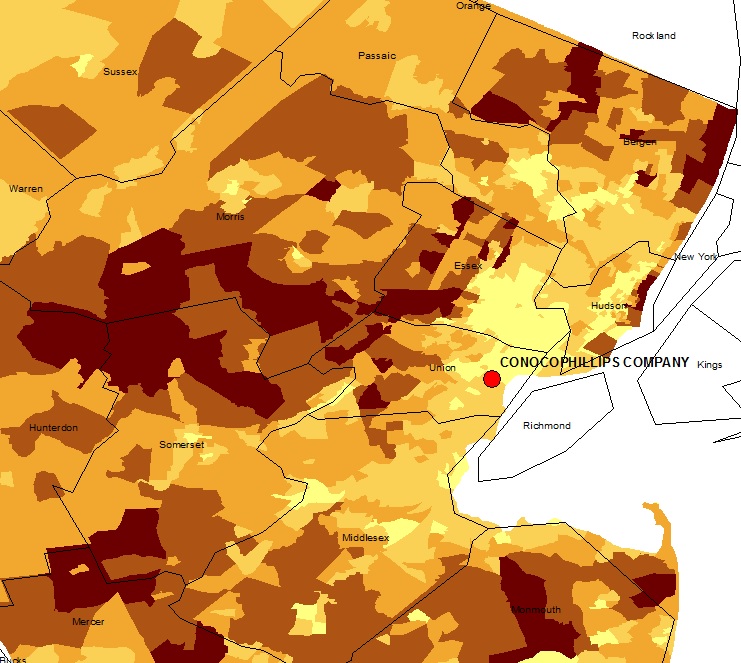
Figure 4. United States Oil Refinery Income Disparities (Note: Larger points indicate oil refinery census tracts that earn less than the surrounding region or city.)
Oil refinery income disparities seem to occur not just in one region, but across the U.S. (Figure 4).
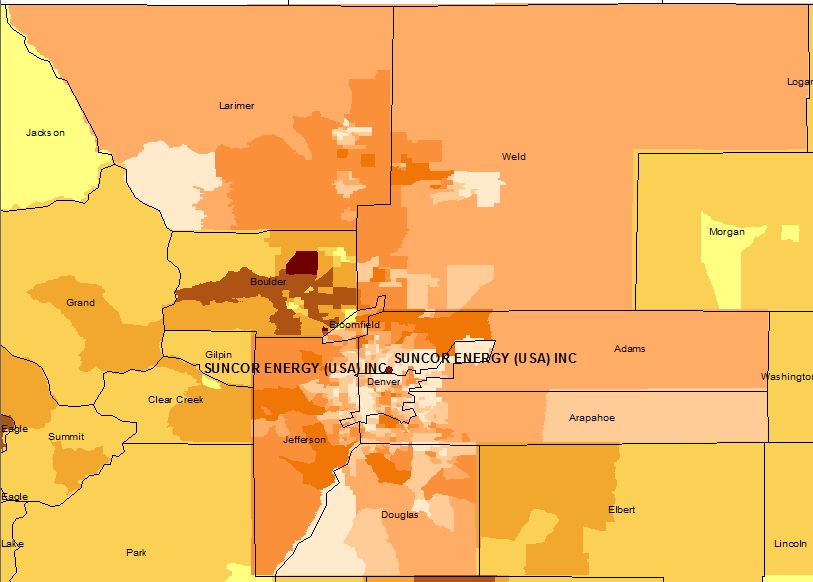
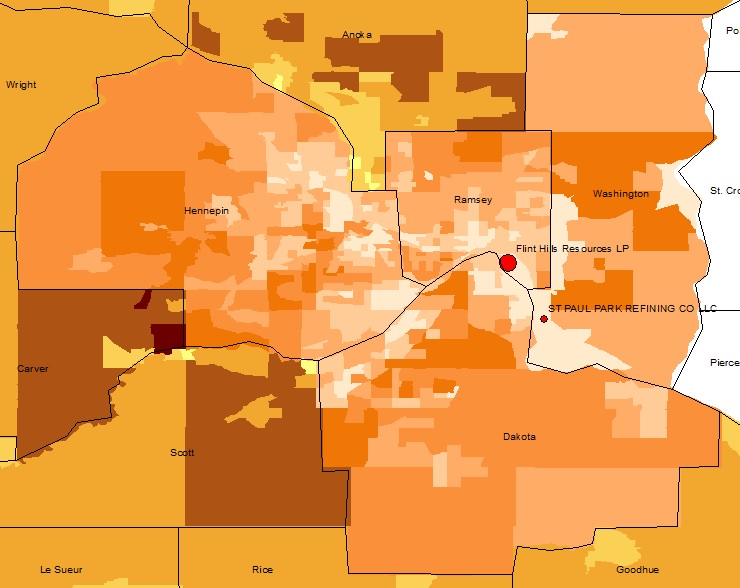
The biggest regional/MSA disparities occur in northeastern Denver neighborhoods around the Suncor Refinery complex (103,000 BPD), where the refinery’s census tracts earn roughly $42,000 less than Greater Denver residents1. California, too, has some issues near its Los Angeles’ Valero and Tesoro Refineries and Chevron’s Bay Area Refinery, with a combined daily capacity of nearly 600 BPD. There, two California census associations in the shadow of those refineries earn roughly $38,000 less than Contra Costa and Los Angeles Counties, respectively. In the Lone Star state Marathon’s Texas City, Galveston County refinery resides among census tracts where annual incomes nearly $33,000 less than the Galveston-Houston metroplex. Linden, NJ and St. Paul, MN, residents near Conoco Phillips and Flint Hills Resources refineries aren’t fairing much better, with annual incomes that are roughly $35,000 and nearly $33,000 less than the surrounding regions, respectively.
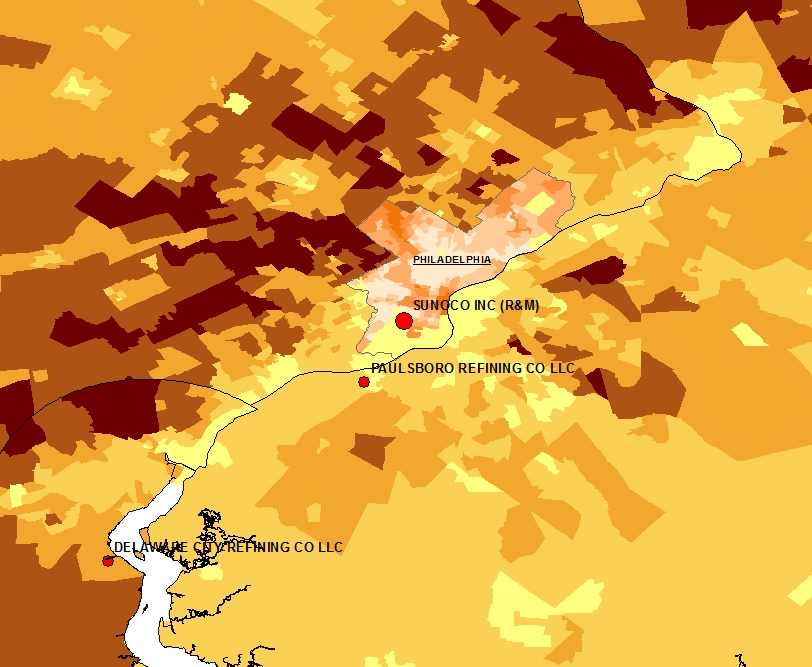
Click on the images below to explore each of the top disparate areas near oil refineries in the U.S. in more detail. Lighter shades indicate census tracks with a lower mean annual income ($).
Conclusion
Clearly, certain communities throughout the United States have been essentially sacrificed in the name of Energy Independence and overly-course measures of economic productivity such as Gross Domestic Product (GDP). The presence and/or construction of mid- and downstream oil and gas infrastructure appears to accelerate an already insidious positive feedback loop in low-income neighborhoods throughout the United States. Only a few places like Southeast Chicago and Detroit, however, have even begun to discuss where these disadvantaged communities should live, let alone how to remediate the environmental costs.
Internally Displaced People
There exists a robust history of journalists and academics focusing on Internally Displaced People (IDP) throughout war-torn regions of Africa, the Middle East, and Southeast Asia – to name a few – and most of these 38 million people have “become displaced within their own country as a result of violence.” However, there is a growing body of literature and media coverage associated with current and potential IDP resulting from rising sea levels, drought, chronic wildfire, etc.
The issues associated with oil and gas infrastructure expansion and IDPs are only going to grow in the coming years as the Shale Revolution results in a greater need for pipelines, compressor stations, cracker facilities, etc. We would propose there is the potential for IDP resulting from the rapid, ubiquitous, and intense expansion of the Hydrocarbon Industrial Complex here in the United States.
By Kirk Jalbert, Manager of Community Based Research & Engagement Kyle Ferrar, Western Program Coordinator
Weld County, Colorado, is one of the top producing shale oil and gas regions in the United States, boasting more than 12,000 active horizontal or directional wells, which account for 50% of all horizontal or directional wells in the state. To put this into perspective, the entire state of Pennsylvania has ten times the land area with “only” 9,663 horizontal or directional wells. At the center of Weld County is the city of Greeley, population 92,889. Greeley has experienced dramatic changes in the past decade as extraction companies compete to acquire oil and gas mineral rights. Extensive housing developments on the outskirts of the city are being built to accommodate future well pads on neighboring lots. Meanwhile, a number of massive well pads are proposed within or on the border of city limits.
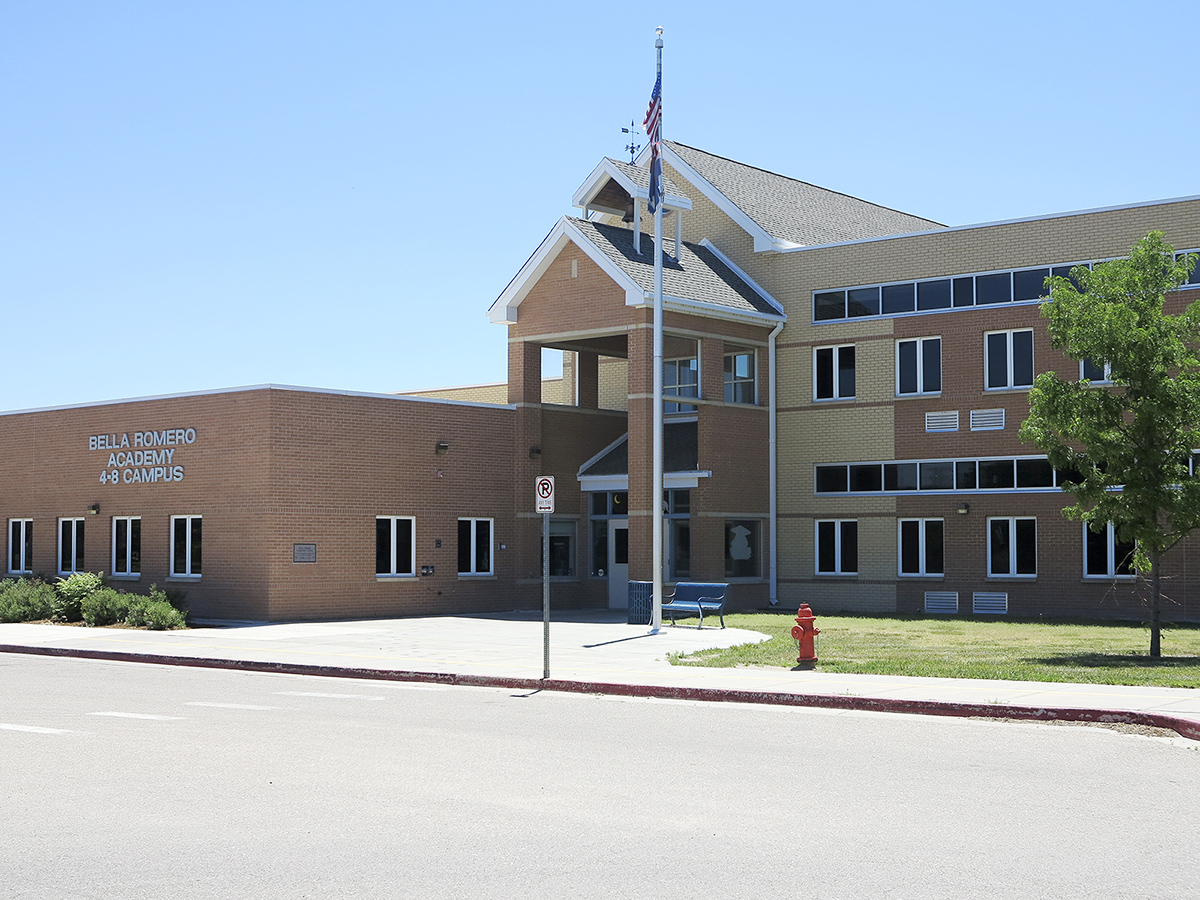
FracTracker visited Colorado back in November 2015 and met with regional advocacy organizations including Coloradans Against Fracking, Protect our Loveland, Weld Air and Water, and Our Longmont to determine how we could assist with data analysis, mapping, and digital storytelling. FracTracker returned in June 2016 to explore conditions unique to Weld County’s oil and gas fields. During our visit we interviewed residents of Greeley and found that one of their greatest concerns was the dangers of siting oil and gas wells near schools. While there is much more we will be publishing in coming weeks about our visit, this article focuses on one troubling project that would bring gas drilling to within 1,300ft of a public school. The proposal goes before the Weld County Commissioners on Wednesday, June 29th for final approval. As such, we will be brief in pointing out what is at stake in siting industrial oil and gas facilities near schools in Colorado and why residents of Greeley have cause for concern.
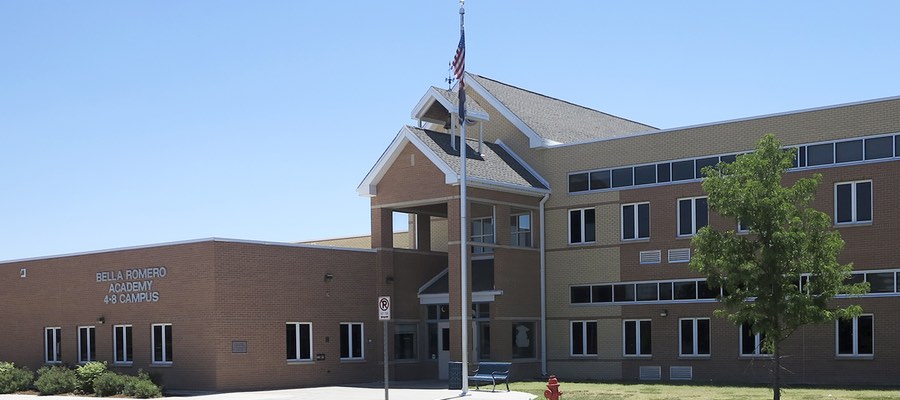
Drilling Bella Romero
On June 7th, the Weld County Planning Commission unanimously approved a proposal from Denver-based Extraction Oil & Gas to develop “Vetting 15H”—a 24-head directional well pad in close proximity to Bella Romero Academy, a middle school just outside Greeley city limits. In addition to the 24-head well pad would be a battery of wastewater tanks, separators, and vapor recovery units on an adjacent lot. The permit submitted to the Colorado Oil & Gas Conservation Commission (COGCC) also states that six more wells may be drilled on the site in the future.
As was detailed in a recent FracTracker article, Colorado regulations require a minimum setback distance of 500ft from buildings and an additional 350ft from outdoor recreational areas. In more populated areas, or where a well pad would be within 1,000ft of high occupancy buildings, schools, and hospitals, drilling companies must apply for special variances to minimize community impacts. Setbacks are measured from the well head to the nearest wall of the building. For well pads with multiple heads, each well must comply with the respective setback requirements.
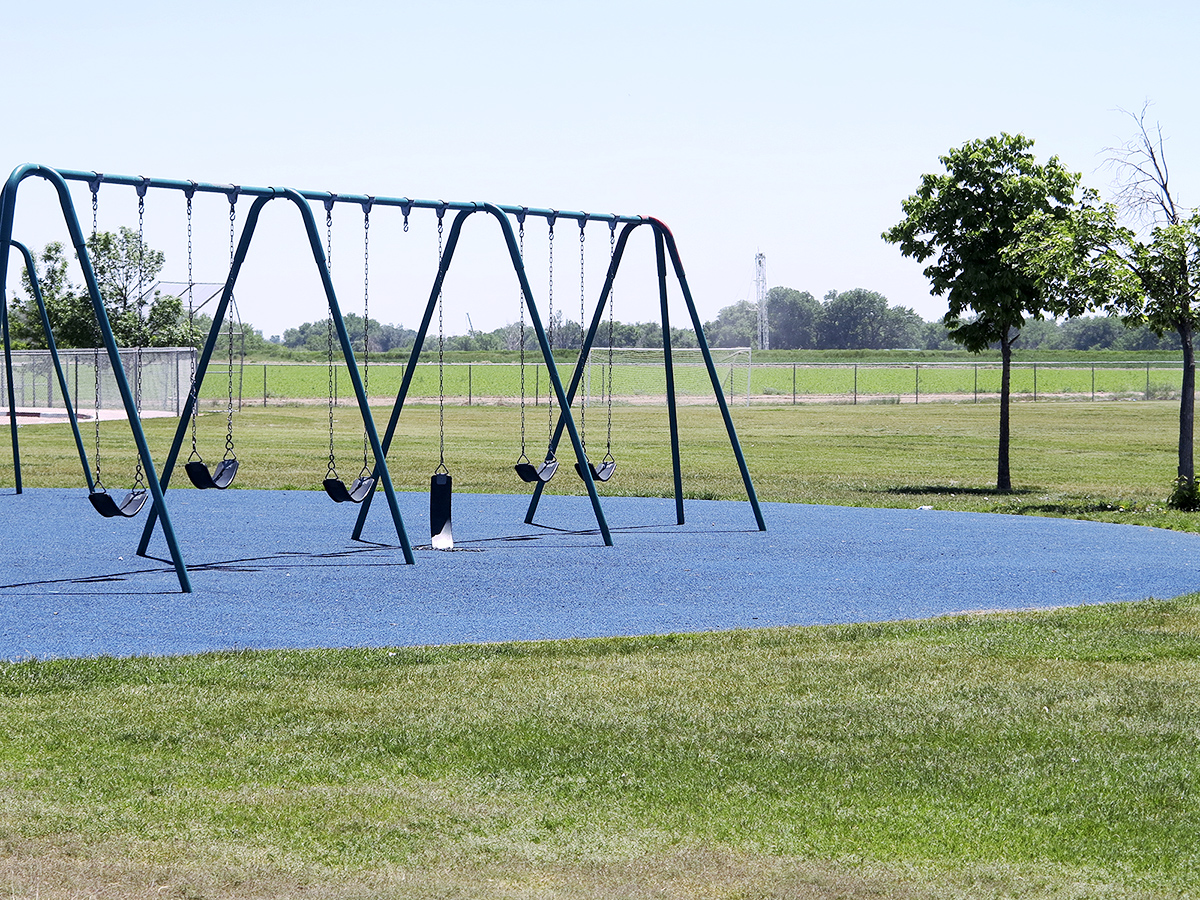
Bella Romero’s playground with Vetting 15H’s proposed site just beyond the fence.
Vetting 15H would prove to be one of the larger well pads in the county. And while its well heads remain just beyond the 1,000ft setback requirement from Bella Romero buildings, a significant portion of the school’s ballfields are within 1,000ft of the proposed site. When setbacks for the well pad and the processing facility are taken together—something not explicitly demonstrated in the permit—almost the entirety of school grounds are within 1,000ft and the school itself lies only 1,300ft from the pad. The below figures show the images supplied by Extraction Oil & Gas in their permit as well as a more detailed graphic generated by FracTracker.
Youth: A High Risk Population
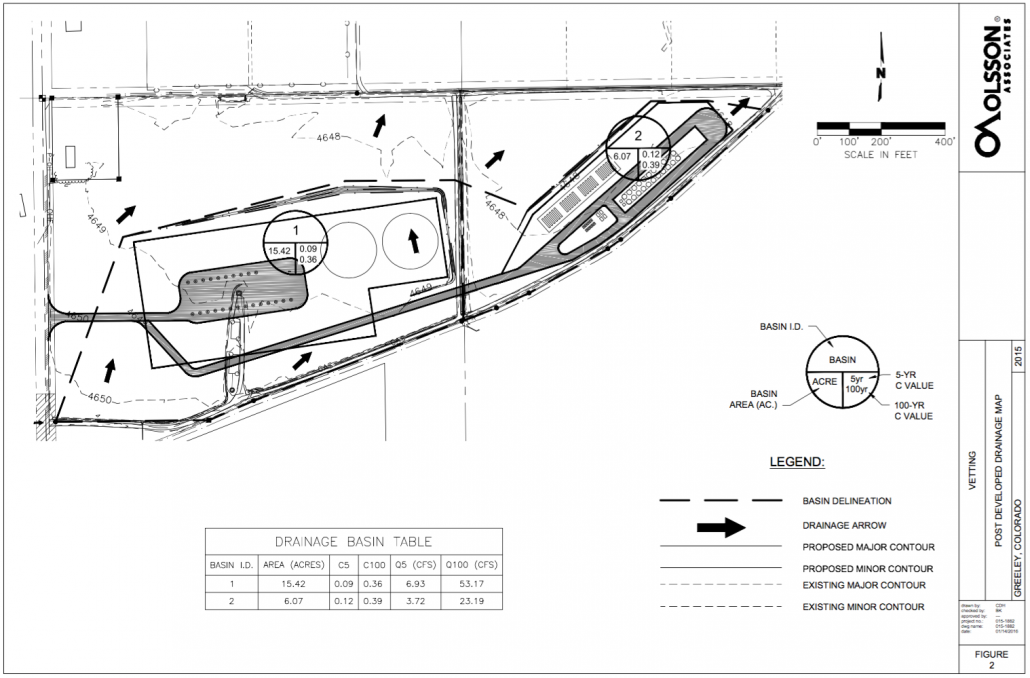
The difference between 1,000ft and 1,300ft may be negligible when considering the risks of locating industrial scale oil and gas facilities near populated areas. The COGCC has issued 1,262 regulatory violations to drilling companies since 2010 (Extraction Oil & Gas ranks 51st of 305 operators in the state for number of violations). Some of these violations are for minor infractions such as failing to file proper paperwork. Others are for major incidents; these issues most often occur during the construction phases of drilling, where a number have resulted in explosions and emergency evacuations. Toxic releases of air and water pollution are not uncommon at these sites. In fact, the permit shows drainage and potential spills from the site would flow directly towards Bella Romero school grounds as is shown in the figure below.
Vetting 15H post-development drainage map.
A host of recent research suggests that people in close proximity to oil and gas wells experience disproportionate health impacts. Emissions from diesel engine exhaust contribute to excessive levels of particular matter, and fumes from separators generate high levels of volatile organic compounds. These pollutants decrease lung capacity and increase the likelihood of asthma attacks, cardiovascular disease, and cancer (read more on that issue here). Exposure to oil and gas facilities is also linked to skin rashes and nose bleeds.
As we’ve mentioned in our analysis of oil and gas drilling near schools in California, children are more vulnerable to these pollutants. The same amount of contaminants entering a child’s body, as opposed to an adult body, can be far more toxic due to differences in body size and respiratory rates. A child’s developing endocrine system and neural pathways are also more susceptible to chemical interactions. These risks are increased by children’s lifestyles, as they tend to spend more hours playing outdoors than adults and, when at school, the rest of their day is spent at a central location.
At the June 7th public hearing Extraction Oil & Gas noted that they intend to use pipelines instead of trucks to transport water and gas to and from Vetting 15H to reduce possible exposures. But, as residents of Greeley noted of other projects where similar promises were made and later rescinded, this is dependent on additional approvals for pipelines. Extraction Oil & Gas also said they would use electric drilling techniques rather than diesel engines, but this would not eliminate the need for an estimated 22,000 trucking runs over 520 days of construction.
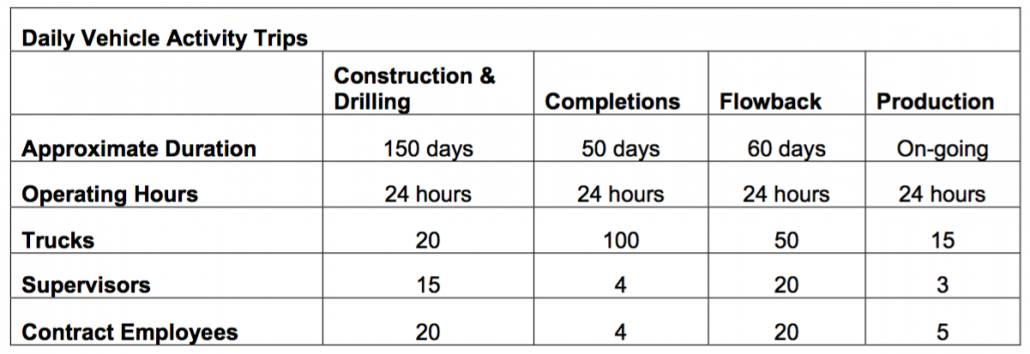
Below is a table from the Vetting 15H permit that shows daily anticipated truck traffic associated with each phase of drilling. The estimated duration and operational hours of each activity are based on only 12 wells since construction is planned in two phases of 12 wells at a time. These numbers do not account for the trucking of water for completions activities, however. The figures could be much higher if pipelines are not approved, as well as if long-term trucking activities needed to maintain the site are included in the estimates.
Vetting 15H daily vehicle estimates from permit
At the Top of the Most Vulnerable List
Bella Romero Academy has the unfortunate distinction of being one of the few schools in Colorado in close proximity to a horizontal or directional well amongst 1,750 public and 90 private schools in the state. Based on our analysis, there are six public schools within 1,000ft of a horizontal or directional well. At 2,500ft we found 39 public schools and five private schools. Bella Romero is presently at the top of the list of all schools when ranked by number of well heads located within a 1,000ft buffer. An 8-head well pad is only 800ft across the street from its front door. If the Vetting 15H 24-head well pad was to be constructed, Bella Romero would be far and above the most vulnerable school within 1,000ft of a well. It would also rank 3rd in the state for well heads located within 2,500ft of a school. The tables below summarize our findings of this proximity analysis.
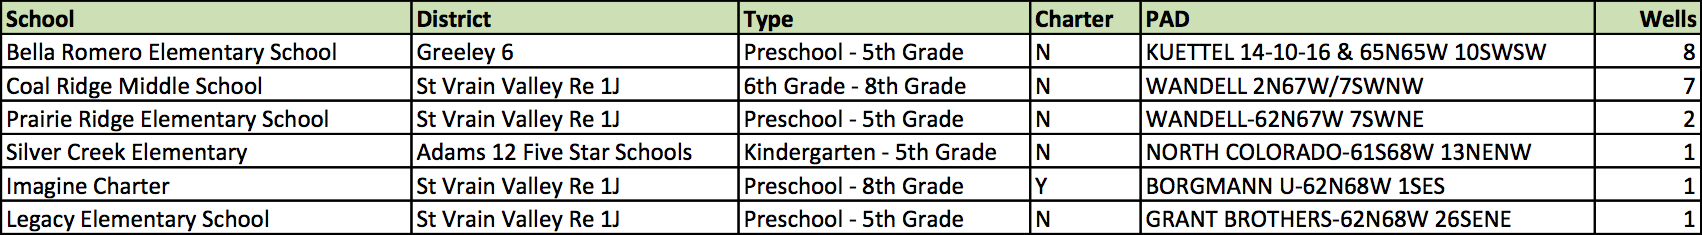
Colorado public schools within 1,000ft of a horizontal or directional well
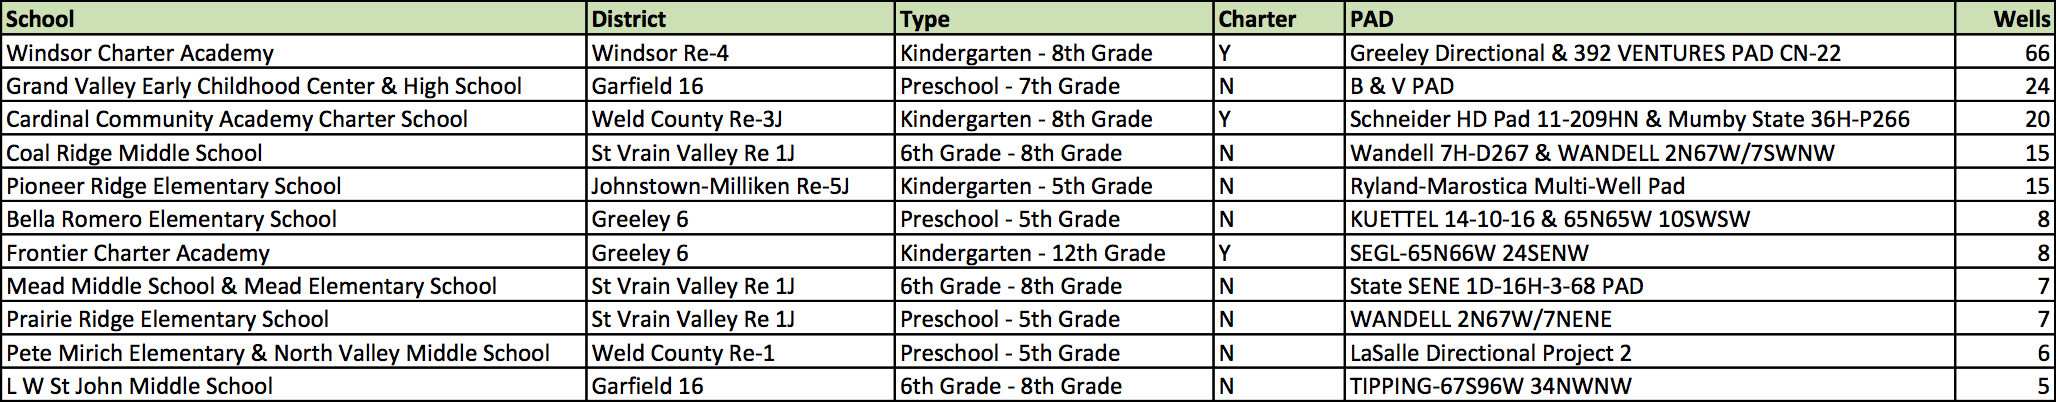
Colorado public schools within 2,500ft of a horizontal or directional well with 5 or more well heads. There are 39 schools in total
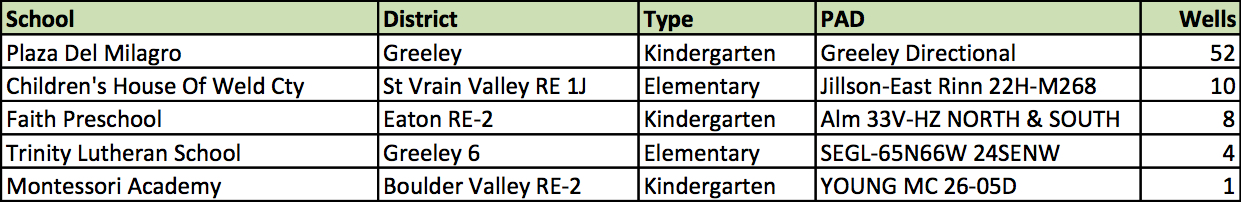
Colorado private schools within 2,500ft of a horizontal or directional well
The following interactive map shows which schools in Colorado are within a range of 2,500ft from a directional and horizontal well. Additional buffer rings show 1,000ft and 500ft buffers for comparison. 1,000ft was selected as this is the minimum distance required by Colorado regulations from densely populated areas and schools without requiring special variances. Environmental advocacy groups are presently working to change this number to 2,500ft. The map is zoomed in to show the area around Bella Romero. Zoom out see additional schools and click on features to see more details. [NOTE: The Colorado school dataset lists Bella Romero Academy as an elementary/middle school. Bella Romero was recently split, with the elementary school moving a few blocks west.]
Drilling near Bella Romero is also arguably an environmental justice issue, as its student population has some of the highest minority rates in the county and are amongst the poorest. According to coloradoschoolgrades.com, Bella Romero is 89% Hispanic or Latino and 3% African American whereas, according to the U.S. Census Bureau, Greeley as a whole is 59% White and 36% Hispanic or Latino. 92% of Bella Romero’s students are also from low income families. Furthermore, according to the EPA’s Environmental Justice Screening Tool, which is used by the agency to assess high risk populations and environments, the community surrounding Bella Romero is within the 90-95% percentile range nationally for linguistically isolated communities.
Many of Bella Romero’s students come from low-income communities surrounding Greeley.
Implications
These statistics are significant for a number of reasons. Firstly, oil and gas permitting in Colorado only requires operators to notify residents immediately surrounding proposed well pads. This rule does not include residents who may live further from the site but send their students to schools like Bella Romero. Parents who might comment on the project would need to hear about it from local papers or neighbors, but language barriers can prevent this from occurring. Another factor we witnessed in our June visit to Latino communities in Weld County is that many students have undocumented family members who are hesitant to speak out in public, leaving them with no voice to question risks to their children.
Residents of Greeley speak out at the June 7th Planning Commission meeting
Nevertheless, at the June 7th Planning Commission hearing, Weld County administrators insisted that their decisions would not take race and poverty into consideration, which is a blatant disregard for EPA guidelines in siting industrial development in poor minority communities. Weld County’s Planning Commission claimed that their ruling on the site would be the same regardless of the school’s demographics. By comparison, another proposed Extraction Oil & Gas site that would have brought a 22-head well pad to within 1,000ft of homes in a more well off part of town was denied on a 0-6 vote by the City of Greeley’s Planning Commission earlier this year after nearby residents voiced concerns about the potential impacts. Extraction Oil & Gas appealed the ruling and Greeley City Council passed the proposal in a 5-2 vote pending additional urban mitigation area permit approval. While the Greeley Planning Commission and the Weld County Planning Commission are distinct entities, the contrast of these two decisions should emphasize concerns about fair treatment.
Conclusion
There are very real health concerns associated with siting oil and gas wells near schools. When evaluating this project, county administrators should assess not only the immediate impacts of constructing the well pad but also the long-term effects of allowing an industrial facility to operate so close to a sensitive youth population. There are obvious environmental justice issues at stake, as well. Public institutions have a responsibility to protect marginalized communities such as those who send their children to Bella Romero. Finally, approving the Vetting 15H project would place Bella Romero far at the top of the list for schools in Colorado within 1,000ft of oil and gas wells. School board administrators should be concerned about this activity, as it will undoubtedly put their students’ health and academic performance at risk. We hope that, when the County Commissions review the proposal, these concerns will be taken into account.
https://www.fractracker.org/a5ej20sjfwe/wp-content/uploads/2016/06/BellaRomeroSchool-Feature.jpg400900FracTracker Alliancehttps://www.fractracker.org/a5ej20sjfwe/wp-content/uploads/2025/09/2025-Wordmark-Logo.pngFracTracker Alliance2016-06-21 13:09:522020-03-11 17:05:19Drilling Bella Romero: Children at Risk in Greeley, Colorado


