FracTracker Alliance invites Colorado’s Front Range communities to attend and participate in two community meetings, open to the public on August 23rd and 24th. Our shared goals will be to craft new research projects for FracTracker to study related to the environmental health impacts resulting from oil and gas development in Colorado. We also welcome Dr. Stephanie Malin, who will be giving a short presentation on her current work.
Background
FracTracker is returning to Colorado’s Front Range to continue working with communities where oil and gas exploration and production impacts the daily lives of Coloradoans and degrades the environment. While Colorado is not well known for oil and gas extraction, development within recent years using unconventional techniques like fracking has bloated production to over 60,000 active wells. The majority of these wells, over 33,000, are located in Weld County. These Front Range communities are also the most densely populated regions near major unconventional oil and gas development. FracTracker will, therefore, continue to support these communities under assault by the fossil fuel industry.
Community Workshops
FracTracker will be hosting two community engagement workshops in Weld County on August 23rd and 24th. You can find the flyers with times posted below. The meetings will serve to both inform the communities of the work FracTracker is currently conducting or has already completed to date, and to direct and inform future research in Colorado. Active communty engagement is most important to the environmental health research process. Researchers rely on community members. You, the community, are the experts we need to create responsibly informed research projects!
Below are flyers with more information about the events (click to expand).
Our agenda for the August 23rd meeting includes a synopsis of the research products that have been generated by FracTracker thus far. Below you will find links to the research that has been summarized into blog posts. Current, active research will also be presented:
Instead of coming in with a preconceived research question, we’re starting with your concerns. The goal of these meetings is to narrow down topics for future research, and then to refine the questions associated with each topic. The meeting on the 23rd will serve to nail down the issues that are most important to community members. This conversation may include expanding existing research and revisiting topics. On the evening of August 24th, we will present these topics to the greater community for further discussion. The issues will be prioritized with the help of a larger audience, and specific research aims will be synthesized.
For more information about these community meetings in Colorado, please contact Kyle Ferrar at ferrar@fractracker.org.
https://www.fractracker.org/a5ej20sjfwe/wp-content/uploads/2017/08/cover.jpg400900Kyle Ferrar, MPHhttps://www.fractracker.org/a5ej20sjfwe/wp-content/uploads/2025/09/2025-Wordmark-Logo.pngKyle Ferrar, MPH2017-08-21 12:58:152021-04-15 15:02:35FracTracker Alliance to Host Community Meetings in Colorado
Imagine that tonight you head home to cook dinner. But, standing at your kitchen sink, you find that your tap water is suddenly running a funny color or gives off a bad smell. So instead of cooking, you order a pizza and decide to work outside in your garden. Just as you’re getting your hands dirty, however, you hear the roar of the compressor station that you see from your yard as its “blows off” some substance. Going back inside, and closing your windows to keep out the foul air, you think of the tap water and decide a shower is out of the question. Imagine that you resign yourself to just going to bed early – only to be kept awake by the bright and unnatural glow of gas being flared at the nearby wellhead.
Scenarios just like these can and do happen when hydraulic fracturing, or fracking, encroaches upon residential areas.
In Part 1 of this two-part series, we described how the many aspects of fracking can destroy a healthy home environment and argued for a frame that focuses on those impacts. A frame is a way of contextualizing, communicating about, and understanding an issue.
This article brings in the idea of rights, and lists several declared rights that fracking violates. Returning to the topic of framing, we then challenge the fracking-friendly frame, by calling into question three common ways of talking about fracking that ignore the rights of those impacted.
In short, the push to support fracking often ignores the rights of people living near it.
Healthy Homes for Human Flourishing
First, let’s explore why a having healthy home matters.
Everyone has a basic need for a safe, healthy place to live. The World Health Organization identifies the social determinants of health (SDH) as the “conditions in which people are born, grow, work, live, and age, and the wider set of forces and systems shaping the conditions of daily life.” Applied to healthy homes, these SDH include access to clean air and safe drinking water, and protection from intrusion and disaster. Health is not merely the absence of disease. Health can mean the ability to function, to live one’s life,[1] to flourish.
Human flourishing demands a healthy home environment. Picture again the scenario at the beginning of this article. Would you be able to care for yourself and your family members, to meet your basic needs, or to lead a satisfying life if your home didn’t seem like a safe place to live?
Using Rights to Make the Case
Many people who live near drilling often ask themselves that very question. These include people like Pam Judy, with a compressor station less than 800 feet from her house, who questions the long term effects of breathing in the 16 chemicals detected in air test conducted by the PA Department of Environmental Protection.
Simply reading or watching the stories of those directly impacted by gas development makes a moving argument for the right to a healthy home environment – and that argument also has a lot of backing. Researchers[2] have made a powerful case that fracking can and has violated human rights, by impacting the health for those downwind or downstream and by denying civil liberties to those pushed aside or silenced during the debate. These same researchers showed specifically that fracking has violated the rights to privacy, family, home, and protection of property.
Various governments and non-governmental organizations around the world have likewise called out human rights violations due to fracking. Other human rights declarations are relevant here, too. Fracking’s impacts are incompatible with the rights to health and to housing. Here’s a sampling:
This sampling of precedents includes statements and declarations by the United Nations and the Organization of American States. It shows that when it comes to human rights and fracking, a strong case has already been made by respected international organizations.
Challenging the fracking-friendly frame
A rights-based perspective, informed by precedents like those above, gives us a strong platform from which to examine and counter arguments that support or promote fracking. We can call those pro-fracking arguments a “fracking-friendly” frame.
A fracking-friendly frame denies or minimizes the human impacts. We can hear elements of the fracking-friendly frame underlying industry promises and political talking points, and witness how they leach into common dialogue between citizens.
Element #1: “Economic impacts”- but only the positives
An “economic impacts ” emphasis tends to focus on narrowly-defined economic benefits , while excluding other real, negative economic drawbacks , like the latter half of boom & bust cycles. Consider this infographic of the “economic impacts” of an Appalachian petrochemical hub scenario–an industry reliant upon the cheap and abundant fracked natural gas of the region. The document offers projected estimates for industry profits and employment levels potentially generated by the five ethane crackers planned for the region. But this document – and its focus on economics – says nothing about the negative consequences to the community. Due to air emissions from these facilities, health costs from fine particulate matter (PM 2.5) could amount to between $120 and $270 million each year, without even factoring in the additional impacts of ozone or toxics. A focus on economic impacts also says nothing about the incalculable value of lives – and quality of life – lost, which could amount to between 14 and 32 additional deaths annually, plus increased asthma, heart attacks, and bronchitis.[3]
Element #2: “Choice”
A false assumption of choice is built into the fracking-friendly frame. This element assumes that people have a choice–if they don’t like the drilling next door, they can just move. Yet, as well water becomes degraded and countryside views become dominated by unprecedented industrial development, selling a home can be a difficult proposition. As one researcher summed it up,
the various forms of land damage from fracking often result in decreased property values, making resale and farming difficult , and also making it harder to acquire mortgages and insurance. Properties adjoining drilling sites are often simply unsellable, as no one wants to live with the noise, the bad air, and the possibility of water pollution.[4]
Others confirm this fallout to home values. A recent report assessing 16 other studies on how UOGD affects home prices points to significant potential decreases in housing values for those on well water (up to -$33,000) and those without ownership of their mineral rights (up to -$60,000). These unfortunate realities belie the idea of choice.
On left, a white fracking rig at the far left of the image sits near a cabin overlooking the town of McDonald, PA. On right, a pipeline cut descends a hillside and into a residential development outside of Houston, PA. Photo credit: Leann Leiter.
In interviews conducted with women living in close quarters to drilling activity, three health care professionals[5] discovered the sense of powerlessness experienced they felt. One woman contemplated moving away from the region in spite of opposition from her husband and her own attachment to her home. In my own interaction with affected families, many express powerful feelings about relocation like sadness about leaving land owned for generations, or an eagerness to escape a home that no longer feels safe. Many express a sense of injustice for being forced to make such painful choices.
Element #3: “Sacrifice of the few for the good of the many”
Another underlying assumption of a fracking-friendly frame is that of “sacrifice of the few for the good of the many.” It declares that a “few” people will have to live near fracking and bear the unfortunate consequences, so many others can have cheap oil and gas. The belief bubbles up among the public, such as in this comment collected during a survey[6] of people living in the Marcellus shale gas region:
Energy has to come from somewhere. The needs of the many may outweigh the inconvenience of the few who live near the exploration efforts. This is not an ideal situation for all residents, but it is the reality.
This person’s statement shows acceptance of the assumption that energy for all requires unevenly shared sacrifice, and indicates a drastic underestimation of the populations impacted. It also indicates a misperception of the impacts, which unfortunately go far beyond mere “inconvenience” for many residents.
We can break down these assumptions by questioning how many people make sacrifices in the name of gas extraction. An interactive map by FracTracker shows that over 12 million Americans live within a risky ½ mile of oil and gas facilities (including both fracking wells and other types). Mounting research indicates health threats for distances of ½ mile or greater. That meaning this ever-growing number of Americans have increased rates of asthma and prenatal harms, with the most vulnerable – the young, the elderly, and those with pre-existing conditions – at the highest risk. The 12 million figure, already a conservative estimate, would be significantly higher if factoring in other oil and gas infrastructure like pipelines or frac sand mining operations, each of which carry their own risks.
Populations in US near activity oil and gas drilling activity in 2016. Click to explore the interactive map.
The view of nearby homes from a pipeline right-of-way, along with list of emergency contacts in case of incident. Safety precautions like these remind us of the potentially injurious nature of gas infrastructure. They also highlight the level of sacrifice being demanded of households near the hazard. Photo credit: Leann Leiter.
Building social support
These elements of a fracking-friendly frame function to isolate those who are experiencing negative effects in their own homes by minimizing, even denying, the impacts they are experiencing. Researchers in extractive regions have observed the power of this isolation. In some rural areas, isolation may be supported in part by cultural norms, such as an Appalachian appreciation for “minding one’s own business.” In at least one fracking-affected community, this widely-accepted norm hampers sharing among neighbors, prompting one resident’s complaint that “we’re all fighting like individuals.”[7] In a study of a community being driven from their homes by coal mining and power generation, another set of extractive, industrial activities, one participant lamented:
I think one of the problems of the mining and the industry is, they play on the basic everyday person’s lack of resources. There’s no social support for displacement, none whatsoever.[8]
A healthy homes frame, focused on universally shared human rights, powerfully counters the isolation. It reminds those who are suffering or have concerns about the changes to their home environment that they are not alone; others around the world are experiencing similar impacts to their households. Adopting this frame for understanding fracking is a show of support, one that acknowledges their plight.
Nearly everyone values and desires a healthy home, regardless of whether that home is an apartment, a nursing home, a cabin, or a mobile home. This frame extends beyond geographical, economical, and cultural barriers. It encourages social support from those currently removed from shale plays and the hydraulic fracturing used in extracting their resources. It empowers action, with the home front as a site of resistance, by articulating the range of rights being violated.
Focusing on what we’re fighting for
Re-centering the problems of fracking as they impact the right to a healthy home makes sense to those of us witnessing the degradation of the places people need in order to live and flourish. A rights-based approach focuses on what we’re fighting for, rather than giving extra airtime to the already-powerful frame we must fight against.
If you need assistance protecting your rights from planned fracking, the Delaware Riverkeeper Network offers a guide for communities and their local leaders to defending environmental rights at the municipal level.
For communities at any stage of gas development, Environmental Health Project has created a Where to Turn for Help directory full of sources for air testing services, community organizing, health information, tracking and reporting fracking development and violations, and much more.
Whether or not you feel the direct impacts of fracking, we are all connected to this extensive process. Fracking’s commodity products – energy and plastics – are part of all of our lives; it’s climate-altering effect diminishes all of our futures. More importantly, we all have a crucial role to play. Here is how you can get further involved:
Communicate with your lawmakers – share with them this article series or your own take on fracking, and ask what frame they are using when they make decisions on this and other dangerous modes of energy extraction.
Join Halt the Harm Network to get connected to people, groups and events “working to fight the harms of oil and gas development.”
Bringing rights into the conversation on fracking challenges the fracking-friendly frame, and promotes instead protection for those in fracked households.
Special thanks to the many individuals and families who shared the experiences that informed this article series.
References:
Resick, L. K., Knestrick, J. M., Counts, M. M., & Pizzuto, L. K. (2013). The meaning of health among mid-Appalachian women within the context of the environment. Journal of Environmental Studies and Sciences , 3 (3), 290-296.
Short, D., Elliot, J., Norder, K., Lloyd-Davies, E., & Morley, J. (2015). Extreme energy, ‘fracking’ and human rights: a new field for human rights impact assessments? , The International Journal of Human Rights, 19:6, 697-736, DOI:10.1080/13642987.2015.1019219
John Graham, Senior Scientist at Clean Air Task Force, personal communication, June 9, 2017. Health impacts modeling completed using EPA Co-Benefits and Risk Assessment (COBRA) Screening Tool, using estimated PM 2.5 air emissions for permitted Shell ethane cracker in Beaver County, PA and four additional facilities planned in Ohio and West Virginia.
Richard Heinberg cited in Short, D., Elliot, J., Norder, K., Lloyd-Davies, E., & Morley, J. (2015). Extreme energy, ‘fracking’ and human rights: a new field for human rights impact assessments? , The International Journal of Human Rights, 19:6, 697-736, DOI:10.1080/13642987.2015.1019219
Resick, L. K., Knestrick, J. M., Counts, M. M., & Pizzuto, L. K. (2013). The meaning of health among mid-Appalachian women within the context of the environment. Journal of Environmental Studies and Sciences , 3 (3), 290-296.
Cooley, R., & Casagrande, D. (2017). Marcellus Shale as Golden Goose. ExtrACTION: Impacts, Engagements, and Alternative Futures. Routledge.
Resick, L. K., Knestrick, J. M., Counts, M. M., & Pizzuto, L. K. (2013). The meaning of health among mid-Appalachian women within the context of the environment. Journal of Environmental Studies and Sciences , 3 (3), 290-296.
Connor et al., p. 54. Linda Connor, Glenn Albrecht, Nick Higginbotham, Sonia Freeman, and Wayne Smith. (2004). Environmental Change and Human Health in Upper Hunter Communities of New South Wales, Australia. EcoHealth 1 (Suppl.2), ,47-58. DOI: 10.1007/s10393-004-0053-2
https://www.fractracker.org/a5ej20sjfwe/wp-content/uploads/2017/08/Pipeline-House-Feature-Leiter.jpg400900FracTracker Alliancehttps://www.fractracker.org/a5ej20sjfwe/wp-content/uploads/2025/09/2025-Wordmark-Logo.pngFracTracker Alliance2017-08-03 12:40:072021-04-15 15:02:36The Right to a Healthy Home
An Ohio family took joy in raising their kids and cattle at their farmhouse, built in 1853 with crooked walls and no indoor bathrooms. When they leased land to fracking activity, however, the “beep, beep, beep” of heavy truck traffic kept them up all night, and a cow died after drinking a strange fluid flowing on the land during the cold of winter. They dedicated their retirement savings to moving and building a new home, only to soon after receive a compressor station as their neighbor – close enough to hear the engines at all hours and loud enough to make them dread even walking out to their mailbox.
During the upswing of a boom-and-bust cycle of the gas industry in Greene County, the influx of outside workers and the high demand on rental housing resulted in one particular family being unable to secure an apartment. Without adequate housing, their children were temporarily taken from their custody.
In Huntingdon, a young woman resisted a pipeline being forced through her property by stationing herself in a tree, while workers with chainsaws felled those around her. Eminent domain enabled the gas company to claim this privately-owned land under a weak guise of “public good.”
These unsettling but true stories hint at the countless ways fracking plays out in individual households. A healthy home environment – with clean air, potable drinking water, and safety from outside elements – is essential to human life and functioning. Yet, the industrial processes involved in unconventional oil and gas development (UOGD), often summed up with the term “fracking,” may interfere with or even take away the ability to maintain a healthy home.
This article aims to put these household impacts, and the right to a healthy home, at the center of the fracking debate.
Framing the issue
The way we understand just about anything depends on our frame of reference. A frame, like the frame around a picture, brings its contents into focus. At the same time, it excludes the information outside its borders. A frame declares that what’s inside is what matters. When it comes to the human effects of fracking, various conflicting frames exist, each dictating their own picture of what fracking actually does and means.
The frame we use to look at the fracking debate is so important, because it dictates how we talk about and think about the problem. Likewise, if we can identify the frame others are using when they talk about fracking, we can see more clearly what they have prioritized and what they are leaving out of the conversation.
Two researchers who conducted surveys, interviews, and focus groups in five Pennsylvania counties in 2014 and 2015 argue for the need for a new frame.1 Some of the common ways of talking about fracking not only favor shale gas development for reasons like those included in the frame on the left above, they also work against those trying to make a stand against the negative effects fracking. These researchers suggest that, rather than arguing within the existing, dominant frames, activists should consider proactively “reframing the debate around other core values.” The right to a healthy home is a widely-shared value. I propose we adopt a frame that puts that right at the center of the picture.
What is a “healthy home”?
The term healthy home isn’t new. The federal agencies Housing and Urban Development (HUD) and the Centers for Disease Control (CDC) both use this phrase in defining the importance of a home environment free from hazards and contaminants, like lead and radon. Simply put, a healthy home is one that supports health.
Why Now?
We sit poised at a unique moment to take on the task of reframing fracking. While new drilling in some places appears to be on the decline, countless large-scale petrochemical projects, like a growing crop of plastic-producing ethane crackers in the northeast US, are ramping up. These facilities will demand massive supplies of natural gas and byproducts, perpetuating and likely increasing drilling.
Engagement is urgent and timely,2 and the entire country has a role to play. This moment in our energy history is a chance for all of us – those affected by, in favor of, concerned about, eager to welcome, or otherwise learning about UOGD – to get clear on our frame of understanding fracking.
A pipeline right-of-way, about 200 yards behind this house and children’s swingset, shows how close fracking infrastructure comes to homes. Photo credit: Leann Leiter
Why a “Healthy Homes” Frame?
Proponents of frames that endorse fracking often live at a considerable distance from the processes involved,3 buffering them and their families from its impacts. According to researchers4 who listened to the testimonies of residents at a community hearing, the distance they lived from the industrial activities shows up in how they talk about fracking. Those in favor tend to use a depersonalized, “birds-eye view” in describing the impacts. People for whom the negative impacts are or will be a part of their lives rely on more descriptive, specific, and place-based language.
Similarly, a frame that focuses on household impacts emphasizes the on-the-ground, lived experience of living near fracking infrastructure. This frame approaches the debate on fracking by continually asking, what is this like for the people who live with the process? What are the impacts to their home environment? Such a frame does not ignore large-scale issues of jobs and energy supply, but grounds these bigger questions with the real and urgent consequences to the people who are suffering.
Household impacts
Despite rulings that define UOGD as an industrial process, drilling companies locate all manner of infrastructure – wells, pipelines, compressor stations, among others – in areas formerly residential or agricultural. Rules dictating distances from UOGD facilities to structures like houses vary by municipality and state. Yet, these new and often imposing facilities repeatedly occupy the immediate view of homes, or are within close proximity that defy medical and safety warnings.
Video: Glaring light of burning flares and noises both droning and sudden, along with major truck traffic and other changes to the immediate landscape around the household, produce high levels of stress, leading to its own health problems, creating an environment where water may become unsafe to drink and breathing the air becomes a hazard.
The Oil & Gas Threat Map (by Earthworks and FracTracker) shows the populations within a half-mile “threat radius” of infrastructure that includes fracking – close enough for residents to be exposed to contaminated air emissions, and possibly smell disturbing odors, hear loud sounds and feel vibrations, and see bright lights and the fire of emergency flares. As confirmed by the EPA, in some cases, UOGD results in contamination of drinking water, as well.
Researchers at The Environmental Health Project (EHP) offer individual health assessments to residents living in the shadow of fracking operations. In a physician’s thorough review of over 61 assessments, they identified the following symptoms to be temporally related to gas activity:
Table 1. Symptoms temporally related to UOGD
SYMPTOM CATEGORY
n
%
Symptom
n
%
UPPER RESPIRATORY SYMPTOMS
39
64%
Nose or throat irritation
25
41%
Sinus pain or infections
17
28%
Nose bleeds
8
13%
CONSTITUTIONAL SYMPTOMS
33
54%
Sleep disruption
26
43%
Fatigue
13
21%
Weak or Drowsy
9
15%
NEUROLOGICAL SYMPTOMS
32
52%
Headache
25
41%
Dizziness
11
18%
Numbness
9
15%
Memory loss
8
13%
PSYCHOLOGICAL SYMPTOMS
32
52%
Stress or anxiety
23
38%
Irritable or moody
12
20%
Worry
6
10%
LOWER RESPIRATORY SYMPTOMS
30
49%
Cough
21
34%
Shortness of breath
19
31%
Weezing
14
23%
GASTRO-INTESTINAL SYMPTOMS
27
44%
Nausea
13
21%
Abdominal pain
12
20%
EYE SYMPTOMS
23
38%
Itchy eyes
11
18%
Painful or dry
10
16%
DERMATOLOGICAL SYMPTOMS
19
31%
Rash
10
16%
Itching
7
11%
Lesions or blisters
6
10%
CARDIAC SYMPTOMS
17
28%
Palpitations
9
15%
Chest pain
6
10%
Other cardiac symptoms
6
10%
HEARING CHANGES OR TINNITUS
10
16%
Hearing loss
3
5%
Tinnitus (ringing in the ear)
10
16%
MUSCULOSKELETAL
10
16%
Painful joints
9
15%
Aches
7
11%
ENDOCRINE
7
11%
Hair loss
7
11%
n = Number of patients reporting symptom, out of 61 patients assessed
% = Percentage of patients reporting symptom, out of 61 patients assessed
Mental and emotional stress can exacerbate and create physical health symptoms. For households close to fracking, the fear of a disaster, like a well pad fire, or concern for the long term health effects of exposures through air and water can create serious stress. These developments change communities, sometimes in divisive, negative ways, potentially adding to the stress.
Fracking, a disruptive, landscape-altering process can also produce what’s called solastalgia, whereby negatively-perceived changes to the land alter a person’s sense of belonging. In the case of fracking in residential areas, people may lose not only their relationship to the land, but their homes as they once knew them.5 Solastalgia, considered by some researchers to be a new psycho-social condition, is “the lived experience of the physical desolation of home.”6
When Home is Unsafe, Where to Get Help
Click to expand and explore the tri-fold. Click here to access and print this free resource, and many others by EHP.
EHP offers a new resource for protecting your health at a household level, called: “Protecting Your Health from Unconventional Oil and Gas Development.” We created this free informational resource in collaboration with residents and health care providers in four different shale gas counties.
The final product is the direct result of input and knowledge from 15 focus groups and project meetings in these affected communities with over 100 participants, including residents and healthcare providers. EHP has packed this resource with practical steps for households amid shale gas development to limit their exposure to air and water contamination that may be associated with fracking.
For follow-up questions, or for free personalized health services for those experiencing fracking-related exposures, you can contact EHP directly at 724-260-5504 or by email at info@environmentalhealthproject.org.
Re-Centering Home in the Fracking Debate
Putting affected households at the center of the fracking debate better reflects the experiences of people on the front lines. This powerful frame could help counter the power of those who speak positively about fracking, but lack direct experience of the process.
For those at the frontlines of fracking, the intent is that these resources and tools will help you protect your health and your homes.
For those not yet directly affected by fracking, you can lend a hand. Show support for health protective measures by signing up at EHP for updates on events, education, and opportunities to make your voice heard. And, whenever and wherever you can weigh in on the debate, put a frame around fracking that puts impacted households at the center.
References
Cooley, R., & Casagrande, D. (2017). Marcellus Shale as Golden Goose. ExtrACTION: Impacts, Engagements, and Alternative Futures.
Short, D., Elliot, J., Norder, K., Lloyd-Davies, E., & Morley, J. (2015). Extreme energy, ‘fracking’ and human rights: a new field for human rights impact assessments?, The International Journal of Human Rights, 19:6, 697-736, DOI:10.1080/13642987.2015.1019219
Cooley, R., & Casagrande, D. (2017). Marcellus Shale as Golden Goose. ExtrACTION: Impacts, Engagements, and Alternative Futures.
Mando, J. (2016). Constructing the vicarious experience of proximity in a Marcellus Shale public hearing. Environmental Communication, 10(3), 352-364.
Resick, L. K. (2016). Gender, protest, and the health impacts of unconventional natural gas development. In Y. Beebeejaum (Ed.), The participatory city (pp. 167-175). Berlin: Jovis Verlag GmgH.
Albrecht et al (2007). Solastalgia: the distress caused by environmental change, Australasian Psychiatry . Vol 15 Supplement.
By Leann Leiter, Environmental Health Fellow for the SW-PA Environmental Health Project and FracTracker Alliance
Feature photograph: A compressor station sits above a beautiful farm in Washington County, Pennsylvania. Photo credit: Leann Leiter
Eighty years ago, Southeastern Ohio was a wasteland of barren, eroding hills. During the 18th and 19th centuries this once heavily forested area in the Appalachian foothills had been clear cut and mined beyond recognition. When the Great Depression struck, lowering crop prices made farming unprofitable in the area, and 40% of the population moved away.
In 1933, President Franklin Delano Roosevelt established the Civilian Conservation Corps (CCC), a public work relief program that employed men aged 18-25 to do manual labor related to conservation and development of natural resources such as planting trees, constructing trails, roads, and lodges, fighting wildfires, and controlling erosion. The following year, Ohio’s legislature agreed to allow the federal government to purchase land in the state for the purpose of establishing a national forest. The Forest Service was tasked with restoring the land for what is now called Wayne National Forest (WNF). A tree nursery was established near Chillicothe, and with the help of the CCC and volunteers, including members of the Daughters of the American Revolution, garden clubs, and school children, reforestation began.
Photos Credit: US Forest Service
An Area on the Mend
Today, WNF comprises three units that span 12 Ohio counties in the Unglaciated Allegheny Plateau. The hills are covered in biologically diverse mixed mesophytic forest, which includes approximately 120 species of trees and provides habitat for at least 45 species of mammals, 158 species of birds, 28 species of reptiles, 29 species of amphibians, and 87 species of fish. The US Forest Service estimates that 240,000 people visit this ecological wonder annually, according to Forest Recreation Program Manager, Chad Wilberger, in Nelsonville, Ohio. The restoration of barren public land to its current state is a great achievement. If it continues to be protected, Wayne could one day resemble the old growth forest that thrived here before the arrival of European settlers.
The Bureau of Land Management (BLM), however, has recently decided to lease up to 40,000 acres of Wayne to gas and oil companies for horizontal hydraulic fracturing, or fracking. The first auction took place last December resulting in the lease of 700 acres. A second auction this March leased another 1,200 acres. Nearly all of this land lies within the 60,000 acre Marietta Unit of the forest. This brings Oil & Gas Expressions of Interest (EOI) acreage to roughly 7.5% of all WNF owned parcels in this unit.
Wayne National Forest and Adjacent Existing Oil and Gas Infrastructure Below is a map of the Wayne National Forest, along with parcels owned by WNF (shown in gray) and those that might be subject to unconventional oil and gas development (gray parcels outlined with dashes). We also include existing unconventional oil and gas infrastructure near the park. Explore the map below, or click here to view the map fullscreen.
Gas and oil development is not new to the Wayne. Since the passage of The Federal Land Policy and Management Act of 1976, the US Forest Service’s land management plan for WNF has included conventional drilling, and derricks are a common sight on both public and private land in southeastern Ohio.
Fracking (unconventional drilling), however, has a far greater impact, requiring clear cutting of large areas of land for the construction of concrete well pads, and the use of millions of gallons of water that will become contaminated during the process and then transported by truck to injection wells. Accidents can be catastrophic for workers and nearby residents, and fracking and waste water disposal have been linked to earthquakes in Ohio.
In 2012, BLM updated its WNF Land and Resource Management Plan to allow fracking in the forest without conducting new impact studies.
What is at risk?
The Marietta Unit of the WNF is located in Monroe, Perry, and Washington counties in Southeastern Ohio along the Ohio River. Within its boundary are a wealth of trails used for hiking, backpacking, horseback riding, and mountain biking, campgrounds, and waterways ideal for kayaking and fishing. Both the highest and lowest points in the Wayne lie in this unit, as does the Irish Run Natural Bridge. The area is also known for its exceptional wildflowers, as shown in the photos below.
One popular recreation area, Lamping Homestead, lies directly within an oil and gas Expression Of Interest (EOI) parcel #3040602400 (See Map Above), one of the areas under consideration for lease. In the 1800s, it was the site of the Lamping family’s farm, but today all that remains of the settlers is a small cemetery with an iron gate atop a hill overlooking a small lake. Six campsites are situated around the western side of the lake, and two intersecting hiking loops rise into the wooded hills to the east. On the western side of the parking lot is a covered picnic area. A creek flows out of the lake and into Clear Fork, a tributary of the Little Muskingum River, across the road from the parking lot.
Both the lake and stream are popular boating and fishing areas. Lamping is an excellent spot for wildlife viewing. The lake, the creeks that flow in and out of it, and the surrounding wooded hills support an impressive variety of plant and animal species. During the day, visitors might spot ducks, geese, great blue herons, red-winged blackbirds, summer tanagers, red spotted newts, box turtles, northern water snakes, garter snakes, deer, rabbits, and muskrats. At night, they could be greeted by a cacophony of voices from frogs, owls, and coyotes.
Species of trees, plants, and fungus are also numerous. In winter, stands of white pine pop out against the bare branches of oak, hickory, maple, buckeye, and other deciduous trees. In spring, eye-catching splotches of blooming dogwood and redbud contrast against the many shades of green. But hikers who pull their gaze away from the brightly colored canopy and look down are rewarded with an abundance of wildflowers and the butterflies they attract, as well as many varieties of mushrooms and fungus, including such edible varieties as morels, wood ear, and dryad’s saddle.
Estimating Disturbances
It is unclear how much surface disturbance would occur on public land if this parcel were to be fracked, but even if the well pad and pipelines were constructed on private land adjacent to the forest, in order to drill under the forest, the public land and its inhabitants and visitors would certainly be impacted.
There is no question that noise and air pollution from traffic and construction would be disruptive both to wildlife and to human visitors. Explore various photos of the oil and gas industry in the gallery below:
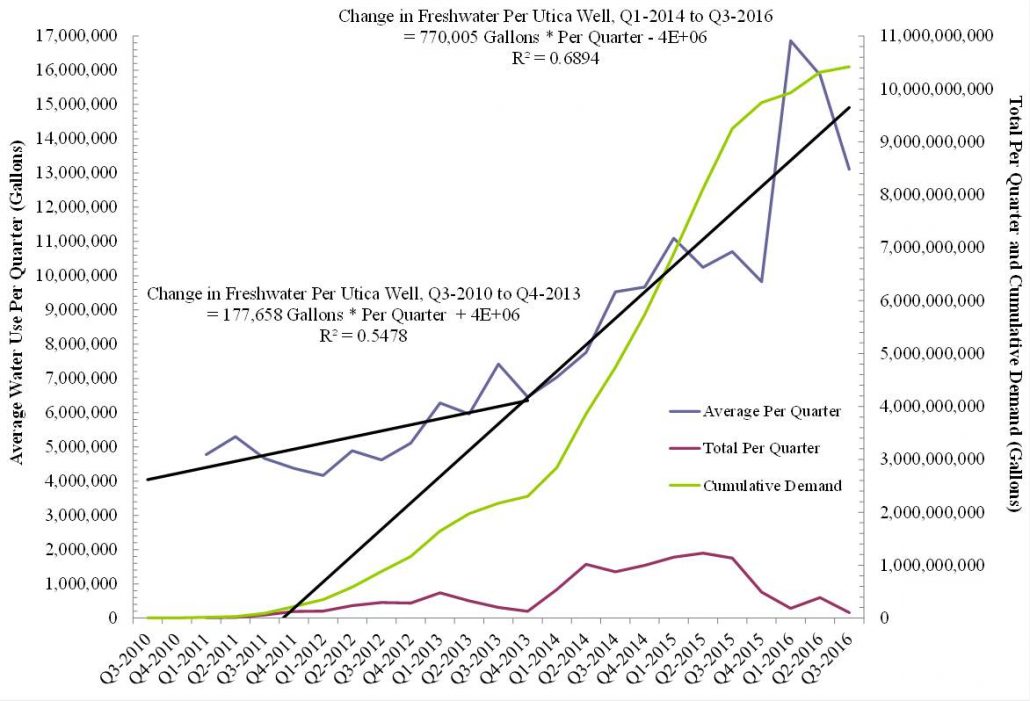
The extraction process requires 2 million to 6 million gallons of fresh water each time a well is fracked. The rate at which hydraulic fracturing’s water demand is increasing on a per-well basis here in Ohio reached an exponential state around Q4-2013 and Q1-2014 and continues to rise at a rate of 3.1 million gallons per well per year (Figure 1).
Ohio Hydraulic Fracturing Total and Per Well Freshwater Demand between Q3-2010 and Q3-2016.
In Ohio, oil and gas companies are allowed to pull this water directly from streams and rivers at no cost. All this is possible, despite the fact that after its use it is so contaminated that it must be disposed of via injection wells and is permanently removed from the water cycle. The industry is already pulling water from streams in the Marietta Unit of the WNF for use in fracking on private land. Fracking public land simply means water withdrawals will occur on a much larger scale.
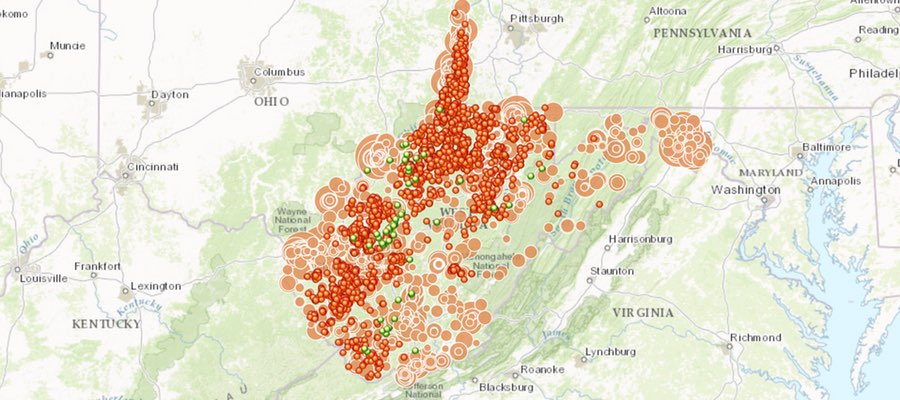
Ohio and West Virginia Shale Water Demand and Injection Waste Disposal This map shows Utica wells weighted by water demand and disposal (and/or production). It also depicts water, sand, and chemical usage as well as injection waste and oil production. Explore the map below, or click here to view map fullscreen.
Inevitable methane leaks, in addition to contributing to climate change, affect humans and wildlife in their immediate vicinity, causing headaches and nausea and even killing trees and plants.
In addition to the anticipated harm that fracking inflicts upon a natural area, there is also a risk of accidents with potentially devastating consequences. Residents of Monroe County have already seen a few in recent years from fracking on private land. In 2014, a well pad fire in the village of Clarington resulted in a chemical spill that contaminated nearby Opossum Creek, killing 70,000 fish. The same year a large gas leak 15 miles south in the village of Sardis resulted in the evacuation of all homes within half mile radius.
Recent studies have shown that extraction wells, in addition to injection wells, can cause earthquakes. Unsurprisingly, Monroe County has seen a spike in seismic activity with the increase in fracking activity in the area. The most recent incident was a 3.0 magnitude earthquake in the forest less than five miles from Lamping Homestead in April of this year.
Supporters of Wayne National Forest
Many people have repeatedly spoken out against BLM’s plan, submitting a petition with more than 100,000 signatures, and protesting outside Wayne National Forest Headquarters and Athens Ranger Station in Nelsonville. They have even organized voters to call and write letters to Regional Forester Kathleen Atkinson and legislators, including Senators Sherrod Brown and Rob Portman, and Governor John Kasich. BLM has not budged on its decision, unfortunately, insisting that leasing this land for fracking, and associated infrastructure buildout, will have “no significant impact.”
This May, the Center for Biological Diversity, Ohio Environmental Council, Ohio Sierra Club, and Heartwood, a regional organization focused on protecting forests, filed a lawsuit against BLM, aiming to void BLM leases and halt all fracking operations within the national forest.
Concerned citizens continue to organize raise awareness as they await the outcome of the suit.
Becca Pollard is Freelance Journalist and Co-founder of Keep Wayne Wild
Data Downloads
Click on the links below to download the data used to create this article’s maps:
https://www.fractracker.org/a5ej20sjfwe/wp-content/uploads/2017/05/Wayne-National-Forest-Feature.jpg400900Guest Authorhttps://www.fractracker.org/a5ej20sjfwe/wp-content/uploads/2025/09/2025-Wordmark-Logo.pngGuest Author2017-05-24 11:35:532021-04-15 15:03:02Wayne National Forest Could Be Deforested – Again
That’s one way to describe climate change. It proceeds ahead of schedule, threatening to wreak havoc on the world we know. No longer merely flirting with disaster, we’re tangled in a frenetic dance to save ourselves. Our friends at Years of Living Dangerously have vividly captured the scale of what’s at stake.
Meanwhile, a laundry list of deplorable measures by President Trump ignores or outright dismantles America’s capacity to respond. Federal investment in clean energy is forsaken. Retro economics reigns replete with dystopian impacts on people and the planet. It could be 1950 all over again. Then, we were blinded by the future – fooled that oil and ingenuity would win the day. Today we are sobered by it. Only wholesale change can get us to tomorrow.
The technologies and bright ideas are ready for broader deployment. They’re propelled by information, action, and unbridled hope. Hope feeds exponentially on the hope of others. The organism grows more powerful and adept through colonial enrichment.
Saturday’s Climate March, the People’s Climate Movement, is the feast of a lifetime, a chance to nurture our souls and make a statement for the generations. By bike, rail, bus or carpool, head to Washington, DC or a satellite March site on April 29th. Put on your earth shoes, walk in solidarity, and make the deniers shake in their sole-less shoes.
And don’t for a second think this will be the last word. When you’re choking Mother Earth, it’s a fight to the finish. Cooler heads prevail.
By Brook Lenker, Executive Director, FracTracker Alliance
https://www.fractracker.org/a5ej20sjfwe/wp-content/uploads/2017/04/Earth-Shoes-March-Feature.jpg400900Guest Authorhttps://www.fractracker.org/a5ej20sjfwe/wp-content/uploads/2025/09/2025-Wordmark-Logo.pngGuest Author2017-04-25 14:49:082021-04-15 15:03:09Put on Your Earth Shoes
In 4th grade, every Wisconsin student learns about their state. Topics pertaining to Wisconsin’s economy, geography, and history along with ethnicity and traditions are introduced and explored. State facts and anecdotes are discussed and naturally memorized. The one that stood out to me the most was how Wisconsin became known as the “Badger State.”
The origin of the badger nickname is from mining. The 4th grade story I remember was that miners were too busy to build houses so they moved into abandoned mineshafts and/or dug their own burrows. These men became known as “badgers.” The 4th grade version of myself thought that was real impressive. I pictured strong, hard working men fiercely toiling away in the earth like mythical creatures, helping make Wisconsin what it is today.
It made for a great story.
Back to Reality
The reality and documentation of the times suggests something different. Most miners lived in cabins or other structures above ground. There most certainly were a few outliers on the fringe of mining society who burrowed their own holes or lived in abandoned underground mines, but the adult version of myself has a hard time imagining that the term used to describe such men – badgers – was used as a compliment.
Either way, the result is the same. Word spread and eventually Wisconsin became known as the Badger State. The state may be known worldwide for its cheese and agriculture, but there was mining in Wisconsin long before the first dairy cow. While the state was earning its nickname, mining was a prominent reason for the early success of the region.
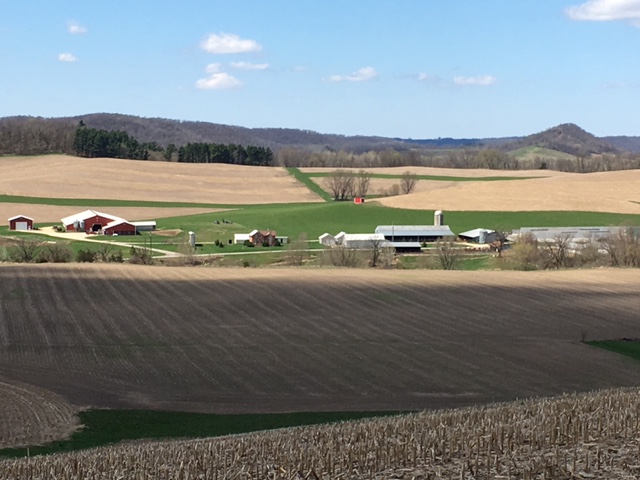
Dairy Farming in WI
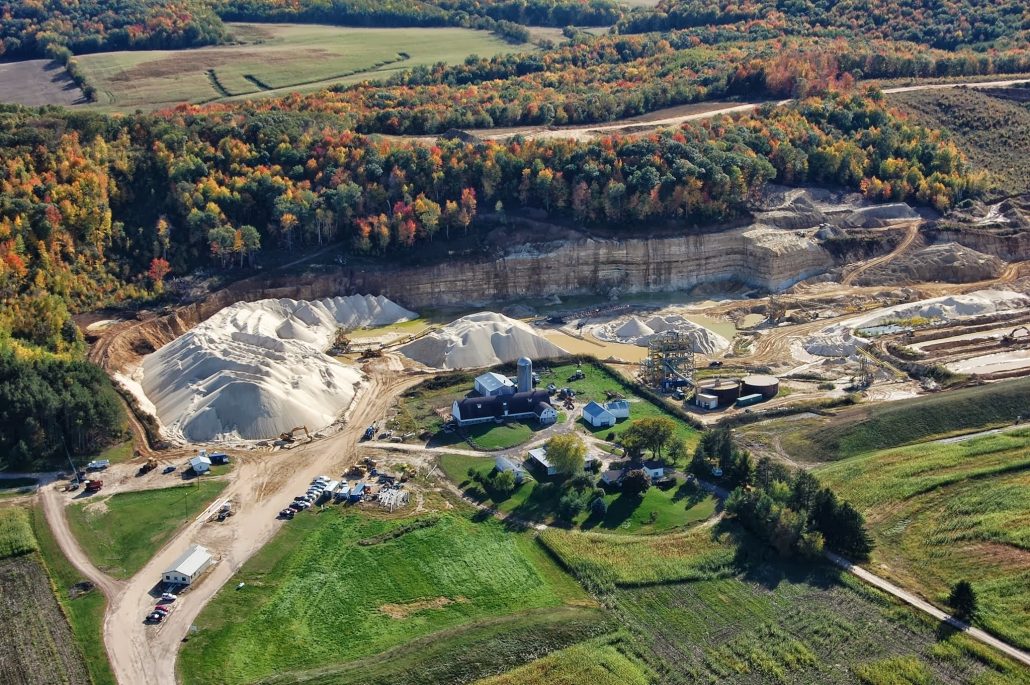
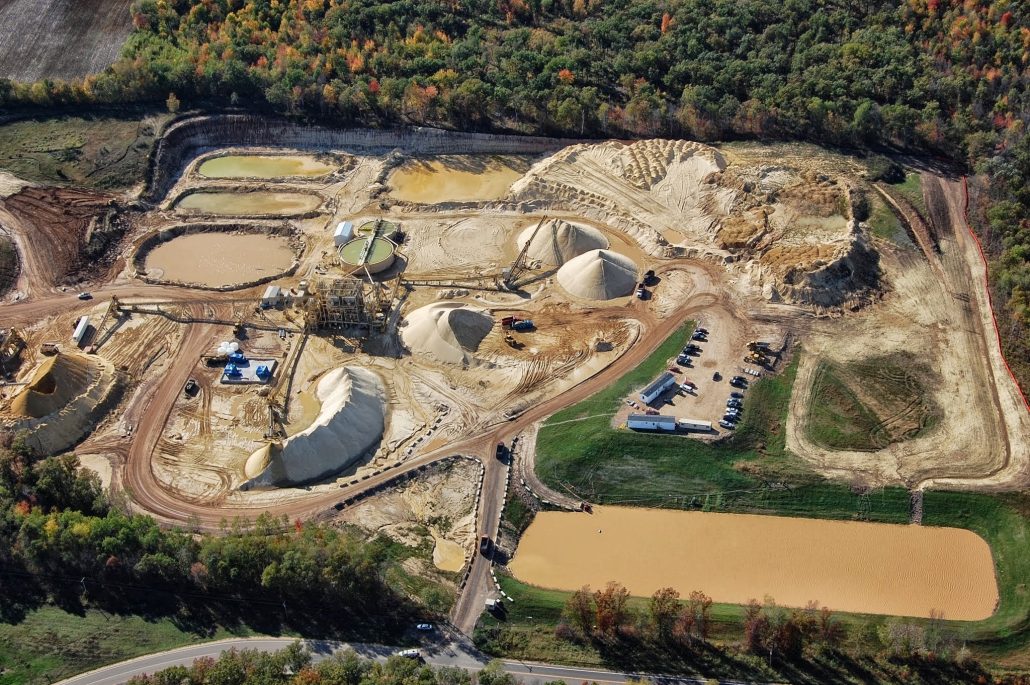
The 700 acre Jereczek Homestead Dairy in Dodge Township, Trempealeau County, Wisconsin first established in 1873 and now being operated by the 6th generation of Jereczeks.
Our farm is in Trempealeau County, Wisconsin – a driftless area – meaning the land was not covered by glaciers during the last ice age. The terrain is hilly and uneven, with tree-topped bluffs and hills overlooking valleys. The valleys, ranging from deep and narrow to wide and shallow, bump and flow into each other. Over the years, our farm has received its fair share of breaker rock, crushed rock, and gravel from the prevalent rock quarries. Sandstone deposits are huge and close to the surface. As a kid, there was a ledge in the cow pasture, where I hunted through chunks of sandstone for fossils.
As with everything else in the world, dairy farming continues to change. Most barns sit derelict and hold only memories of cows as they fade into the landscape. Small farms that clung to the valley walls have been sold to bigger operations, sit vacant, or have been built over. A lot of once prime farmland has been converted into houses with ridiculously large lawns. In 1990, Wisconsin had over 34,000 licensed dairy herds. Now there are just over 9,000.
We are the last dairy farm in our valley. Parallel to the trend, my childhood herd of 40 cows has turned to 200, which is about an average-sized herd. Margins are tighter than ever. Consistent help is hard to find. Milk prices are a terrible rollercoaster ride – it seems to take forever for them to go up, but when they fall, it’s fast and sickening. In the dairy business world, survival is a measure of success.
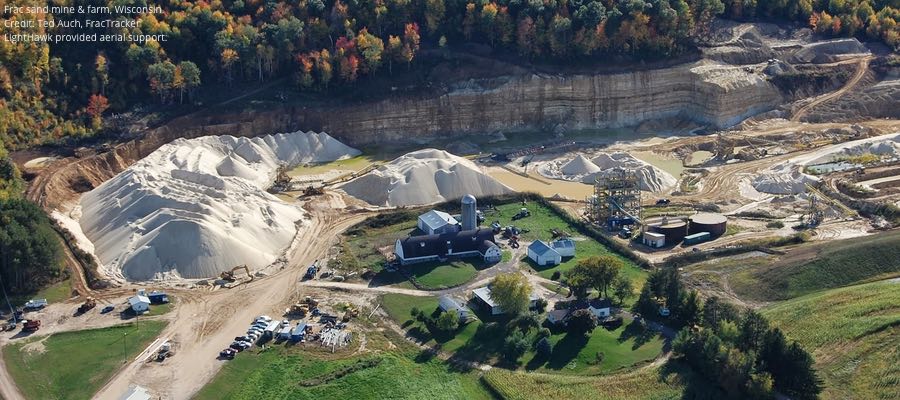
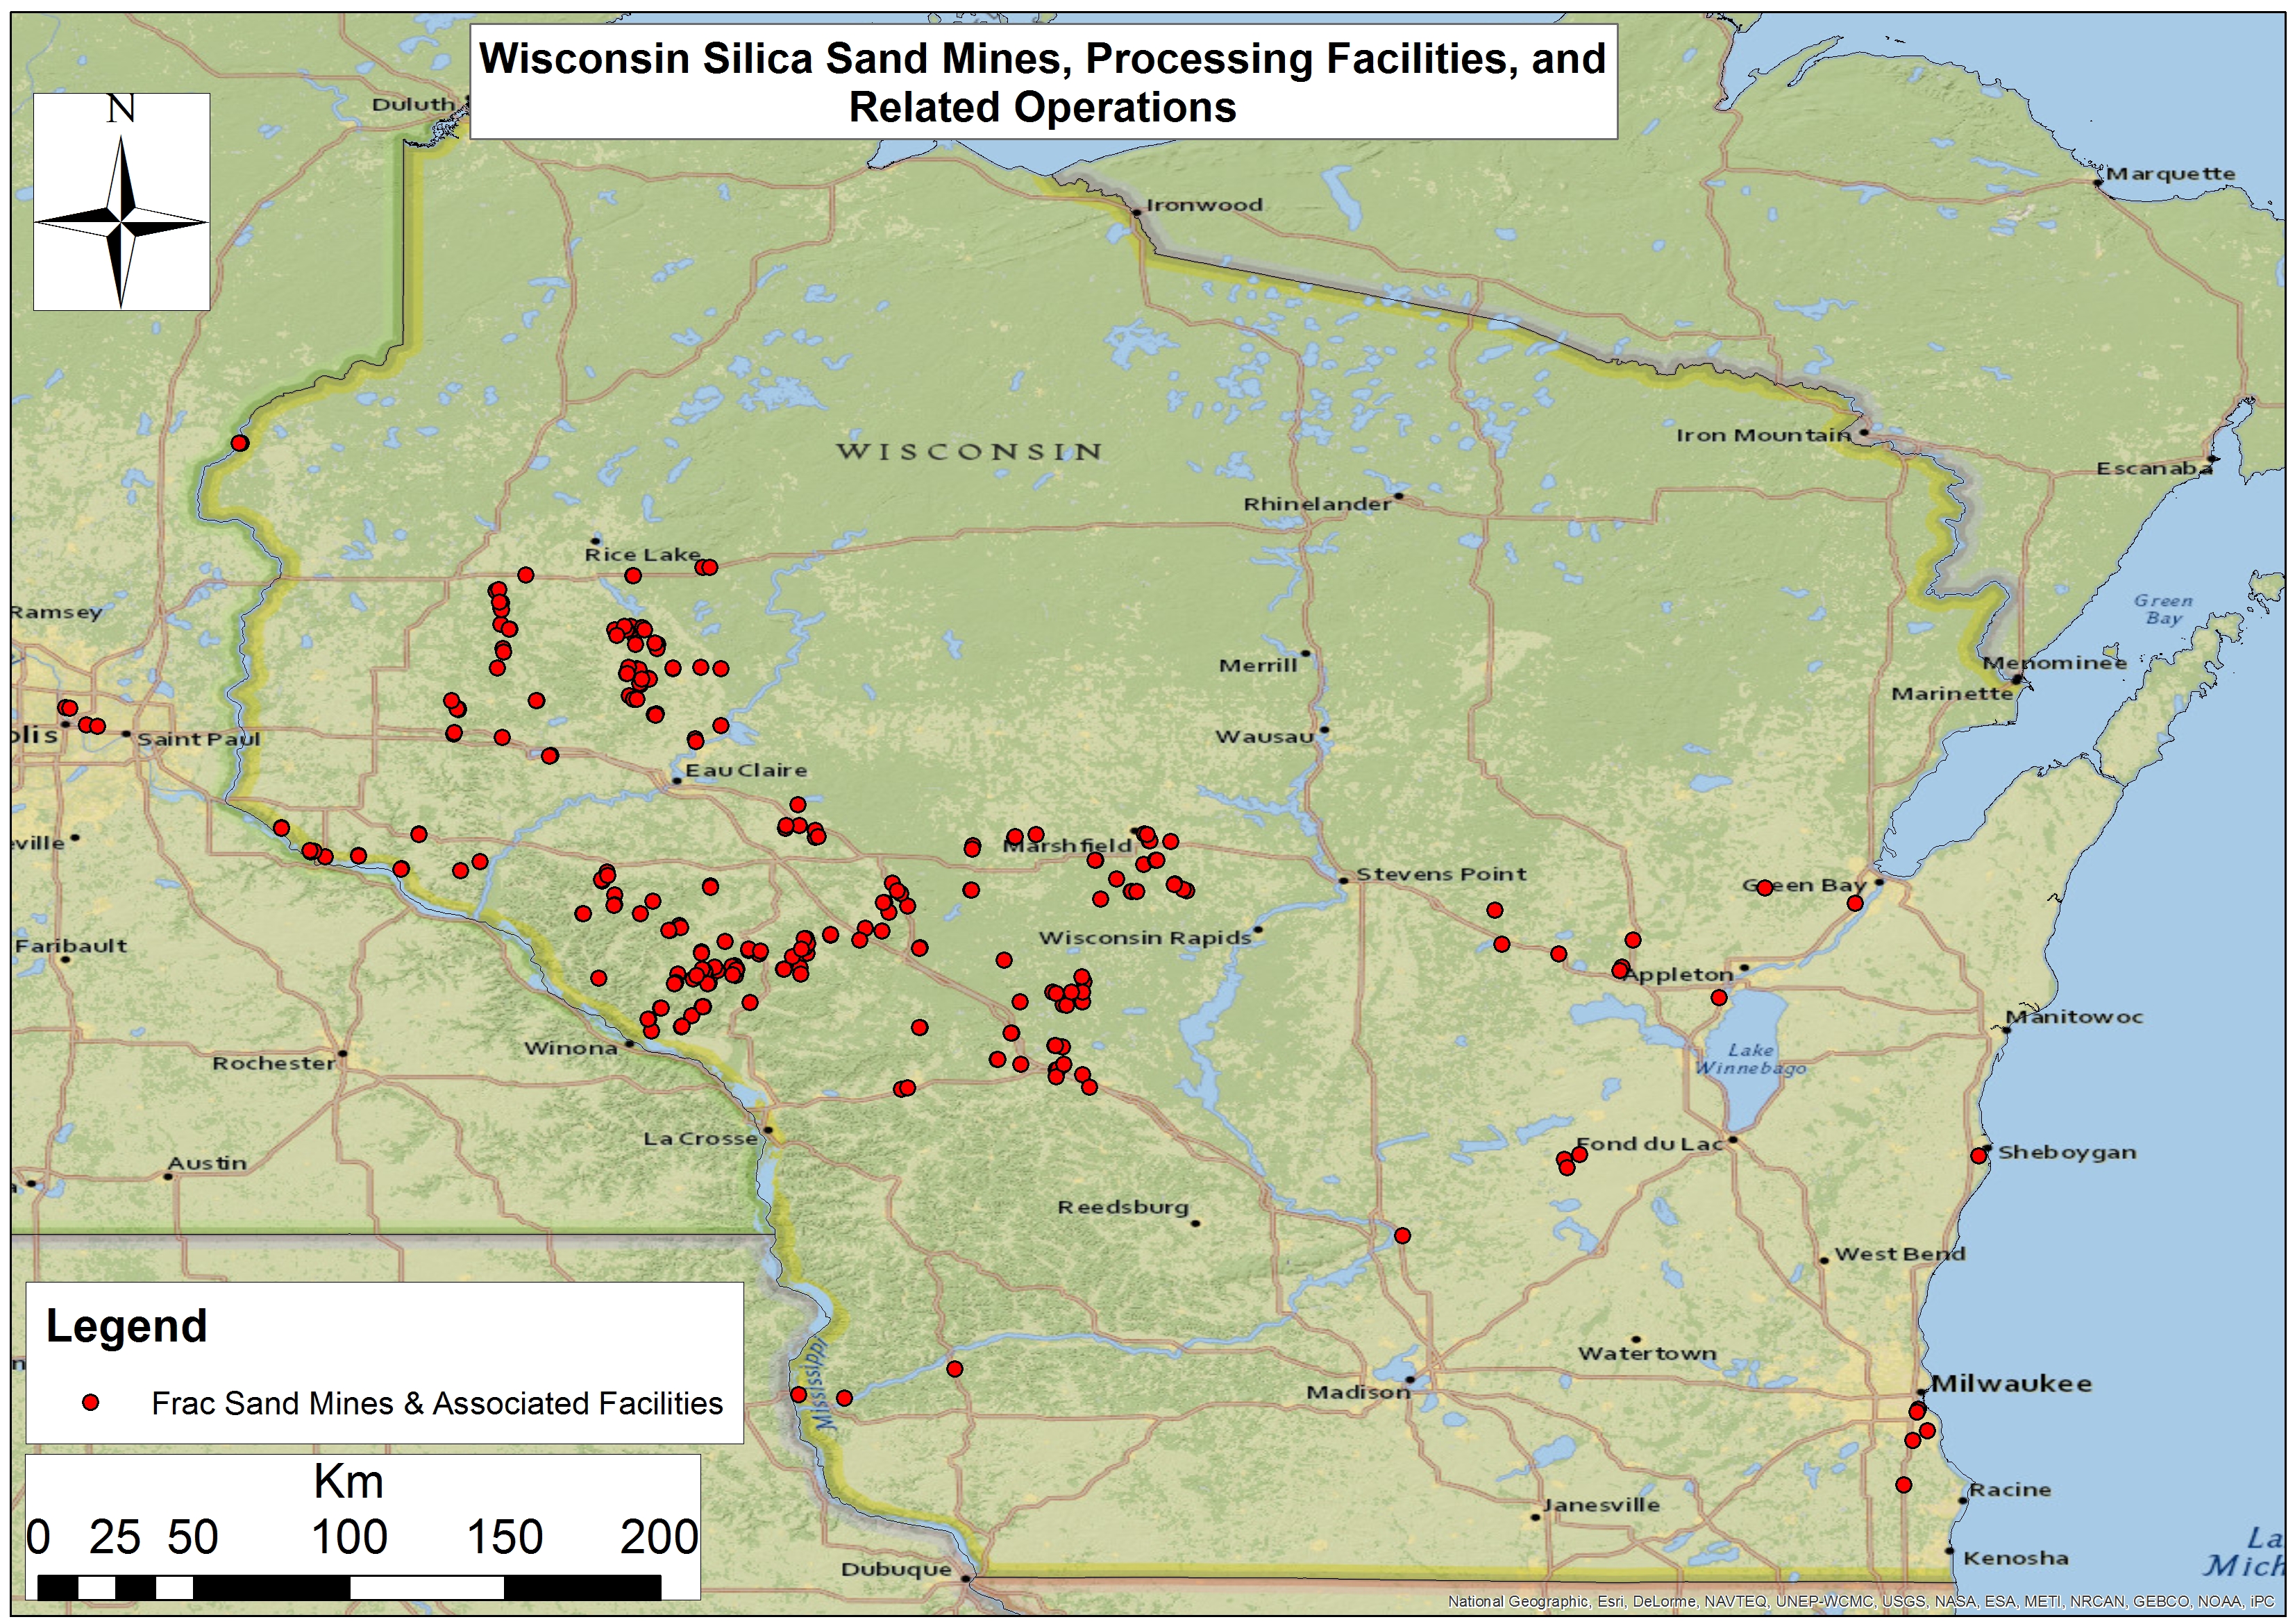
Frac Sand Mining Perceptions
Wisconsin Frac Sand Mines, Processing Facilities, and Related Operations
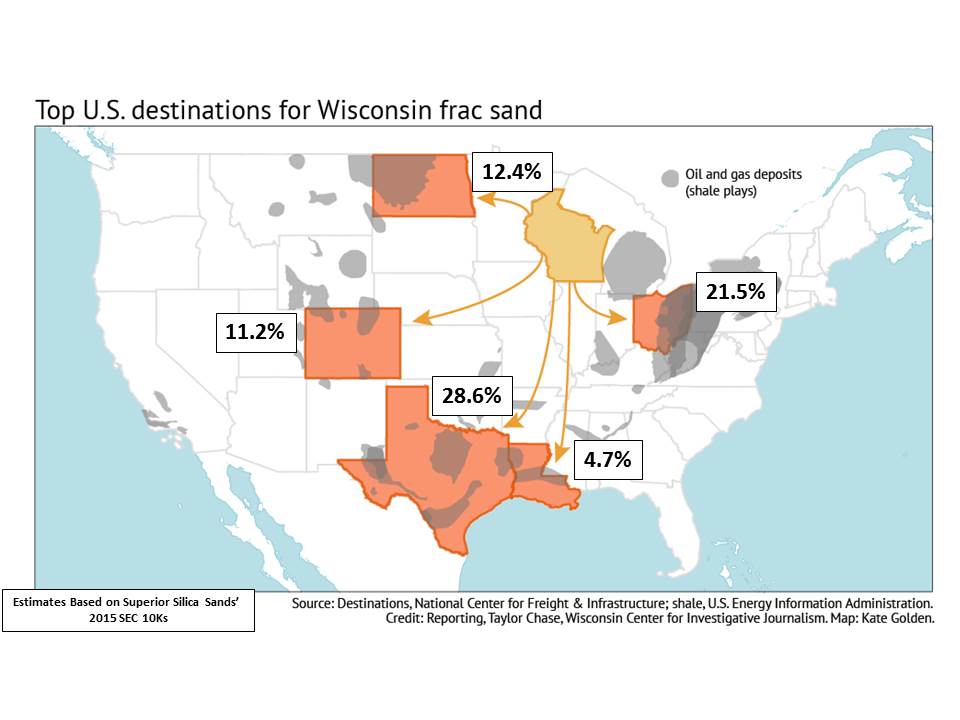
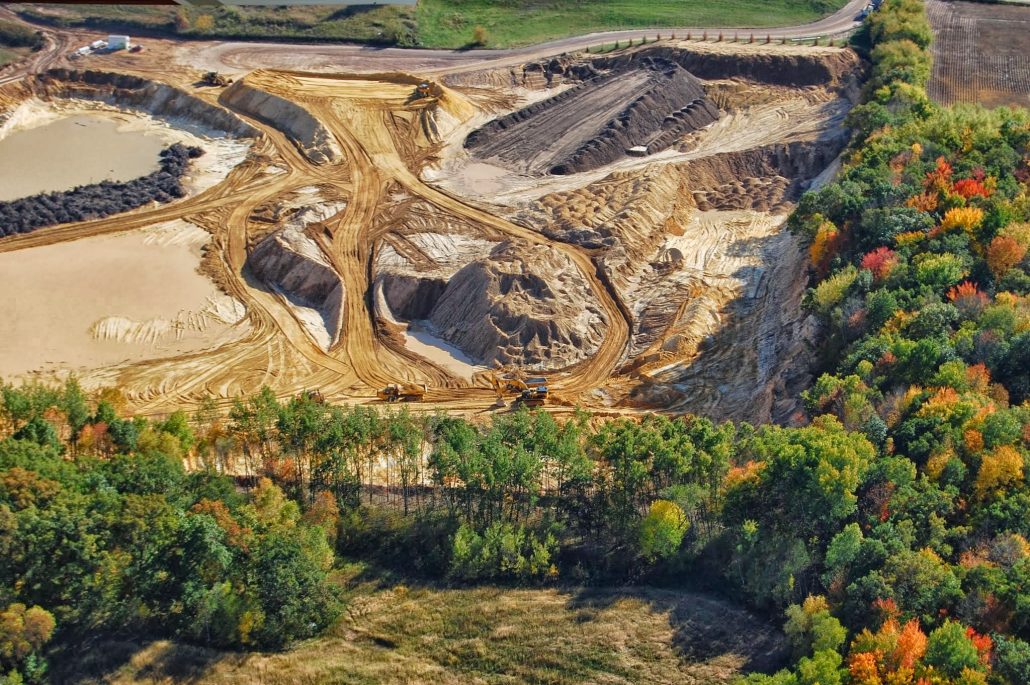
The term frac sand is relatively new to me. I always assumed sand was sand and had given the word sand a negative connotation. Sand’s large particles don’t hold moisture or nutrients well, so sandy fields tend to perform poorly. But what if that sand has value for something else? What if there is a market for this sand much like a market for corn or soybeans?
Farmers tend to be resourceful. Every asset is scrutinized and employed to the fullest. Every acre is pushed. But what about what may lie beneath the soil? Sand mining has been going on in Wisconsin for well over a hundred years, but the recent surge in fracking has created an enormous demand for frac sand – and there are many people and companies set to take advantage of the boom.
Top U.S. Destinations for Wisconsin’s Frac Sands Estimated from Superior Silica Sands’ 2015 SEC 10Ks
Trempealeau County has zoning and planning ordinances to protect its industries and way of life. These aggressive ordinances allow more citizen input than other county’s ordinances. Public hearings are required, and orderly processes are enforced. With the economics involved with frac sand mining, citizens got educated very quickly. Much like abortion or immigration, frac sand has become a polarizing subject. Strong emotions built up by personal ideologies have pushed this topic to a boiling point. The for and against groups trade barbs without much convincing being done on either side. Frac sand mining editorials are common in local papers with those against appearing to be the most vocal and emotional.
New Player, New Approach
One such editorial detailed the approach a sand company took to obtaining a property. A local farmer had a sand mine company representative approach him with an oversized check written out to him for a sizable amount of money for his land. It was as though the sand rep was taking a page out of the Publishers Clearing House’s playbook. The farmer turned down the check. The sand rep left and returned a short time later with a significantly larger offer. The farmer was equally surprised and insulted. He found out later a few neighbors turned down similar proposals.
So what’s the deal with such a brazen approach? Intentions from this company may well have been good. Many people believed the sand mines were a win-win opportunity. Companies were selling hype – there was no way for anything but success. Extreme optimism. Sand mines were going to increase the tax base, fund schools and roads. Concerns were minimized, and residents were told what they wanted to hear. Such talk produced plenty of skeptics.
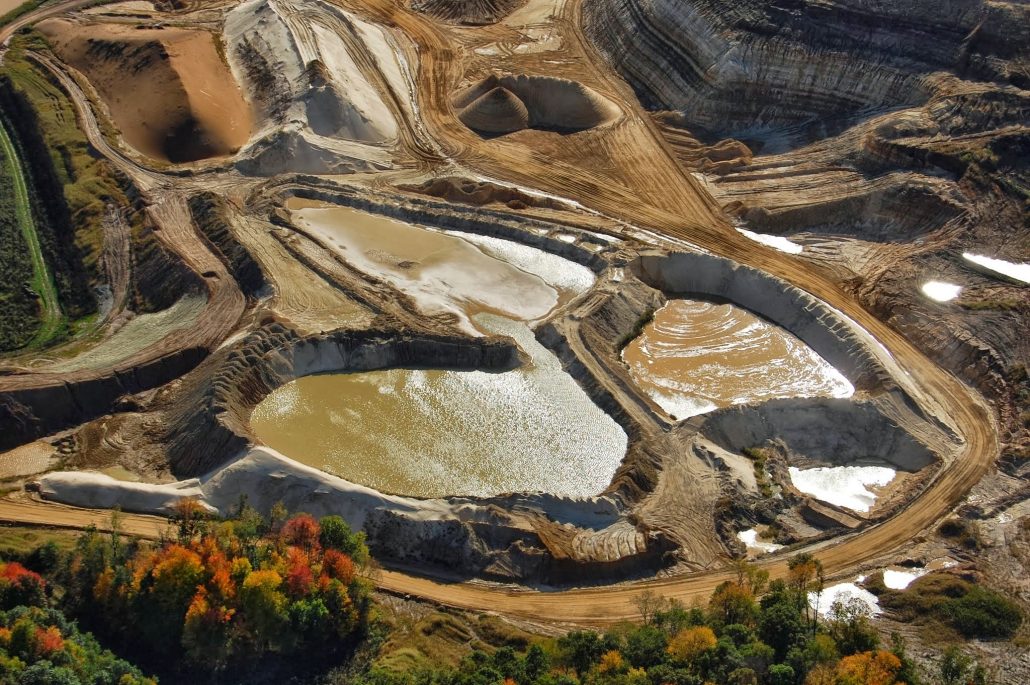
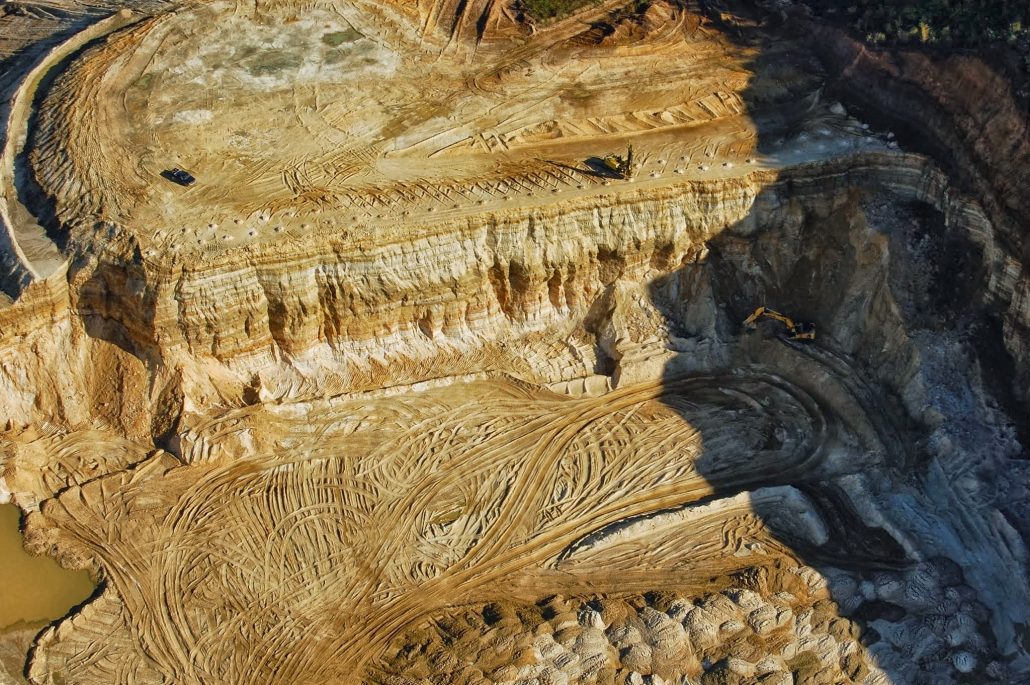
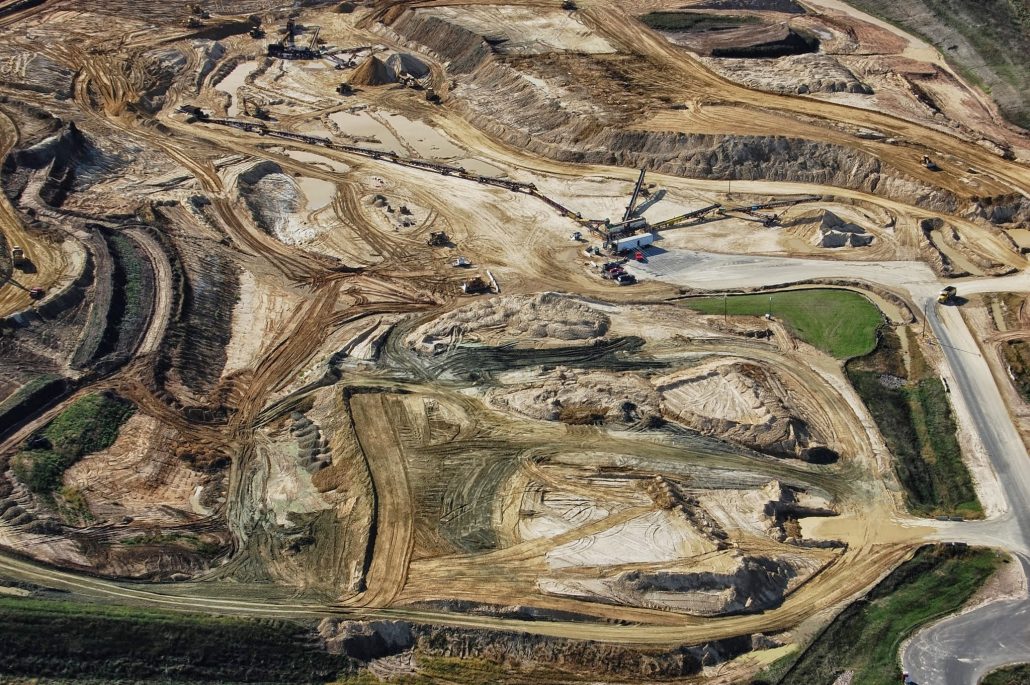
Environmental Costs of Frac Sand Mining
With both dairying and fracking, there is an environmental cost. Whether you milk 10, 100, or 1,000 cows – there are environmental pressures. With sand mining, the environmental effects are well documented. It is important, if not just practical, to measure these with the fiscal rewards. And where does this money go and who benefits the most? But, most importantly, who must deal with the consequences?
The risks of sand mines can be mitigated if proper regulations are taken seriously. With the extra scrutiny, a magnifying glass was placed over the sand mines, and what was found only proved the skeptics right. Trapping or pooling storm water seemed to be a learning process for sand mine companies; reported in 2012, every operating sand mine in Trempealeau County had storm water runoff violations. In 2014, over half of the sand mines in all of Wisconsin had violated environmental regulations imposed by the Department of Natural Resources. Add to this loss of surrounding property values, damage to roads, and a damper on quality of life – and you’ll create a substantial amount of public backlash.
As was mentioned earlier, mining Is not new to the state. There are many multi-generational mining companies who have the experience, tradition, and financial network to abide by current standards and environmental regulations. Nobody likes to be told what to do. No industry is out there begging for more regulations. Often, the rules are in place to protect – not hinder – those that use environmentally safe and humane practices. Dairying has its own unique regulations – some are good, some not so much, and some downright stupid. Yet, overall it can be argued that these regulations protect the industry and the environment.
One heated topic in the dairy industry involves the sale of raw (unpasteurized) milk. It is illegal for any dairy in the state to sell raw milk. I have been drinking raw milk straight from the bulk tank since before I can remember. Our whole family did. Now, I still drink it and so do all my children from the age of a year and a half on up. None of us has ever had trouble with it. However, I am in complete agreement that the sale of raw milk should be illegal. All it takes is for one child to get terribly sick (which most certainly would happen) and for that kid lying on a hospital bed being blasted by every news network in the nation. These images create strong negative emotions that reverberate throughout society. The potential costs far outweigh the economic benefits from such a sale. Sure, some people are upset, but the greater good is maintained by taking away a risky practice.
The same principle works for mining. Rules and regulations get negative press and reaction, but who stands to lose the most from environmental catastrophes related to mining – the company in business 90-some years or the startup mining ventures trying to capture lightning in a bottle? Some companies have built years of trust and compatibility and support for their local communities. These are businesses that will remain after the sand rush has fizzled.
Booms and Busts, Ups and Downs
The frac sand industry is going through the same economic cycle as the dairy industry. The sand companies are getting better at what they do and increase their production capacity. Like milk, sand is a commodity. As the price of sand decreased, production increased to maintain profits. The dairy industry does the same thing, by expanding and improving efficiency to get more milk to catch those dollars slipping away. However, when the market is flush with milk or bombed with sand, they’re just doing more damage to themselves. This is a simplified take on the industry, as there are many global factors that come into play, but the overall pattern tends to remain. As the dairy industry can attest, this fluctuating cycle is not sustainable for all producers.
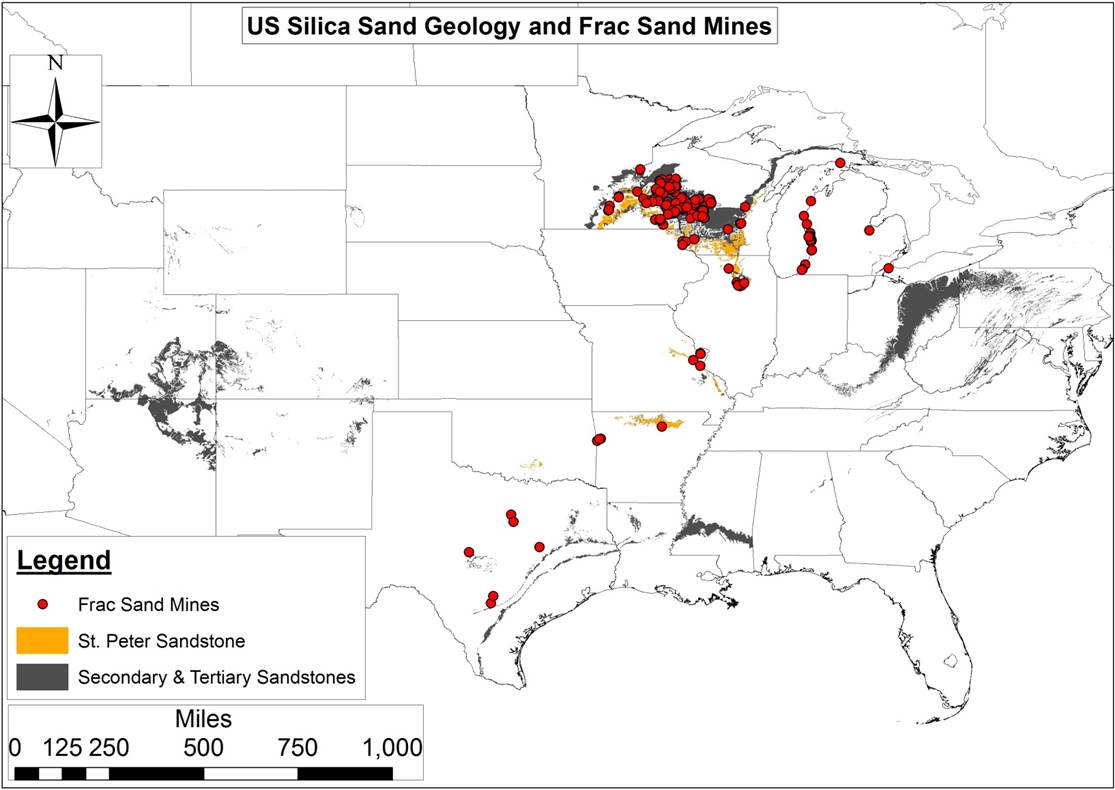
Primary and Secondary US Silica Sand Geologies and Existing Frac Sand Mines
Worse yet for the sand industry, this cycle has occurred in hyper speed. At first, just the small mines cut production. Outcompeted by larger operations, production at smaller mines was no longer profitable. Soon, the larger mines cut production due to the weakening demand. Many mines in the permit or early production phases never got started. Unlike the dairy industry, there was no rollercoaster effect because prices have yet to return to prior levels. The bubble, it seems, had popped.
With any kind of new mine developed comes the environmental impacts. Yet, I find the fervent negative reaction to such practices directly related to the end result. Fracking. Fracking isn’t magic. They’re not just mixing water with this sand and forcing oil and gas out of the ground. Harmful chemicals are being added to the mix. Worst yet, the quantity and potency of such chemicals is kept secret, closely guarded from the public. Harmful chemicals are being legally pumped into the ground. All the short-term gains will have long-term consequences. This is where I believe a significant backlash for new mines comes from. The end result. Can you imagine what the public’s perception of dairy farms would be if milk was mixed with chemicals and pumped into the ground?
The Future of Dairy Farming in Wisconsin
The 2016 presidential election has breathed some life into the frac sand industry. The new president promises to cut regulations interfering with business, and thus far has kept those promises. The environment will not be a detriment to his goals. Sand companies are returning with ads in the local papers, looking for qualified applicants and offering great salaries. In contrast, the dairy industry is stuck in a rollercoaster spiral. Milk prices have been too low for far too long. The dairy dispersal continues with some very good cows being sold and very good dairymen and women calling it quits. Naturally, some land will be sold. To what end remains to be seen. But it is a safe bet, the frac sand mining ride has not ended.
https://www.fractracker.org/a5ej20sjfwe/wp-content/uploads/2017/04/Frac-sand-mine-WI-Feature.jpg400900Guest Authorhttps://www.fractracker.org/a5ej20sjfwe/wp-content/uploads/2025/09/2025-Wordmark-Logo.pngGuest Author2017-04-19 16:22:422021-04-15 15:03:09Fracking in Dairy Country
The Pennsylvania Department of Environmental Protection (DEP) will be hosting a nine-stop “listening tour” to hear residents’ perspectives on environmental justice (EJ). These sessions begin in the western part of the state on April 12th and 13th. The complete list of dates and locations of these meetings can be found here. The DEP will also be accepting written comments, which can be either mailed or emailed to DEP-OEJ@pa.gov.
The EJ listening tour follows on the heels of events in May 2016, when environmental advocacy groups questioned the well pad siting practices of oil and gas drilling company Range Resources, causing the DEP to announce it would revisit its EJ policies. Such changes would include reassessing how EJ zones are designated and what kinds of development triggers additional scrutiny by the DEP’s Office of Environmental Justice. We wrote about this story, and detailed how present EJ rules fail to account for oil and gas development in June 2016.
The following guide is meant to provide helpful information to residents in preparing for the listening tour. We first offer a summary of PA’s present EJ policies, followed by a commentary on what gaps we believe exist in those policies, and conclude with some reflections on EJ policies in other U.S. states and what we might learn from them in reassessing our own state’s EJ laws.
Listening Sessions Format
Each environmental justice listening tour will include opening remarks from Acting Secretary McDonnell, followed by a brief presentation from the Office of Environmental Justice, and then will open to receive testimony from the public. Verbal testimony is limited to 3 minutes for each witness. Organizations are asked to designate one witness to present testimony on their behalf. Verbal comments will be recorded by a court stenographer, and transcripts will be made available to the public at a later date.
The DEP Office of Environmental Justice has offered a set of eight questions to guide comments in the listening tour sessions. They are as follows:
What environmental justice concerns are most pressing in your community?
Do you feel that the current definition of an environmental justice community (20% poverty and/or 30% minority) properly represents the needs of your community and the Commonwealth at large?
Do you feel the DEP is engaged with marginalized communities to ensure that they have a voice in the decision making process? How can the DEP be more engaged with these communities?
What tools have you used to find out information on DEP permitting/enforcement actions?
What ways can the DEP be more effective at sharing information with the public?
How can the DEP be more effective at receiving public input?
What resource(s) is your community lacking that the DEP can provide that would assist in efforts to ensure environmental equity?
What additional steps can be taken by the Department to effectively reach out to these vulnerable communities to ensure that their concerns are taken into consideration?
Summary of Existing EJ Policies
According to the U.S. Environmental Protection Agency, environmental justice is “the fair treatment and meaningful involvement of all people regardless of race, color, national origin, or income with respect to the development, implementation, and enforcement of environmental laws, regulations, and policies.” This same definition is used by the DEP.
In 2004, the DEP codified this EJ definition in the Environmental Justice Public Participation Policy. EJ designations are defined by the DEP as any census tract where 20% or more of the population lives in poverty and/or 30% or more of the population identifies as a minority. Designations are based on the U.S. Census Bureau and by the federal poverty guidelines.
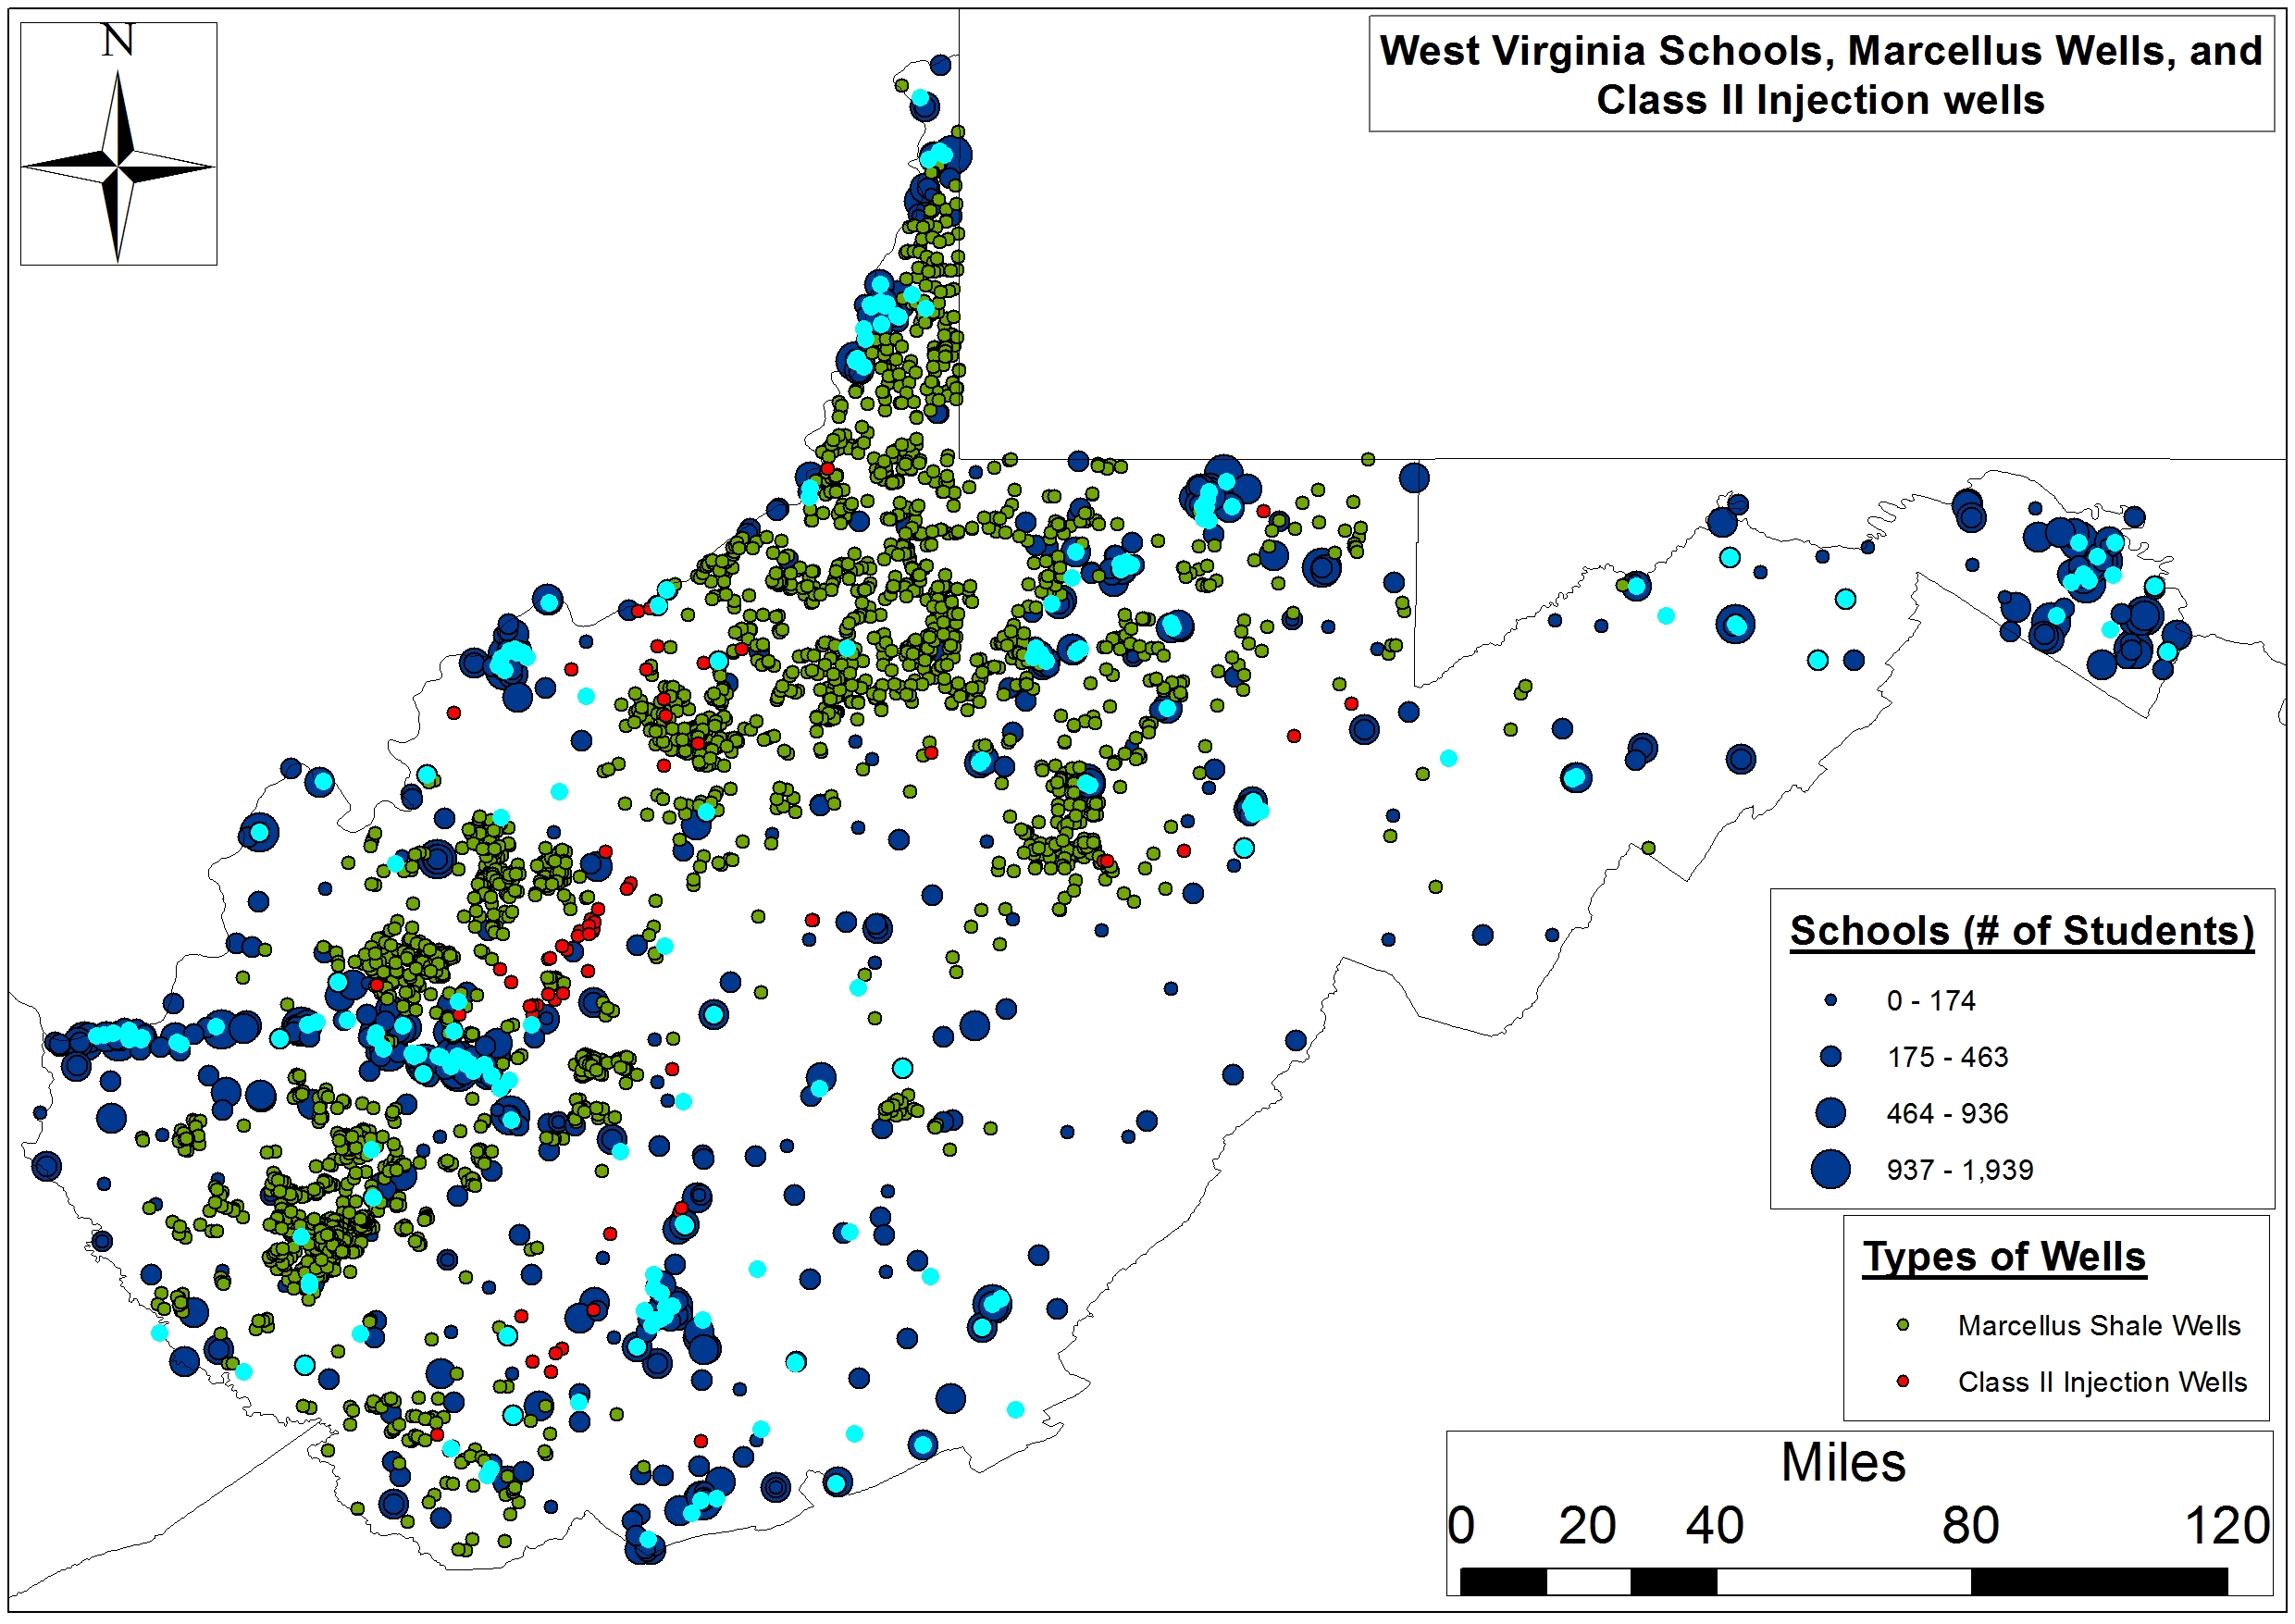
Below is a map of current EJ designated census tracts in PA that also shows the counties where listening tour sessions will be held. When zoomed in to regional scale, EJ areas can be clicked to see their current poverty and minority percentages. The locations of oil and gas wells and permits are also visible at the regional scale.
Map of current EJ areas (based on 2015 census data) shown in teal, with listening tour counties outlined in red
Of note in the 2004 policy are the kinds of permits that trigger a potential EJ review – specifically: industrial wastewater facilities, air permits for new major source of hazardous air pollution, waste permits for landfills and incinerators, coal mining permits and coal refuse facilities, and/or concentrated animal feeding operations. The policy also allows for review of “opt-in permits” the DEP believes warrant special consideration, but we have found no evidence to suggest that this option has been historically used.
When a project triggers EJ review, the DEP “strongly encourages” the applicant meets with community stakeholders prior to submitting their permit, with the idea that additional public outreach makes project details more apparent. The applicant is also encouraged to produce “plain language” information sheets, online and in print form, regarding the proposed activity.
Issues with Existing PA EJ Policies
A complete list of what may occur when a project triggers EJ review can be found here. The following table is a breakdown of where we see deficiencies in PA EJ policies that need to be addressed:
Existing Policy
Issue
Possible Solutions
EJ Definition EJ areas defined by 20% poverty/30% minority indicators.EJ ensures meaningful involvement of all people regardless of race, color, national origin, or income.
Many communities are just outside poverty/minority thresholds, or are spread across multiple census tracts experiencing concentrated industrial activities.
Disproportionate exist due to other factors besides poverty and race.
DEP should go beyond the census tracts, as well as account for other factors such as the “working poor”, homeownership rates, assisted school lunches rate, disability and elderly populations, and language barriers.
Reviews should factor in “cumulative impacts” of more developing relative to existing industrial burdens.
Regardless of “age and gender” should be added to EJ protection language.
Trigger Permits Limited kinds of “trigger” permit types are listed in the Public Participation Policy as eligible for EJ review.
Permits outside of these categories are also degrading the communities and being targeted to environmental justice communities. Oil and gas extractions, pipelines, and other infrastructure are not currently considered trigger permits but are impacting many environmental justice areas.
DEP should oil and gas permits to the trigger list. All permits, even of seemingly lesser severity, should trigger review to see if they contribute to cumulative impacts to already burdened community.
Permit Notifications DEP program staff must notify the Office of EJ when a permit “trigger” EJ review and report the details of the proposed activity.
Currently not all DEP program staff are alerting the EJ office of trigger permits, and many are not education on EJ policies.
More training and funding needs to be allocated to make sure that trigger permits are not overlooked or mishandled.
Public Education
Requiring the distribution of “plain language” information sheets regarding the proposed activity and permit conditions. Public notices are to be placed in widely read publications in print and online.
Does not always happen or the information produced is inadequately written or poorly distributed. Public notices are put in the legal sections of paper, often initial meetings are not even publicly noticed if the company is the only one organizing the meeting.
Enforce this requirement and include real infographics as much as possible. Consult with local community groups to determine what communication tools work best.
Publish additional notice outside of newspaper in widely read publications, flyers in local businesses, community centers, and church bulletins. Require applicants to do direct mailing.
Updated the “eFacts notification system to include more information and send email notices to interested parties when updates in non-technical language.
Applicant Public Meetings
DEP “strongly suggests” applicants meet with all stakeholders, before applying for permit, as well as throughout the permitting process.
Not all stakeholders are being brought into conversations and often DEP allows the applicant to decide who these people should be. Applicants are often not transparent about their plans. Meetings do not occur at all stages of the process.
It should not be up to the applicant to control the process and do outreach. DEP should ensure that all interested parties are engaged in the permitting process.
Meeting should be held during the entire permitting process. This should be required, not “strongly suggested.” A meeting should occur after a permit is administratively complete and again after technical review is done but before a decision is made. Many changes happened during technical review and this gives communities the opportunity to weigh in on the final project and understand its timeline.
DEP should always participate in these meetings and make themselves available to answer questions from the community.
DEP Public Meetings
DEP holds an informal public conference within 30 days of receiving the application to inform residents of EJ area designation and the nature of project.
These meetings frequently are not able to answer people questions and residents are told to wait for additional information. The format of these meetings do not allow for dialogue, which prevents the community from learning from each other.
The DEP needs to hold the informal public conferences in discussion formats so residents can ask questions together and receive answers in person, not just take notes and tell residents they will receive a written response. DEP staff responsible for reviewing the proposal must be present at the meetings to answer questions.
Public Comments
DEP accepts comments from EJ communities.
These comments are often not taken into consideration, or given very little weight during the permitting process. Instead, the comments are merely noted for the record.
Create a formal process for integrating comments from community experts who are often best able to provide information about how a project will impact their community.
DEP Availability
DEP will maintain presence and be availability to residents throughout permitting process.
DEP staff are available during public meetings but are otherwise unavailable until there is a permit decision.
Inadequate continuing public oversight of how EJ policies are administered across the state.
Actively provide updates on the permitting process and changes to the application. The burden should not be on an EJ community to stay up date on the permit, but should be the DEP and applicant’s responsibility.
DEP staff responsible for reviewing the proposal must be available to the community to answer questions. DEP should also prioritize filling its regional Environmental Advocate staff positions currently vacant in many of its districts.
Convert the DEP Citizen Environmental Justice Advisory Board (EJAB) to a full committee, with the power to oversee EJ permits under review and influence state EJ policies. Hold quarterly EJAB meetings in different DEP regions on a rotating basis.
Reflections on other states’ EJ policies
States that use poverty and race indicators differently:
Connecticut: Uses income below 200% of the federal poverty level (“working poor”).
Illinois: indicates low-income and/or minority population as being “greater than twice the statewide average.”
Massachusetts: Defines by census “block group” rather than census tract, which can identify pocket EJ areas that might be lost in larger census tracts.
Texas: For income indicator, uses census block group and income below 200% of the federal poverty level.
States that go beyond poverty and race indicators:
California: Considers existing disproportionate environmental burden. Also, demographics include “low levels of homeownership, high rent burden…or low levels of educational attainment.”
Connecticut: includes a “distressed community” indicator, defined as whether it is eligible for HUD grants, or experienced layoffs/tax loss due to a major plant closing.
Georgia: includes language for elderly and disabled populations “The Americans with Disabilities Act (ADA) encourages the involvement of people with disabilities in the development and improvement of transportation and paratransit plans and services.”
Massachusetts: Uses linguistic isolation, defined as “25% or more of households having no one over the age of 14 who speaks English only, or very well.”
New Jersey: Communities can file a petition to be recognized as a vulnerable.
Example of better public participation affordances:
New Jersey: When a community is designated EJ, a task force is formed to develop a unique “Action Plan” after consultation with residents, local, and county government, that will address environmental, social and economic factors affecting their health or environment. This task force monitors Action Plan implementation, and advises development projects to reduce impacts.
Conclusions
Environmental justice rules came into existence in order to deal with the burdens of large polluting facilities like landfills, incinerators, and coal mines. Race and poverty measures are, without question, two very important indicators that have provided for the fair treatment of people of all races, income, and cultures in these instances. However, if we are to properly assess how residents are disproportionately impacted across a range of environmental burdens in the state, other indicators of marginalization should be included. The Center for Coalfield Justice suggests a few in a report titled Community Indicators of Environmental Justice: A Baseline Report Focusing on Greene and Washington Counties, Pennsylvania.
Fair treatment in EJ communities should also mean offering mechanisms for meaningful input that allow residents to shape the ultimate direction of proposed projects, as well. Finally, current EJ policies are very limited in only addressing future projects, whereas issues such as how disadvantaged communities, struggling with legacy problems such water, air, and soil pollution, are left to other agencies to deal with.
We encourage residents of Pennsylvania to attend an environmental justice listening tour session to share their perspectives, and how the DEP can better fulfill its mandates to protect vulnerable communities.
https://www.fractracker.org/a5ej20sjfwe/wp-content/uploads/2017/04/EJ_tour_header.jpg400900FracTracker Alliancehttps://www.fractracker.org/a5ej20sjfwe/wp-content/uploads/2025/09/2025-Wordmark-Logo.pngFracTracker Alliance2017-04-10 11:06:352021-04-15 15:03:12PA DEP Environmental Justice Listening Tour
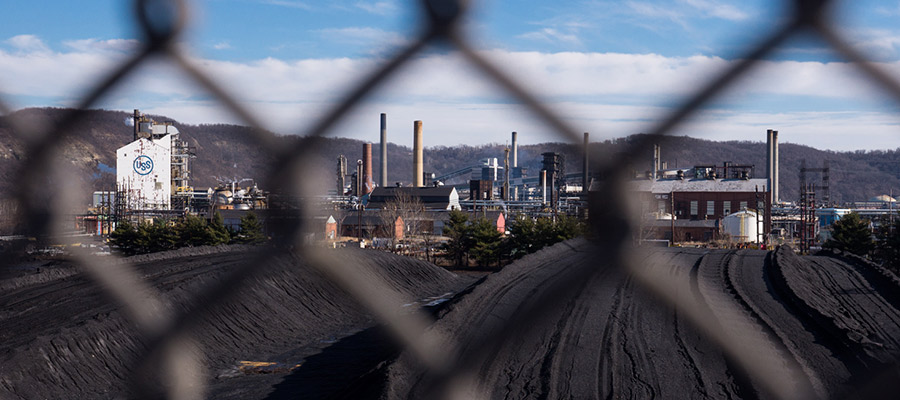
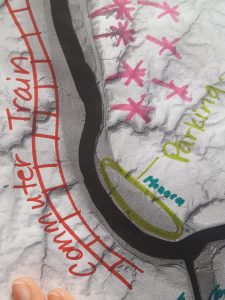
At a Re-Imagine Beaver County gathering in Pennsylvania earlier this month, static maps became dynamic in the hands of those who live in and around the region depicted. Residents of this area in the greater Pittsburgh region gathered to depict a new vision for Beaver County, PA. This county is currently faced with the proposal of a massive Shell-owned petrochemical facility – also called a “cracker” – and further build-out that could render the area a northern version of Louisiana’s “Chemical Corridor.” Participants at this event, from Beaver County and beyond, were encouraged to collectively envision a future based on sustainable development. The picture they created was one that welcomes change – but requires it to be sustainable and for the benefit of the community that makes it happen.
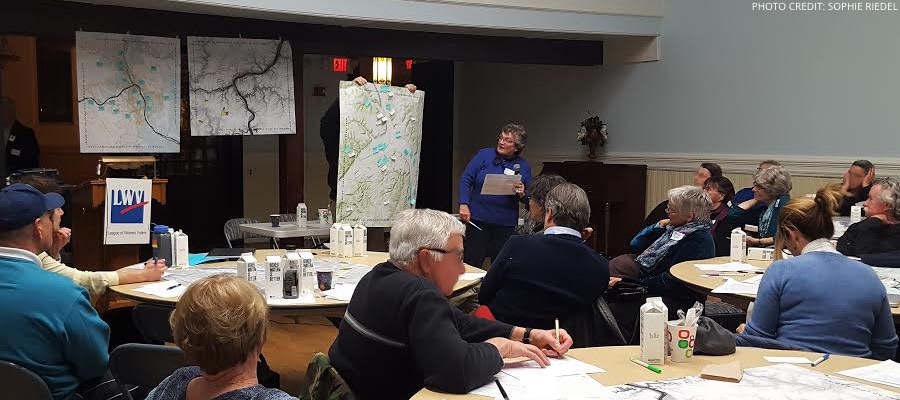
Figure 1: Participants study a map of Beaver County. Photo credit: Sophie Riedel.
Re-Imagine Beaver County Participants
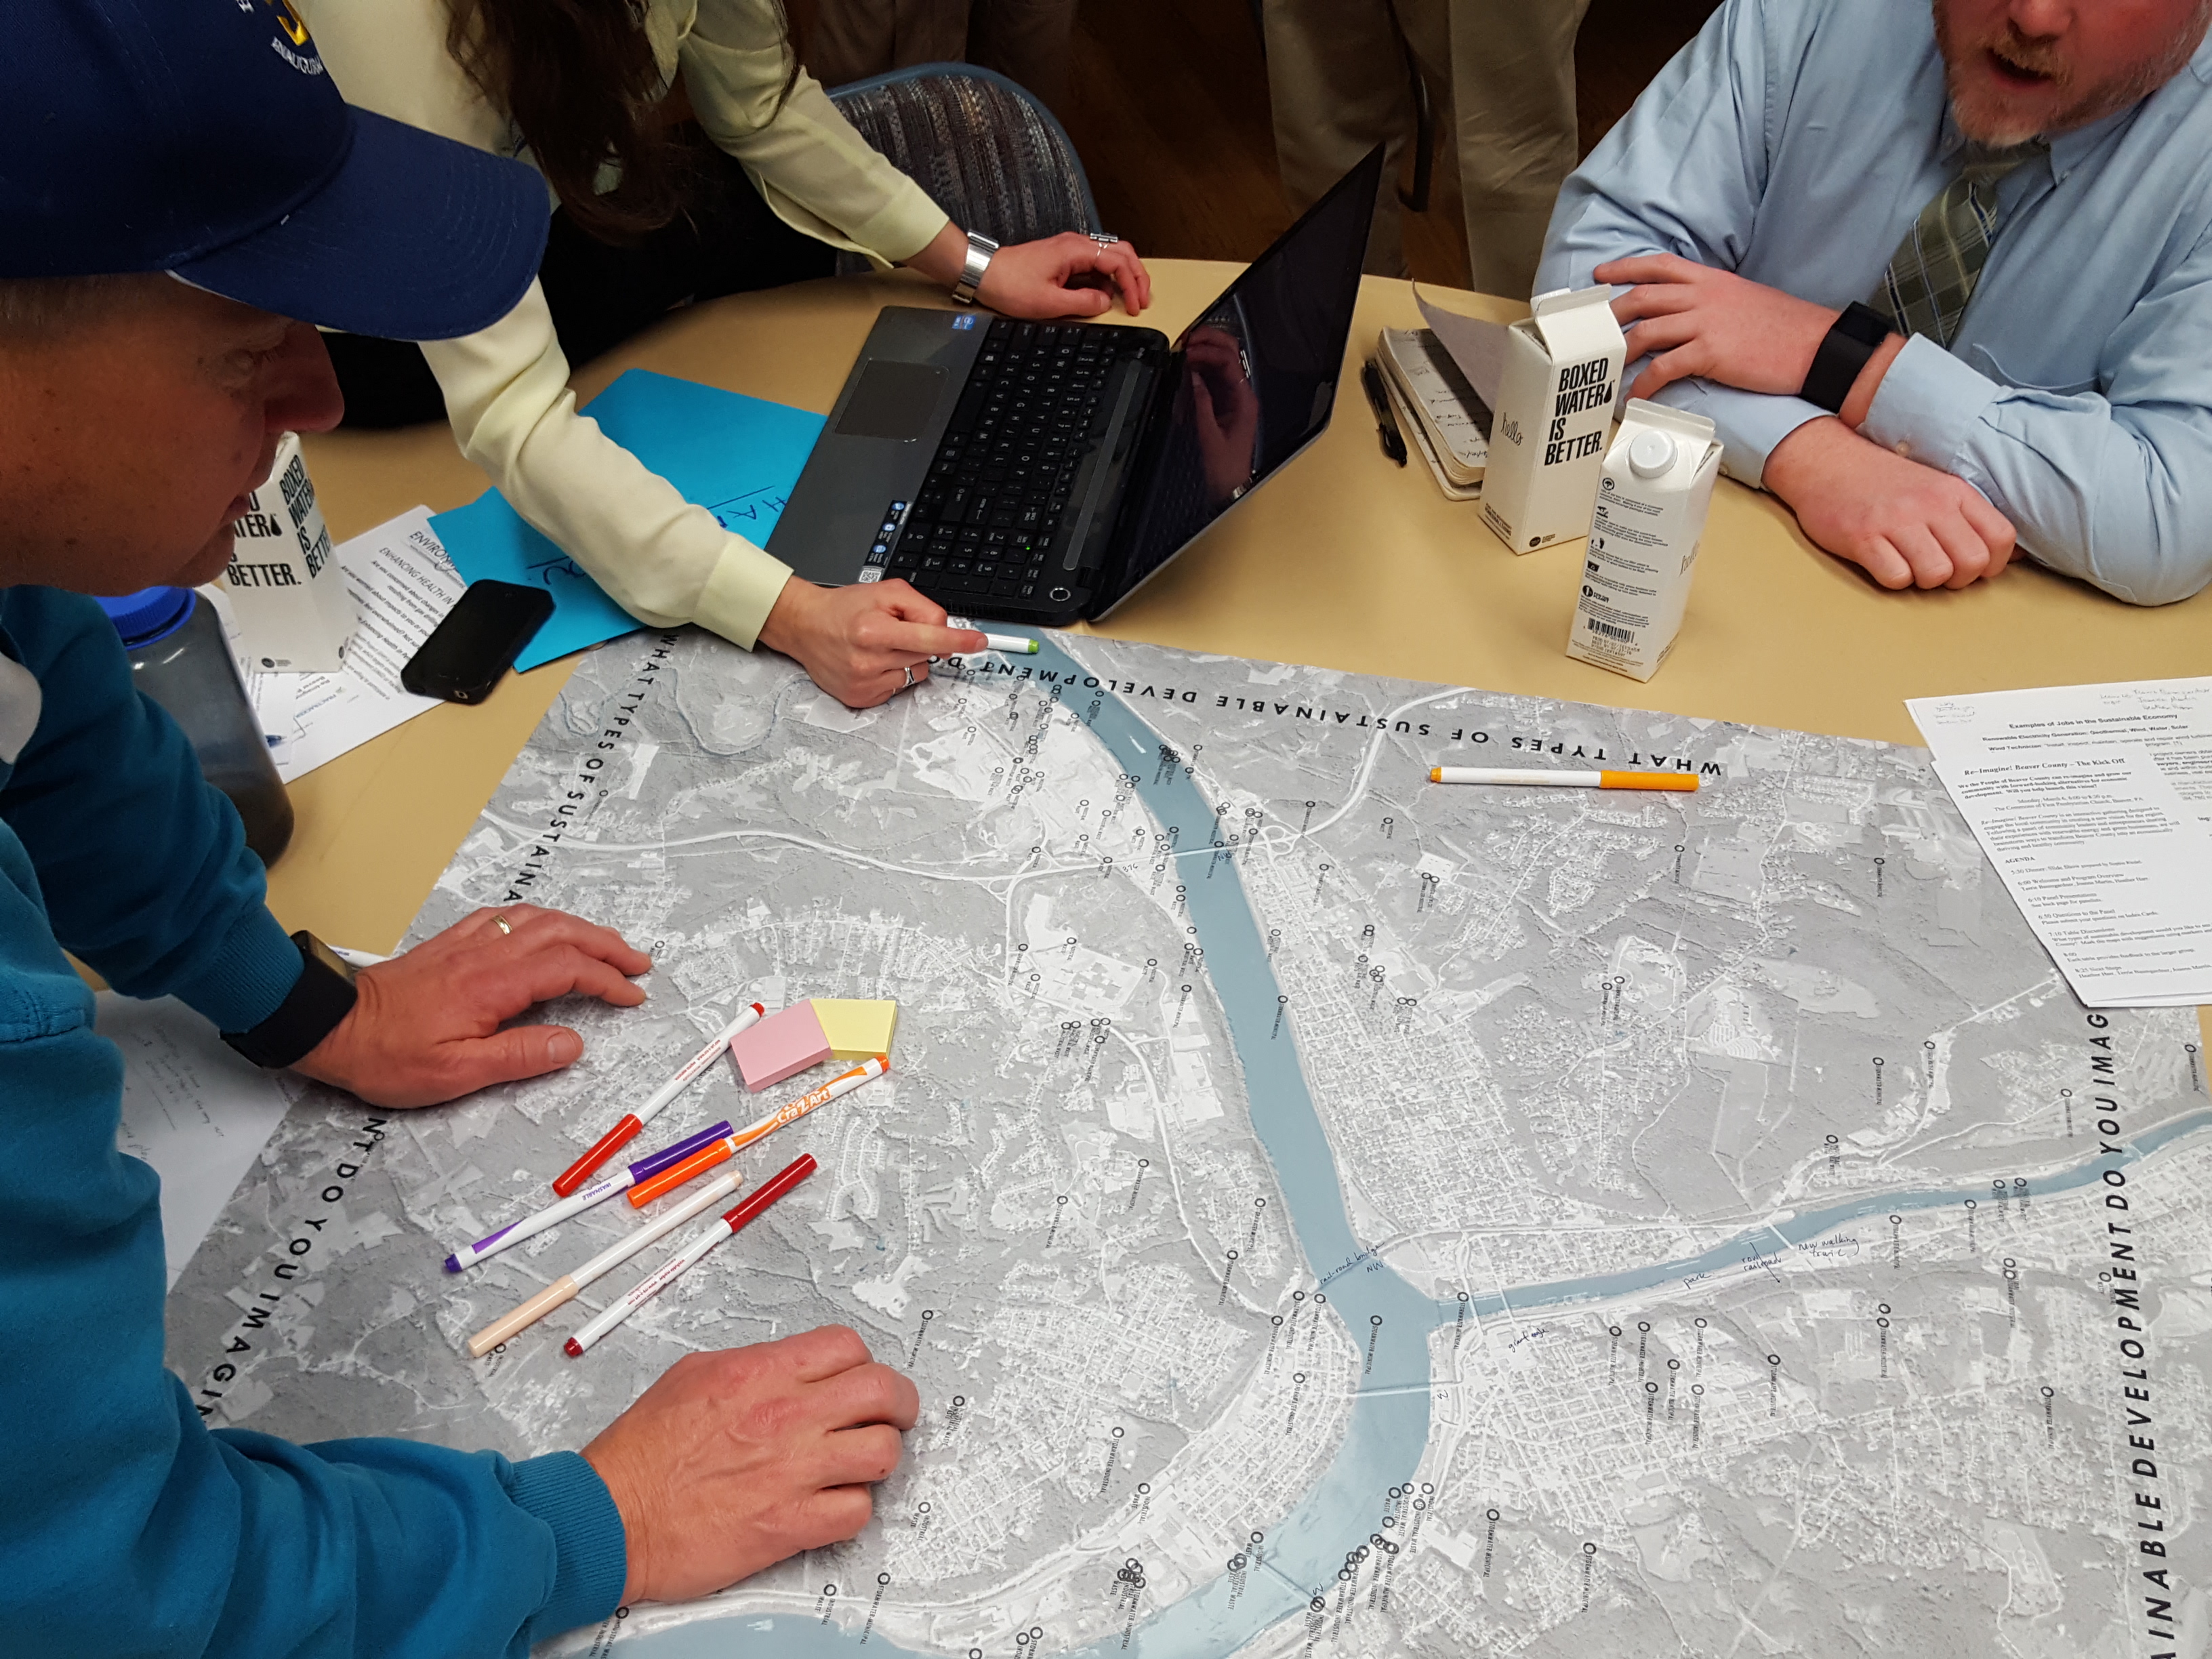
Panelists from municipal government, organic agriculture, and leaders and entrepreneurs of sustainable initiatives started off the event, sponsored by the League of Women Voters of Pennsylvania and endorsed by the Beaver County Marcellus Awareness Committee. After an hour, the room of 60 or so participants dove into the lively de- and re-construction of large format maps of the area. They were invited to markup the maps, created by Carnegie Mellon University graduate student of the School of Architecture, Sophie Riedel. Each table worked from a different base map of the same area – centering on the confluence of the Ohio and Beaver rivers, including the already heavily-industrialized riverside and the site of Shell’s proposed petrochemical facility.
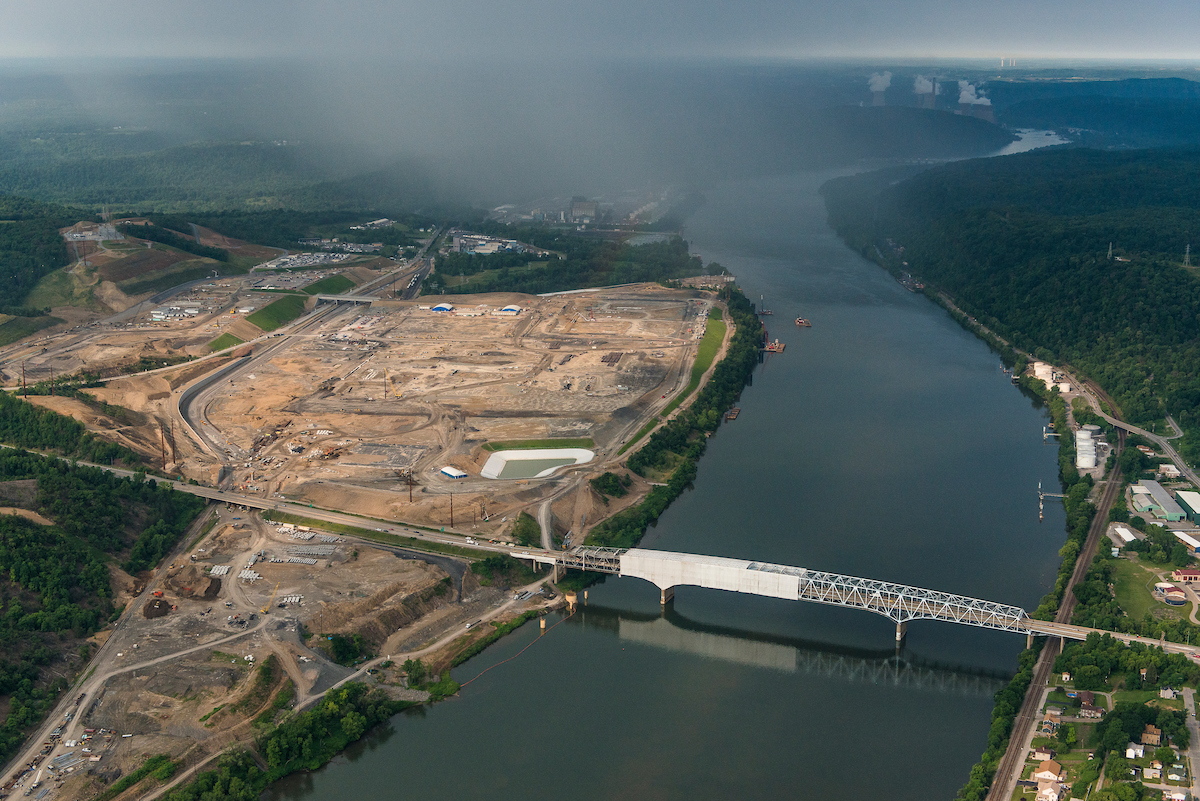
Figure 2: The site of the proposed petrochemical facility in Beaver County (on left) and the Ohio River that participants hope to see reinvented as a recreational waterway buttressed by public parks. Photo credit: Garth Lenz, iLCP.
Much more than a thought exercise, the gathering represented a timely response to a growing grassroots effort around the proposed petrochemical inundation. Changes are already underway at the site, and those who live in this region have the right to give input. This right is especially salient when considering the risks associated with the petrochemical industry – including detrimental health impacts on babies before they are even born, asthma exacerbation, and increased cancer rates.
Charting a new vision
The re-invented Beaver County would be one of increased connectivity and mobility, well-equipped to provide for local needs with local means.
Many ideas included on the maps reflected a longing for transportation options independent of personal vehicles – including better, safer, more connected bike trails and walking paths, use of existing rail lines for local travel, and even the inventive suggestion of a water taxi. These inherently lower-impact means of transport coincide with preferences of millennials, according to several of the panelists, who want more walkable, bikeable communities. Ushering in such sustainable suggestions would welcome more young families to an area with an aging population. More than just about moving people, transportation ideas also included ways to get locally grown foods to those who need it, such as the elderly.
Figure 3: Participants modify maps to reflect a new vision. Photo credit: Sophie Riedel.
The value of beauty was a subtheme in many of the ideas to connect and mobilize the population and goods, ideas which often held a dual aim of protecting open space, creating new parks, and offering recreation possibilities. Participants ambitiously reimagined their river, the Ohio, from its current status as a closed-off corridor for industrial usage and waste, to a recreational resource for kayaking and fishing walleye.
Participants marked up the maps to show the resources that help sustain this community, and voiced a strong desire for development that would enable additional self-reliance. These forward-thinking changes included increased agriculture and use of permaculture techniques, and community gardens for growing food near the people who currently lack access. Ideas for powering the region abounded, like harnessing wind power and putting solar panels on every new building.
Participants were firm on local sourcing for another key resource: the labor required for these efforts, they insisted, must come from the local populace. Educational programs designed to channel learners into workers for sustainability might include training to rebuild homes to “greener” standards, and programs aimed at bringing a new generation of farmers to the fields. Perhaps a nod to the world-wide plastic glut that a petrochemical facility would add to, suggestions even included local ways of dealing with waste, like starting a composting program and establishing more recycling centers.
Whose vision?
Who is a part of this vision, both in creating it and living it out? Inevitably, the selection of panelists and the interests of the audience members themselves influenced the vision this group crafted. The question of inclusion and representation found articulation among many participants, and the hosts of the event welcomed suggestions on reaching a broader audience moving forward. Looking around the room, one man asked, “Where are all the young people, and families with kids?” Indeed, only several members of this demographic were present. Though indicative of the racial makeup of Beaver County, the audience appeared to be primarily white, meaning that the racially diverse communities in the region where not represented. Others pointed out that going forward, the audience should also include those residents struggling with un- and underemployment, who have a major stake in whatever vision of Beaver County comes to fruition. Another said he would like to see more elected officials and leaders present. Notably, Potter Township Board of Supervisors Chairperson, Rebecca Matsco, who is a strong advocate for the proposed petrochemical project in her township, was present for the first half of the event.
Local means for meeting local needs
People who welcome petrochemical development in Beaver County might believe that those who voice concerns about the proposed Shell plant aren’t forward-thinking, or simply oppose change. Quite in contrast, participants at Re-Imagine Beaver County went to work reinventing their community with optimism and enthusiasm. They didn’t seem to be resisting change, but instead, wanting to participate in the process of change and to ultimately see benefits to their community. For example, discussion of solar power generated substantial excitement. According to panel speaker Hal Saville, however, the biggest challenge is making it affordable for everyone, which suggests that the estimated $1.6 billion in tax breaks going to Shell for the petrochemical plant could be better allocated.
A key narrative from supporters of the ethane cracker centers on the pressing need for jobs in this area, though some locals have expressed concern about how many of Shell’s promised jobs would go to residents. Whoever gets hired, these jobs come with serious dangers to workers. Participants at this event proposed alternative initiatives – both ambitious and small – for creating jobs within the community, like providing “sprout funds” to encourage new business start-ups, and launching a coordinated effort to rehab aging housing stock. These ideas suggest that the people of this region feel their energy and ingenuity would be best spent making Beaver County a better place to live and work, in contrast to producing disposable petrochemical products for export around the world. The fact that so many participants emphasized local means for meeting their needs in no way downplays the need for good jobs. Rather, it points to the fact that people want jobs that are good for them and for the future of their community.
Moving the vision forward
Where do we go from here? Can the momentum of this event draw in greater representation from the region to have a voice in this process? Will these visions become animated and guide the creation of a new reality? Broader and deeper planning is in order; participants and panelists alike pointed to tools like comprehensive community plans and cleaner, “greener” industrial policies. More than anything, the group articulated a need for more deliberation and participation. As panelist and farm co-owner Don Kretschmann put it, when it comes to change, we need to “think it through before we go ahead and do it.”
The maps themselves, bearing the inspirations scrawled out during the event, have not reached the end of the road. From here, these maps will accompany an upcoming exhibition of the artworks in Petrochemical America, which locals hope to bring to the greater Pittsburgh area in the coming months. League of Women Voters, for their part, continue to move the vision forward, inviting input from all on next steps, with an emphasis on pulling in a broader cross-section of the community.
To voice your vision, and to stay in the loop on future Re-Imagine Beaver County events, contact reimaginelwvpa@gmail.com.
https://www.fractracker.org/a5ej20sjfwe/wp-content/uploads/2017/03/Re-Imagine-Beaver-Feature-Riedel.jpg400900FracTracker Alliancehttps://www.fractracker.org/a5ej20sjfwe/wp-content/uploads/2025/09/2025-Wordmark-Logo.pngFracTracker Alliance2017-03-24 09:11:252021-04-15 15:03:37Mapping a new vision in PA: Alternatives to petrochemical development
A review of WV and OH drilling activity and its proximity to schools and medical facilities
Schools and hospitals represent places where vulnerable populations may be put at risk if they are located close to oil and gas activity. Piggybacking on some elegant work from PennEnvironment (2013) and Physicians, Scientists, and Engineers (PSE) Healthy Energy (PDF) in Pennsylvania, below is an in-depth look at the proximity of unconventional oil and gas (O&G) activity to schools and hospitals in Ohio and West Virginia.
Ohio Schools and Medical Facilities
In Ohio, presently there are 13 schools or medical facilities within a half-mile of a Utica and/or Class II injection well and an additional 344 within 2 miles (Table 1 and map below). This number increases to 1,221 schools or medical facilities when you consider those within four miles of O&G related activity.
Map of OH Drilling and Disposal Activity Near Schools, Medical Facilities
Table 1. Number of OH schools and hospitals within certain distances from Utica wells
Utica
Class II Injection
Well Distance (Miles)
Schools
Medical Facilities
Schools
Medical Facilities
0.5
3
1
9
0
0.5-1
19 (22)
9 (10)
16 (25)
13 (13)
1-2
79 (101)
41 (51)
88 (113)
79 (92)
2-3
84 (185)
49 (100)
165 (278)
122 (214)
3-4
85 (270)
79 (179)
168 (446)
112 (326)
4-5
92 (362)
63 (242)
196 (642)
166 (492)
5-10
388 (750)
338 (580)
796 (1,438)
584 (1,076)
Ohio’s rate of Utica lateral permitting has jumped from an average of 39 per month all-time to 66 per month in the last year. OH’s drilling activity has also begun to spread to outlying counties[1]. As such, we thought a proactive analysis should include a broader geographic area, which is why we quantified the number of schools and medical facilities within 5 and 10 miles of Utica and Class II activity (Figures 1 and 2). To this end we found that ≥50% of Ohio’s schools, both public and private, are within 10 miles of this industry. Similarly 50% of the state’s medical facilities are within 10 miles of Utica permits or Class II wells.
Footnote 1: Eleven counties in Ohio are currently home to >10 Utica permits, while 23 are home to at least 1 Utica permit.
Figures 1, 2a, 2b (above). Click to expand.
Grade Level Comparisons
With respect to grade level, the majority of the schools in question are elementary schools, with 40-50 elementary schools within 2-5 miles of Ohio Utica wells. This number spikes to 216 elementary schools within ten miles of Utica permits along with an additional 153 middle or high Schools (Figure 3). Naturally, public schools constitute most of the aforementioned schools; there are approximately 75 within five miles of Utica permits and 284 within ten miles of Utica activity (Figure 4).
Figures 3 and 4 (above). Click to expand.
Public Schools in Ohio
We also found that ~4% of Ohio’s public school students attend a school within 2 miles of the state’s Utica and/or Class II Injection wells (i.e., 76,955 students) (Table 2). An additional 315,362 students or 16% of the total public school student population, live within five miles of O&G activity.
Table 2. Number of students in OH’s public schools within certain distances from Utica and Class II Injection wells
Utica
Class II Injection
Well Distance (Miles)
# Schools
# Students
Avg
# Schools
# Students
Avg
0.5
3
1,360
453
7
3,312
473
<1
21
7,910
377
19
7,984
420
<2
96
35,390
376
90
41,565
462
<3
169
67,713
401
215
104,752
487
<4
241
97,448
404
350
176,067
503
<5
317
137,911
435
505
254,406
504
<10
600
280,330
467
1,126
569,343
506
(Note: Ohio’s population currently stands at 11.59 million people; 2,007,667 total students).
The broadest extent of our study indicates that 42% of Ohio students attend school within ten miles of a Utica or Class II Injection well (Figure 5). As the Ohio Utica region expands from the original 11 county core to include upwards of 23-25 counties, we expect these 5-10 mile zones to be more indicative of the type of student-Utica Shale interaction we can expect to see in the near future.
Photos of drilling activity near schools, and Figure 5 (above). Click to expand.
Private Schools in Ohio
At the present time, less than one percent of Ohio’s private school students attend a school within 2 miles of Utica and/or Class II Injection wells (specifically, 208 students). An additional 11,873 students or 11% of the total student population live within five miles. When you broaden the extent, 26% of Ohio’s private primary and secondary school students attend school daily within ten miles of a Utica or Class II Injection well. Additionally, the average size of schools in the immediate vicinity of Utica production and waste activity ranges between 11 and 21 students, while those within 2-10 miles is 112-159 students. Explore Table 3 for more details.
Table 3. Number of students in Ohio’s private schools within certain distances from Utica and Class II Injection.
Utica
Class II Injection
Distance from Well (Miles)
# Schools
# Students
Avg
# Schools
# Students
Avg
0.5
.
.
.
1
.
.
<1
.
.
.
2
25
13
<2
2
22
11
9
186
21
<3
7
874
125
30
4,460
149
<4
12
1,912
159
45
6,303
140
<5
21
2,471
118
61
9,610
158
<10
60
6,727
112
135
20,836
154
West Virginia Schools and Students
Twenty-eight percent (81,979) of West Virginia’s primary and secondary school students travel to a school every day that is within two miles of the state’s Marcellus and/or Class II Injection wells.
Compared with Ohio, 5,024 more WV students live near this industry (Table 4). An additional 97,114 students, or 34% of the West Virginia student population, live within 5 miles of O&G related wells. The broadest extent of our study indicates that more than 90% of West Virginia students attend school daily within 10 miles of a Marcellus and/or Class II Injection well.
Figure 6. West Virginia primary and secondary schools, Marcellus Shale wells, and Class II Injection wells (Note: Schools that have not reported enrollment figures to the WV Department of Education are highlighted in blue). Click image to expand.
It is worth noting that 248 private schools of 959 total schools do not report attendance to the West Virginia Department of Education, which means there are potentially an additional 69-77,000 students in private/parochial or vocational technology institutions unaccounted for in this analysis (Figure 6). Finally, we were not able to perform an analysis of West Virginia’s medical facility inventory relative to Marcellus activity because the West Virginia Department of Health and Human Resources admittedly did not have an analogous, or remotely complete, list of their facilities. The WV DHHR was only able to provide a list of Medicaid providers and the only list we were able to find was not verifiable and was limited to hospitals only.
Table 4. Number of students in WV schools within certain distances from Shale and Class II Injection wells
Marcellus
Class II Injection
Distance from Well (Miles)
#
Sum
Avg
#
Sum
Avg
0.5
19
5,674
299
1
.
.
<1
52 (71)
16,992 (22,666)
319
5 (6)
1,544
257
<2
169 (240)
52,737 (75,403)
314
16 (22)
5,032 (6,576)
299
<3
133 (373)
36,112 (111,515)
299
18 (40)
6,132 (12,708)
318
<4
88 (461)
25,037 (136,552)
296
21 (61)
5,235 (17,943)
294
<5
56 (517)
15,685 (152,237)
295
26 (87)
8,913 (26,856)
309
<10
118 (635)
37,131 (189,368)
298
228 (315)
69,339 (96,195)
305
Note: West Virginia population currently stands at 1.85 million people; 289,700 total students with 248 private schools of 959 total schools not reporting attendance, which means there are likely an additional 69-77,000 students in Private/Parochial or Vocational Technology institutions unaccounted for in this analysis.
Conclusion
A Trump White House will likely mean an expansion of unconventional oil and gas activity and concomitant changes in fracking waste production, transport, and disposal. As such, it seems likely that more complex and broad issues related to watershed security and/or resilience, as well as related environmental concerns, will be disproportionately forced on Central Appalachian communities throughout Ohio and West Virginia.
Will young and vulnerable populations be monitored, protected, and educated or will a Pruitt-lead EPA pursue more laissez-faire tactics with respect to environmental monitoring? Stay Tuned!
Analysis Methods
The radii we used to conduct this assessment ranged between ≤ 0.5 and 5-10 miles from a Utica or Marcellus lateral. This range is larger than the aforementioned studies. The point of using larger radii was to attempt to determine how many schools and students, as well as medical facilities, may find themselves in a more concentrated shale activity zone due to increased permitting. Another important, related issue is the fact that shale O&G exploration is proving to be more diffuse, with the industry exploring the fringes of the Utica and Marcellus shale plays. An additional difference between our analysis and that of PennEnvironment and PSE Healthy Energy is that we looked at identical radii around each state’s Class II Injection well inventory. We included these wells given the safety concerns regarding:
their role in induced seismicity,
potential water and air quality issues, and
concomitant increases in truck volumes and speeds.
By Ted Auch, Great Lakes Program Coordinator, FracTracker Alliance
https://www.fractracker.org/a5ej20sjfwe/wp-content/uploads/2017/03/WV-Schools-Feature.jpg400900Ted Auch, PhDhttps://www.fractracker.org/a5ej20sjfwe/wp-content/uploads/2025/09/2025-Wordmark-Logo.pngTed Auch, PhD2017-03-13 11:27:562021-04-15 15:03:37How close are schools and hospitals to drilling activity in West Virginia and Ohio?
The Pennsylvania Department of Environmental Protection (DEP) logs incoming complaints from residents about drilling activity in the Commonwealth, and Public Herald has spent a great deal of time aggregating and making that information public. A recent investigation by Public Herald into that data, with help from FracTracker, has highlighted a number of concerning issues related to fracking in Pennsylvania unfortunately.
Concerning Complaints
Firstly, the data they reviewed indicate that complaints from residents about unconventional drilling (how most fracked wells are designated) are more common than those about traditional wells. Secondly, it seems that complaints about fracked wells are increasing over time, even though the number of new wells has decreased.
There may be several reasons for such trends, and Public Herald discusses some of them in their new report. Are fracking wells more likely to fail, resulting in a higher proportion of complaints from nearby residents? Or has tracking simply improved in recent years? What these trends undoubtably indicate, however, is that the impacts from drilling have been systemic, according to Drs. Ingraffea and Stolz, who also reviewed the data.
Probably the most troubling finding unearthed in this investigation is that the PA DEP was not transparent about complaint data. The information they released to Public Herald differed wildly from the spreadsheets previously obtained by other requestors. Learn more about this and other issues in Public Herald’s Hidden Data Report.
The above map by Public Herald and FracTracker Alliance shows the density of citizen complaints reported to the Department of Environmental Protection from 2004 – 2016. It includes conventional and unconventional well complaints. Clicking on a township reveals a database of complaints where viewers can download files.
In addition to the report issued by Public Herald, you can explore the data mapped above in the table below. It fleshes out how many complaints have been issued by residents, where these complaints originated, and how many are specific to water issues.
Table 1. PA Unconventional Well Complaint Statistics Logged by the PA DEP
DEP Office
County
Total Complaints (#)
Water Complaints (#)
Municipalities w/Complaints (#)
Drilled Unconventional Wells, Jan 2004 – Nov 29 2016
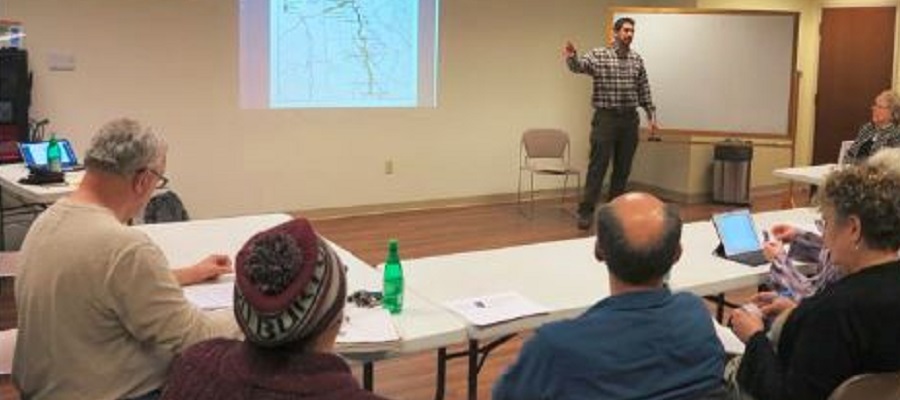


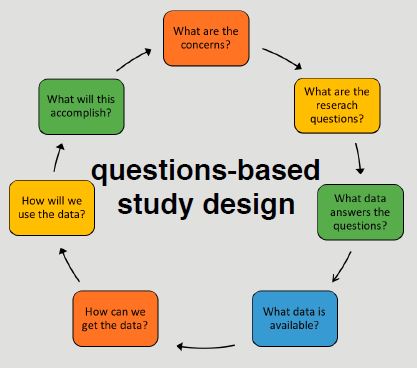
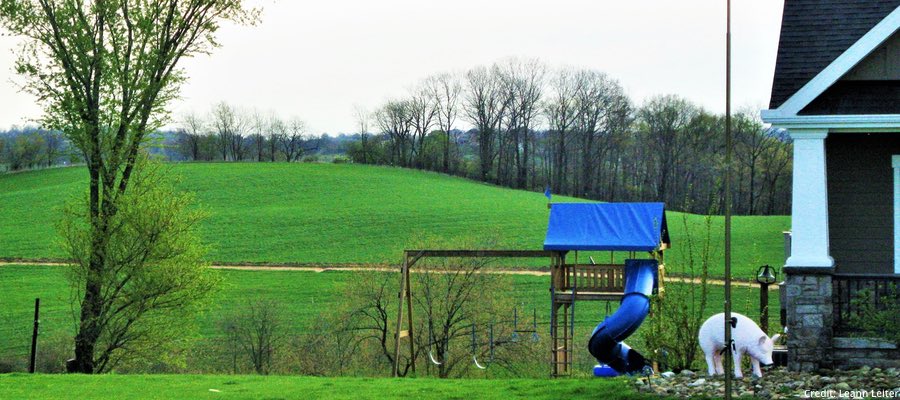

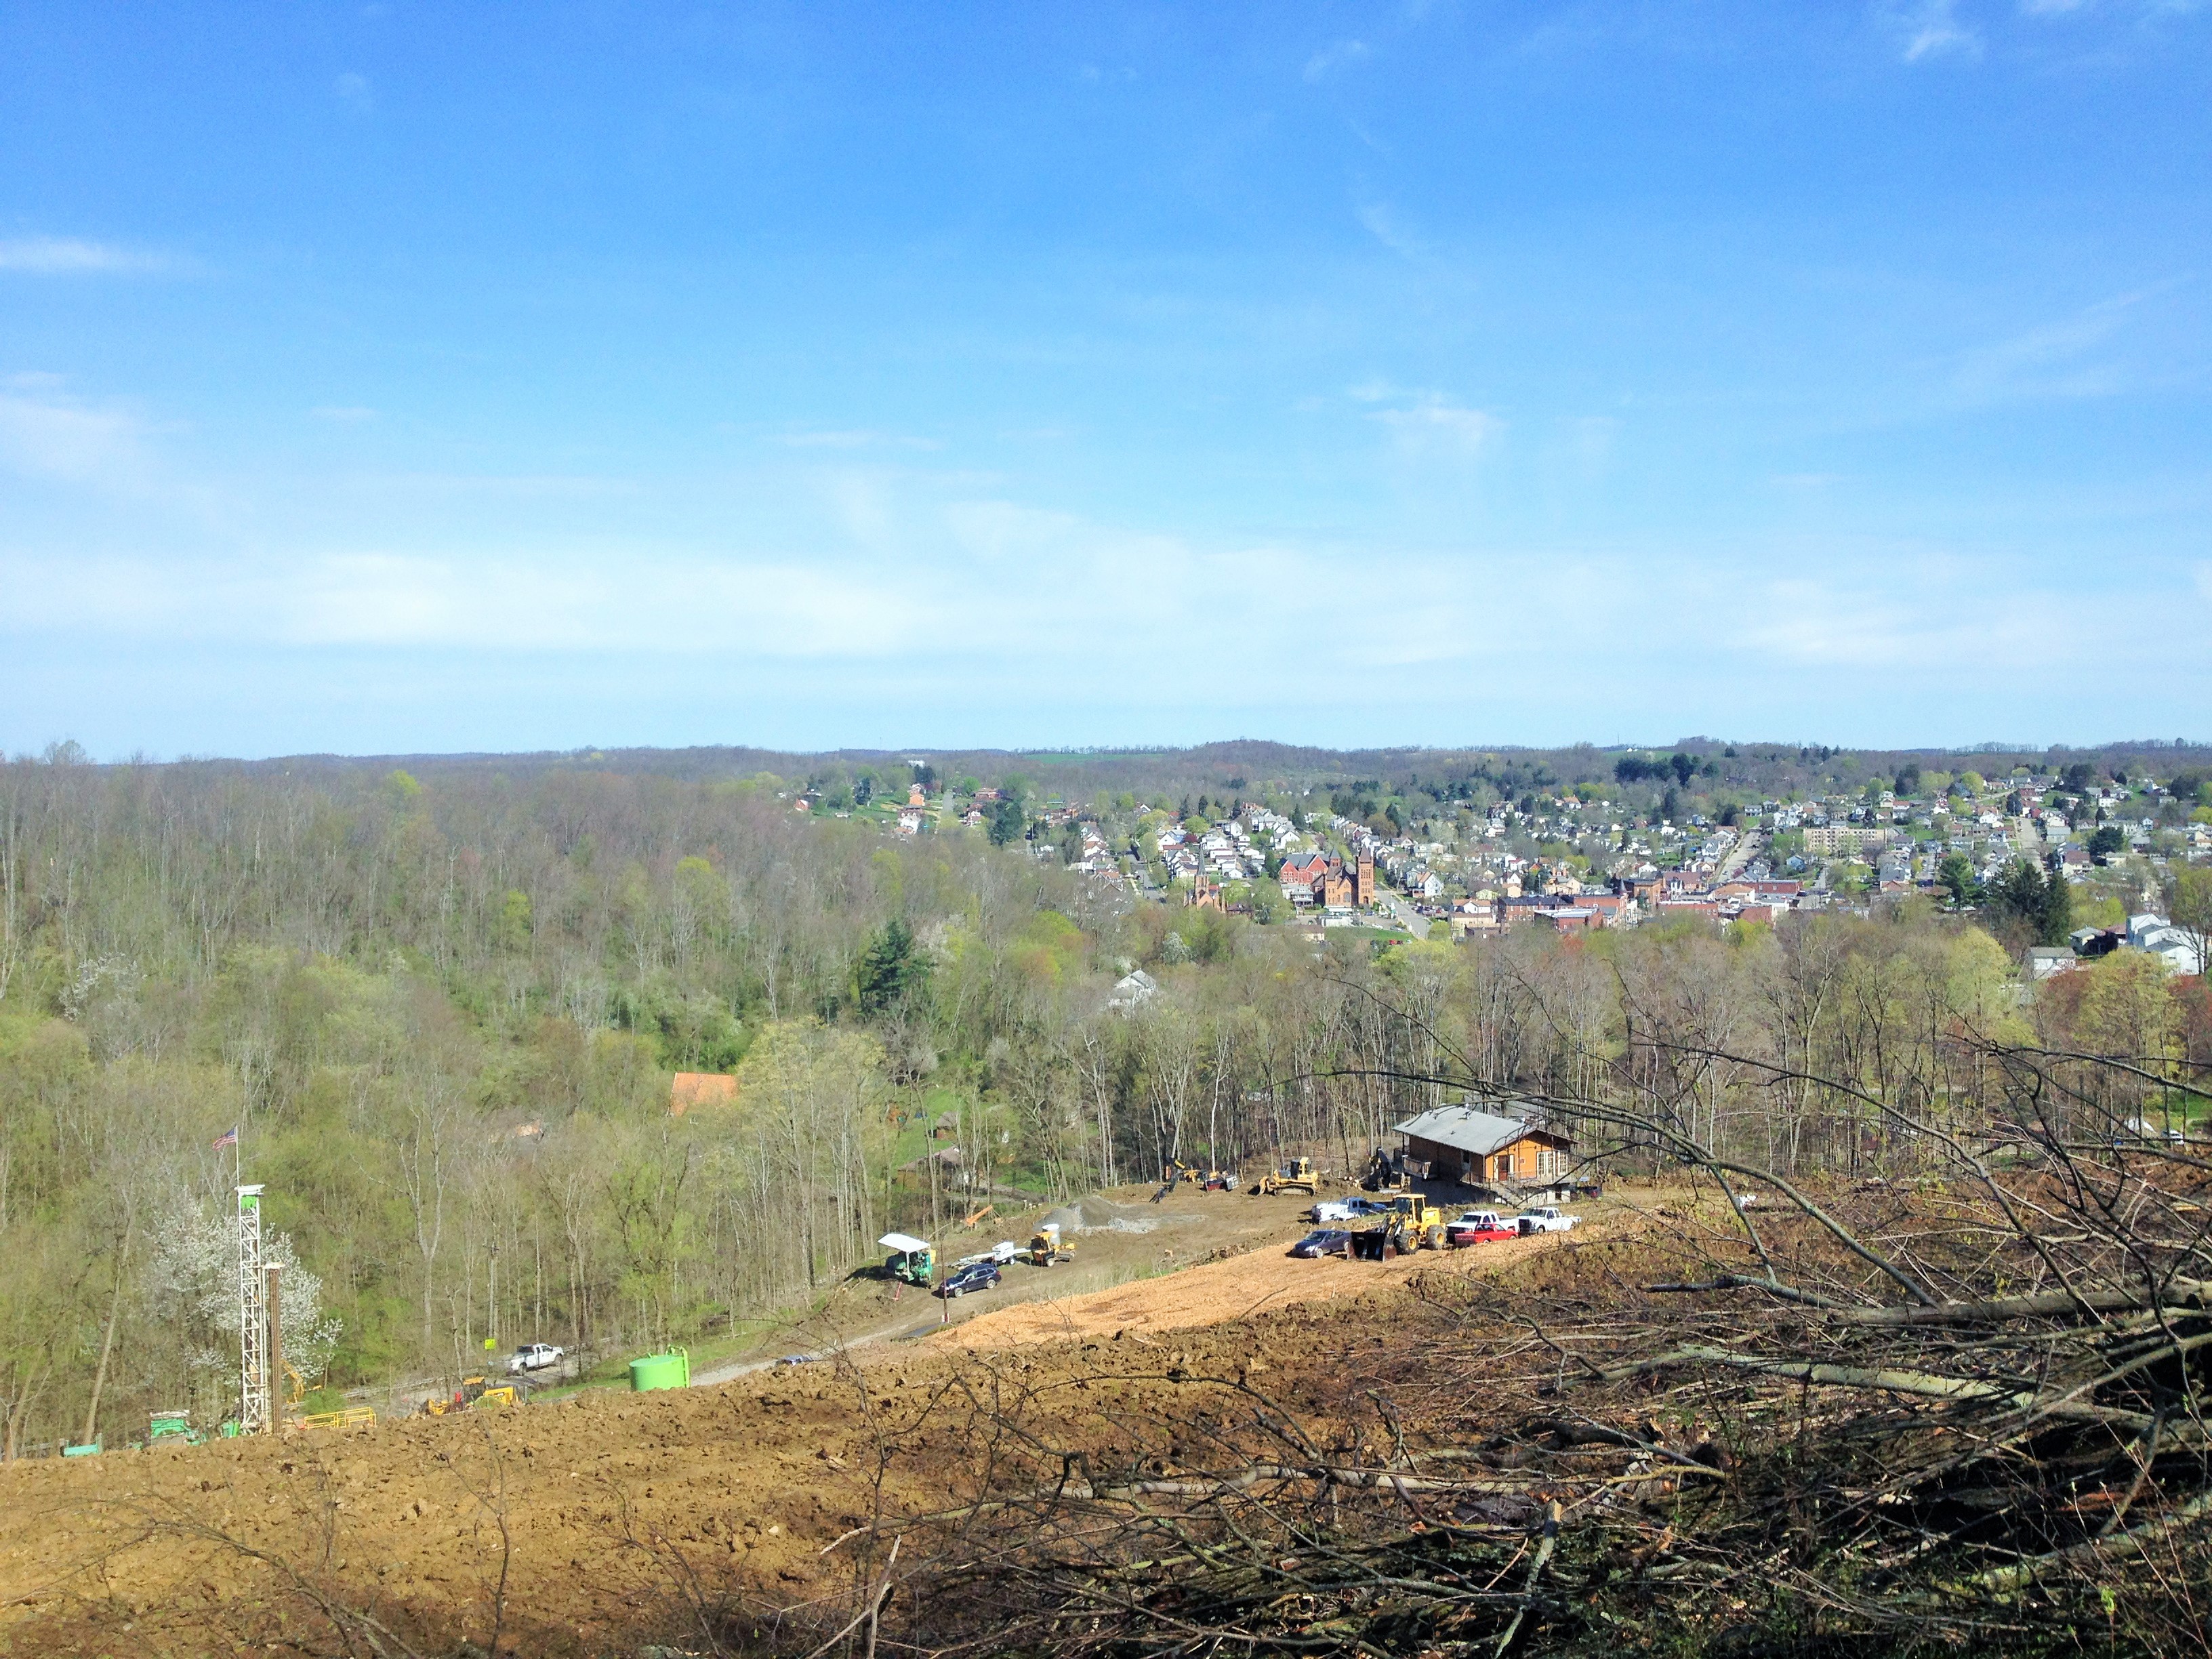
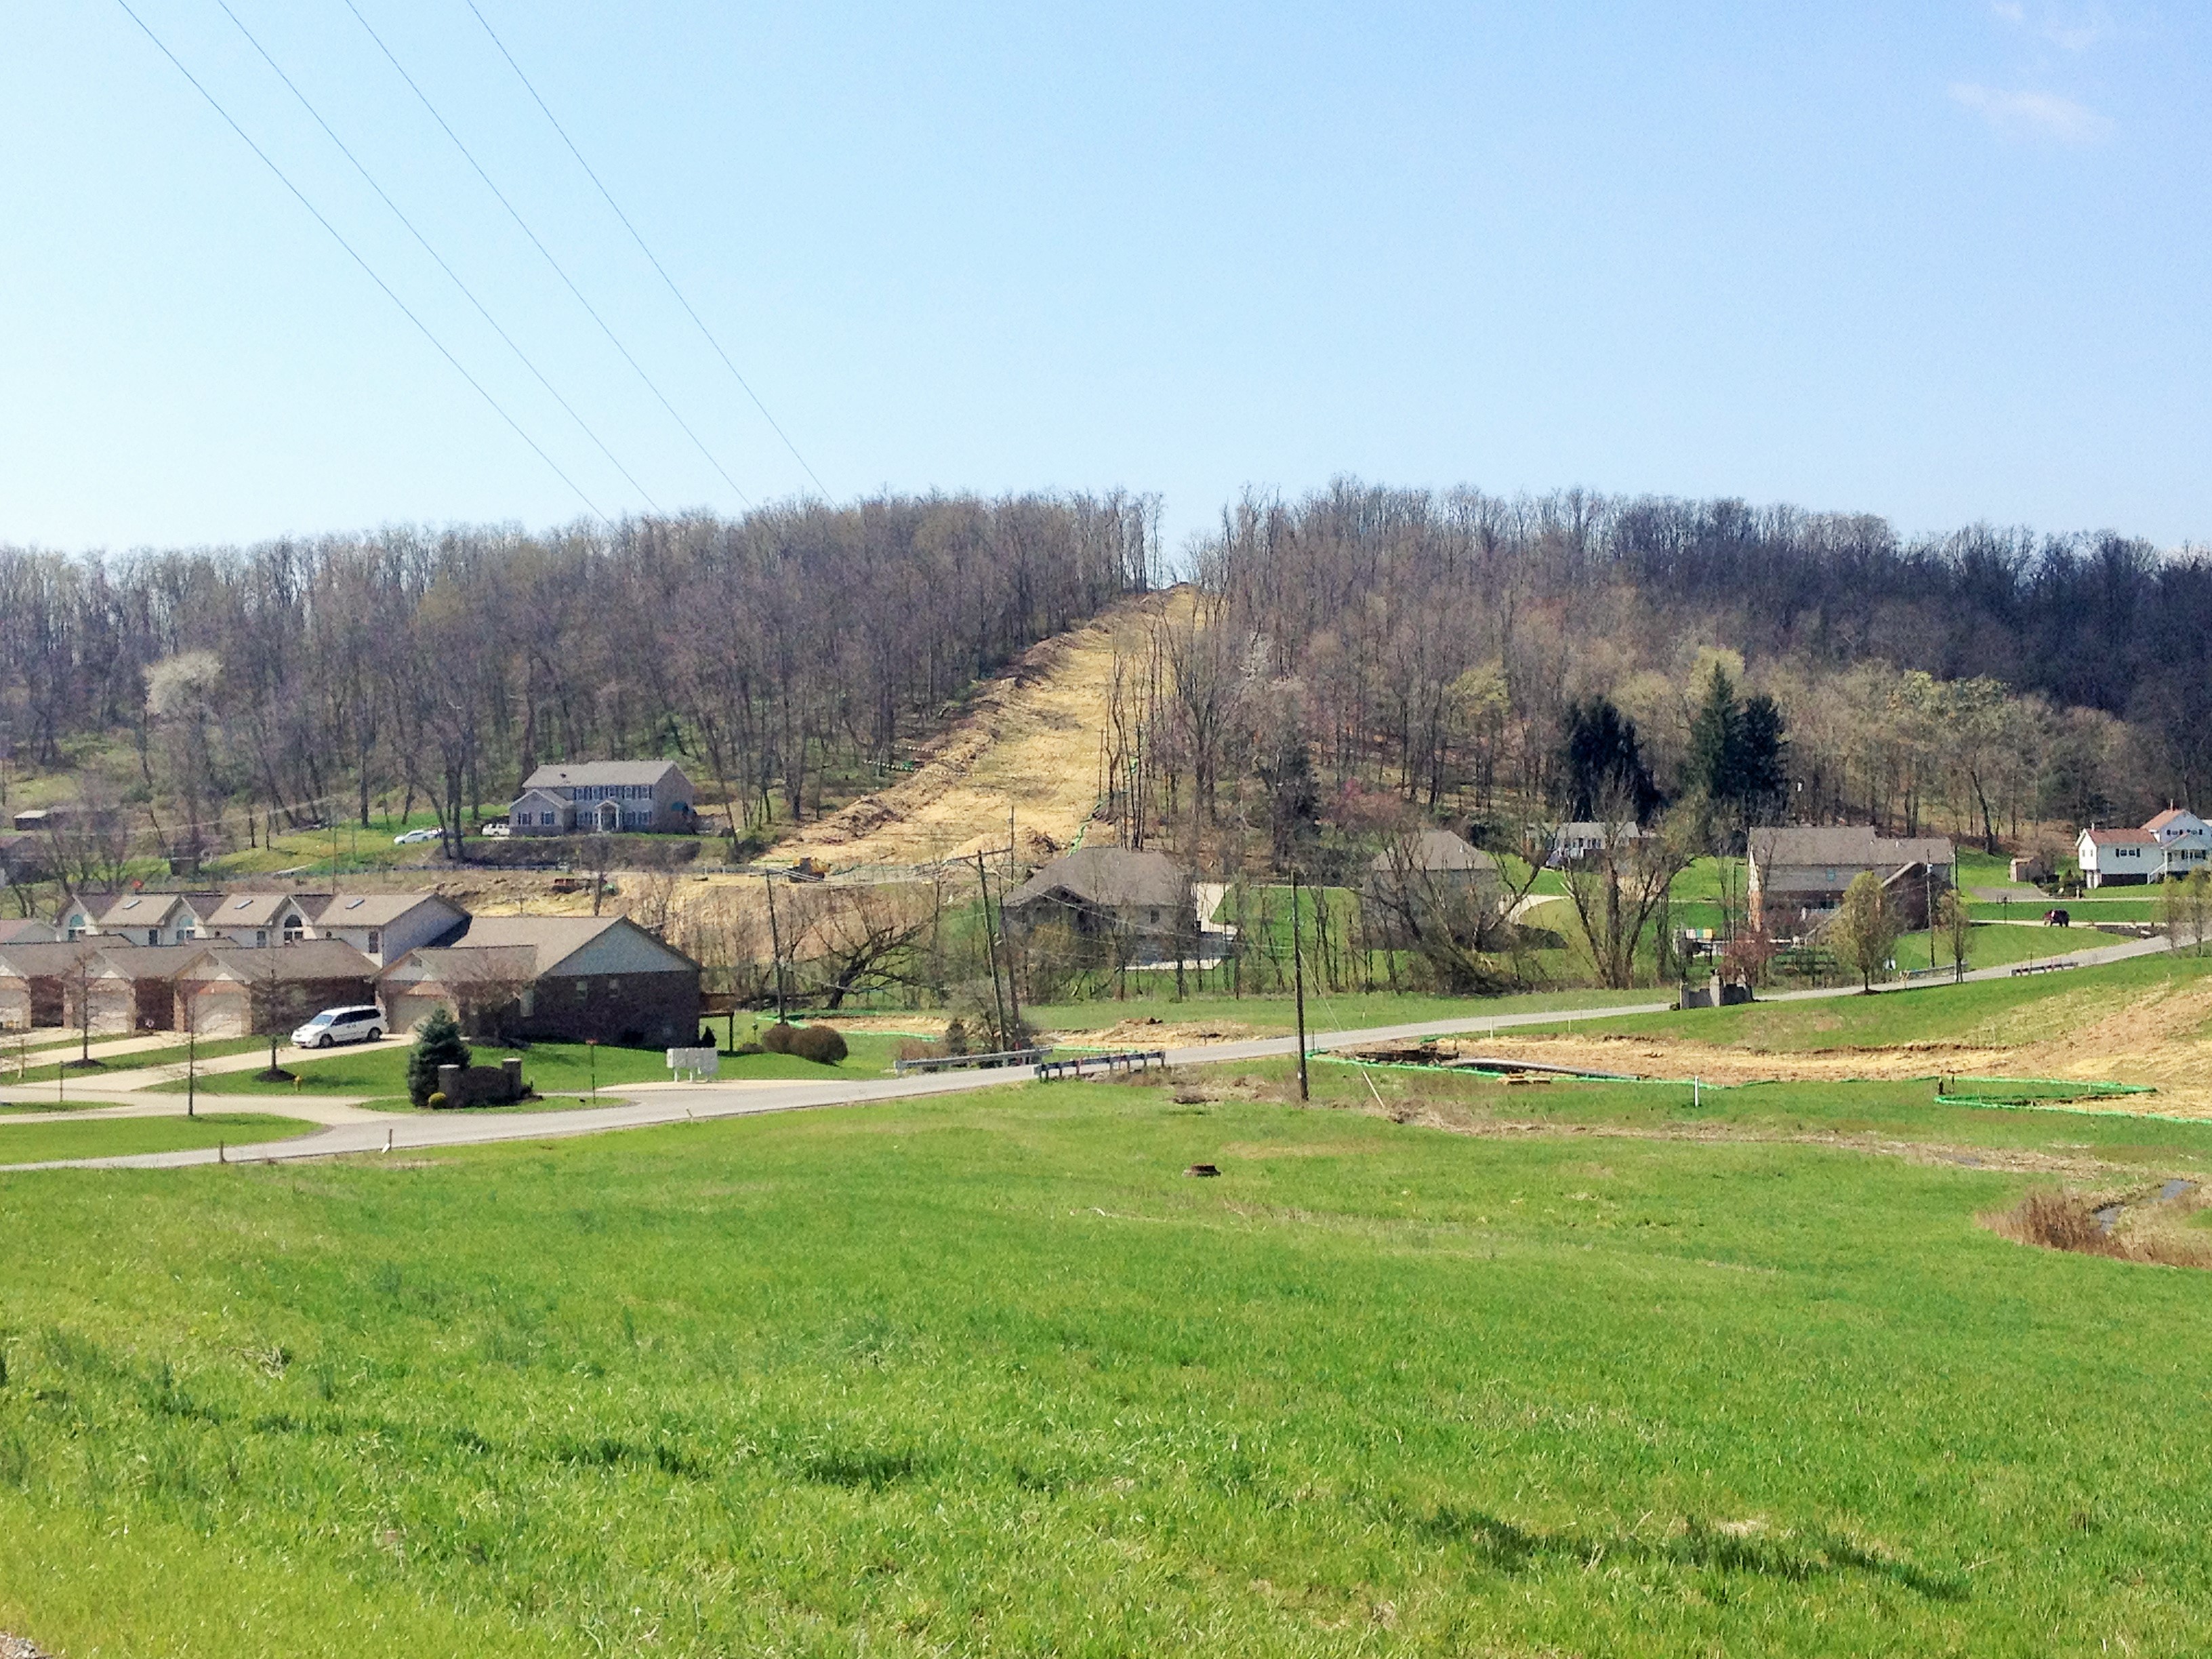
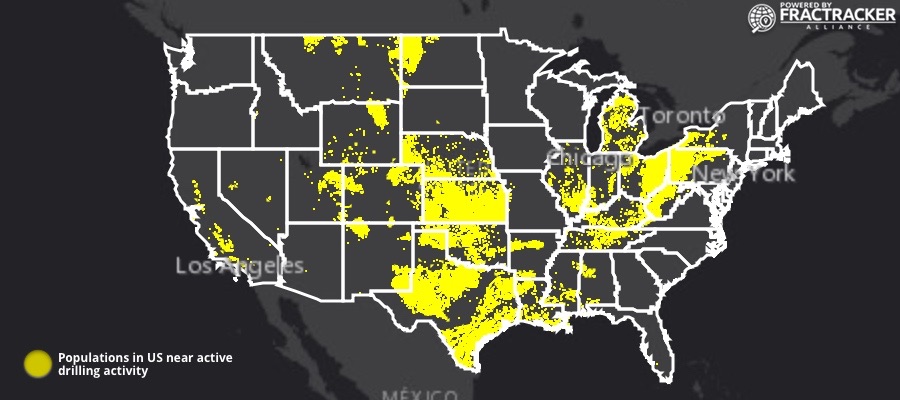
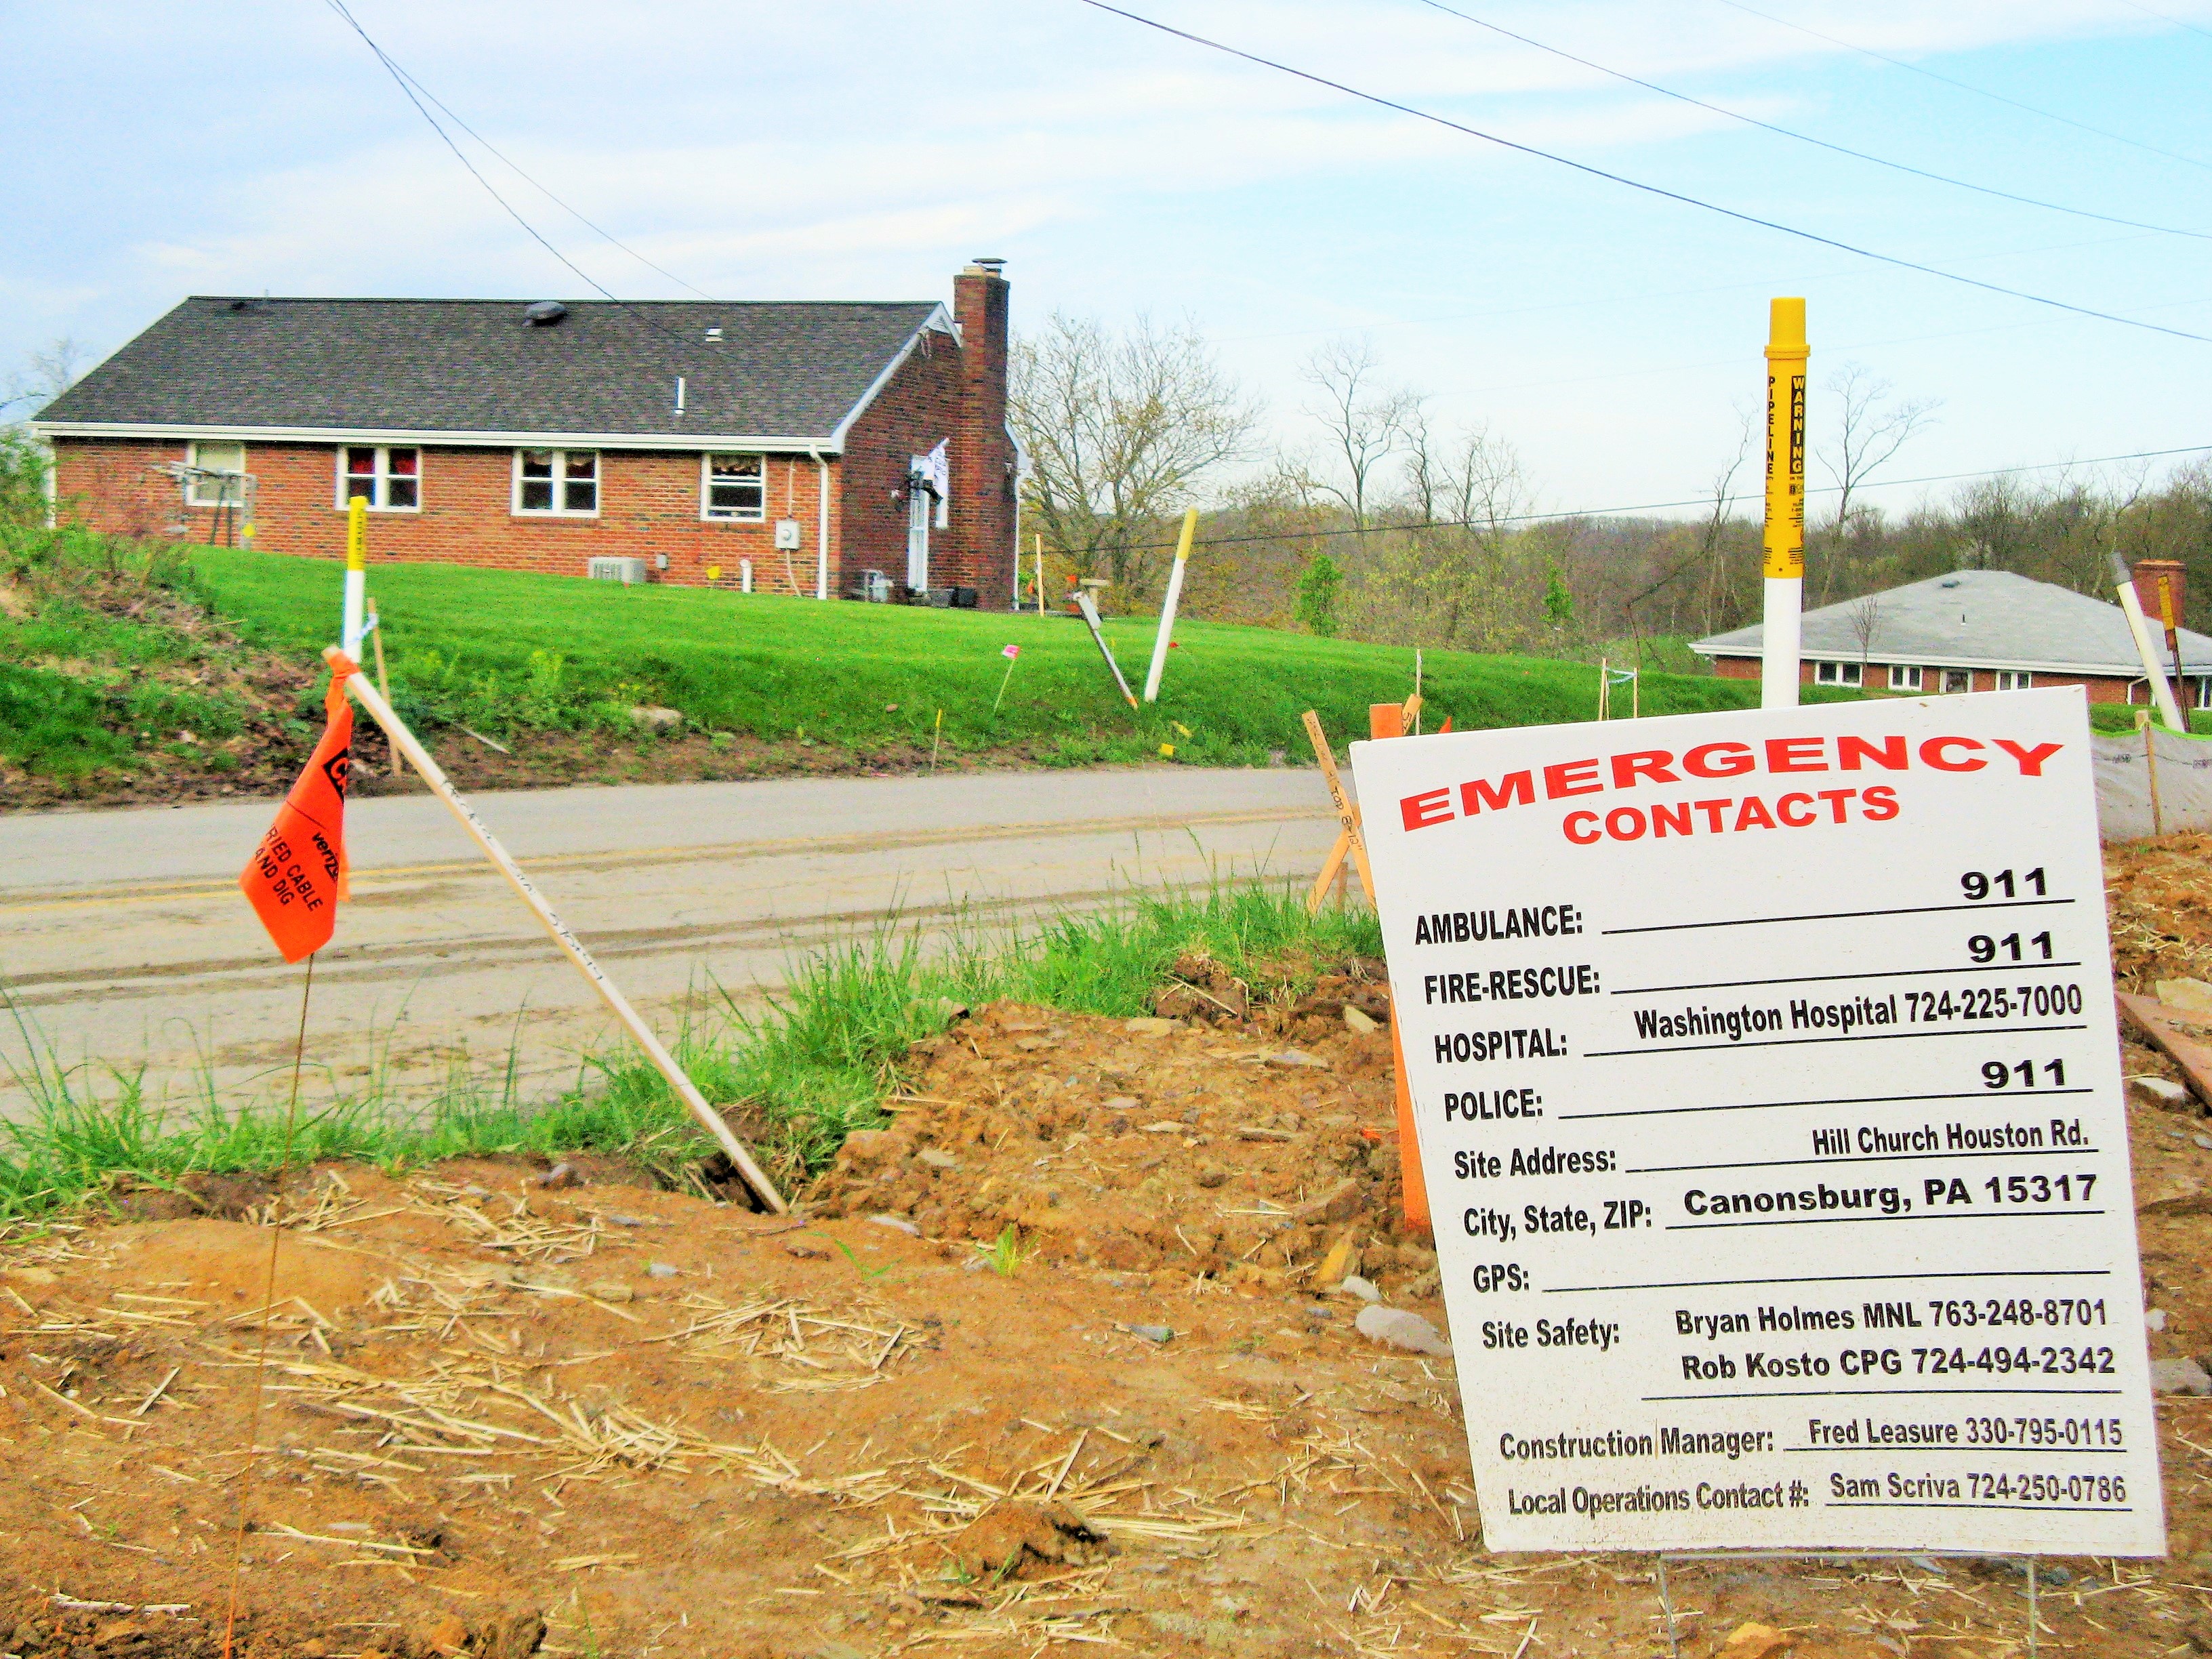
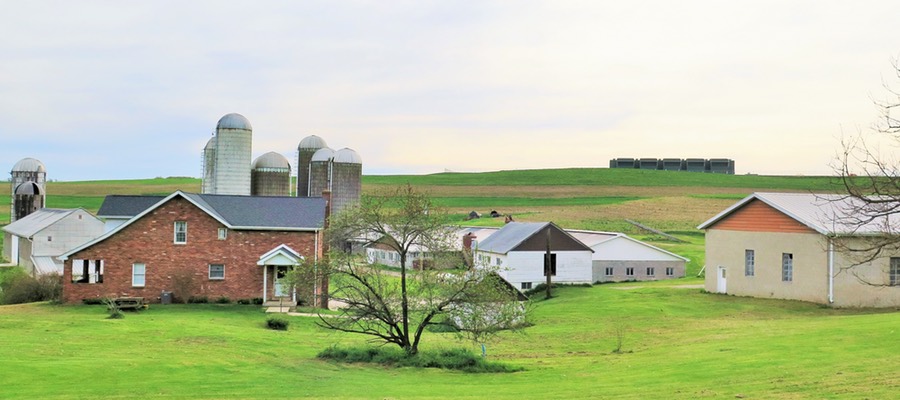
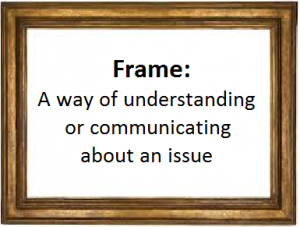
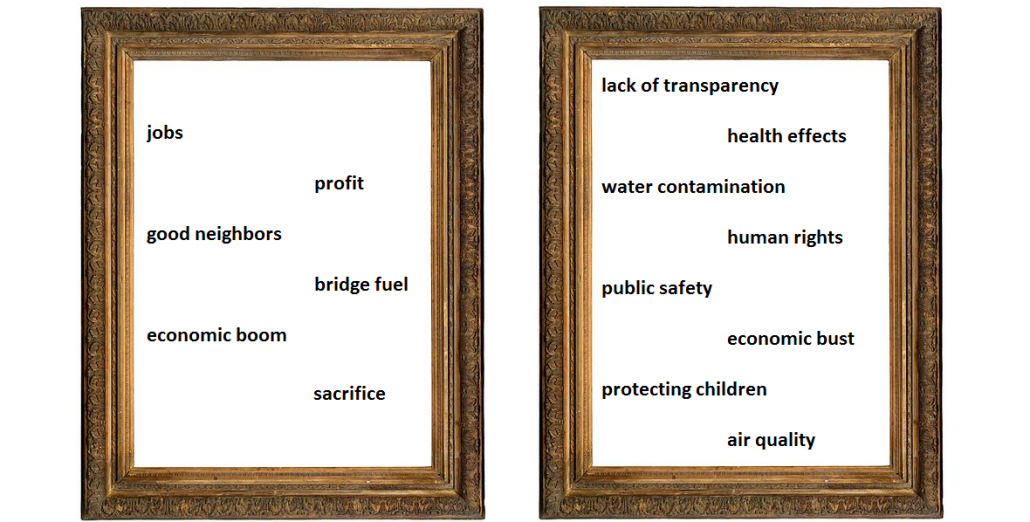
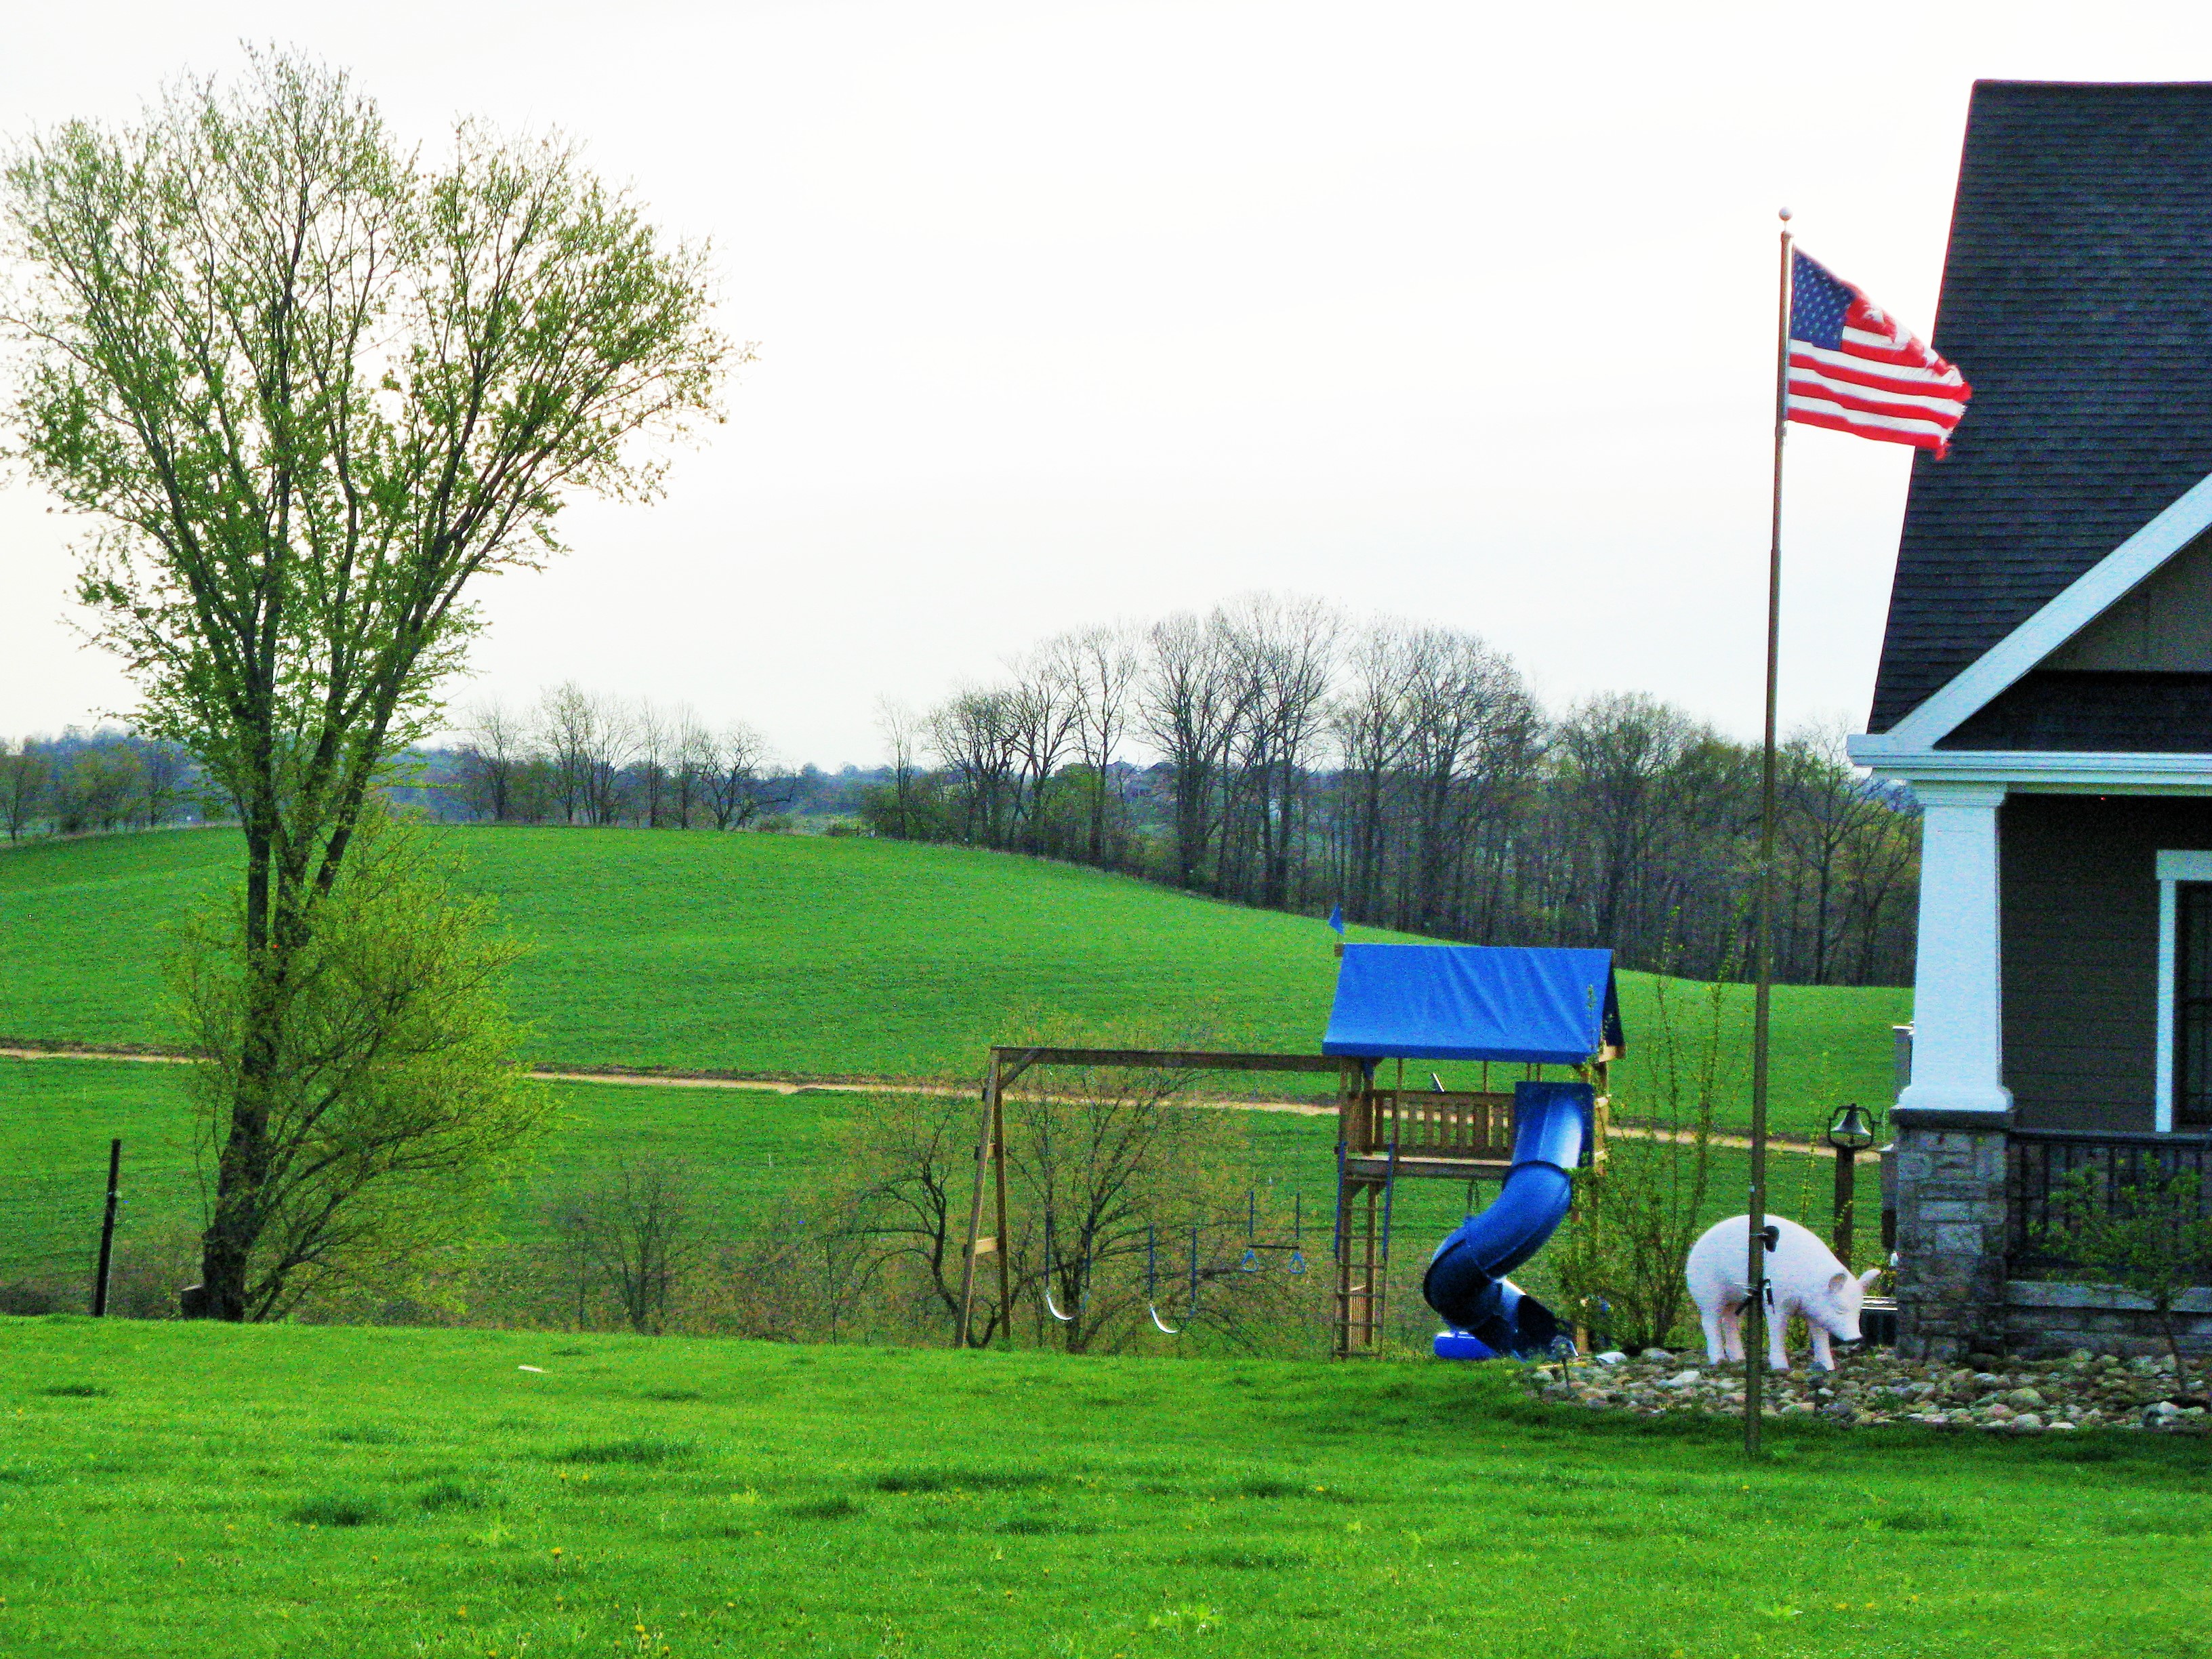
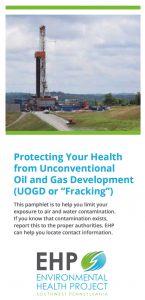
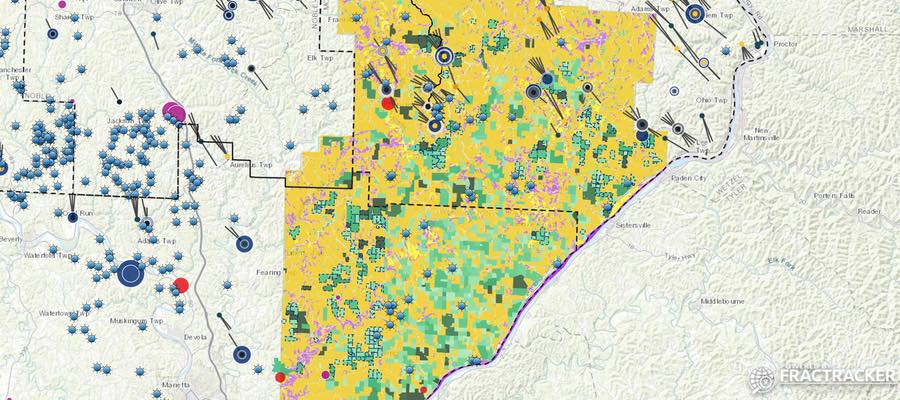


")
")
")
")
")
")

")

")


")
")