Tracking the Movement Against Fossil Fuels
Energy use — whether for heating, cooking, transportation, or manufacturing — is a fact of life for humans on our planet. From the most subsistence-level village life, to the largest metropolises in the world, energy is consumed. But fossil fuels are not a sustainable source of energy. Fossil fuels, by their very nature, are finite in quantity, and increasingly more expensive to extract as the most accessible stores are tapped.
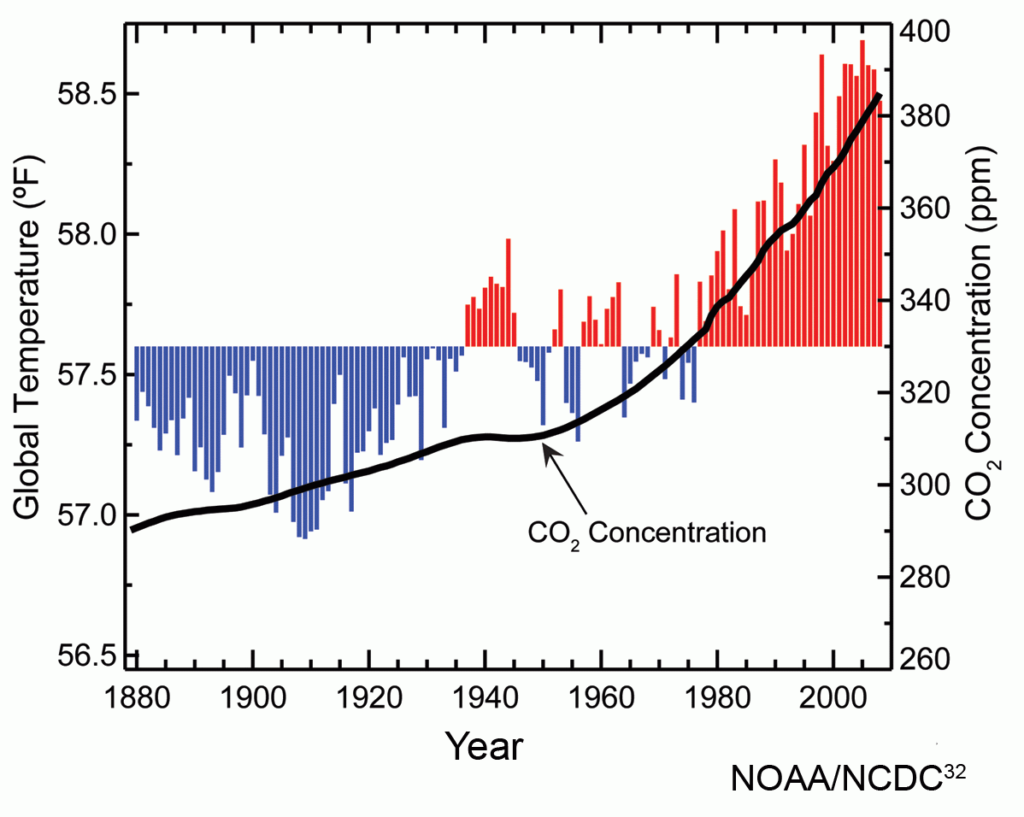
Fossil fuel consumption by-products are driving CO2 and methane to accumulate in the atmosphere, leading towards what most scientists think will be a tipping point to irreversible climate chaos (see image below).
Alternatives to fossil fuels not only exist, but in many cases, are becoming more affordable (see additional information on solar afforability here) than the environmentally-destructive oil, gas, and coal-burning options. Technological advances are changing the way people around the world can live, with cleaner, greener, and more equitable energy sources, as well as more conservation-focused consumption patterns.
Recognizing the benefits to transitioning away from fossil fuels, communities across the US and world-wide, are saying NO to fossil fuel extraction and YES to renewable energy: solar, wind, geothermal, and hydro power, as well as electric vehicles when the electricity that supplies them is renewably generated. Below, and in the following map, we are tracking this movement to a clean energy future.
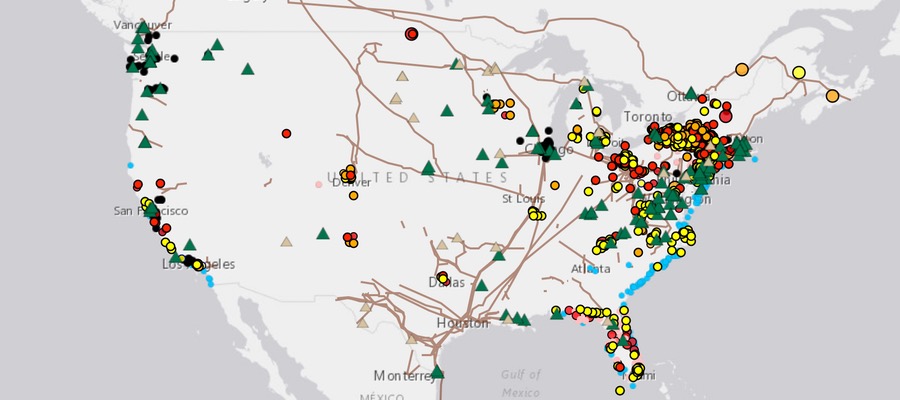
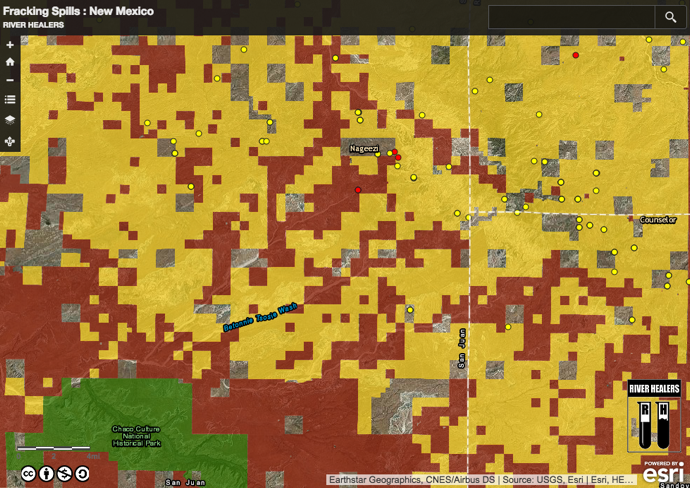
The Resistance – Movements Against Fossil Fuels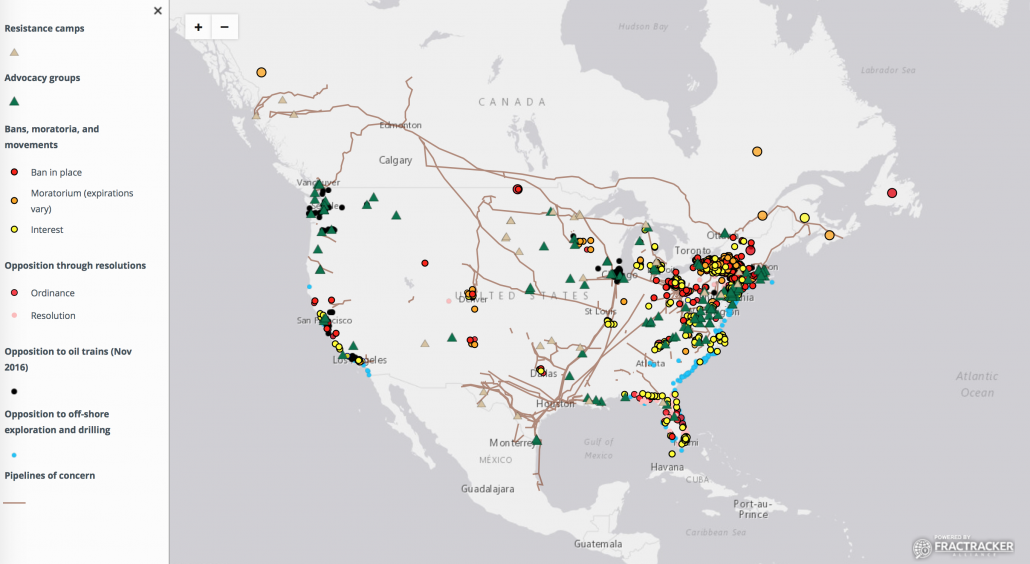 View Live Map | How FracTracker maps work
Municipal law-making
At least 35 communities in California and Washington State have passed resolutions against off-shore drilling. On the East Coast, from Florida to New York State, 44 municipalities have passed resolutions opposing seismic blasting, a form of exploration for oil and gas that has disastrous impacts on marine life, including threatened and endangered marine mammals. What’s further, 105 communities have come out against a combination of offshore drilling and seismic blasting, and at least 26 have taken a stand against offshore drilling.
In Florida, where several bills that would prohibit fracking statewide have been in play for the past few years, individual municipalities have registered their opposition. 43 have signed resolutions opposing fracking, and 7 communities, including Zephyr Hills, Cape Coral, Bonita Springs, Coconut Creek, Dade City, Estero, and St. Petersburg, have passed full ordinances against fracking within their boundaries. In addition to resolutions against drilling in 25 Florida counties, 13 counties in Florida have passed legislation fully banning fracking. These counties are Alachua, Bay, Brevard, Citrus, Indian River, Madison, Osceola, Pinellas, Seminole, St. Lucie, Volusia, Wakulla, and Walton.
In Connecticut, where the geology is not suitable for oil and gas extraction, communities are still proactively protecting themselves against one byproduct of extreme oil and gas extraction: fracking waste disposal. While historically, there are no known instances of fracking waste being exported to Connecticut for disposal, as of March 2018, 46 municipalities are considering rules to ban future disposal of oil and gas wastes within their boundaries, while another 45 have already outlawed the practice, as of late May 2018.
New York State has had a state-wide ban against high-volume hydraulic fracturing since December of 2014. New York led the way in home-rule backed municipal bans and moratoria (temporary prohibitions). Since 2011, 92 NYS municipalities have instituted bans against fracking, and 96 towns, cities, and village have passed moratoria — most of which have now expired. At least another 88 municipalities have also considered banning the practice, prior to the more comprehensive state-wide ban.
The state of Vermont has also banned fracking, and Maryland has instituted a long-term moratorium. Outside of New York State, another 51 municipalities — from Australia to Italy, and New Jersey to California — have passed local ordinances banning fracking. Five countries — Bulgaria, France, Ireland, Germany, and Scotland — have banned the practice altogether. The countries of Wales, The Netherlands, and Uruguay have active moratoria. Moratoria are also currently in place in Cantabria, Spain; Victoria, Australia; Newfoundland, Canada; Paraná, Brazil; Entre Rios, Argentina; and the Eastern Band of Cherokee Indians, as well as the Turtle Mountain Band of Chippewa Indians.
Crossing Boundaries
Coordinated efforts are happening — across state lines, linking urban and rural communities — to fight new fossil fuel infrastructure on local and regional levels. On both sides of the New York / Connecticut border, communities are uniting against the Cricket Valley Energy Center, an 1,100 MW fracked gas-powered plant that opponents say presents environmental and human health risks and diverts NYS’s renewable energy focus back to fossil fuels.
More than 30 communities in Pennsylvania along the route of the proposed PennEast pipeline have passed resolutions opposing that pipeline. Nearly 80 communities in New York and New Jersey have come out against the proposed Pilgrim Pipeline, designed to carry light crude from the Port of Albany to the Atlantic Coast refineries. And a plan by Crestwood/ Stagecoach Energy to store hydrocarbons in abandoned salt caverns along the shores of Seneca Lake in the scenic Finger Lakes Region of central New York met unprecedented sharp opposition. As of early 2018, over 32 towns and counties, and close to 400 local businesses had signed resolutions opposing the gas storage plans. Pressure from business and government interests likely contributed to scaling down of the storage plans from butane, ethane, and natural gas, to only LNG.
Unconventional Bans
A 2013 ban on fracking in Hawai’i was met initially with some puzzlement, since there are no oil and gas deposits within the lava-created rock that makes up the Big Island. However, this ban was not against fracking for gas; rather, it dealt with fracking to harness geothermal energy. The Puna Geothermal Venture Plant, located on Hawaii’s highly geologically active East Rift Zone, was controversial when it was built twenty-five years ago. Now, with lava already on the property and poised to potentially inundate the facility, opponents are pushing for its complete closure — if the plant survives the massive flow from Kilauea, now devastating Lower Puna, that started in early May 2018.
Transportation Concerns
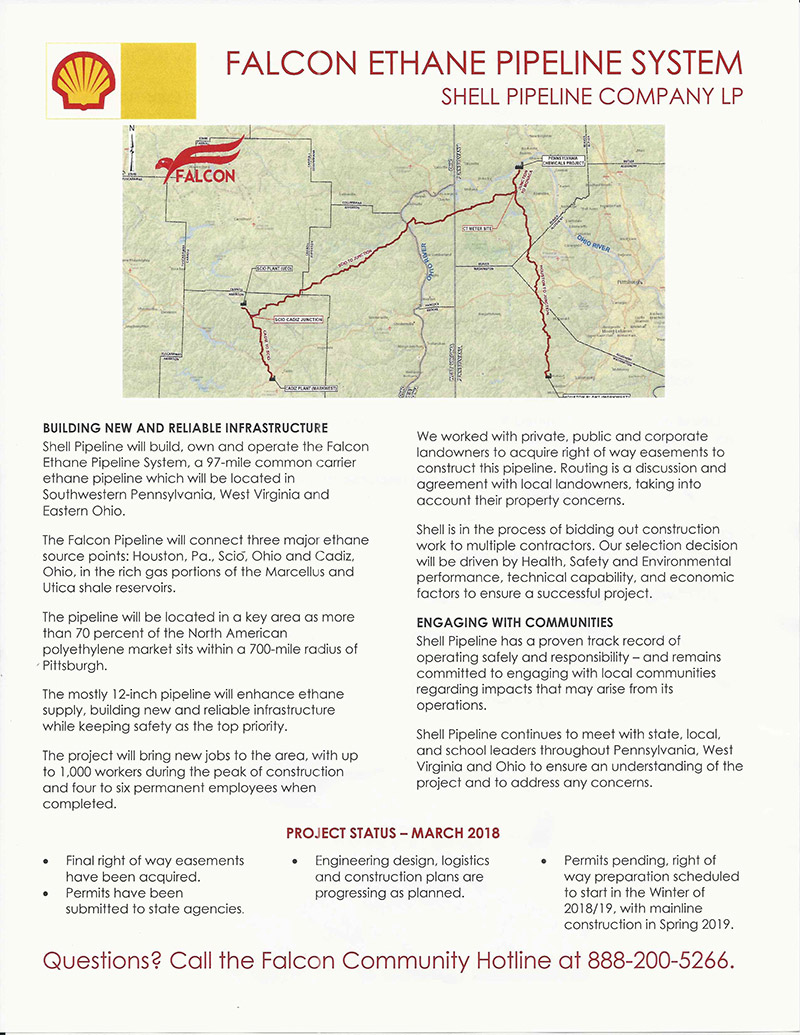
Fossil fuels are transported through a variety of mechanisms. Pipelines are the most common means of conveyance; the US Energy Information Administration (EIA) estimates that 3 million miles of oil and gas transmission and delivery pipelines crisscross the US. The Bureau of Transportation Statistics estimated in 2014 that there were nearly 1.6 million miles of gas transmission pipelines in the US, and another 160,521 miles of oil pipelines. Pipeline safety has been a concern for years, and as pipeline build-out continues, so does the litany of accidents due to failures.
A widely used alternative to moving light crude via pipelines is to transport it by rail, from oil fields in Canada and the Dakotas to coastal refineries. In 2014, crude oil production from North Dakota was nearly 1 million barrels per day. The same year, Texas was producing 2.9 million barrels per day. Statistics from the Association of American Railroads (NY Times, 4/12/2014) indicate that in 2013, 407,642 carloads (700 barrels = 1 carload) of crude oil were shipped across the US. That’s more than 285 million barrels, or about 80% of the crude oil shipped to port, that were transported via rail.
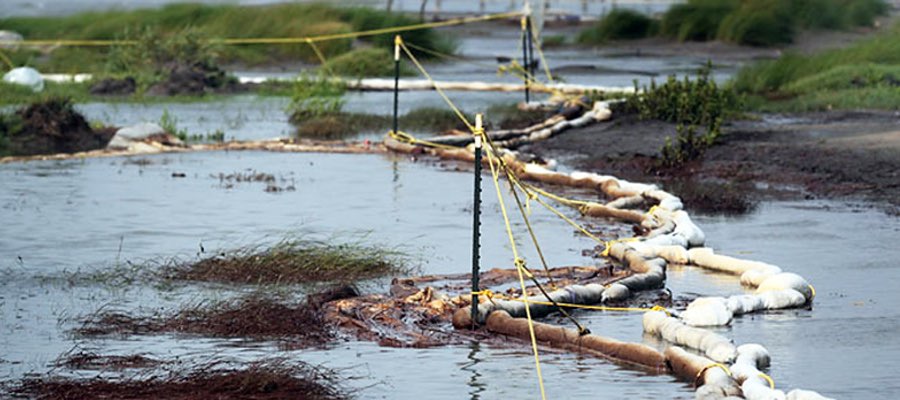
Accidents resulting from the derailment of freight cars carrying crude oil can be disastrous to both human communities, and to the environment. The Lac-Mégantic derailment in July, 2013 resulted in a death toll of 47, and the near complete devastation of the downtown of this small Quebec town. Benzene contamination at the site was heavy, and the Chaudière River was contaminated with 26,000 gallons of the light crude, which impacted towns 50 miles downstream.
The disaster at Lac-Mégantic led to a rallying cry among policy-makers, regulators, and environmentalists, who continued to raise awareness of the risks of “crude by rail”, or, as the freight cars are often known, “bomb trains”. Within 2 years after the disaster, over 180 communities from Washington State, to California, to New York, and New Jersey, passed local resolutions demanding better safety regulations, and exhorting officials to stop shipping crude through their communities.
Earlier research by FracTracker Alliance on “bomb train” routes through major New York urban centers like Buffalo and Rochester showed dozens of K-12 public and private schools are within the ½-mile blast zones. Without adequate evacuation plans, the injury or loss of life — were a derailment to happen within the cities — could be extensive. The importance of public critique about the transportation of light crude by rail cannot be overstated.
Transitions to renewable energy
communities making it happen
The answer to a clean and renewable energy future, while rooted in the resistance to fossil fuel build out, consists of much more than protesting, and saying “NO”. A clean energy future requires goal-setting, and a vision to commit to change. It takes communities investing in a healthy future for all community members—today, tomorrow, and into the next century.
Clean, Renewable Energy Movements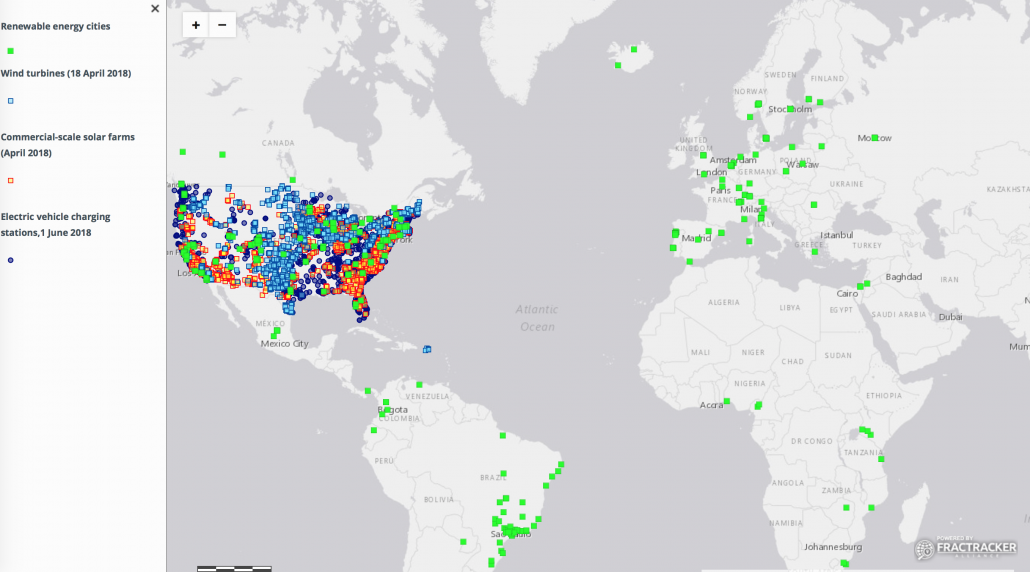 View Live Map | How FracTracker maps work
To that end, nearly 350 communities worldwide (so far) have set tangible goals to transition off fossil fuels – see map above. These communities are our beacons for a sustainable planet. They take seriously the dangerous ecological cascades posed by climate change and have made creative and conscious commitments to future generations of Earth’s biota.
As of early 2018, at least 62 cities in the US have set goals for being powered by renewable energy before the middle of the 21st century according to Sierra Club’s tally of municipalities striving for clean energy power. Five of these communities — Kodiak Island, AK; Rock Port, MO; Greensburg, KS, Burlington, VT; and Aspen, CO, have already met their goals. EcoWatch collected information on over 100 cities around the world that are now powered by at least 70% renewables, and the organization CDP noted close to 200 cities and towns with ambitious targets for renewable power within the next two decades.
Across the US, over 27,300 MW of commercial solar has been installed as of April, 2018. And currently, wind turbines provide close to 59,000 MW of clean energy, nationwide. As of June, 2018, there were more than 18,000 electric vehicle charging stations across the country. While many municipalities are committed to replacing fossil fuels with renewable energy sources, we have a long way to go. Change must happen exponentially in order to meet ambitious goals of even 50% renewable energy in the next decade. For example, in 2011, New York State was meeting approximately 19% of its energy needs from renewable energy—largely from hydropower. Governor Cuomo’s “50 by 30” plan—mandating a clean energy standard of 50% renewables by 2030—sets forth goals that will require aggressive advocacy, the will of decision-makers, economic funding and incentives, education, and the steadfast insistence of the citizenry if we are to have a chance at slowing climate change and curbing greenhouse gas emissions.
Other resources on resistance
On every continent of the planet, there are citizen-based movements to address the impacts of coal on the environment. CoalSwarm has compiled a dynamic listing on a country-by-country basis. Similarly, a sister project, FrackSwarm, is a clearinghouse for citizen’s movements around the world that are addressing the impacts of fracking. Both CoalSwarm and FrackSwarm advocate strongly for a movement to clean energy everywhere. Both sites feature detailed background information on movements around the world and are partner projects to SourceWatch and the Center for Media and Democracy.
Halt the Harm Network, another organization closely allied with FracTracker Alliance, has developed a robust network of groups leading the fights against the oil and gas industry. Their database is searchable by skills, geography, and interests. Many of the organizations included in their database are also included in this map of resistance advocacy and activism groups fighting for a clean energy future.
Last, but not least, in 2017, FracTracker Alliance partnered with E2 to create a resource called “Mapping Clean Energy: New York”. You can view the maps that show clean energy jobs, solar, wind, and electric vehicle resources here. FracTracker also developed clean energy interactive maps for Pennsylvania, Ohio, Illinois, Michigan, and Missouri.
Next steps
FracTracker will continue to update our Clean Energy Action Maps project, and actively solicit input and feedback from the public. If your advocacy group is not listed on our maps above, please complete the form at the bottom of the project page. We’ll compile public input, and regularly add new organizations to this resource.
Of note: We will soon be retiring our Alliance Map in favor of these maps, as we believe it is extremely important to capture the depth and breadth of the movements against fossil fuels and in support of renewables. This project is our effort to make connections across the globe, whether or not we are in direct communication with the groups on the maps.
If you have any questions about this work, please email: info@fractracker.org.

