Recommendations for an EIR to prioritize Kern County Frontline Communities
Kern County Environmental Impact Report
As we have discussed in previous reports, Kern County is required to develop a new set of environmental impact report (EIR) requirements for permitting new oil and gas wells.
With this recent development, it is necessary to provide science-based recommendations for the EIR to prioritize the protection of the health of frontline communities. Frontline communities bear the most risk. Emissions from oil and gas infrastructure and exposure to water and soil contamination most affect those living closest. It is therefore vital for an EIR to institute protections that address these known and well-established sources of exposure. In addition, the EIR must prioritize a requirement by law that all regulatory information is equitably available and imparted to Frontline Communities; with Kern County, this means providing regulatory notices in Spanish, the predominantly spoken language in this area, according to household census data.
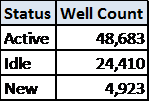
In preparation of the Kern County rule-making process, FracTracker Alliance has prepared new analyses of Kern County communities. These analyses have mapped and assessed the distribution of oil and gas wells within Kern County for proximity to sensitive receptors. This information is vital to understand how the “most drilled County” in the United States manages the risks associated with oil and gas extraction. According to CalGEM data updated September 1, 2020, there are 78,016 operational oil and gas wells countywide. Of these, 5,906 (7.6%) are within 2,500 feet of a sensitive receptor, receptors being homes, schools, healthcare facilities, child daycare facilities, and elderly care facilities. Thirty-six CHHS healthcare facilities and 35 schools in Kern County are within 2,500 feet of an operational oil and gas well. In fact, 646 operational wells are within 2,500 feet of a school in Kern County. Most of these at-risk, sensitive receptors are in Kern’s cities, large and small.
Table 1. Well Counts in Kern County
Most of the population of Kern County is in its cities. Unincorporated, rural areas of Kern County are in majority zoned for large estate landownership and agriculture, and have low population density, rather than designated for residential, single-family homes, apartments, developments, and mobile homes. Oil and gas extraction operations and well sites are dispersed throughout the county, including near and within the residentially-zoned areas of cities. Given that the county’s population density is highest in cities, these areas present the greatest public health risk for exposures to toxic emissions and spills from fossil fuel extraction operations. This analysis focuses specifically on the Frontline Communities of Kern County, where oil and gas extraction is occurring near city limits.
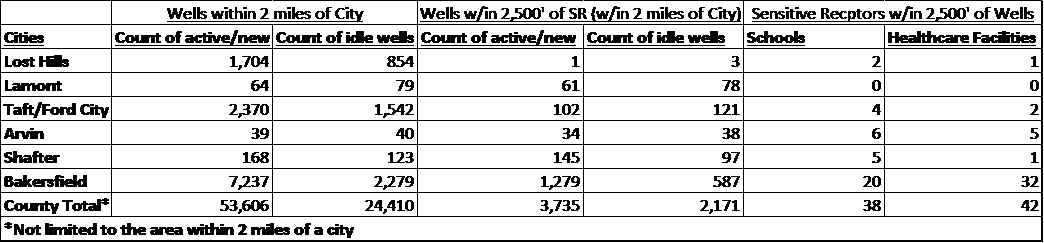
Table 2. Operational oil and gas well counts near cities and sensitive receptors.
Frontline Communities
These include Lost Hills, Lamont, Taft, Arvin, Shafter and Bakersfield. In Table 2 (above) are counts of operational wells within two miles of each city, along with demographic profiles for each incorporated/unincorporated city, based on American Community Survey (2013-2018) census data (downloaded from Census.gov). Population estimates are based on the ACS block groups. For block groups larger than city boundaries, the population was assumed to be within city limits, although in certain cases, such as Arvin, a small section of a block group was eliminated from the city demographic counts. This assumption is validated by the county and city zoning parcels. The maps below in Figures 1 – 6 show the municipal zoning parcels for these cities, with maps that include operational oil and gas wells. Note the proximity of residential- and urban-zoned parcels to oil and gas extraction in Kern County, and the difference in zoning between the cities and the rest of the county. Cities are zoned for residences, including apartments, single-family homes, and mobile homes. Most of the rest of the county is agriculture and estates, where predominantly wealthy residents and corporations own large holdings.
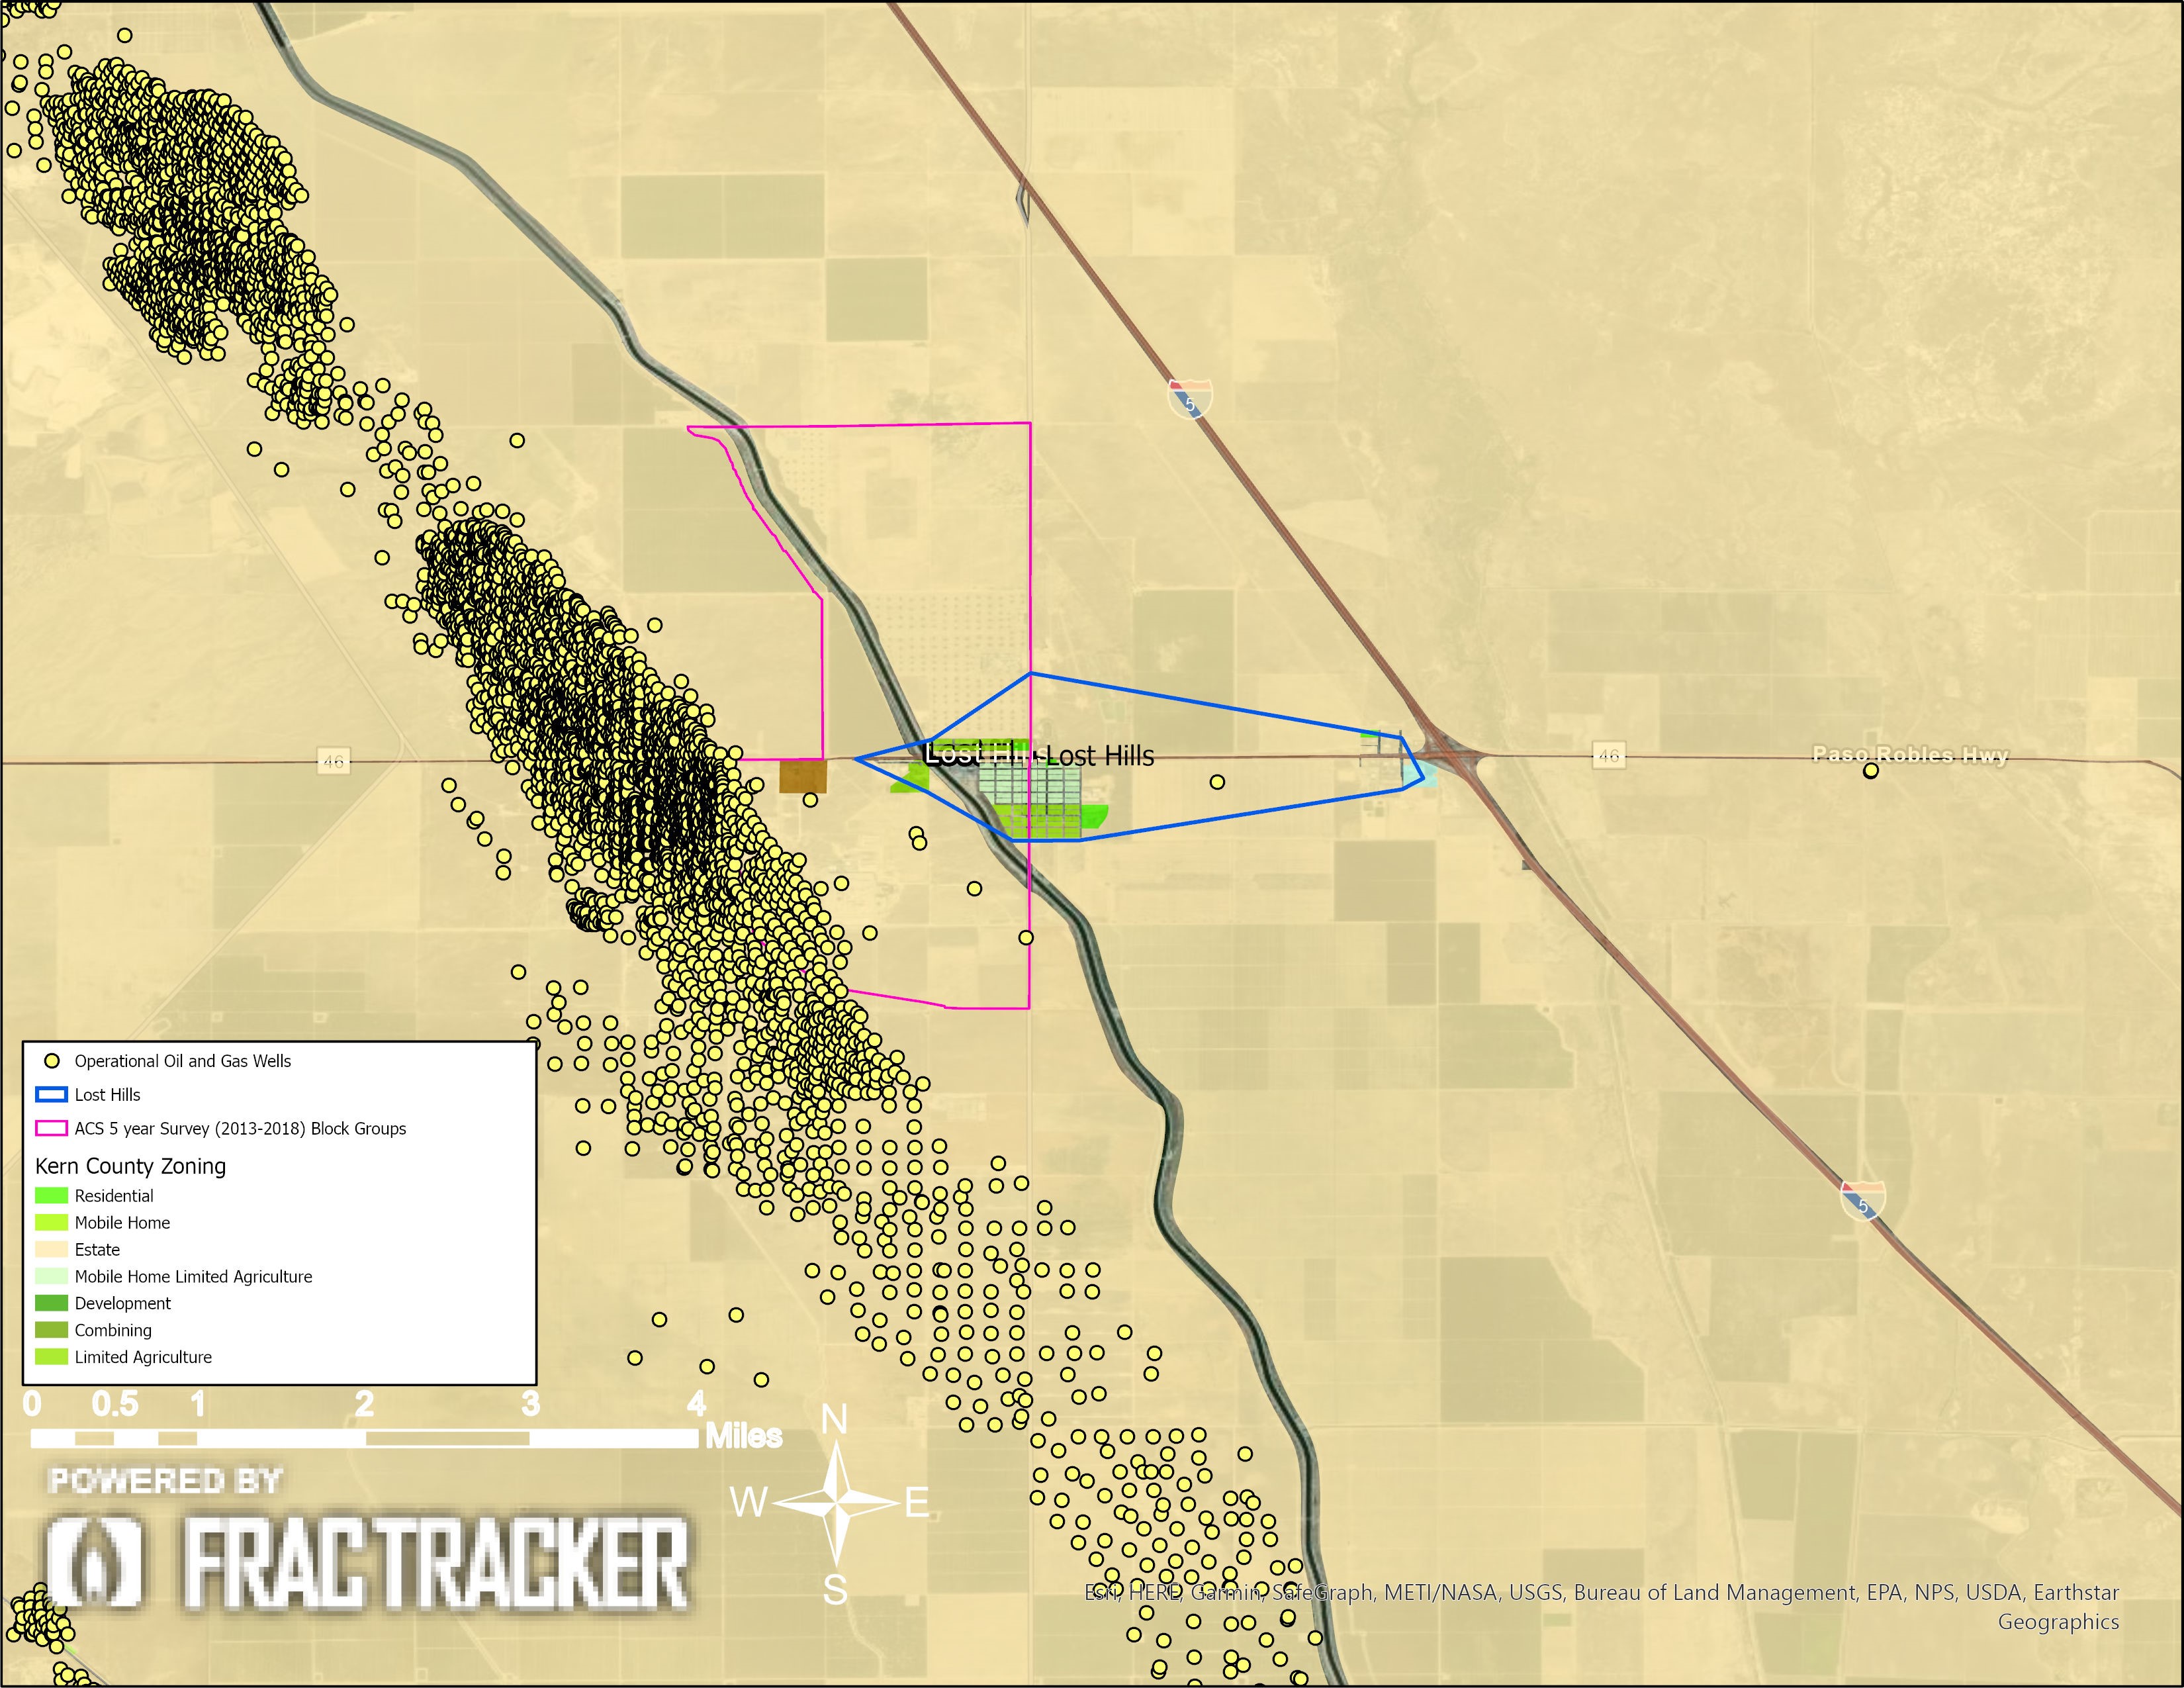
Figure 1. Municipal zoning boundaries of the City of Lost Hills.
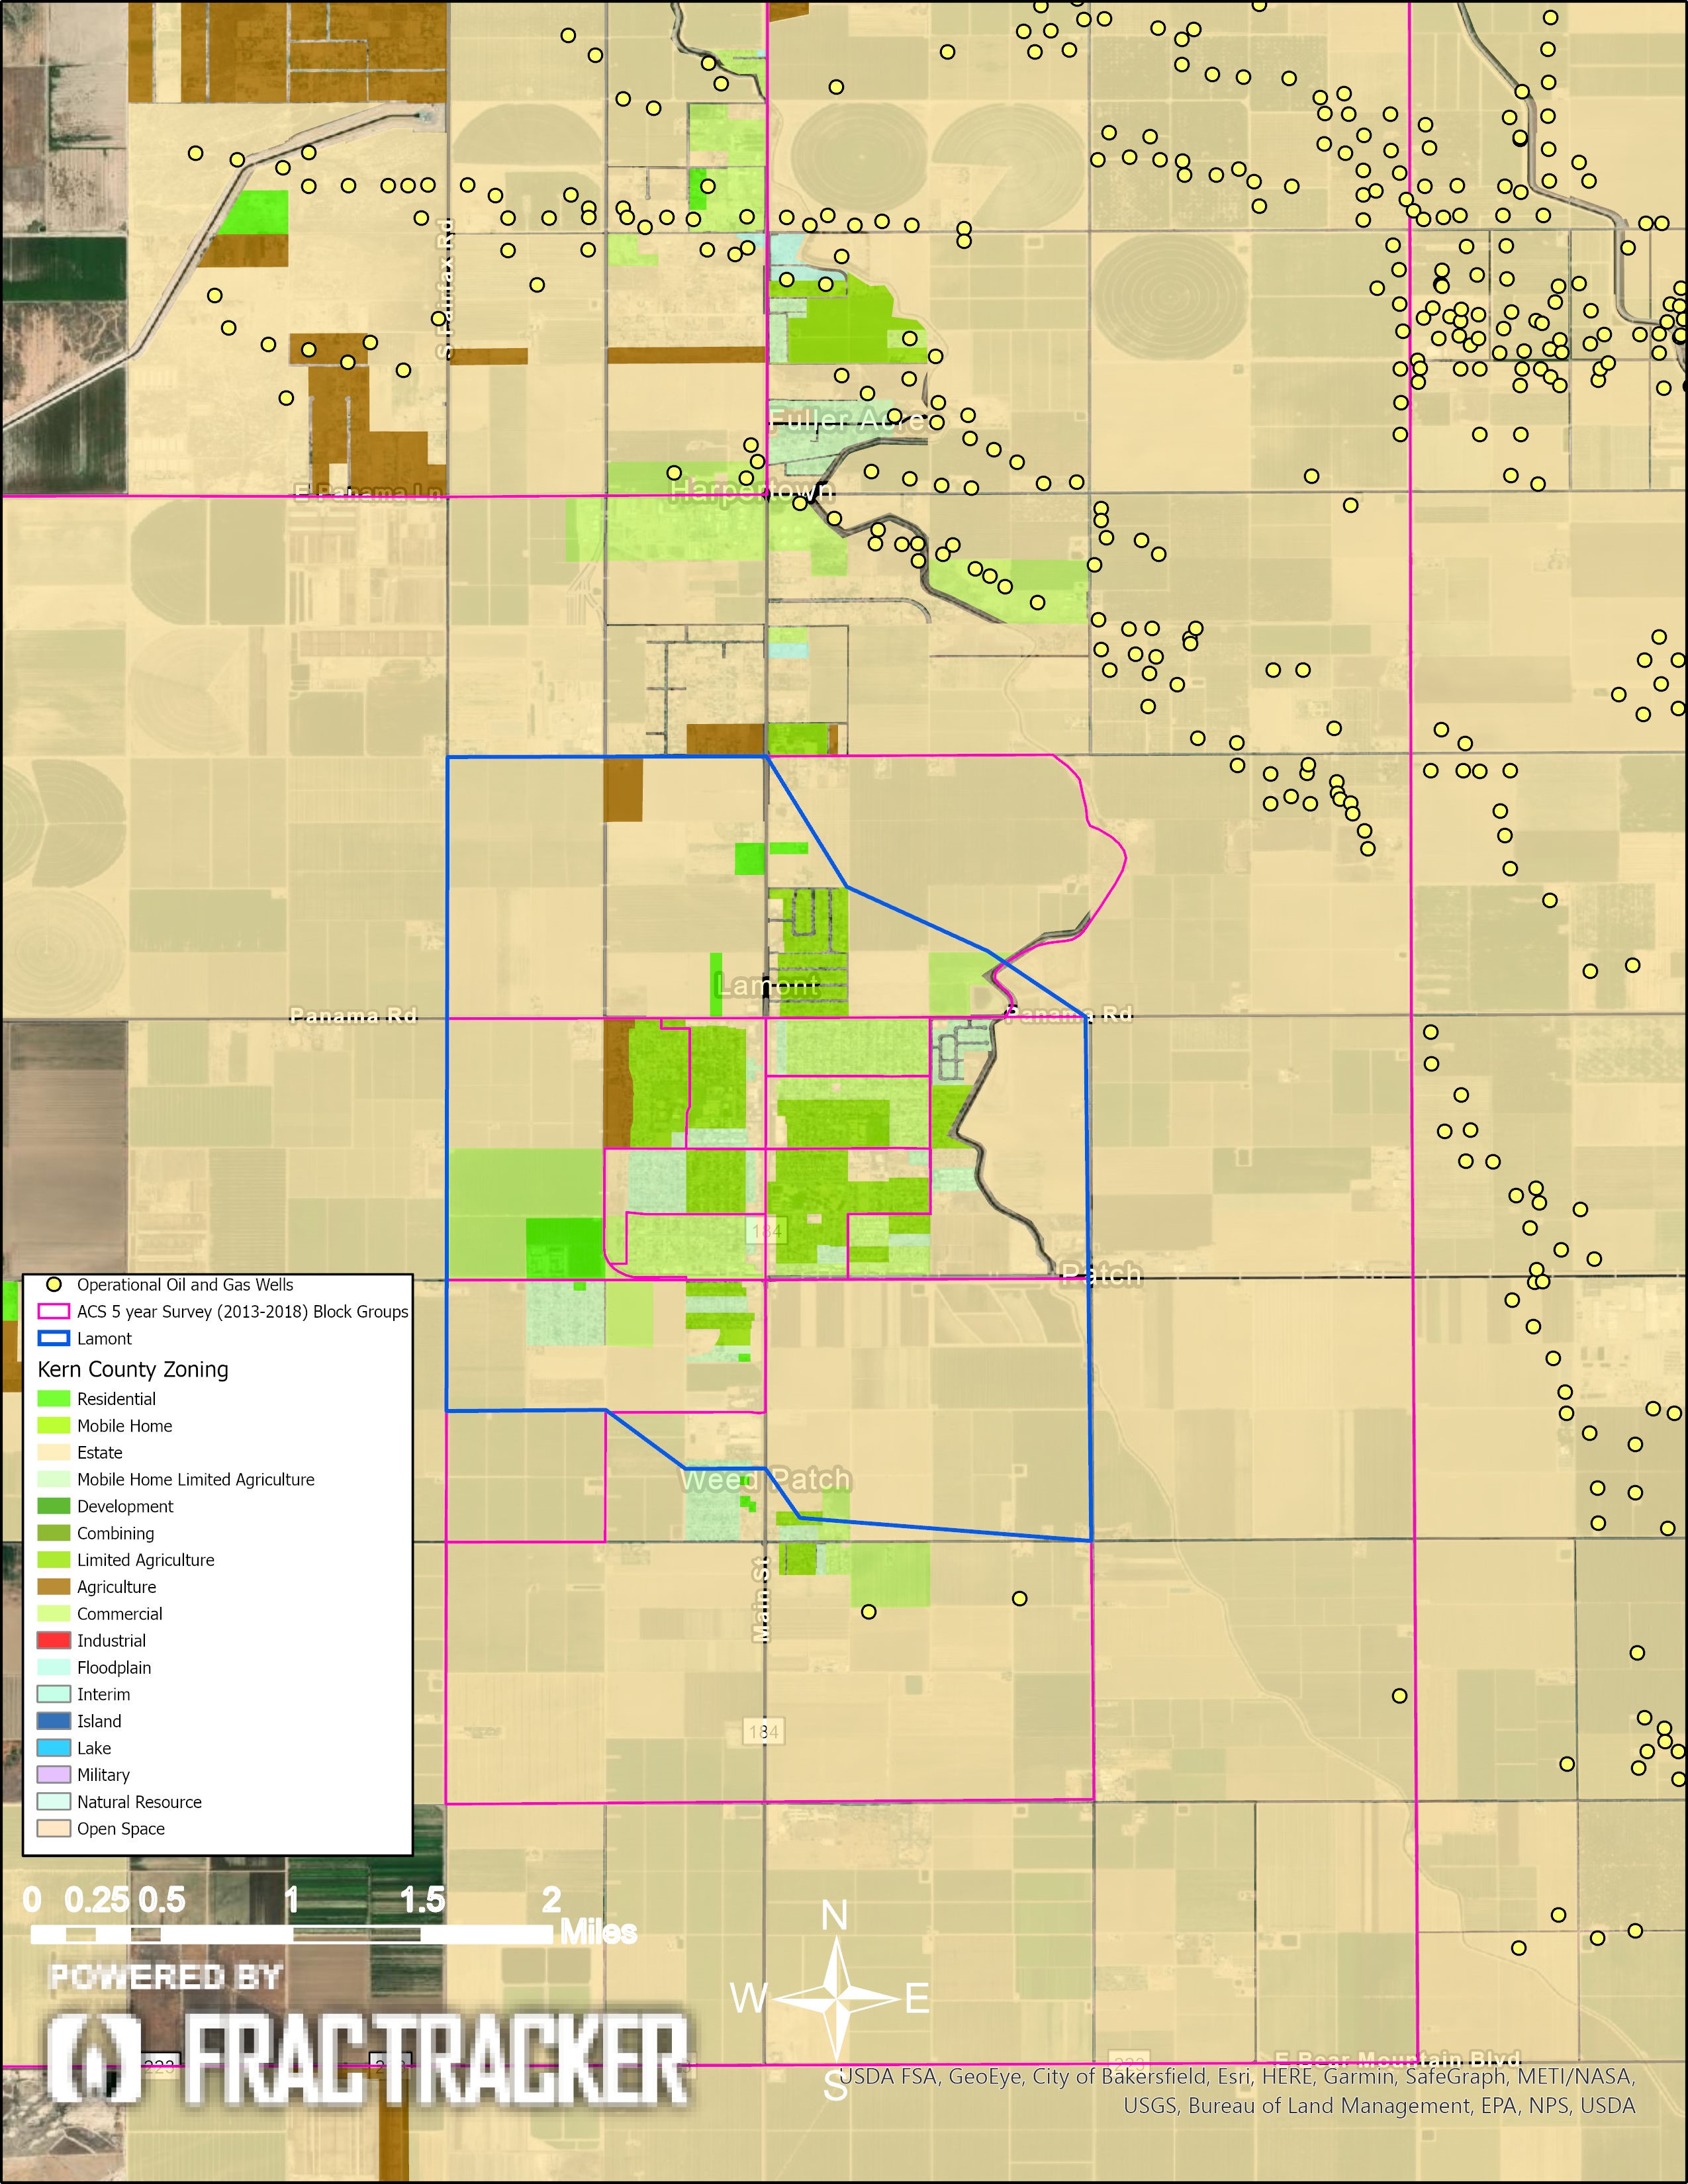
Figure 2. Municipal zoning boundaries of the City of Lamont.
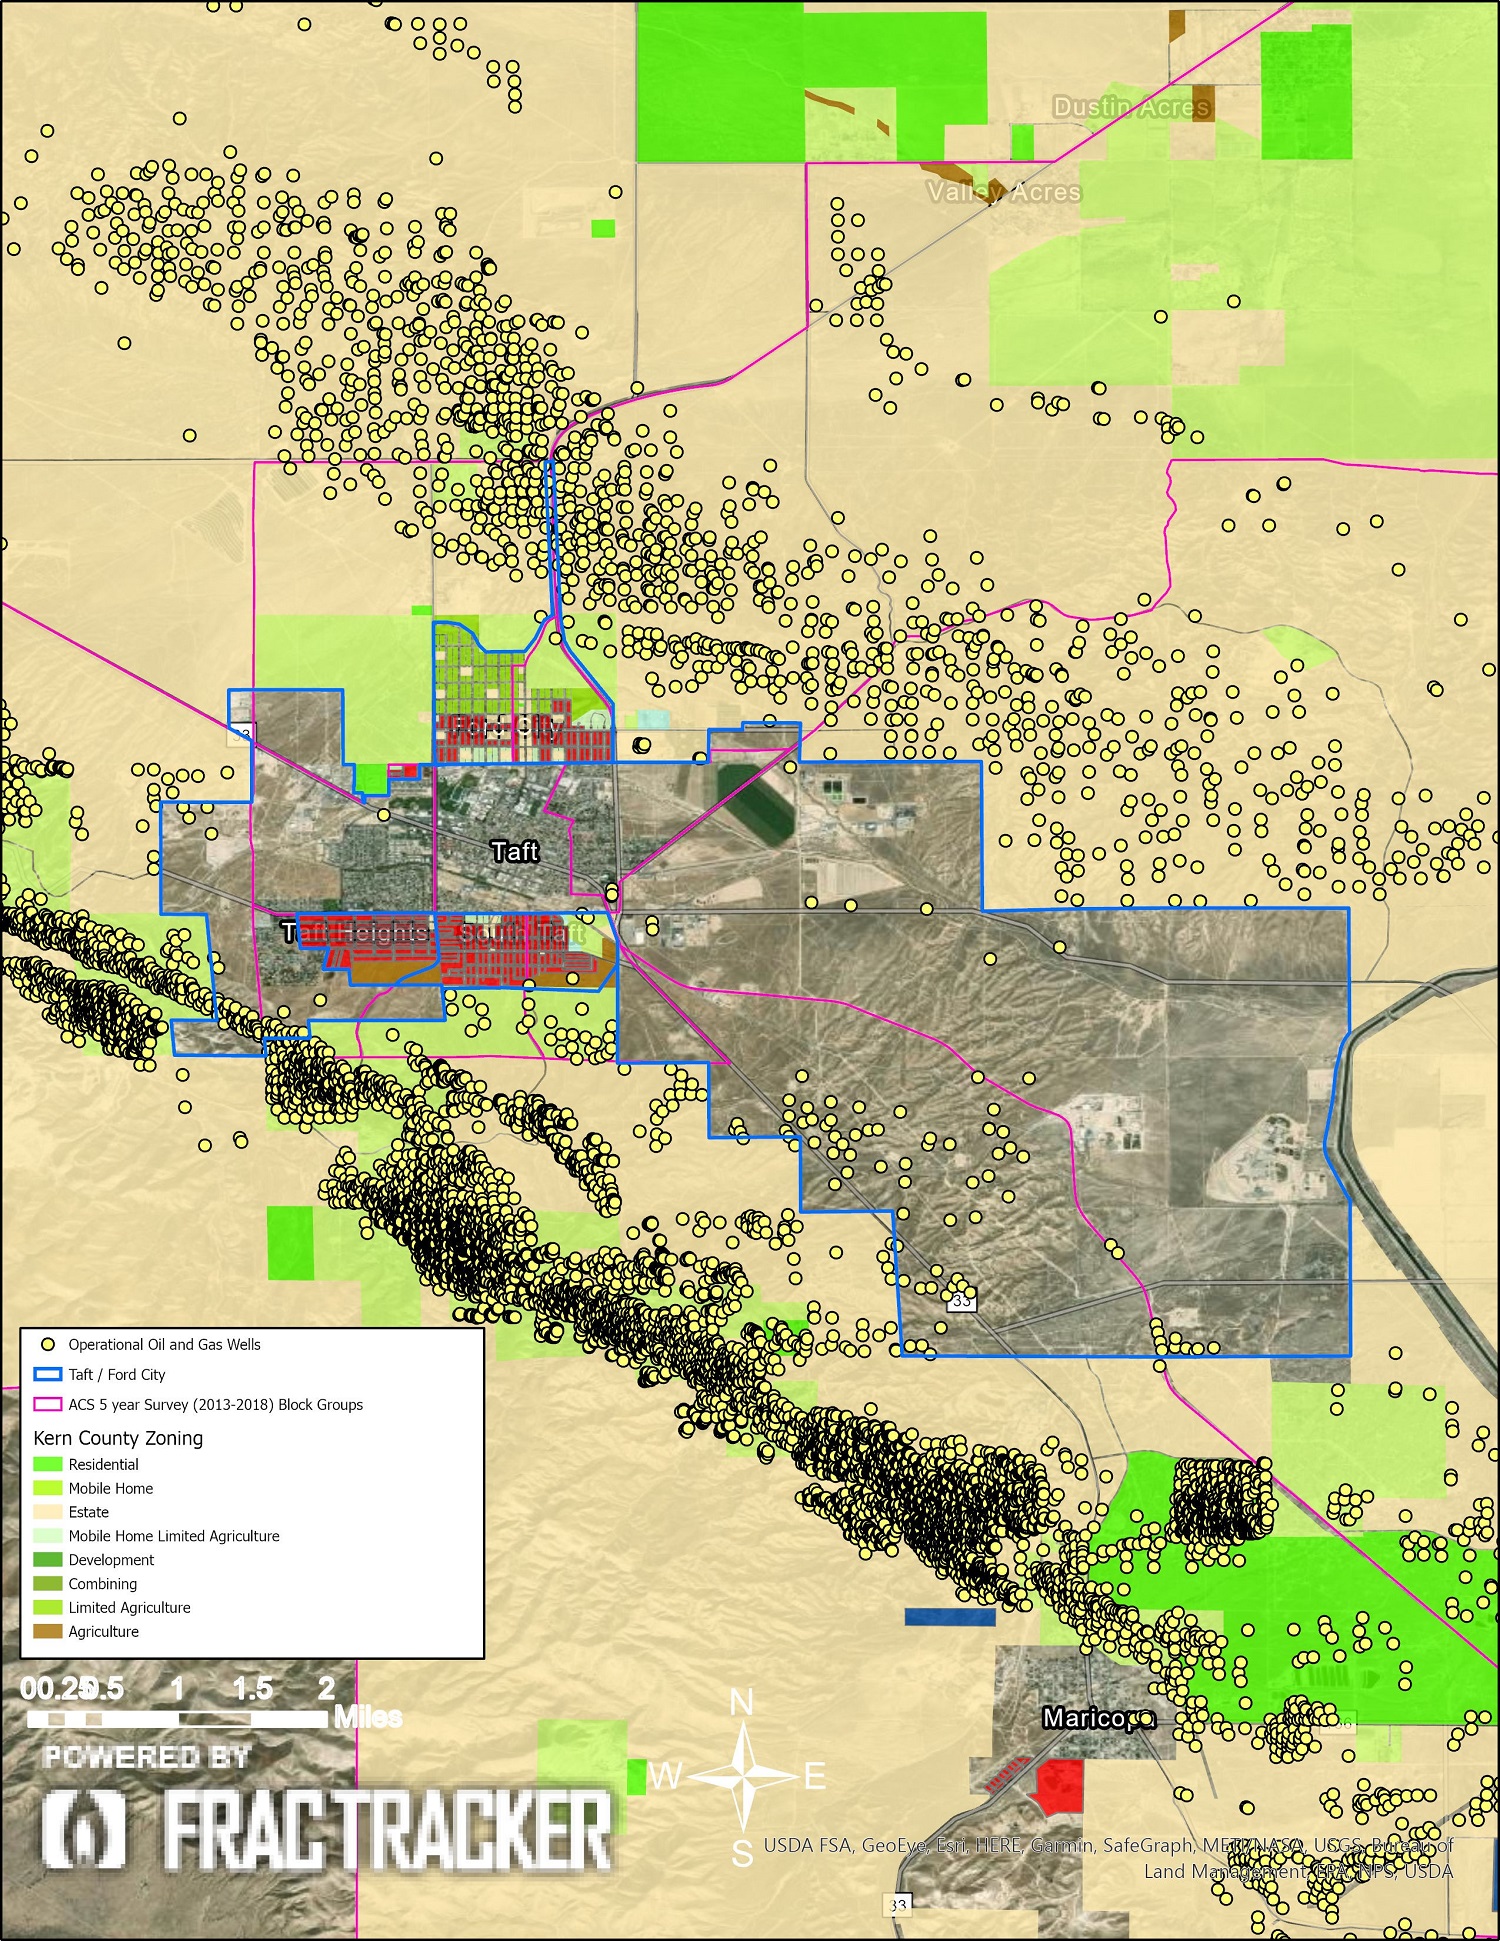
Figure 3. Municipal zoning boundaries of the City of Taft.
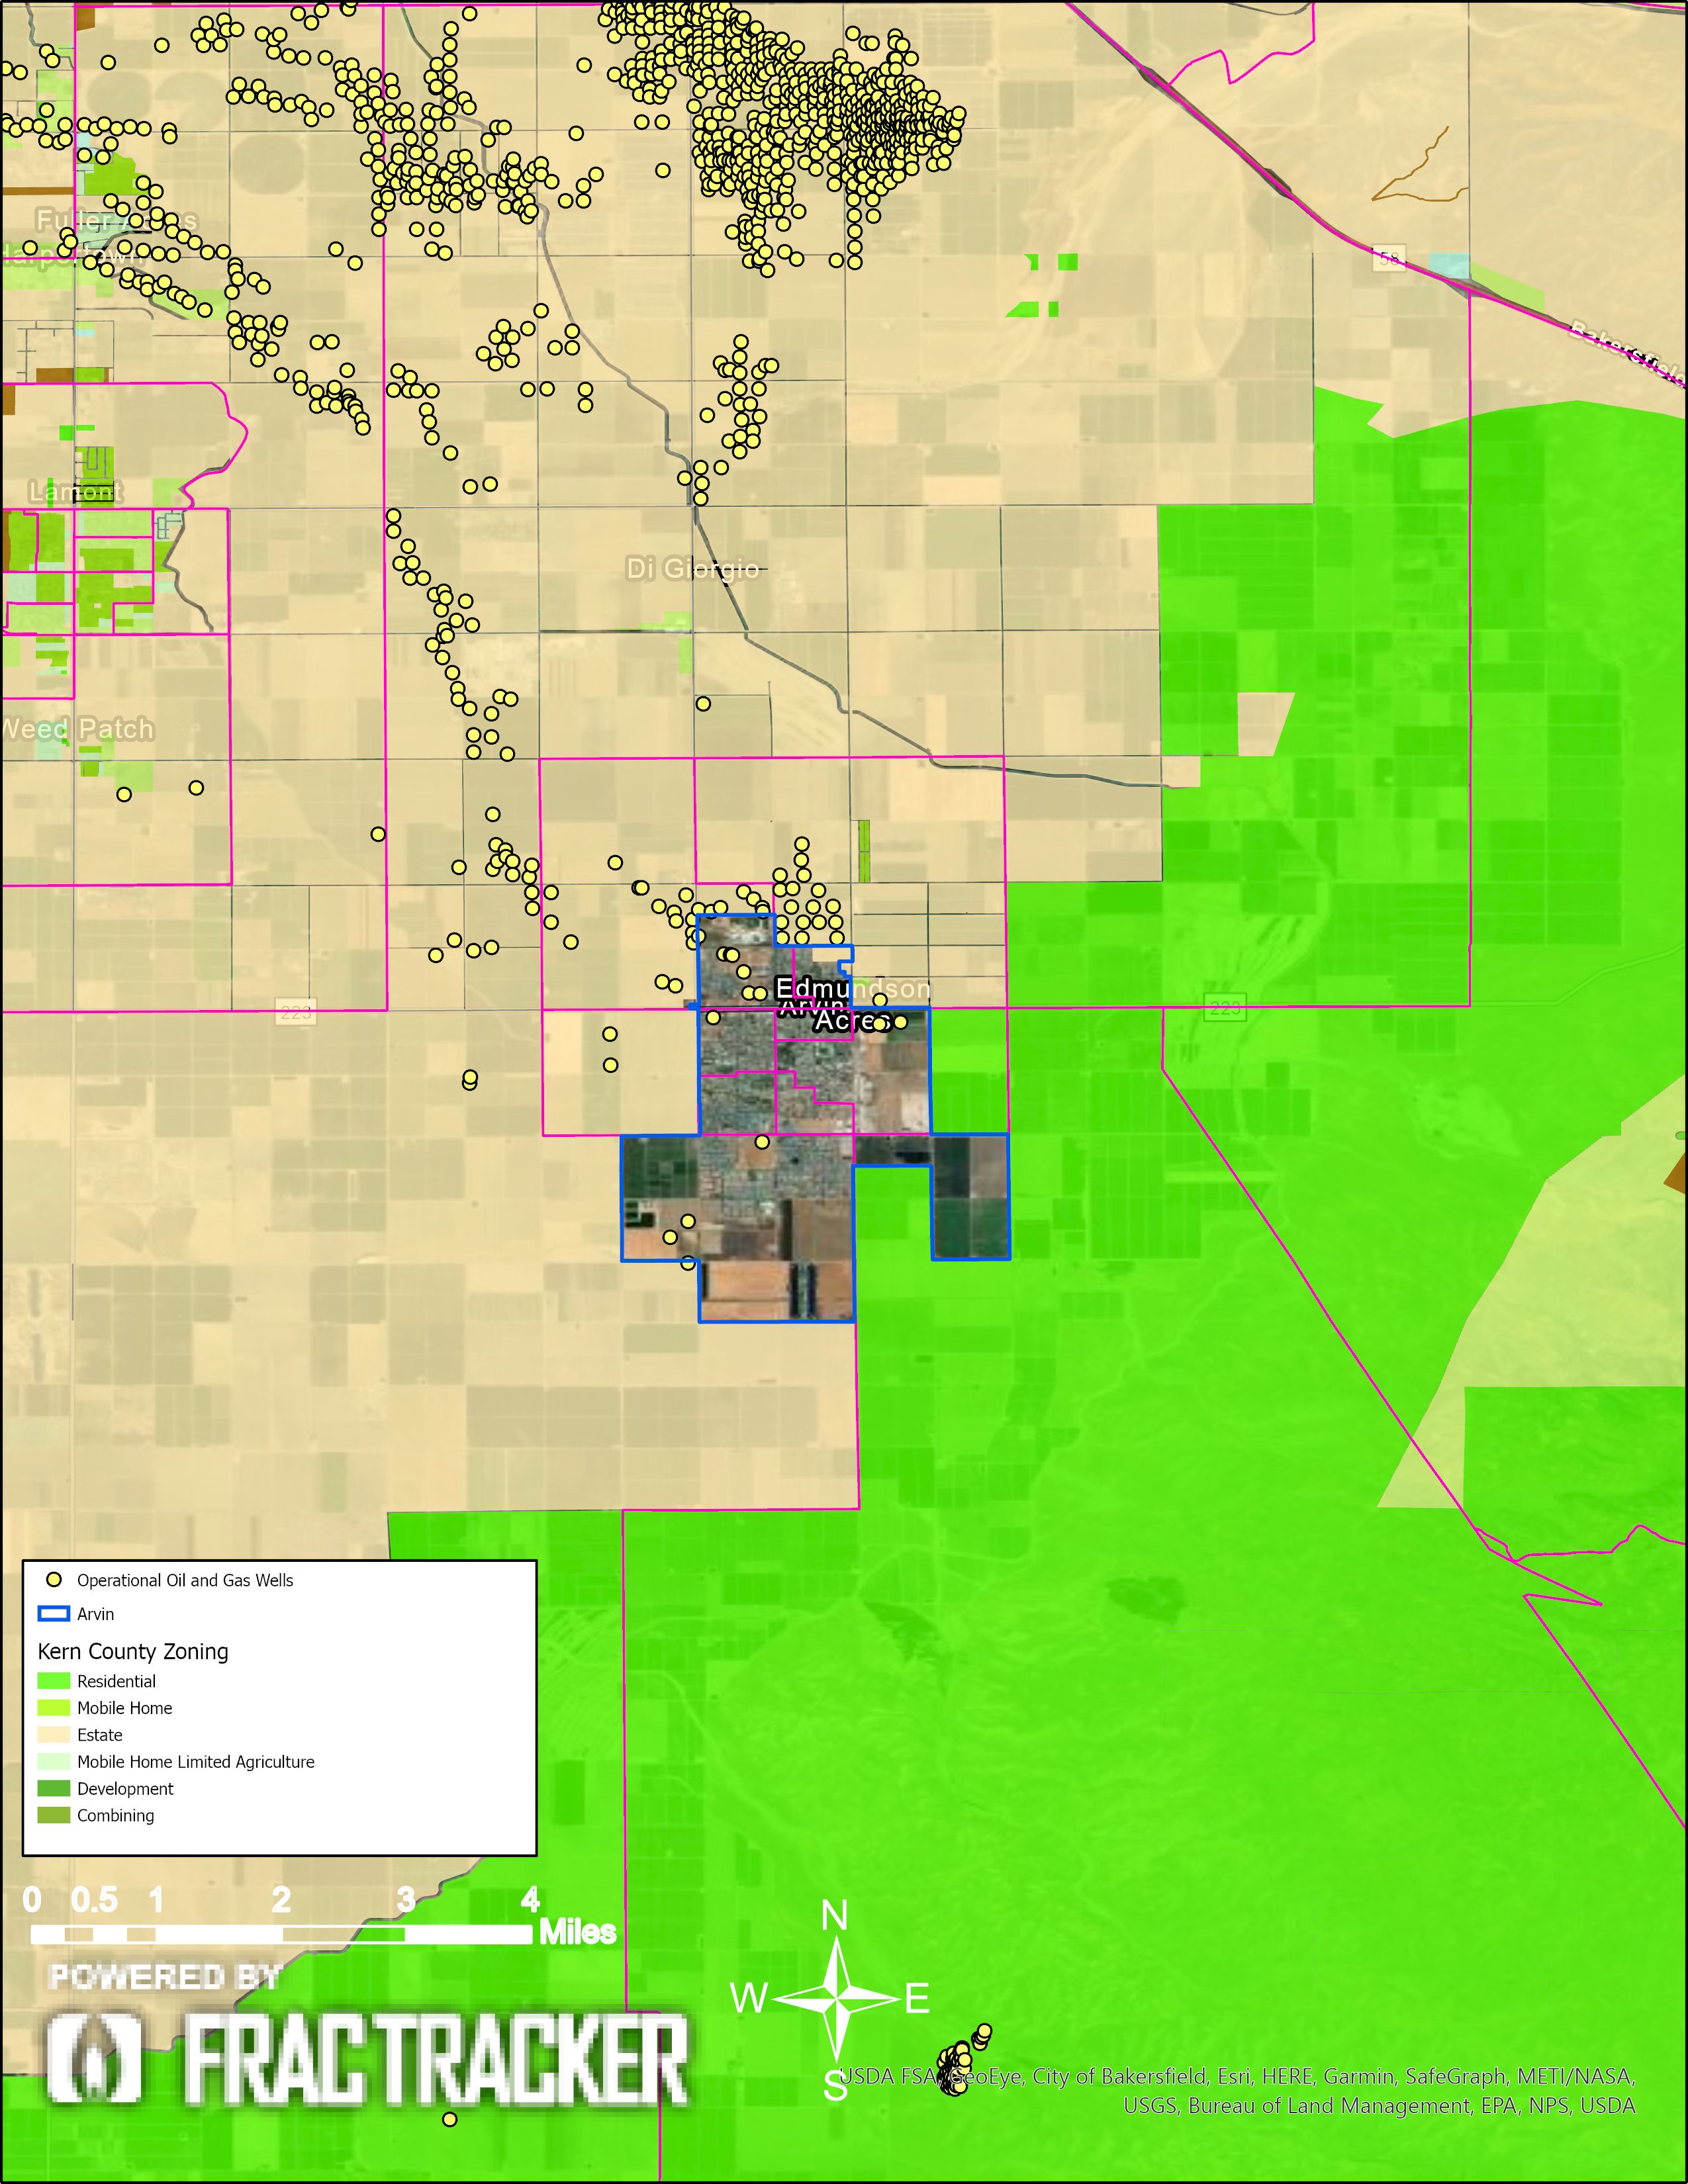
Figure 4. Municipal zoning boundaries of the City of Arvin.
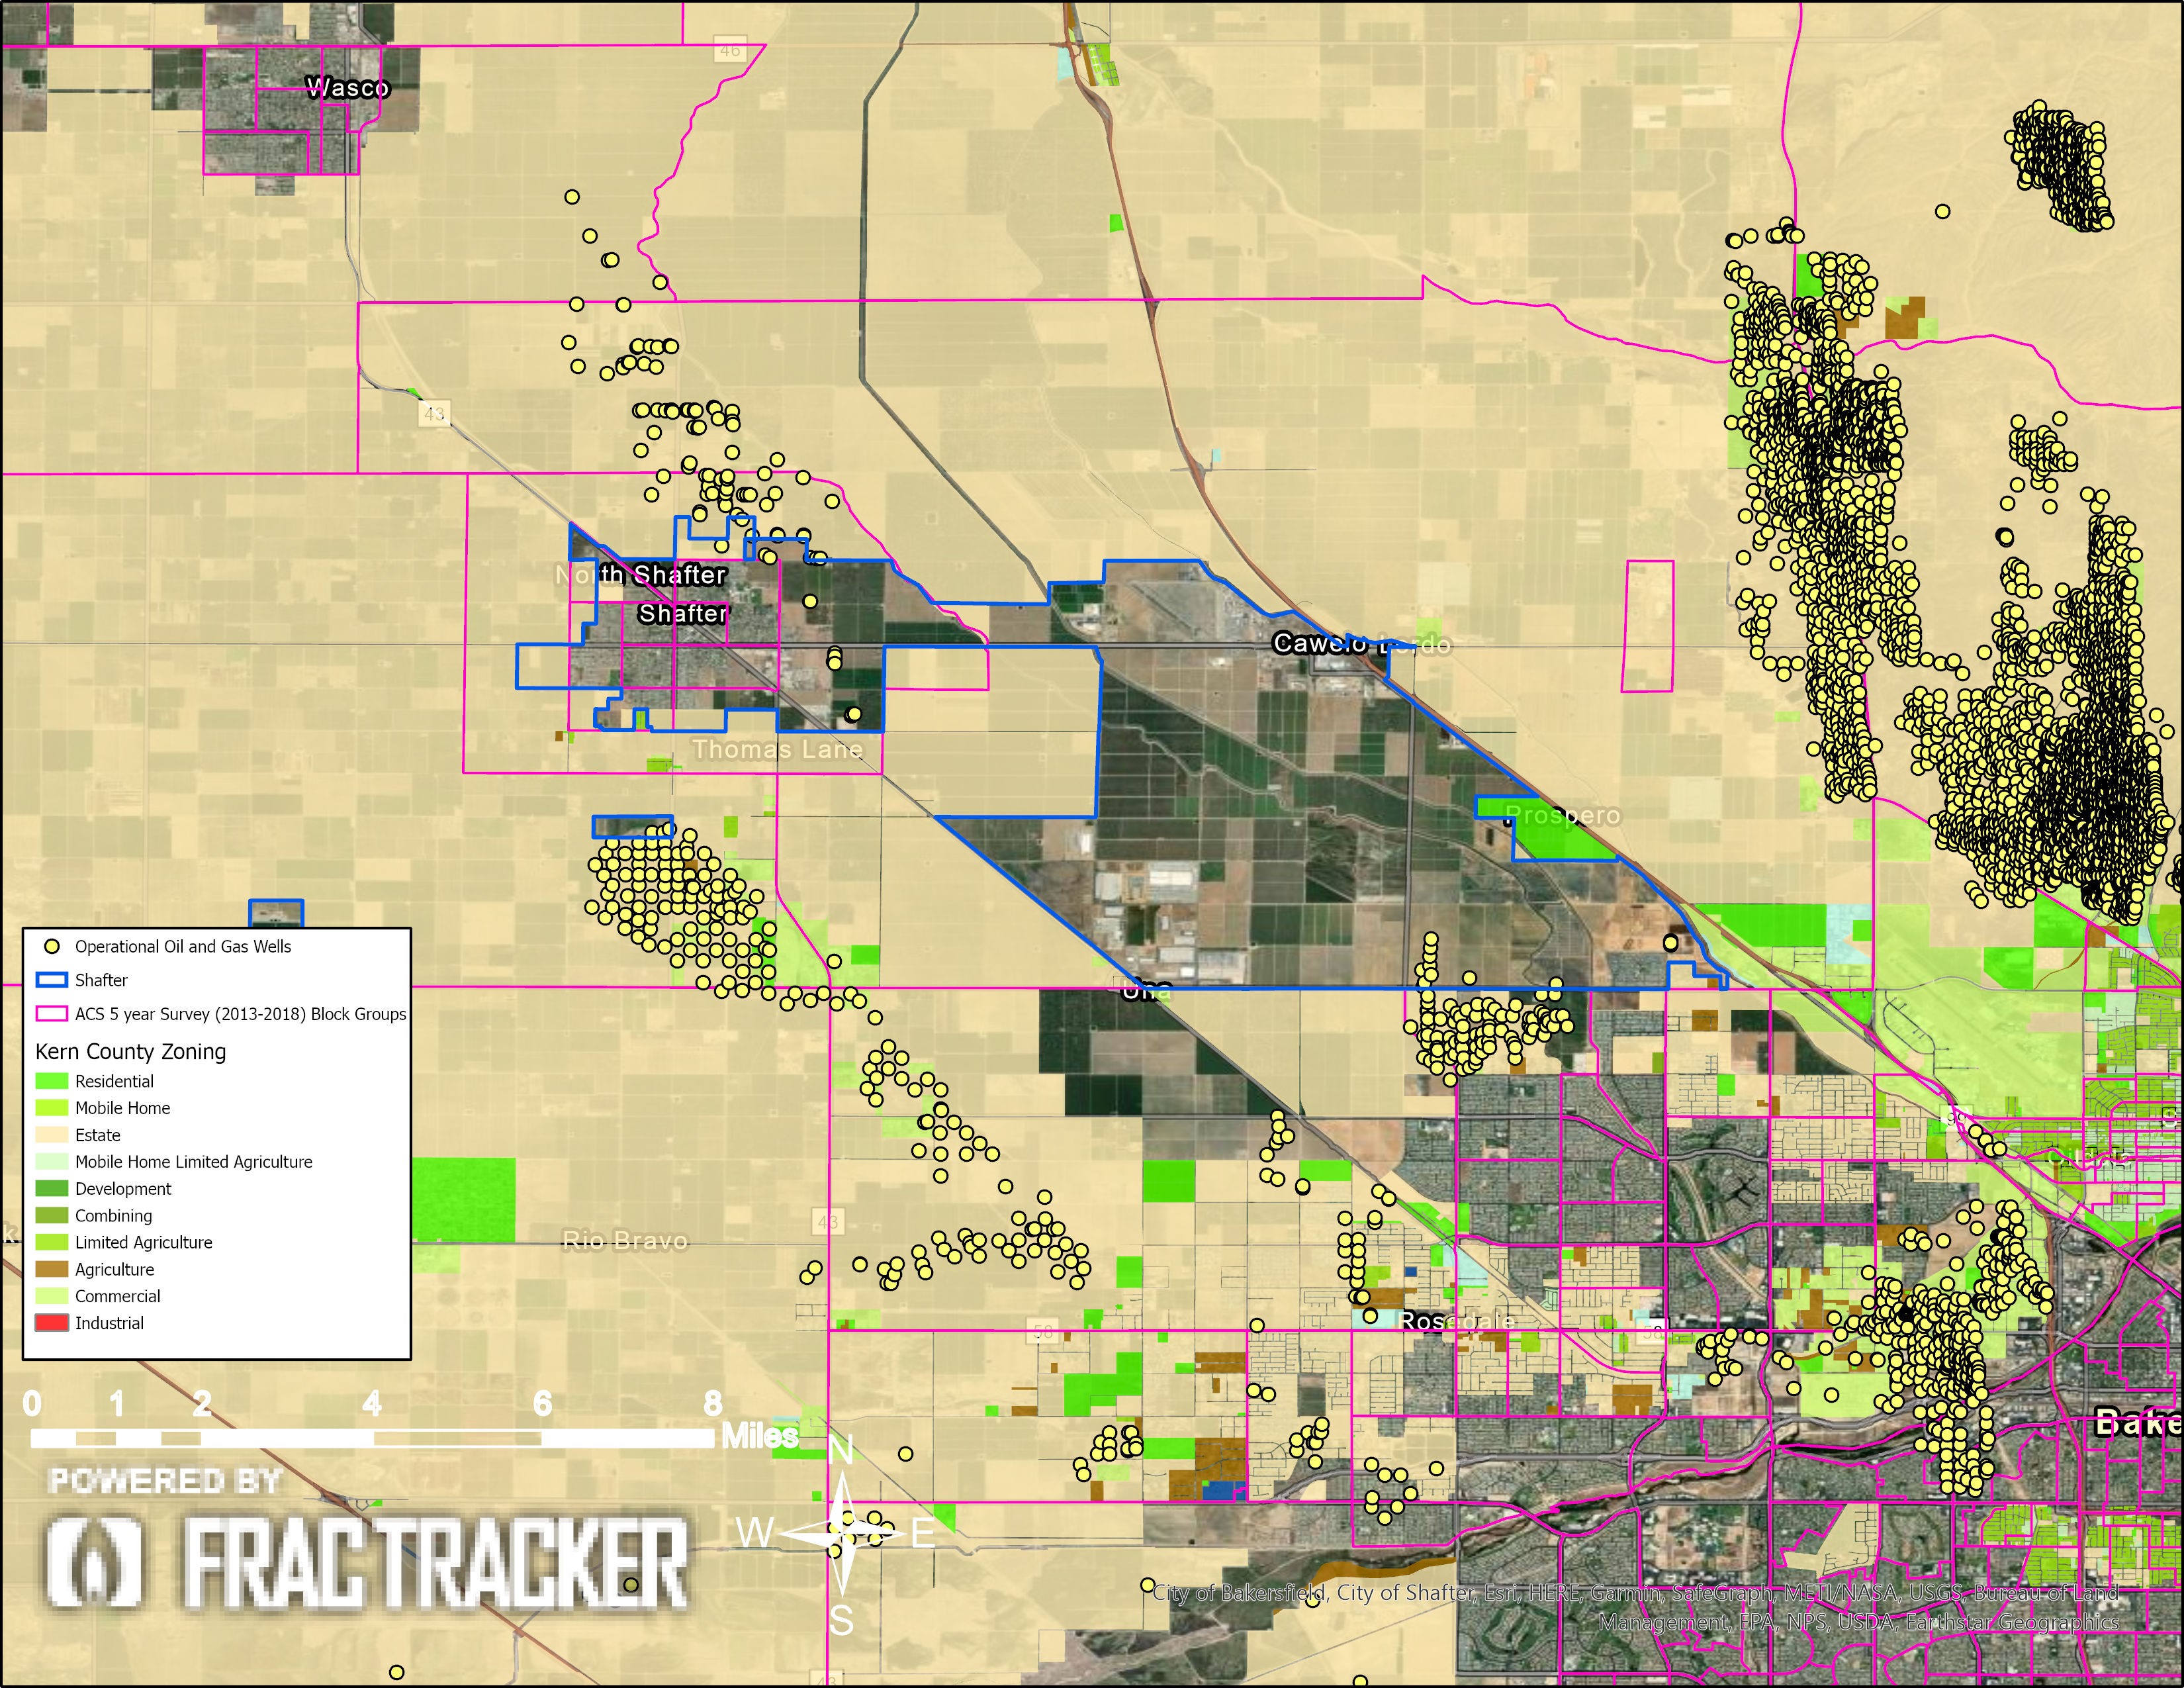
Figure 5. Municipal zoning boundaries of the City of Shafter.
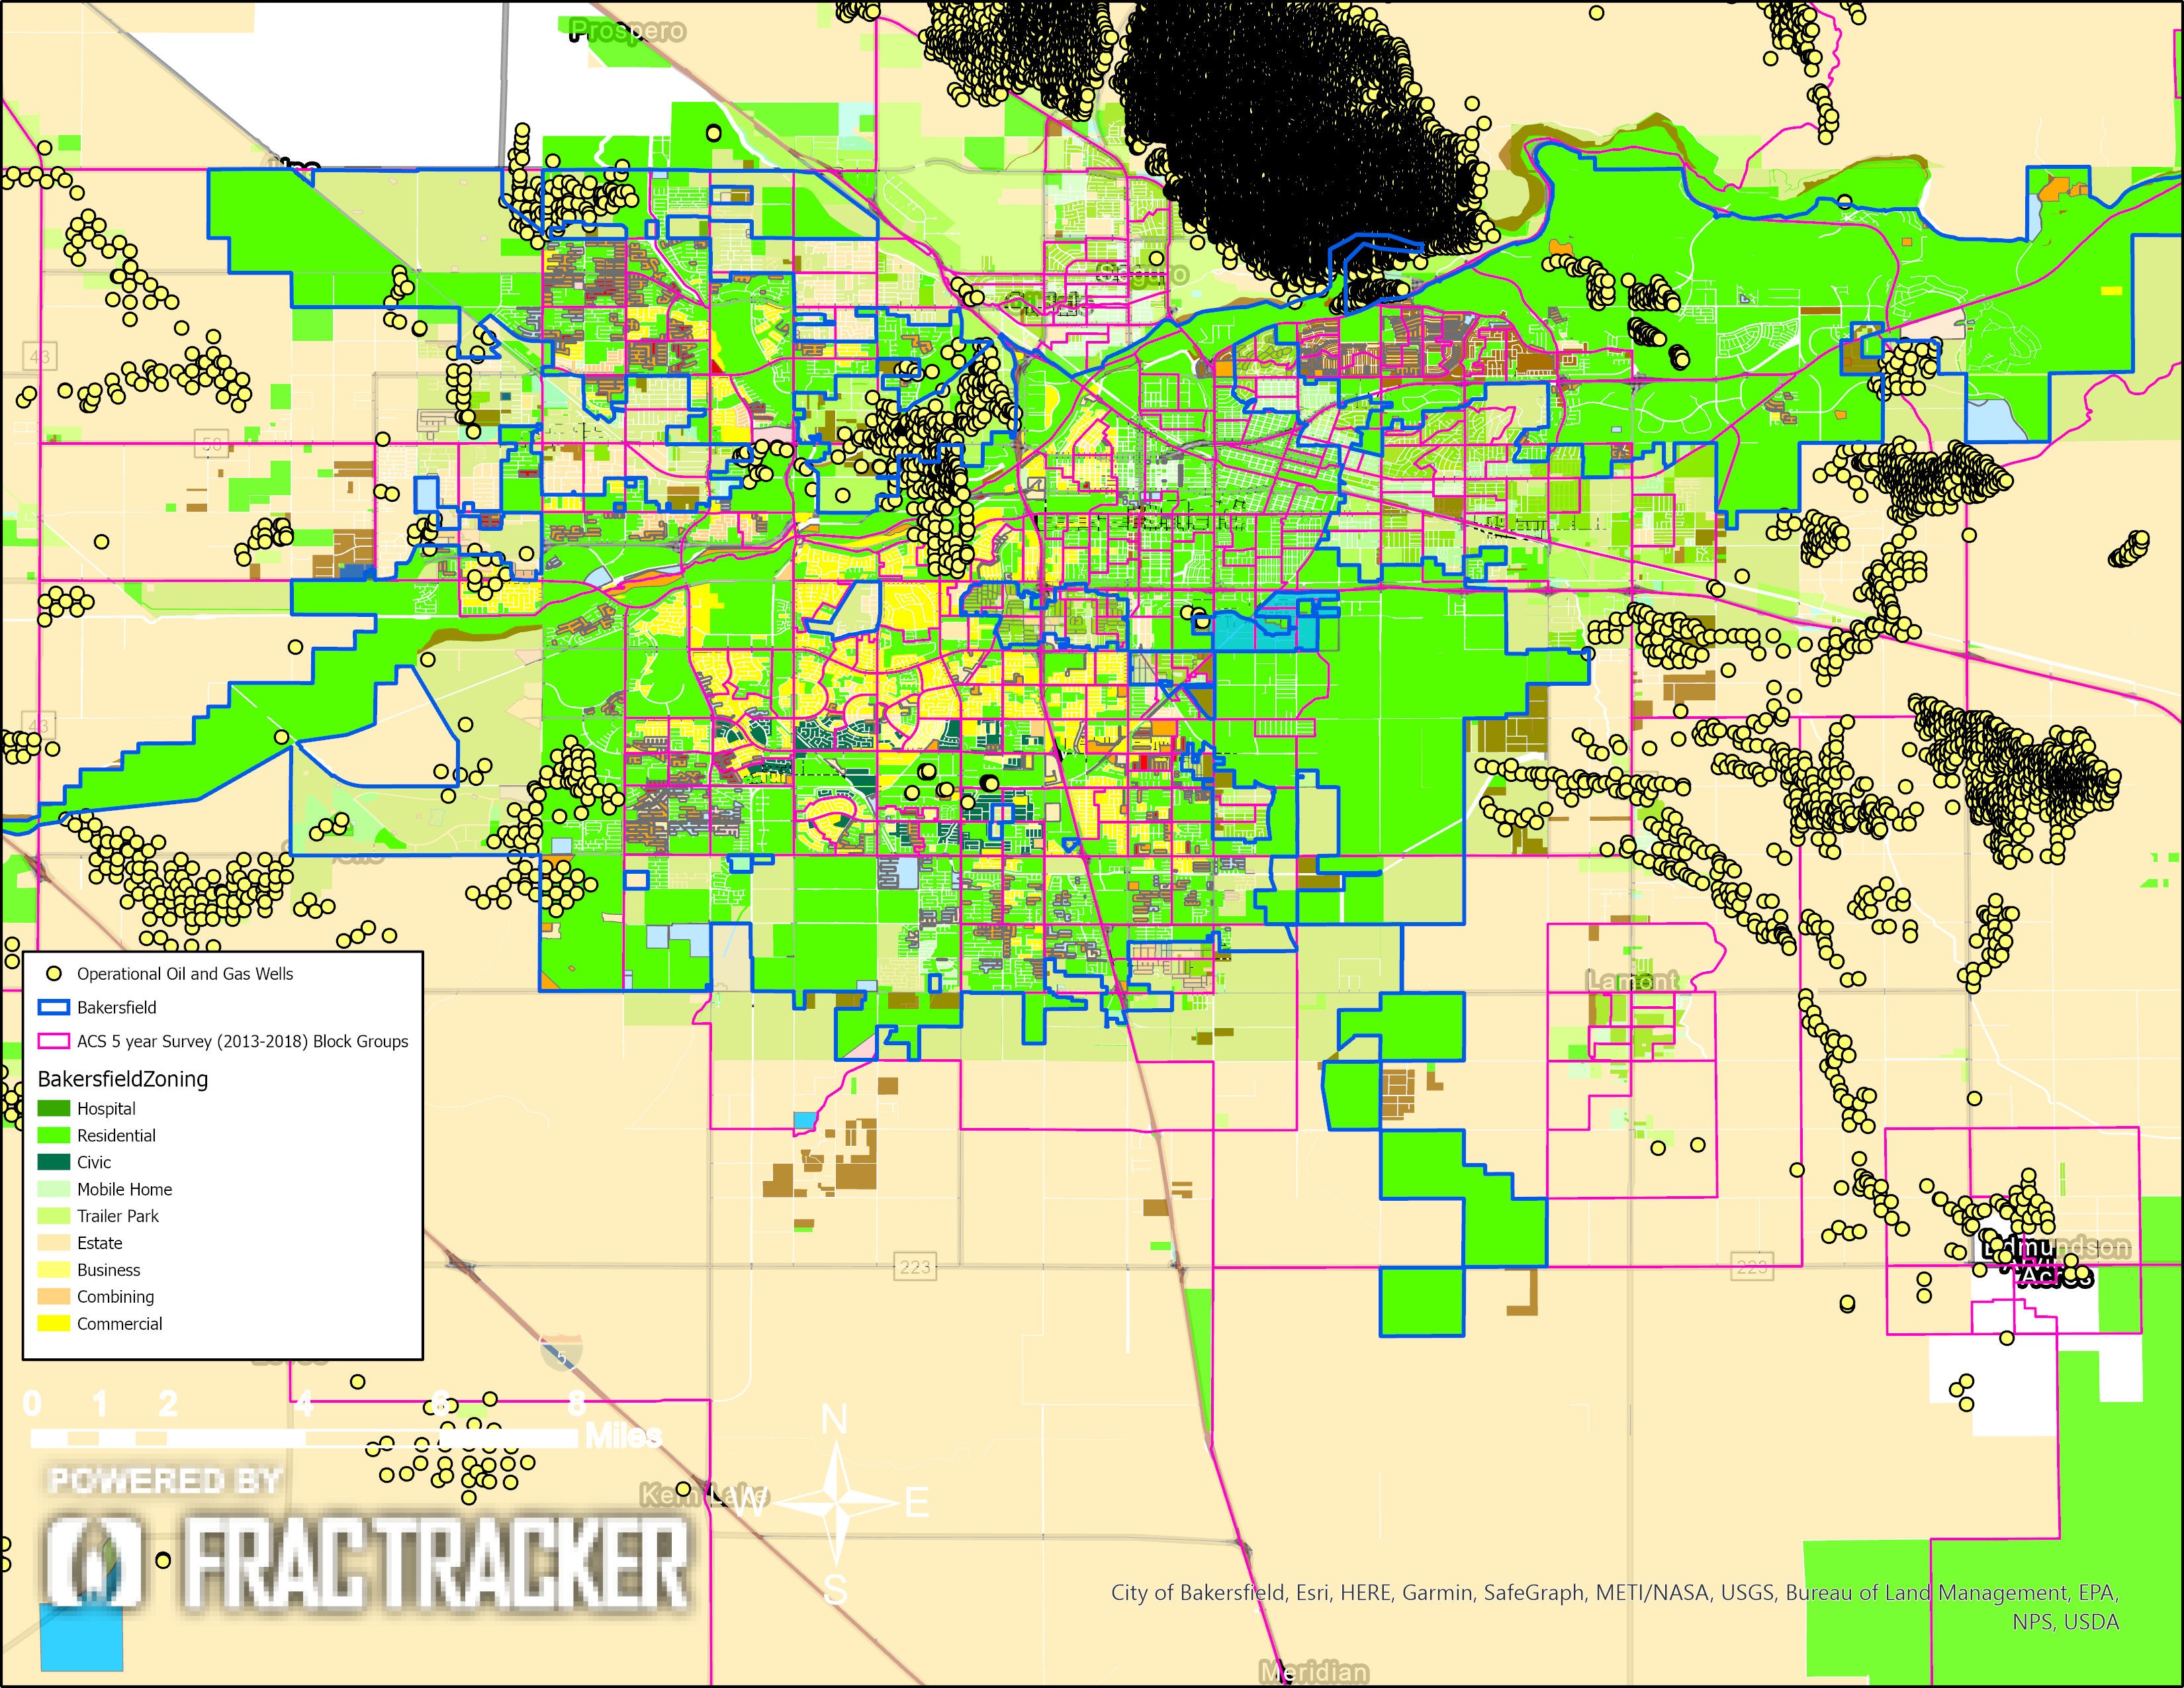
Figure 6. Municipal zoning boundaries of the City of Bakersfield.
Economic Disparity in Environmental Justice Communities
These six cities and their Frontline Communities experience a disparity of exposure to environmental pollutants, particularly emissions from oil and gas extraction operations — as well as pesticides, regionally degraded air quality (from ozone and particulate matter), and contaminated groundwater. Besides the risk disparity, these communities are also vulnerable from several other factors, including disparities in economic opportunity, demographics, and access to information.
Compared to the rest of Kern County, Frontline Communities in these unincorporated and incorporated cities have less financial opportunity. The maps in Figures 7 – 9 below show block groups and the proportions of the population with annual median incomes less than or equal to $40,000. This value was chosen because it is less than 80% of the countywide median income of $51,579 in 2018. For comparison, the statewide median income is $75,277. Lack of economic opportunity for these communities limits the ability to leverage financial resources to protect their community health and to maintain local-level financial independence from corporate influence. In Lost Hills, over 80% of the city block group closest to the Lost Hills Oil Field has a median income less than or equal to $40,000. The same trend is visible for Lamont, Taft, and Arvin. In Figure 9, the only section of Taft with higher annual median income is sparsely populated and predominantly open space, as confirmed in Figure 3. For the areas of Frontline Community block groups within 2,500 feet of an operational well, 36% of the population makes under $40,000; 80% of the Kern County annual median income is $41,000.
In the maps below, the American Community Survey data is summarized in percentages of one, where, for example, light orange (<.400) in the map refers to areas where 20% – 40% of the population’s annual median income is less than or equal to $40,000.
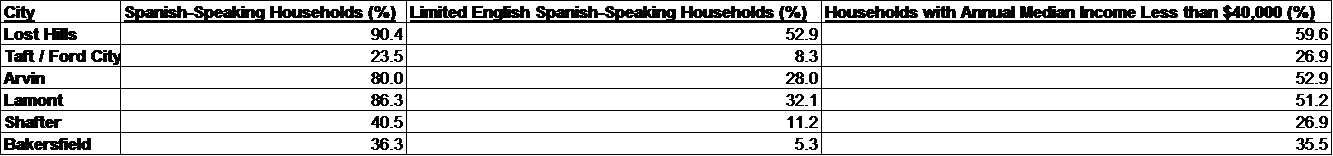
Table 3. Demographical Profile of each city, including the percentage of Spanish-speaking households and proportion of households with limited English proficiency.
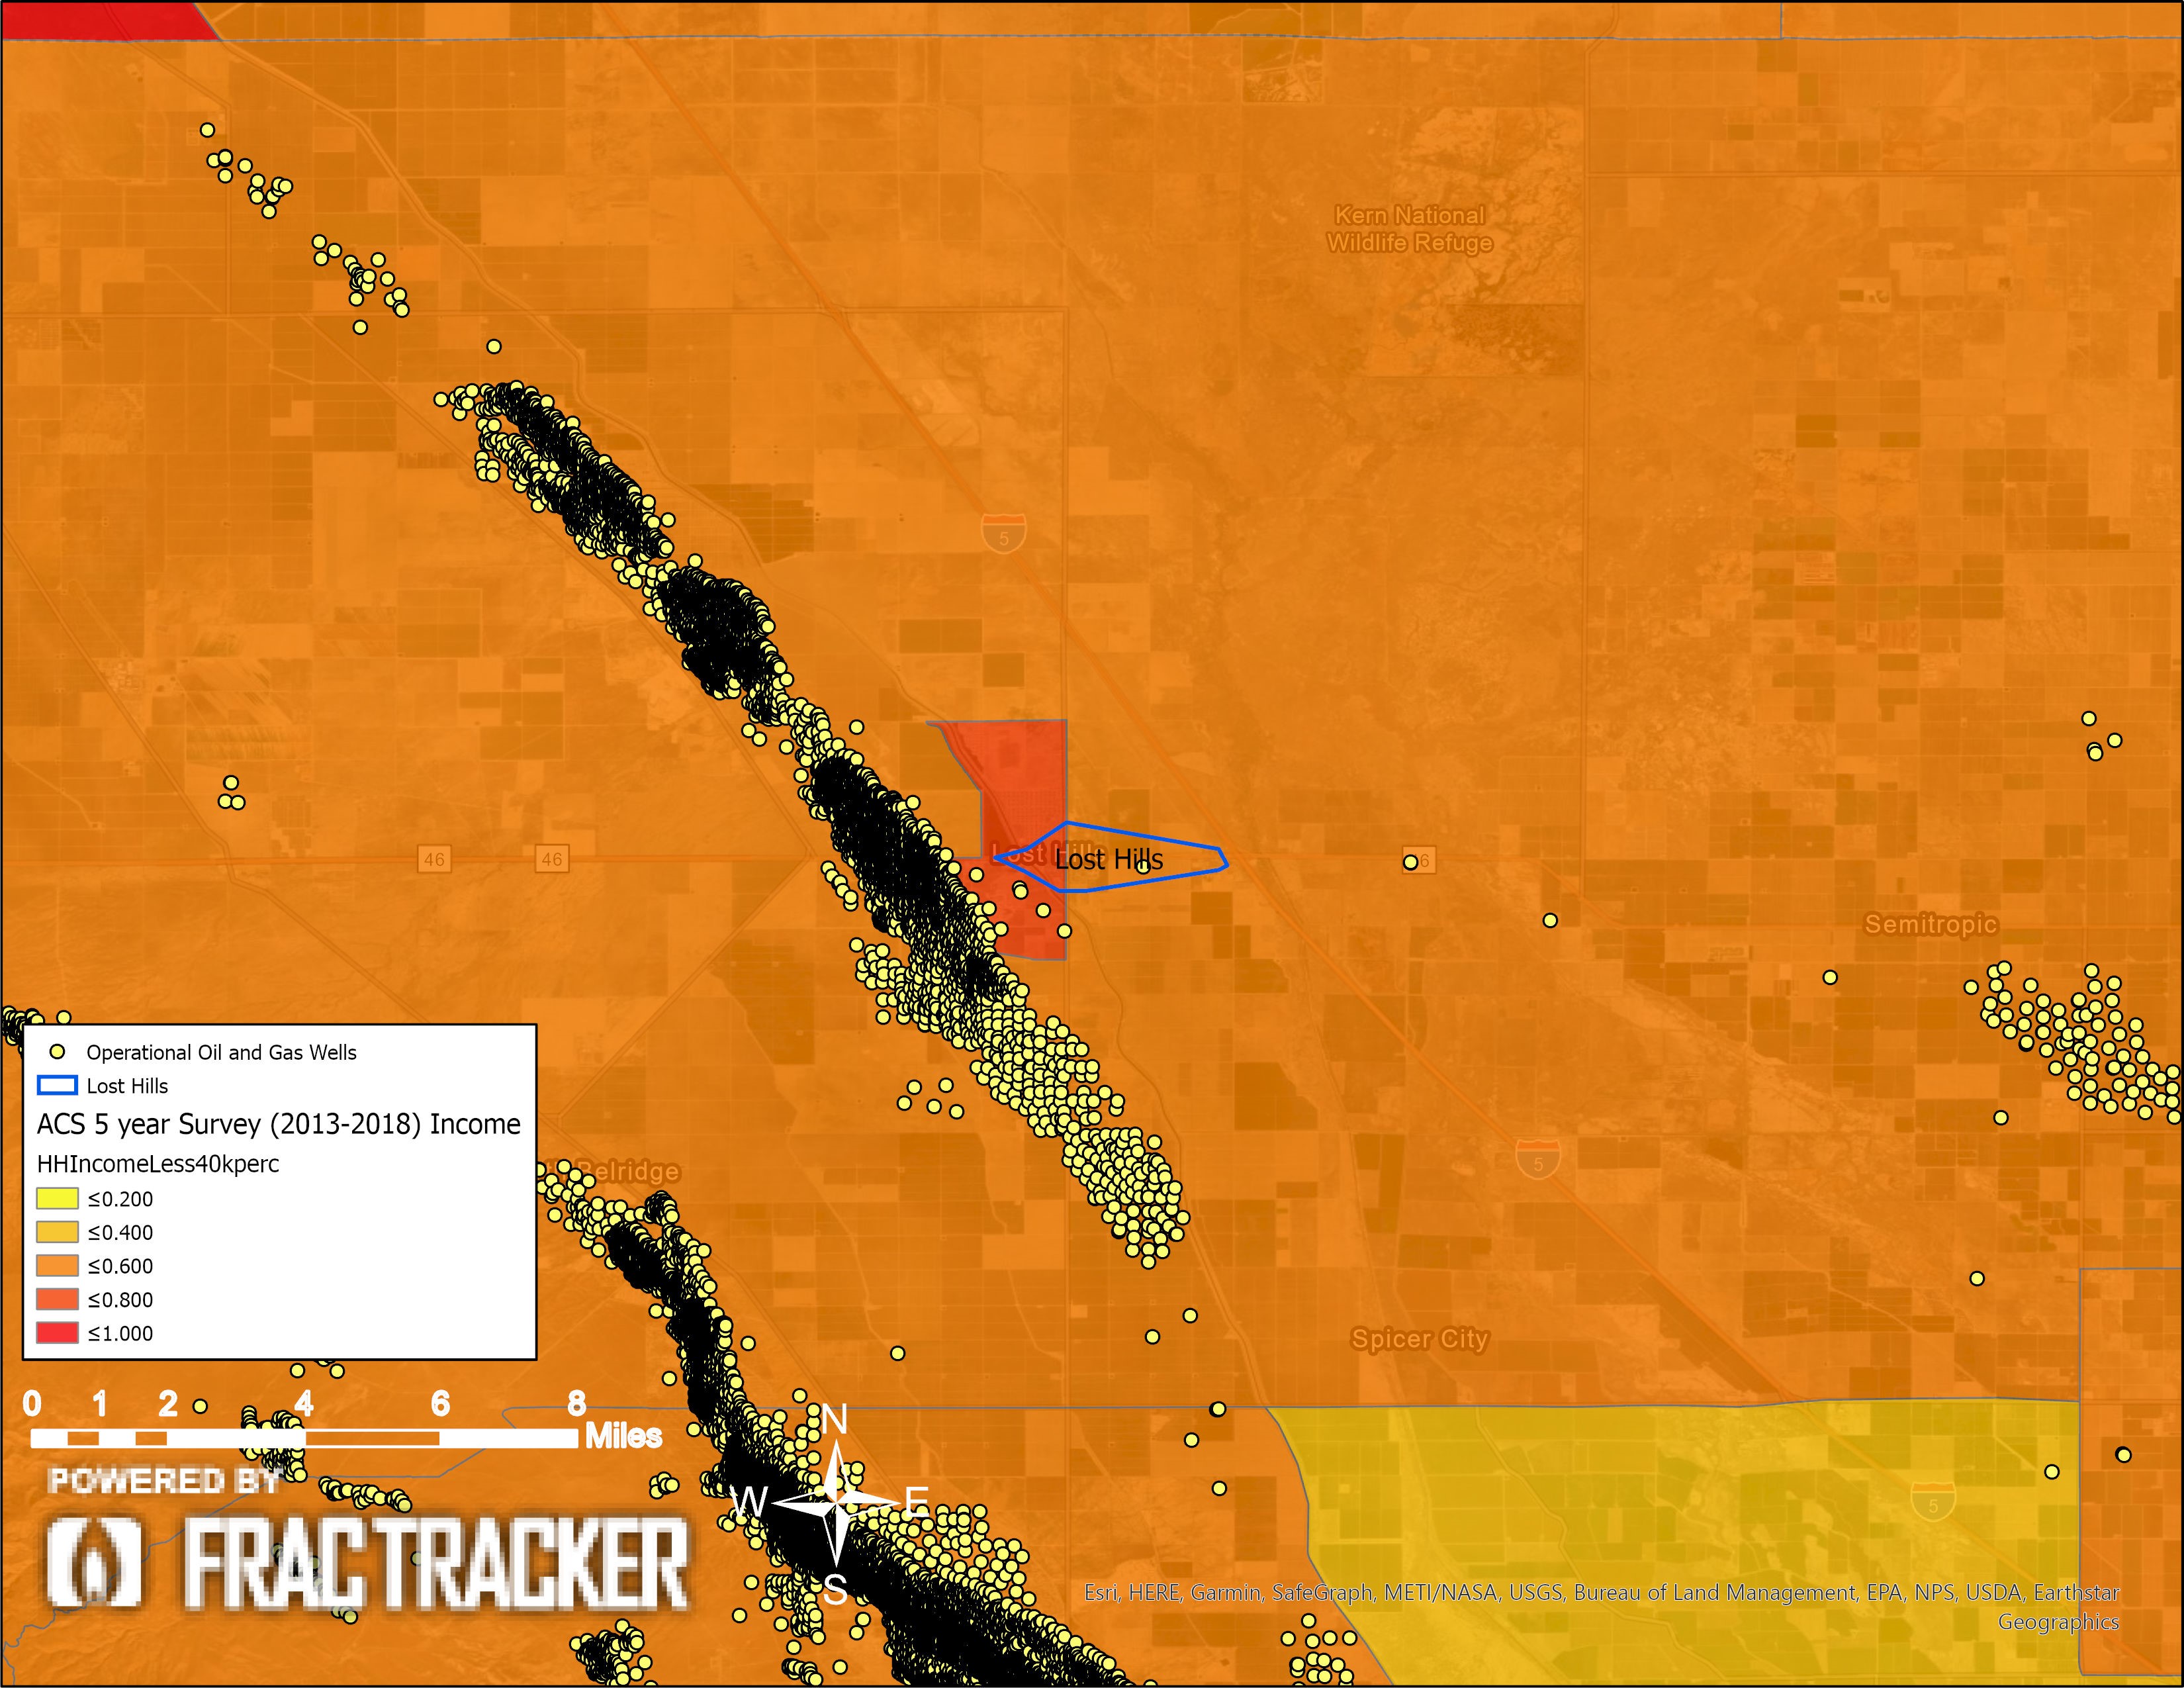
Figure 7. Lost Hills income disparity: This map shows the population percentage with annual incomes of less than or equal to $40,000, which is less than 80% of the Kern median income of $51,579 (2018).
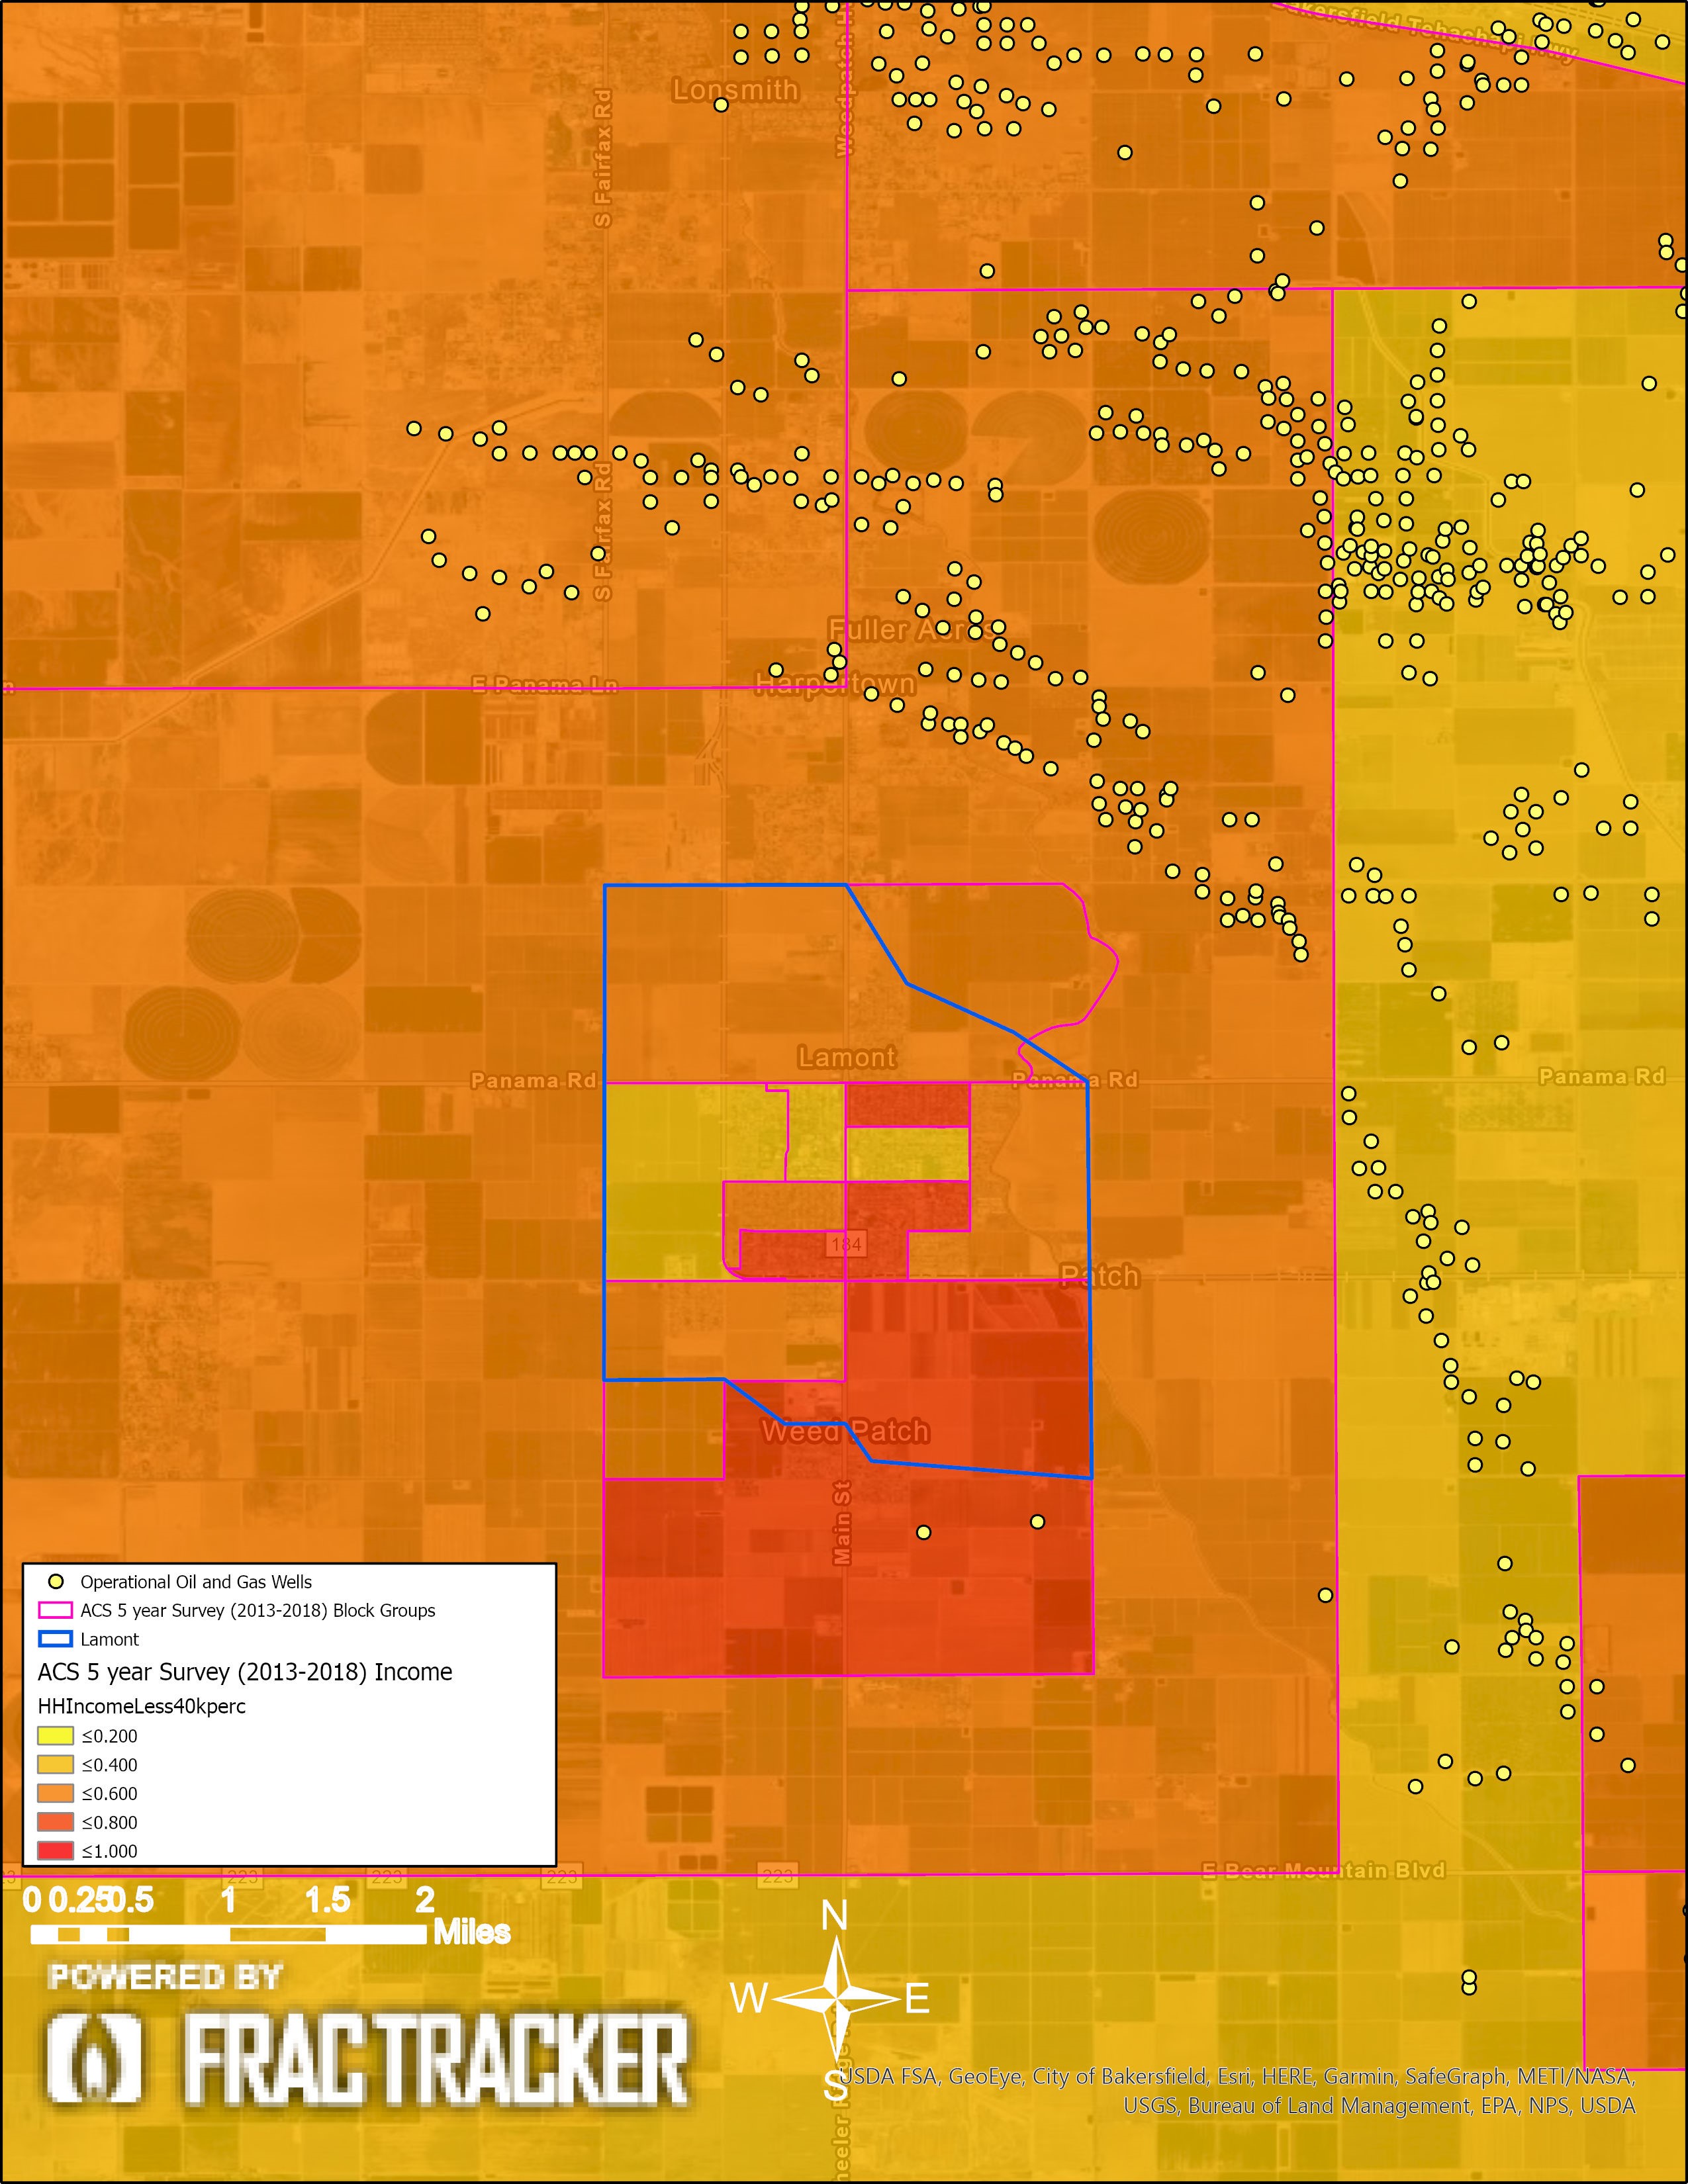
Figure 8. Lamont income disparity: This map shows the population percentage with annual incomes less than or equal to $40,000, which is less than 80% of the Kern median income of $51,579 (2018).
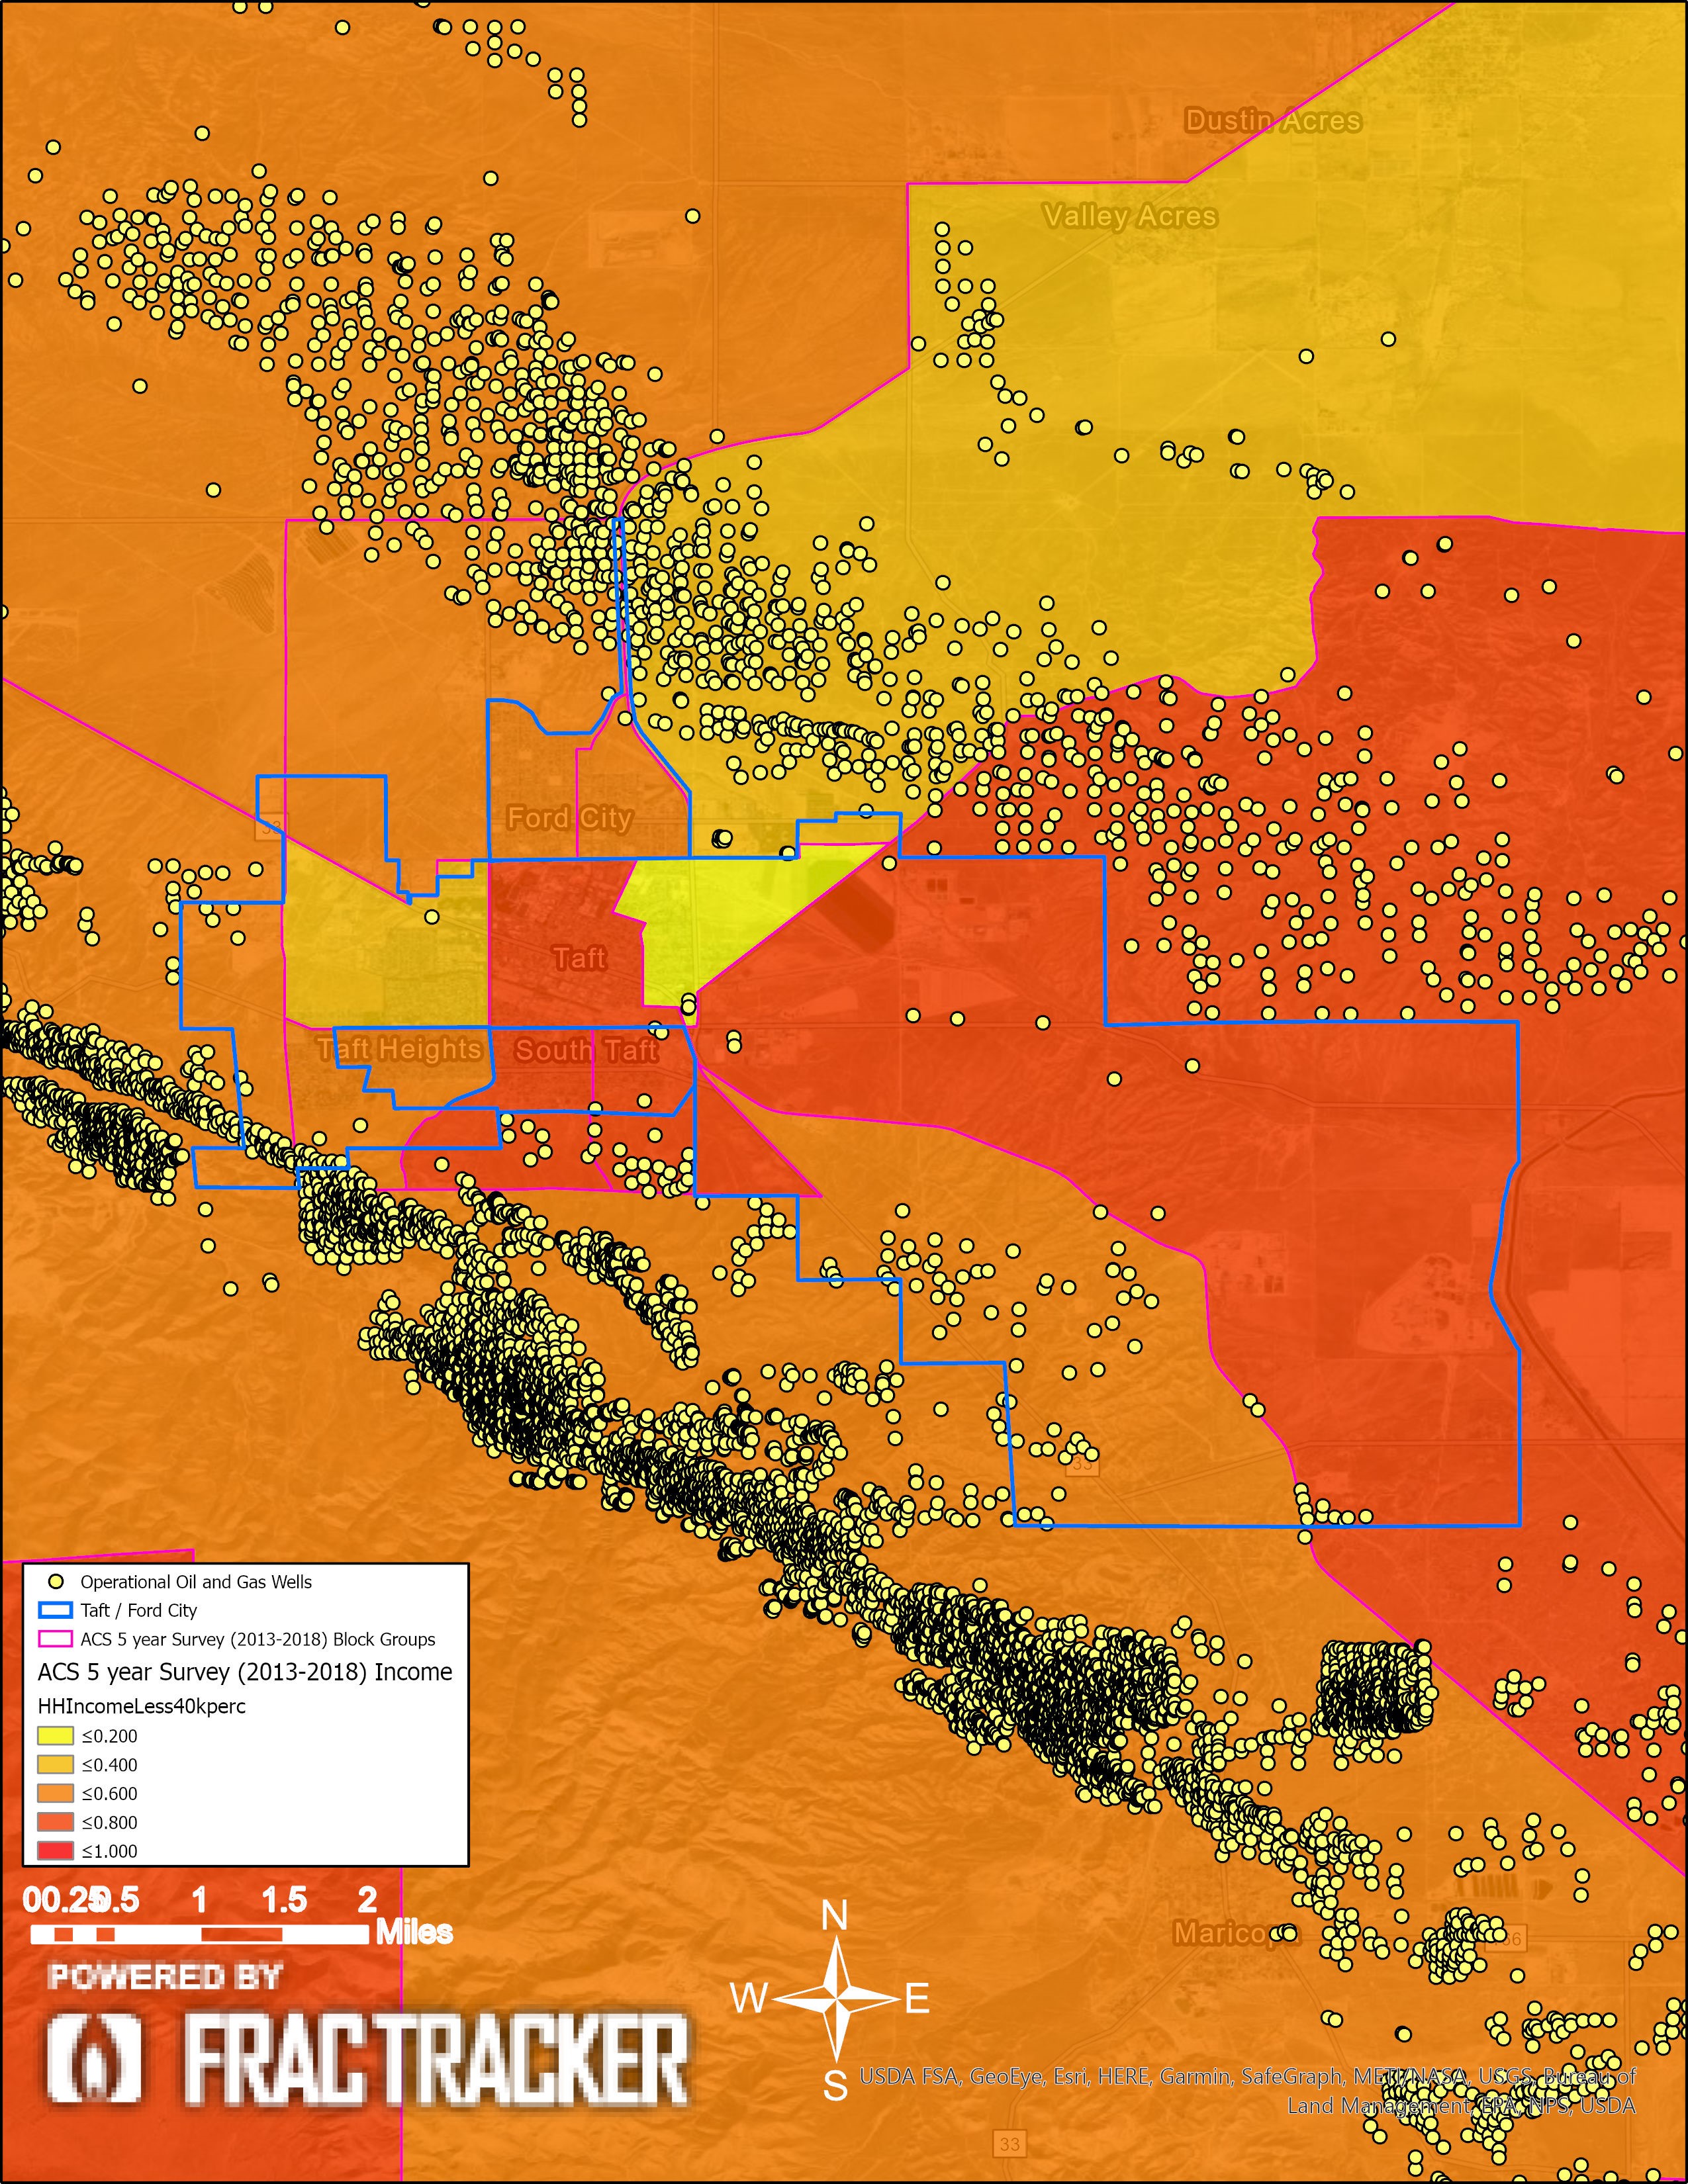
Figure 9. Taft income disparity: This map shows the population percentage with annual incomes less than or equal to $40,000, which is less than 80% of the Kern median income of $51,579 (2018).
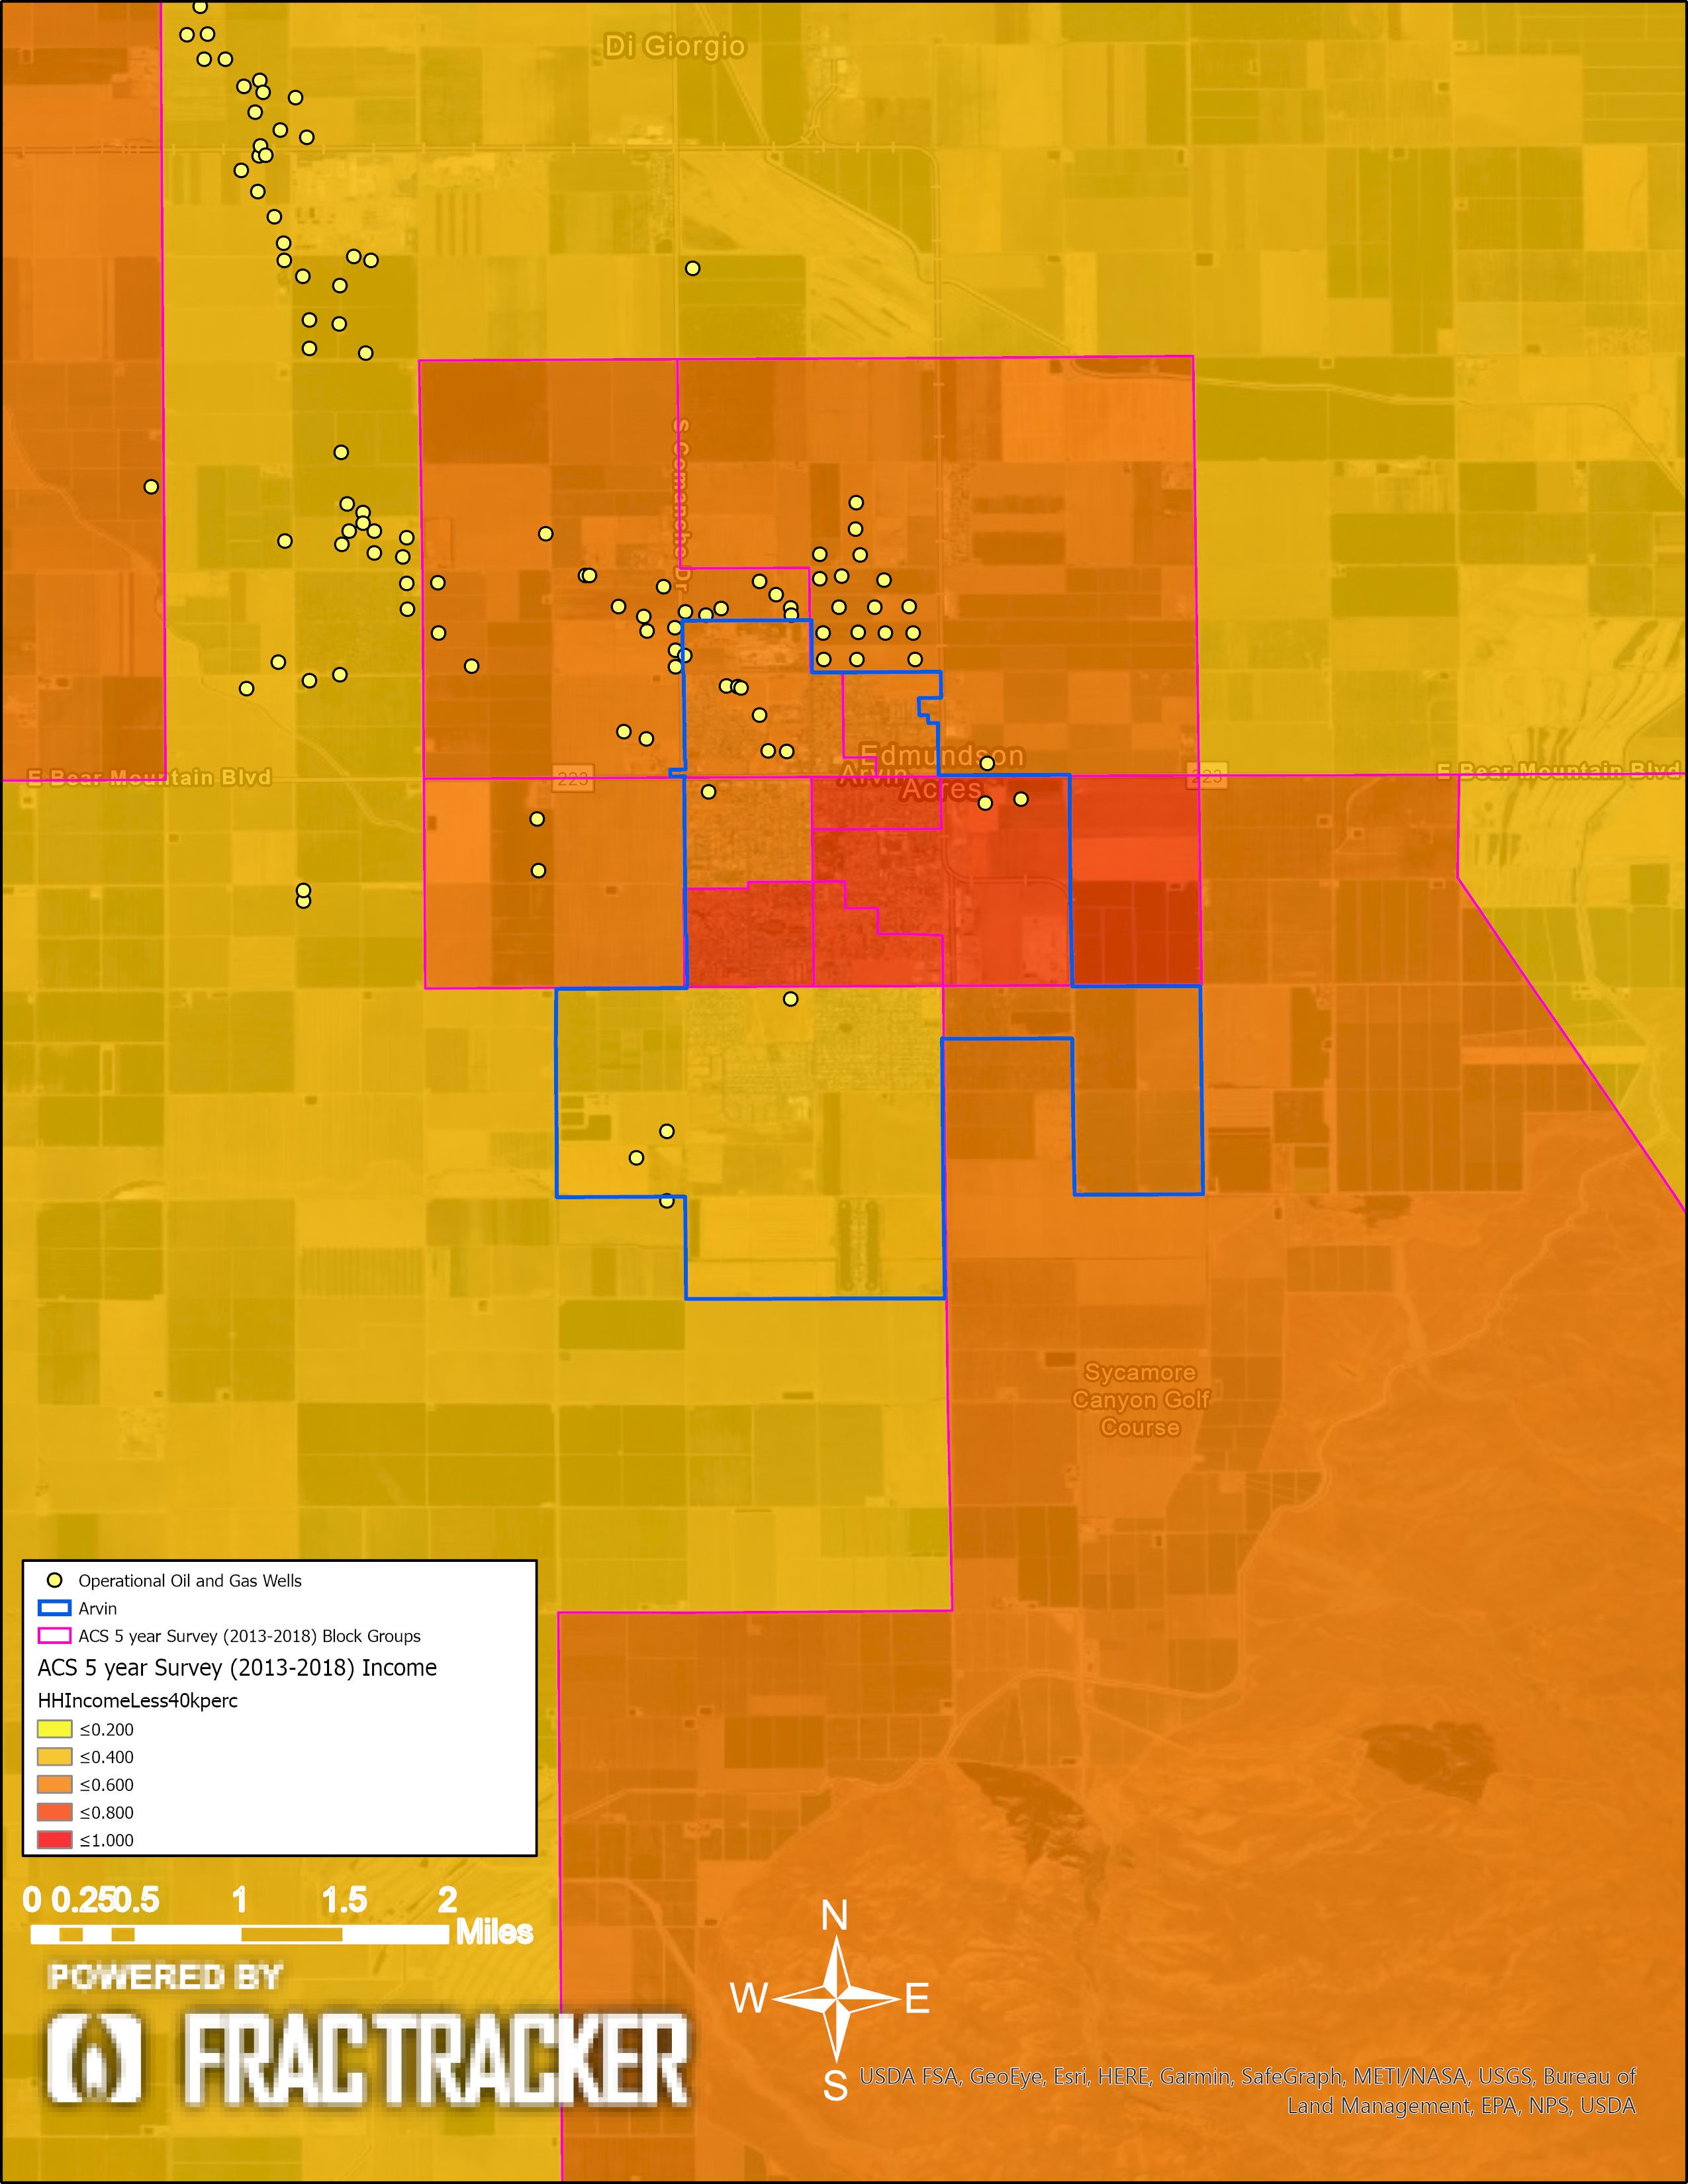
Figure 10. Arvin income disparity: This map shows the population percentage with annual incomes less than or equal to $40,000, which is less than 80% of the Kern median income of $51,579 (2018).
Linguistic Isolation Disenfranchises Frontline Communities
Access to information is vital for representation. Without representation, communities have no power over their autonomy. Kern County’s Frontline Communities are denied this basic, but absolutely vital right. According to the U.S. Census, over 51% of Kern County is Hispanic, and the maps below show that the demographics of the Frontline Communities in these cities are regularly between 80 – 100% Hispanic. Additionally, the maps illustrate that the households in these communities are majority Spanish-speaking households, many with limited English proficiency (all persons aged five and older reported speaking English less than “very well”). Yet Kern County regulators only provide information, notices, and other materials in English. This linguistically segregates power in Kern County, limiting Spanish-speaking Kern residents and citizens from participating in local decision-making processes.
Using the five-year ACS census data (2018) clipped by the 2,500 feet well setback zone, I have calculated the percentage and number of Spanish-speaking households. For the areas of Frontline Community block groups within 2,500 feet of an operational well, 9,077 households (30.8%) speak Spanish as their primary language, and 1,900 households have limited access to proficient English translators.
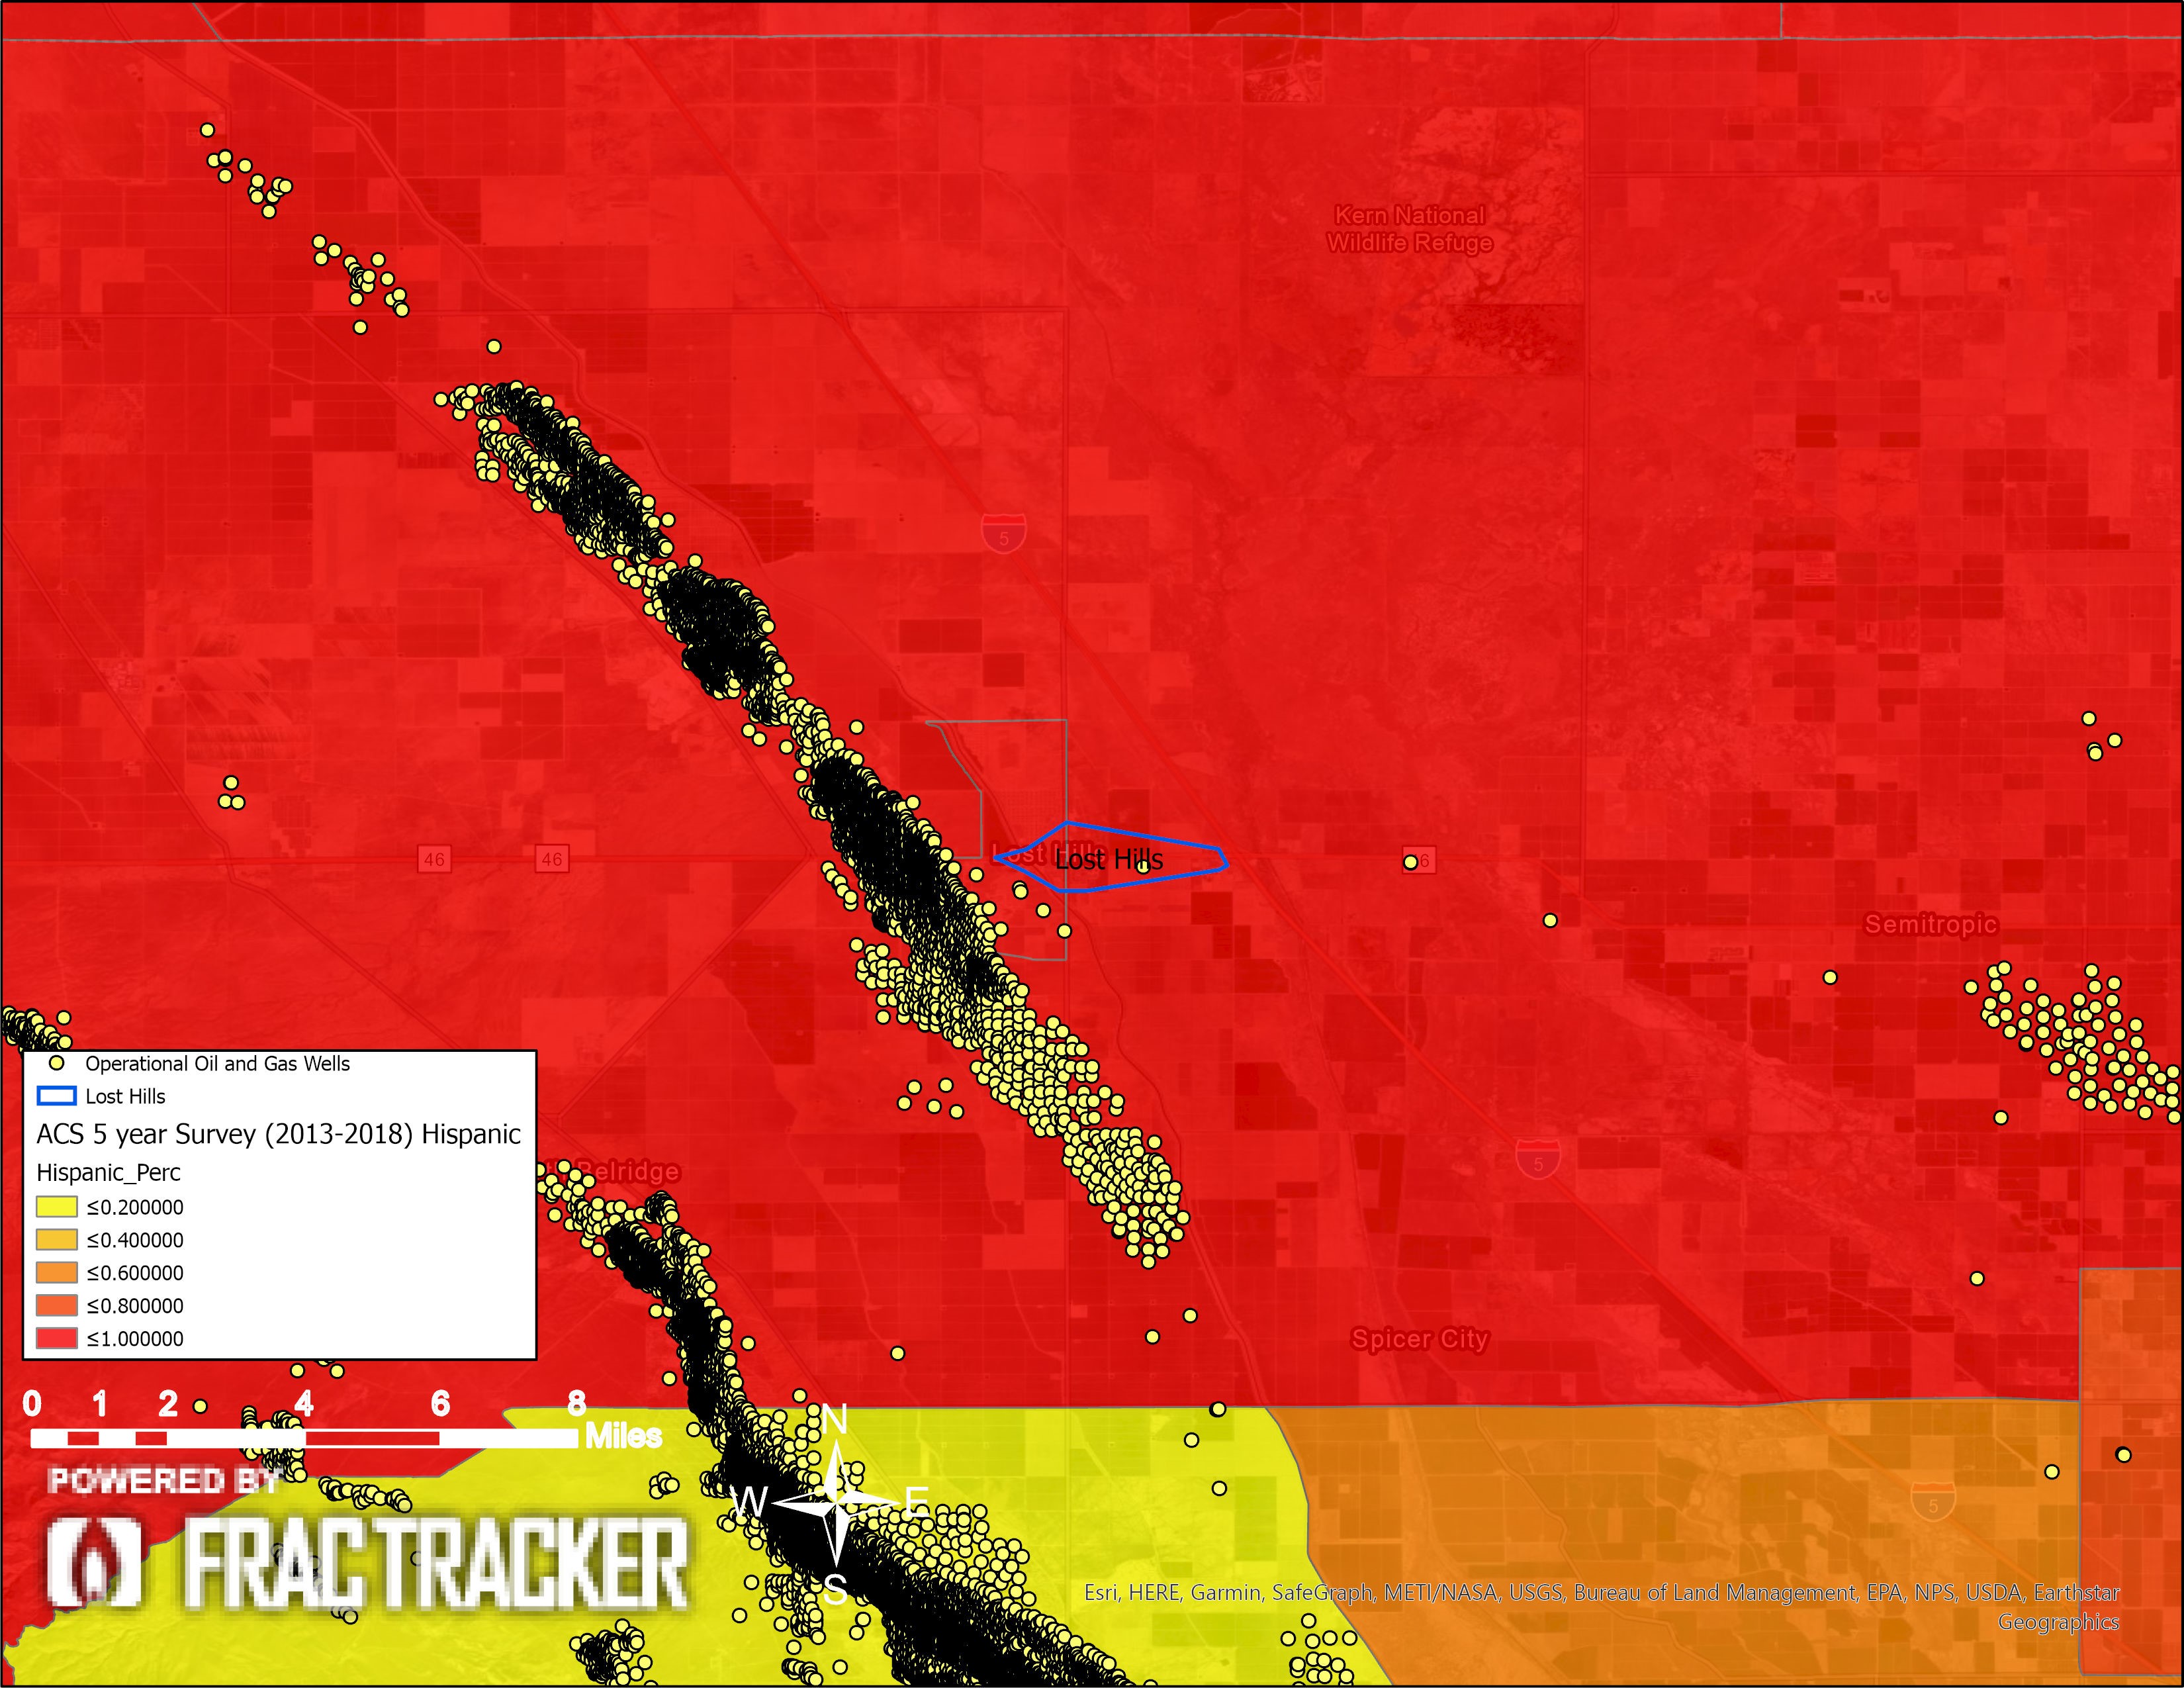
Figure 11. Lost Hills Hispanic population demographics: This map shows the Hispanic percentage of the population. In these maps, the ACS data is summarized in percentages of one, where, for example, light orange (<.400) refers to areas where 20% – 40% of the population is Hispanic.
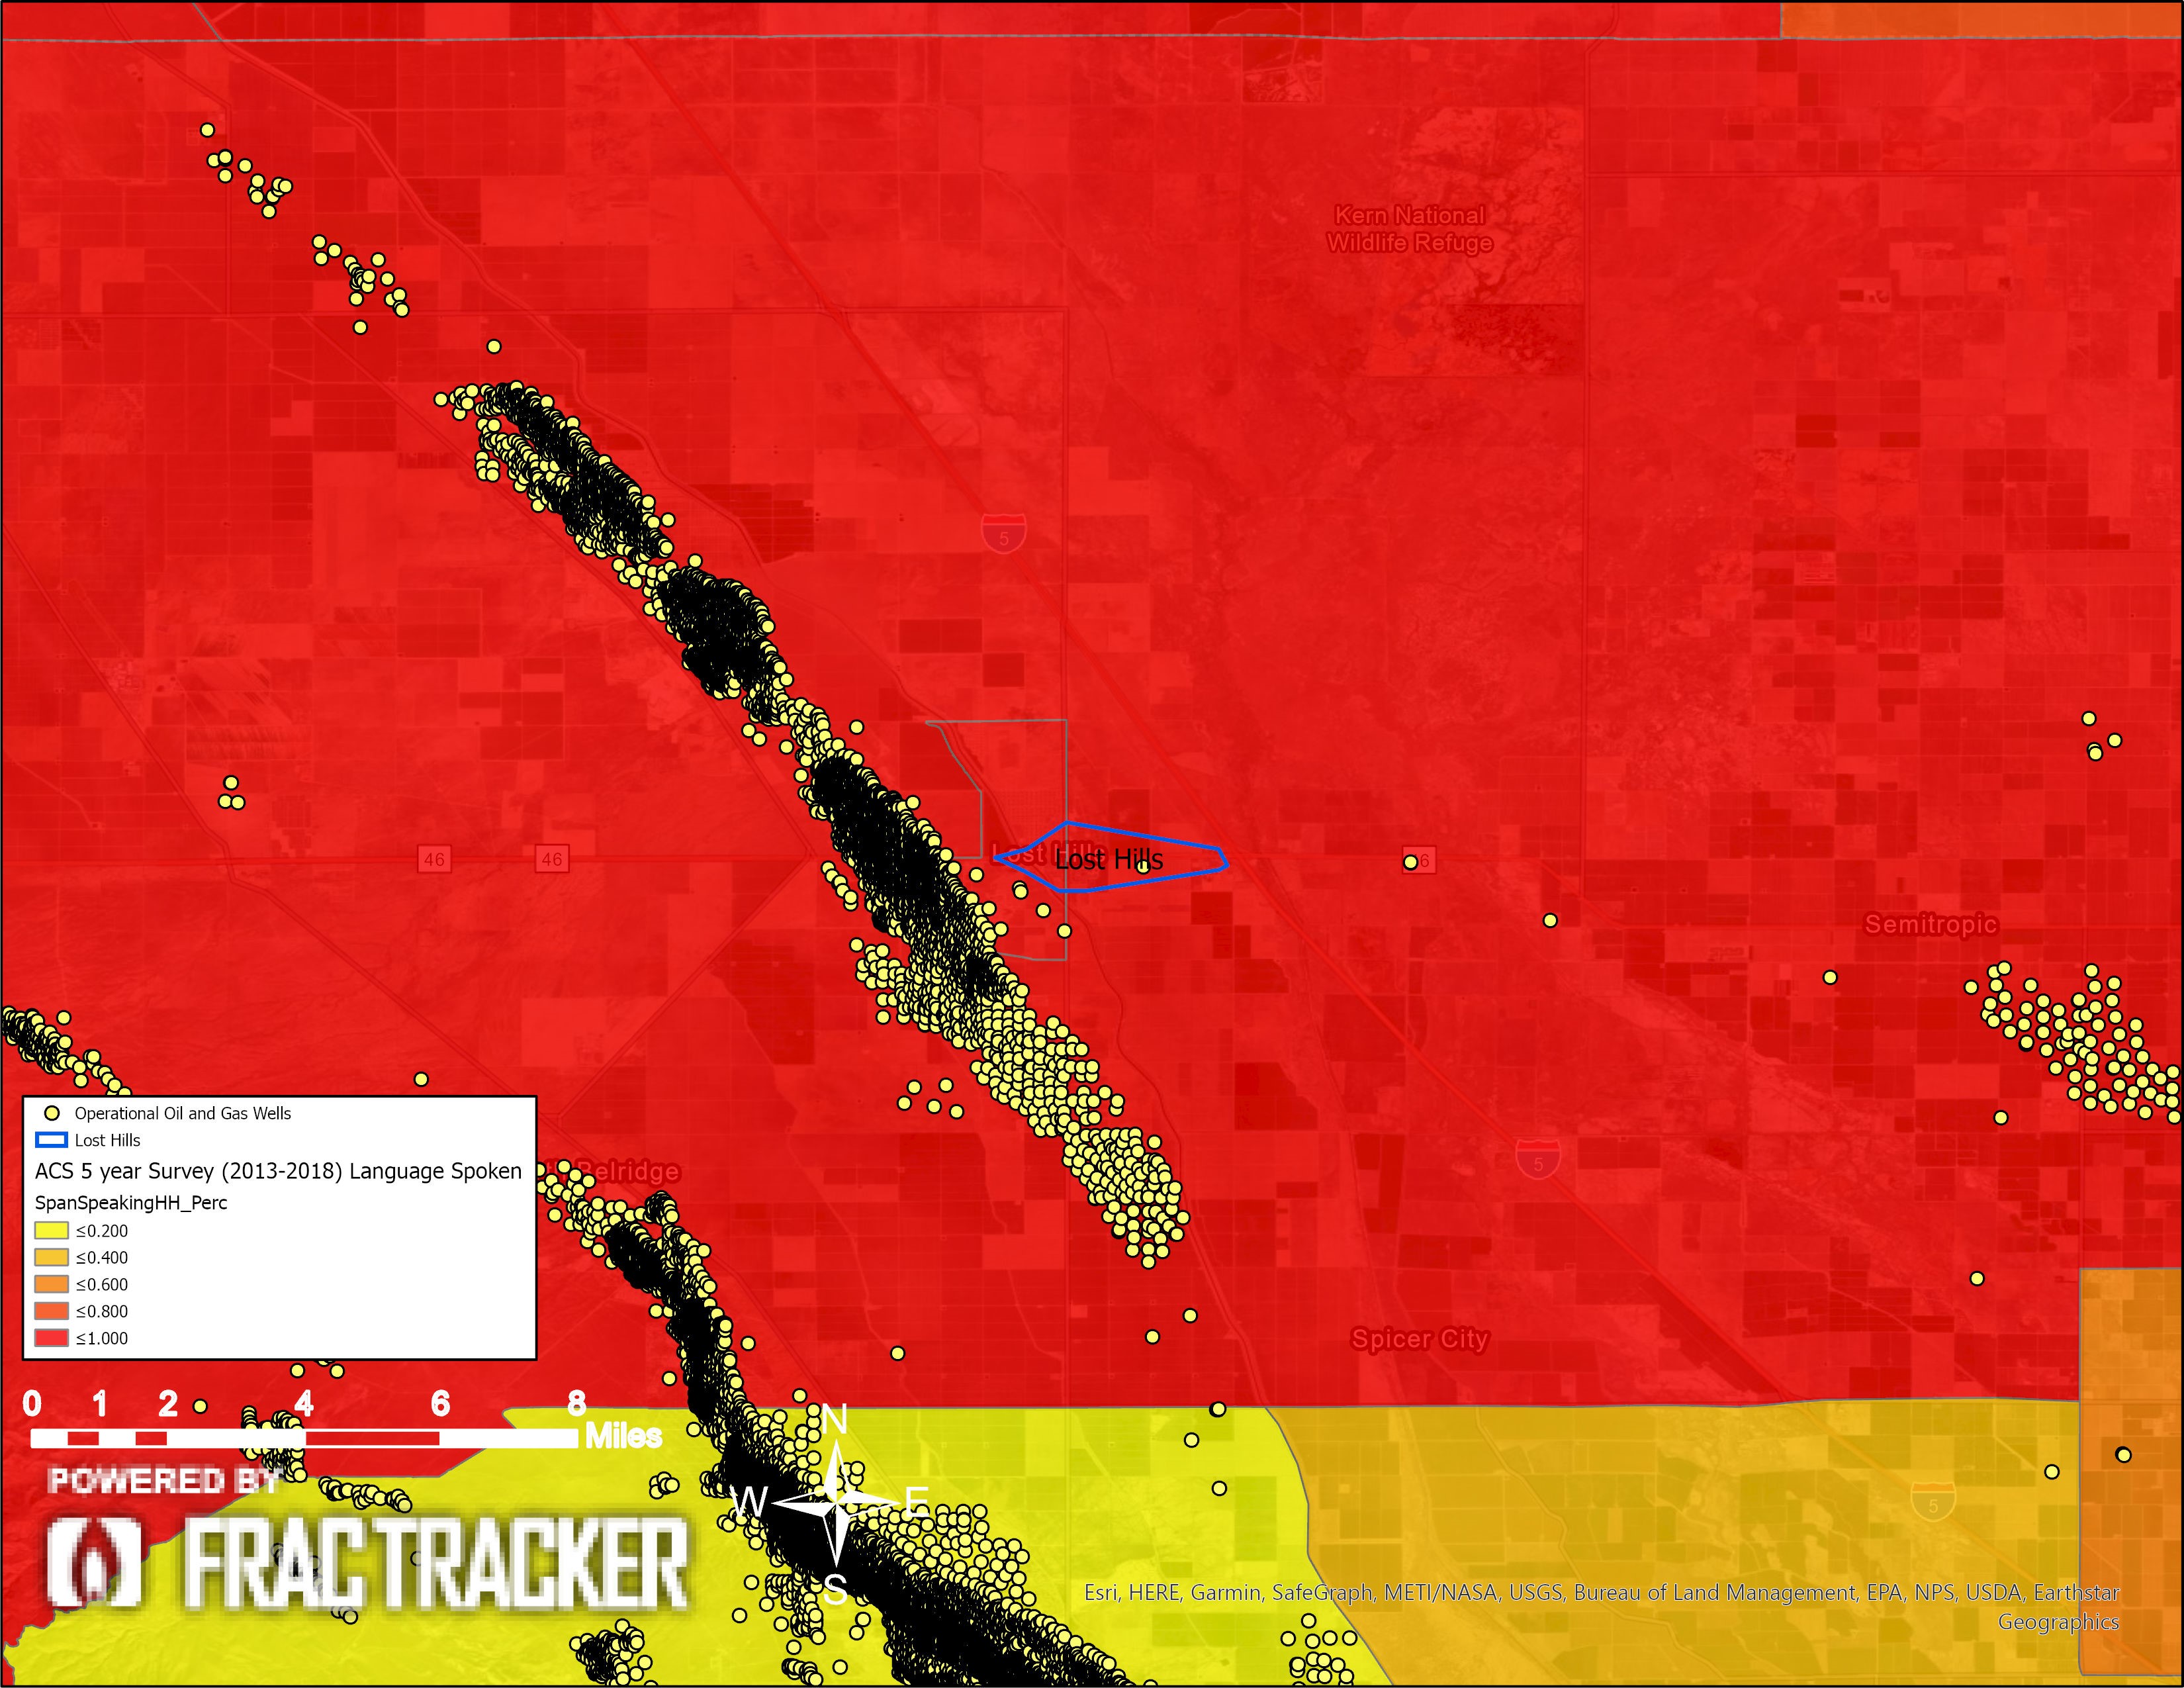
Figure 12. Lost Hills Spanish-speaking households: This map shows the percentage of the households that speak Spanish as their primary language. In these maps, the ACS data is summarized in percentages of one, where, for example, light orange (<.400) refers to areas where 20% – 40% of the households are Spanish speaking.
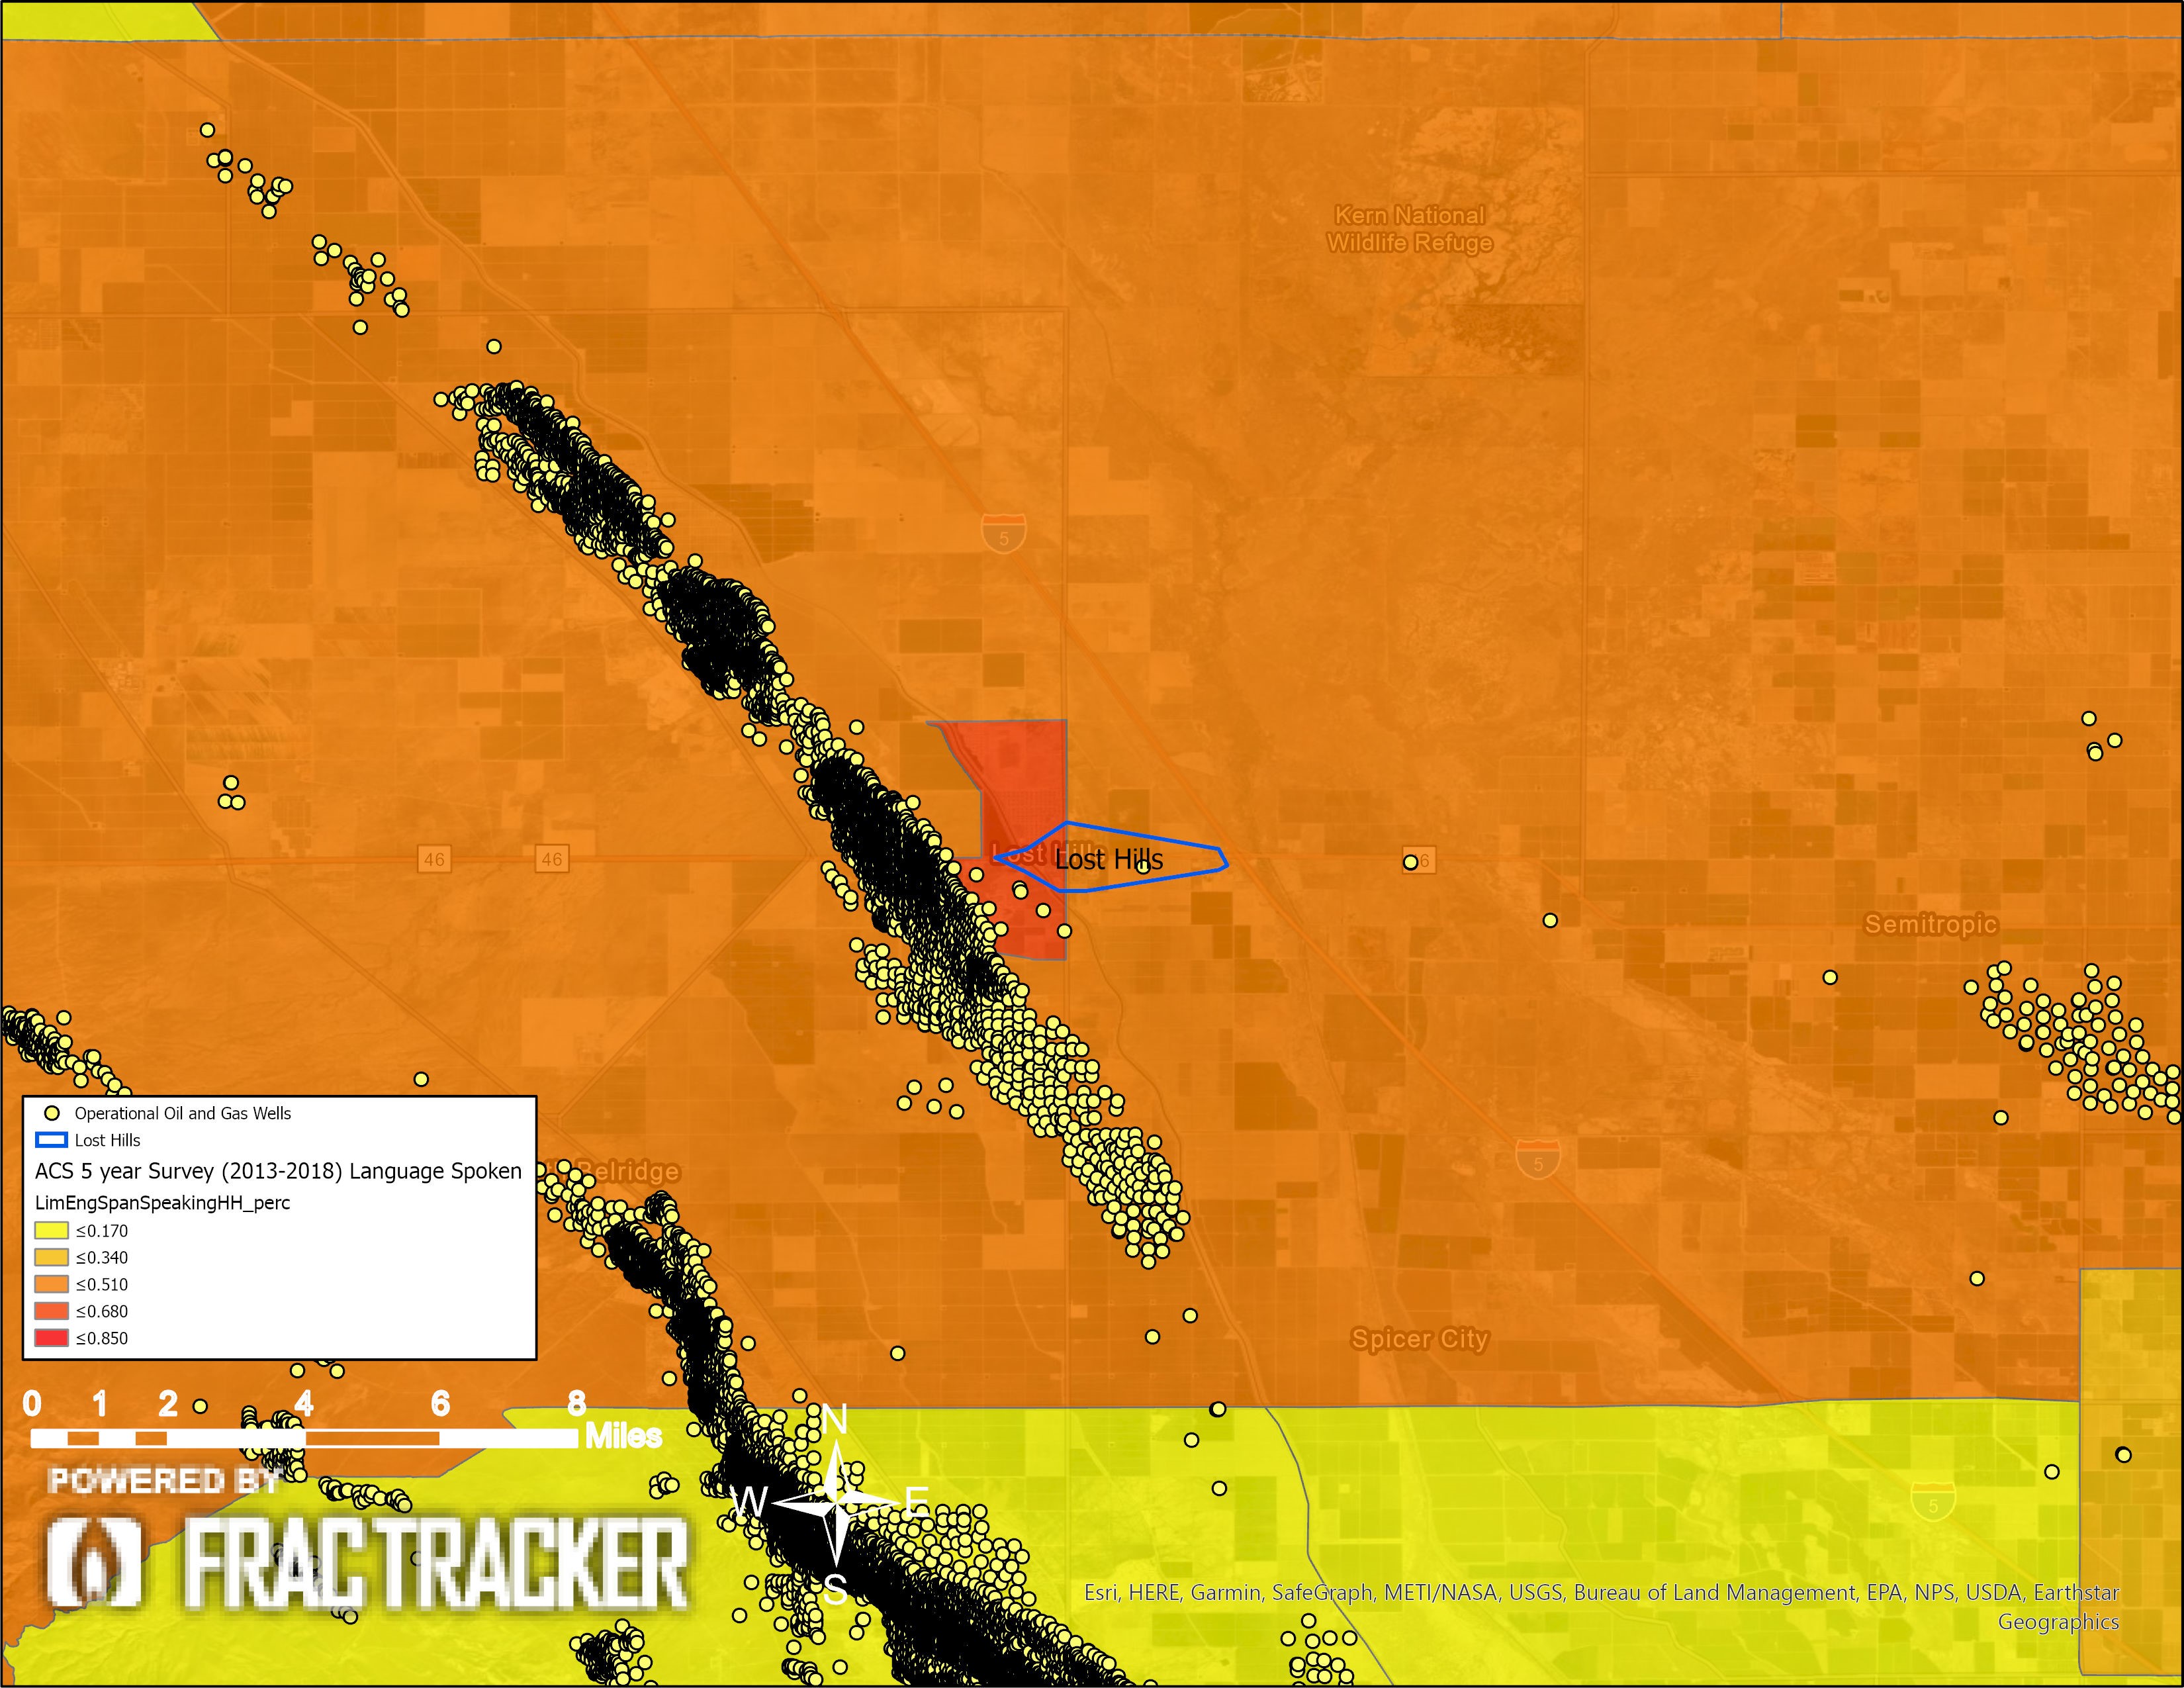
Figure 13. Lost Hills Limited English Spanish-speaking households: This map shows the household percentage that speak Spanish as their primary language, with limited English-speaking proficiency. In these maps, the ACS data is summarized in percentages of one, where, for example, light orange (<.400) refers to areas where 20% – 40% of the households are Spanish speaking and have limited English proficiency.
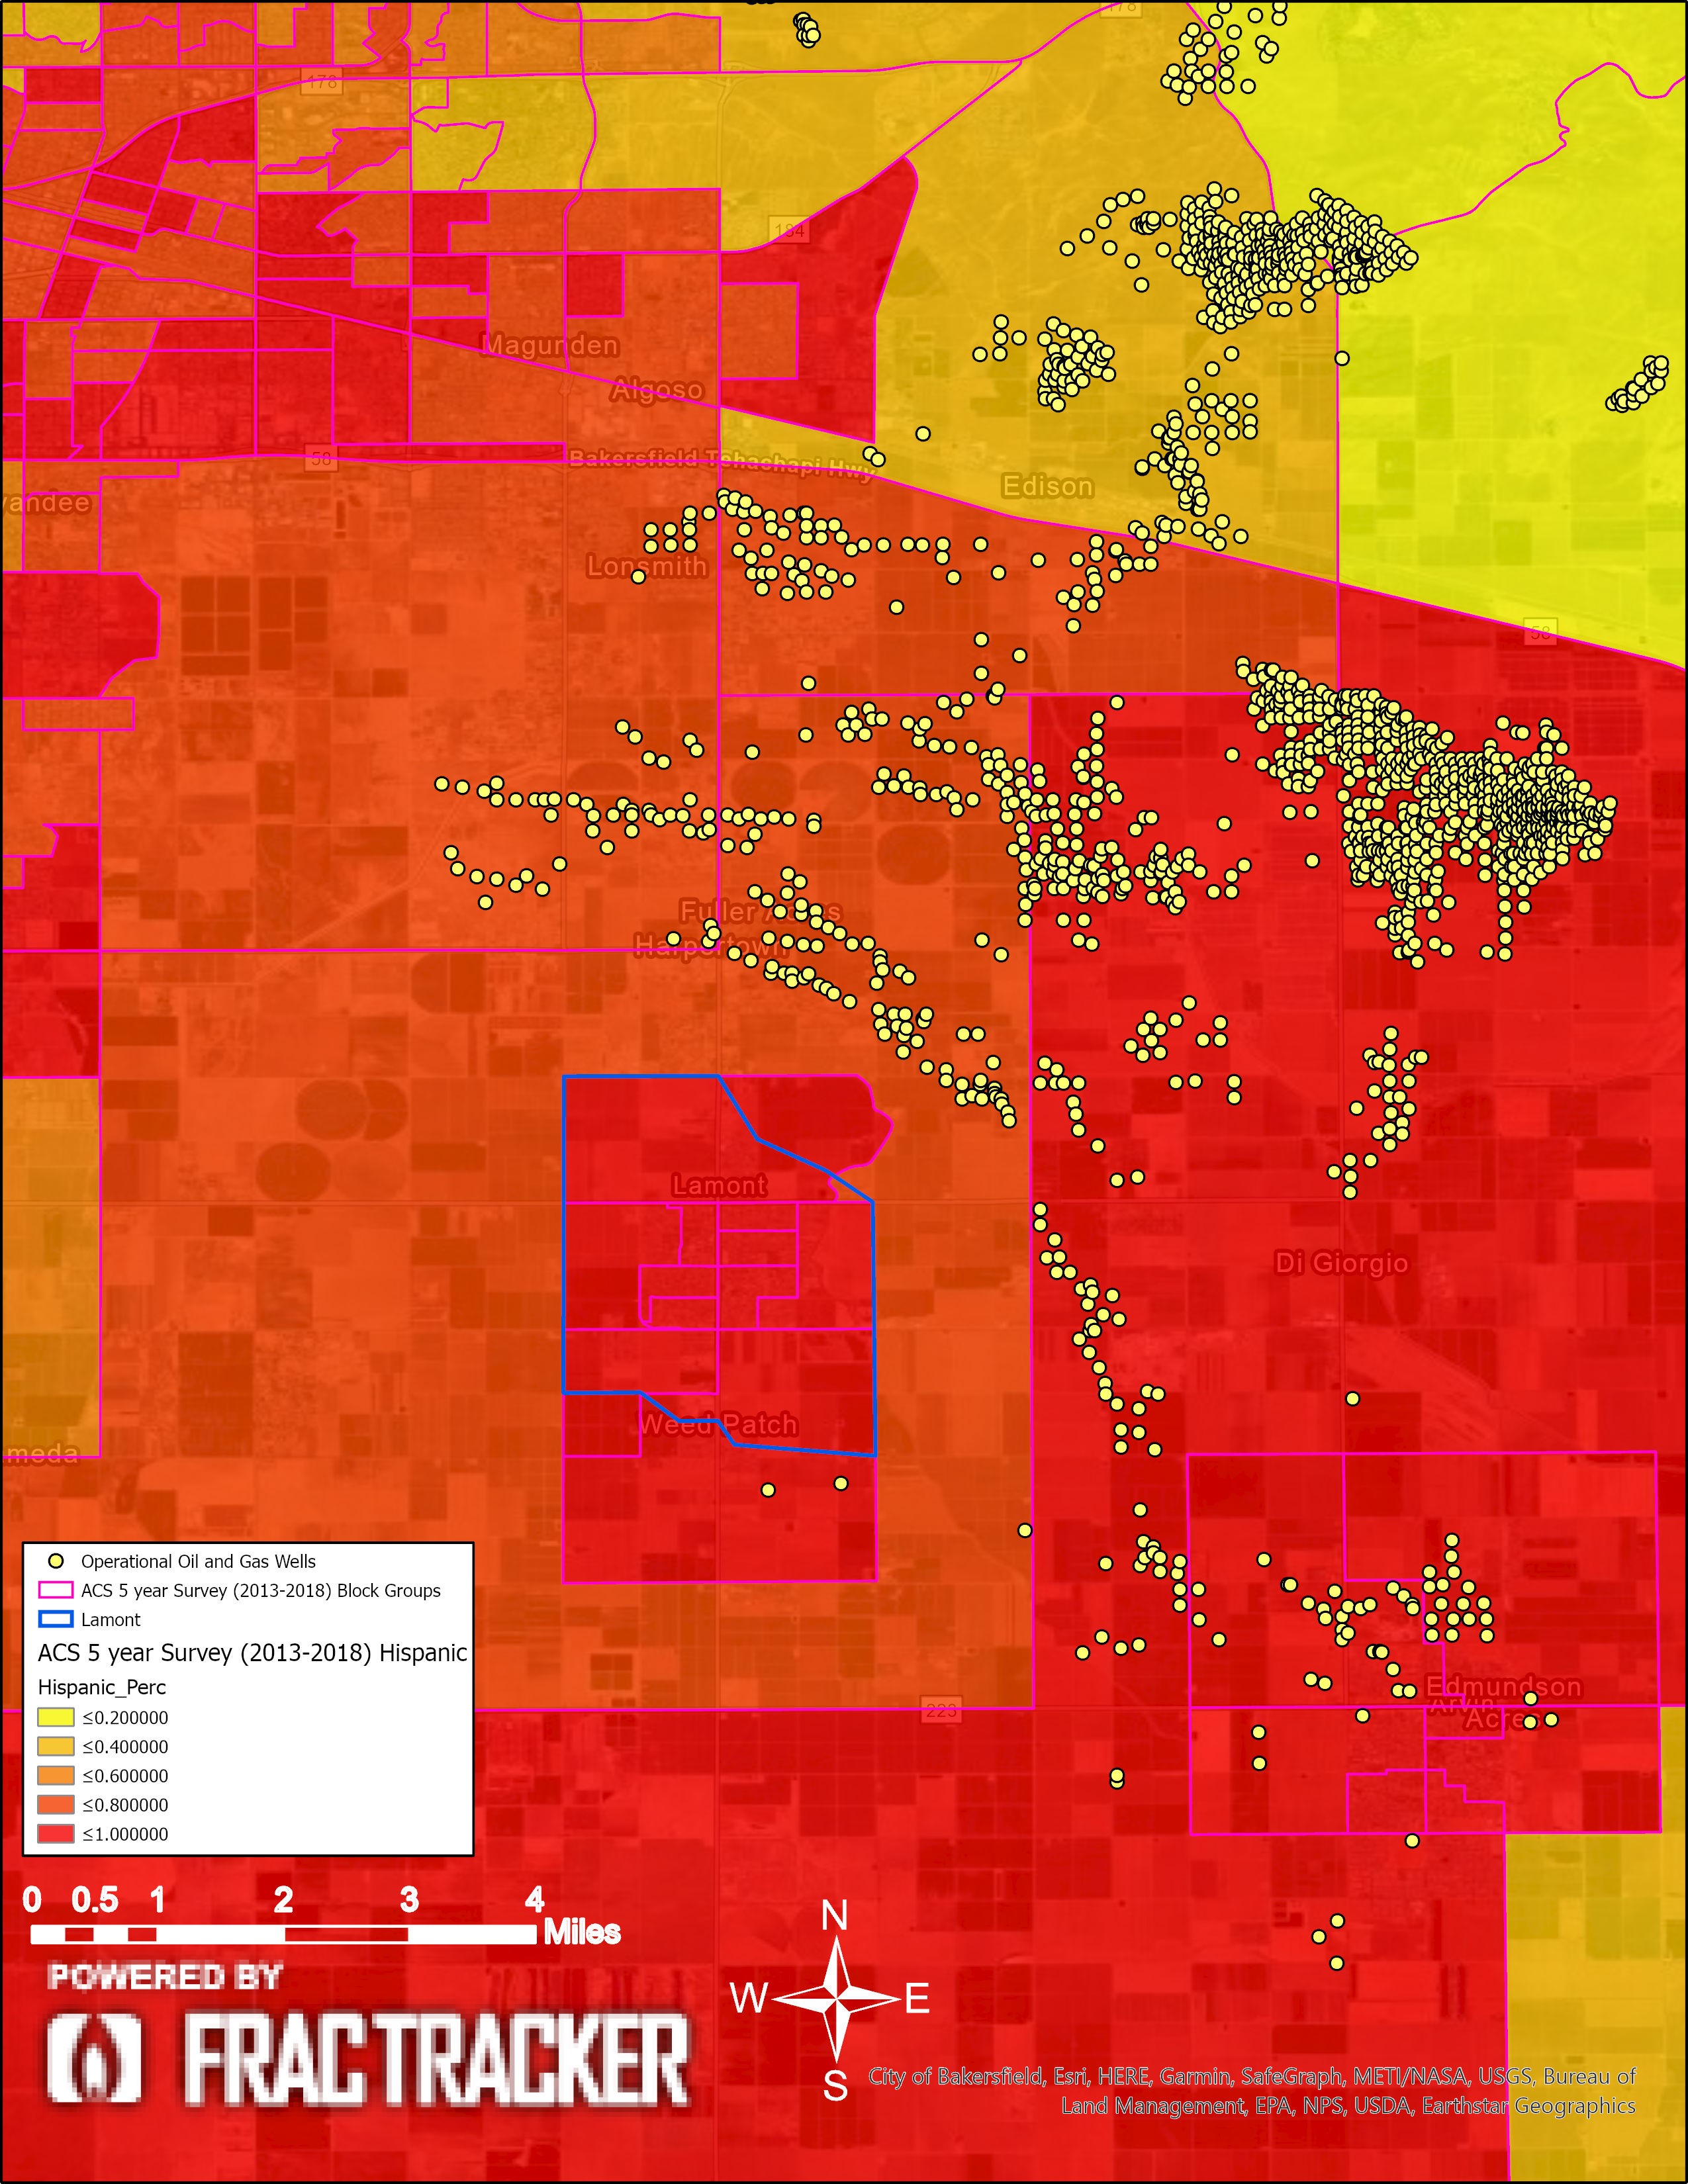
Figure 14. Lamont Hispanic population demographics: This map shows the Hispanic percentage of the population. In these maps, the ACS data is summarized in percentages of one, where, for example, light orange (<.400) refers to areas where 20% – 40% of the populations is Hispanic.
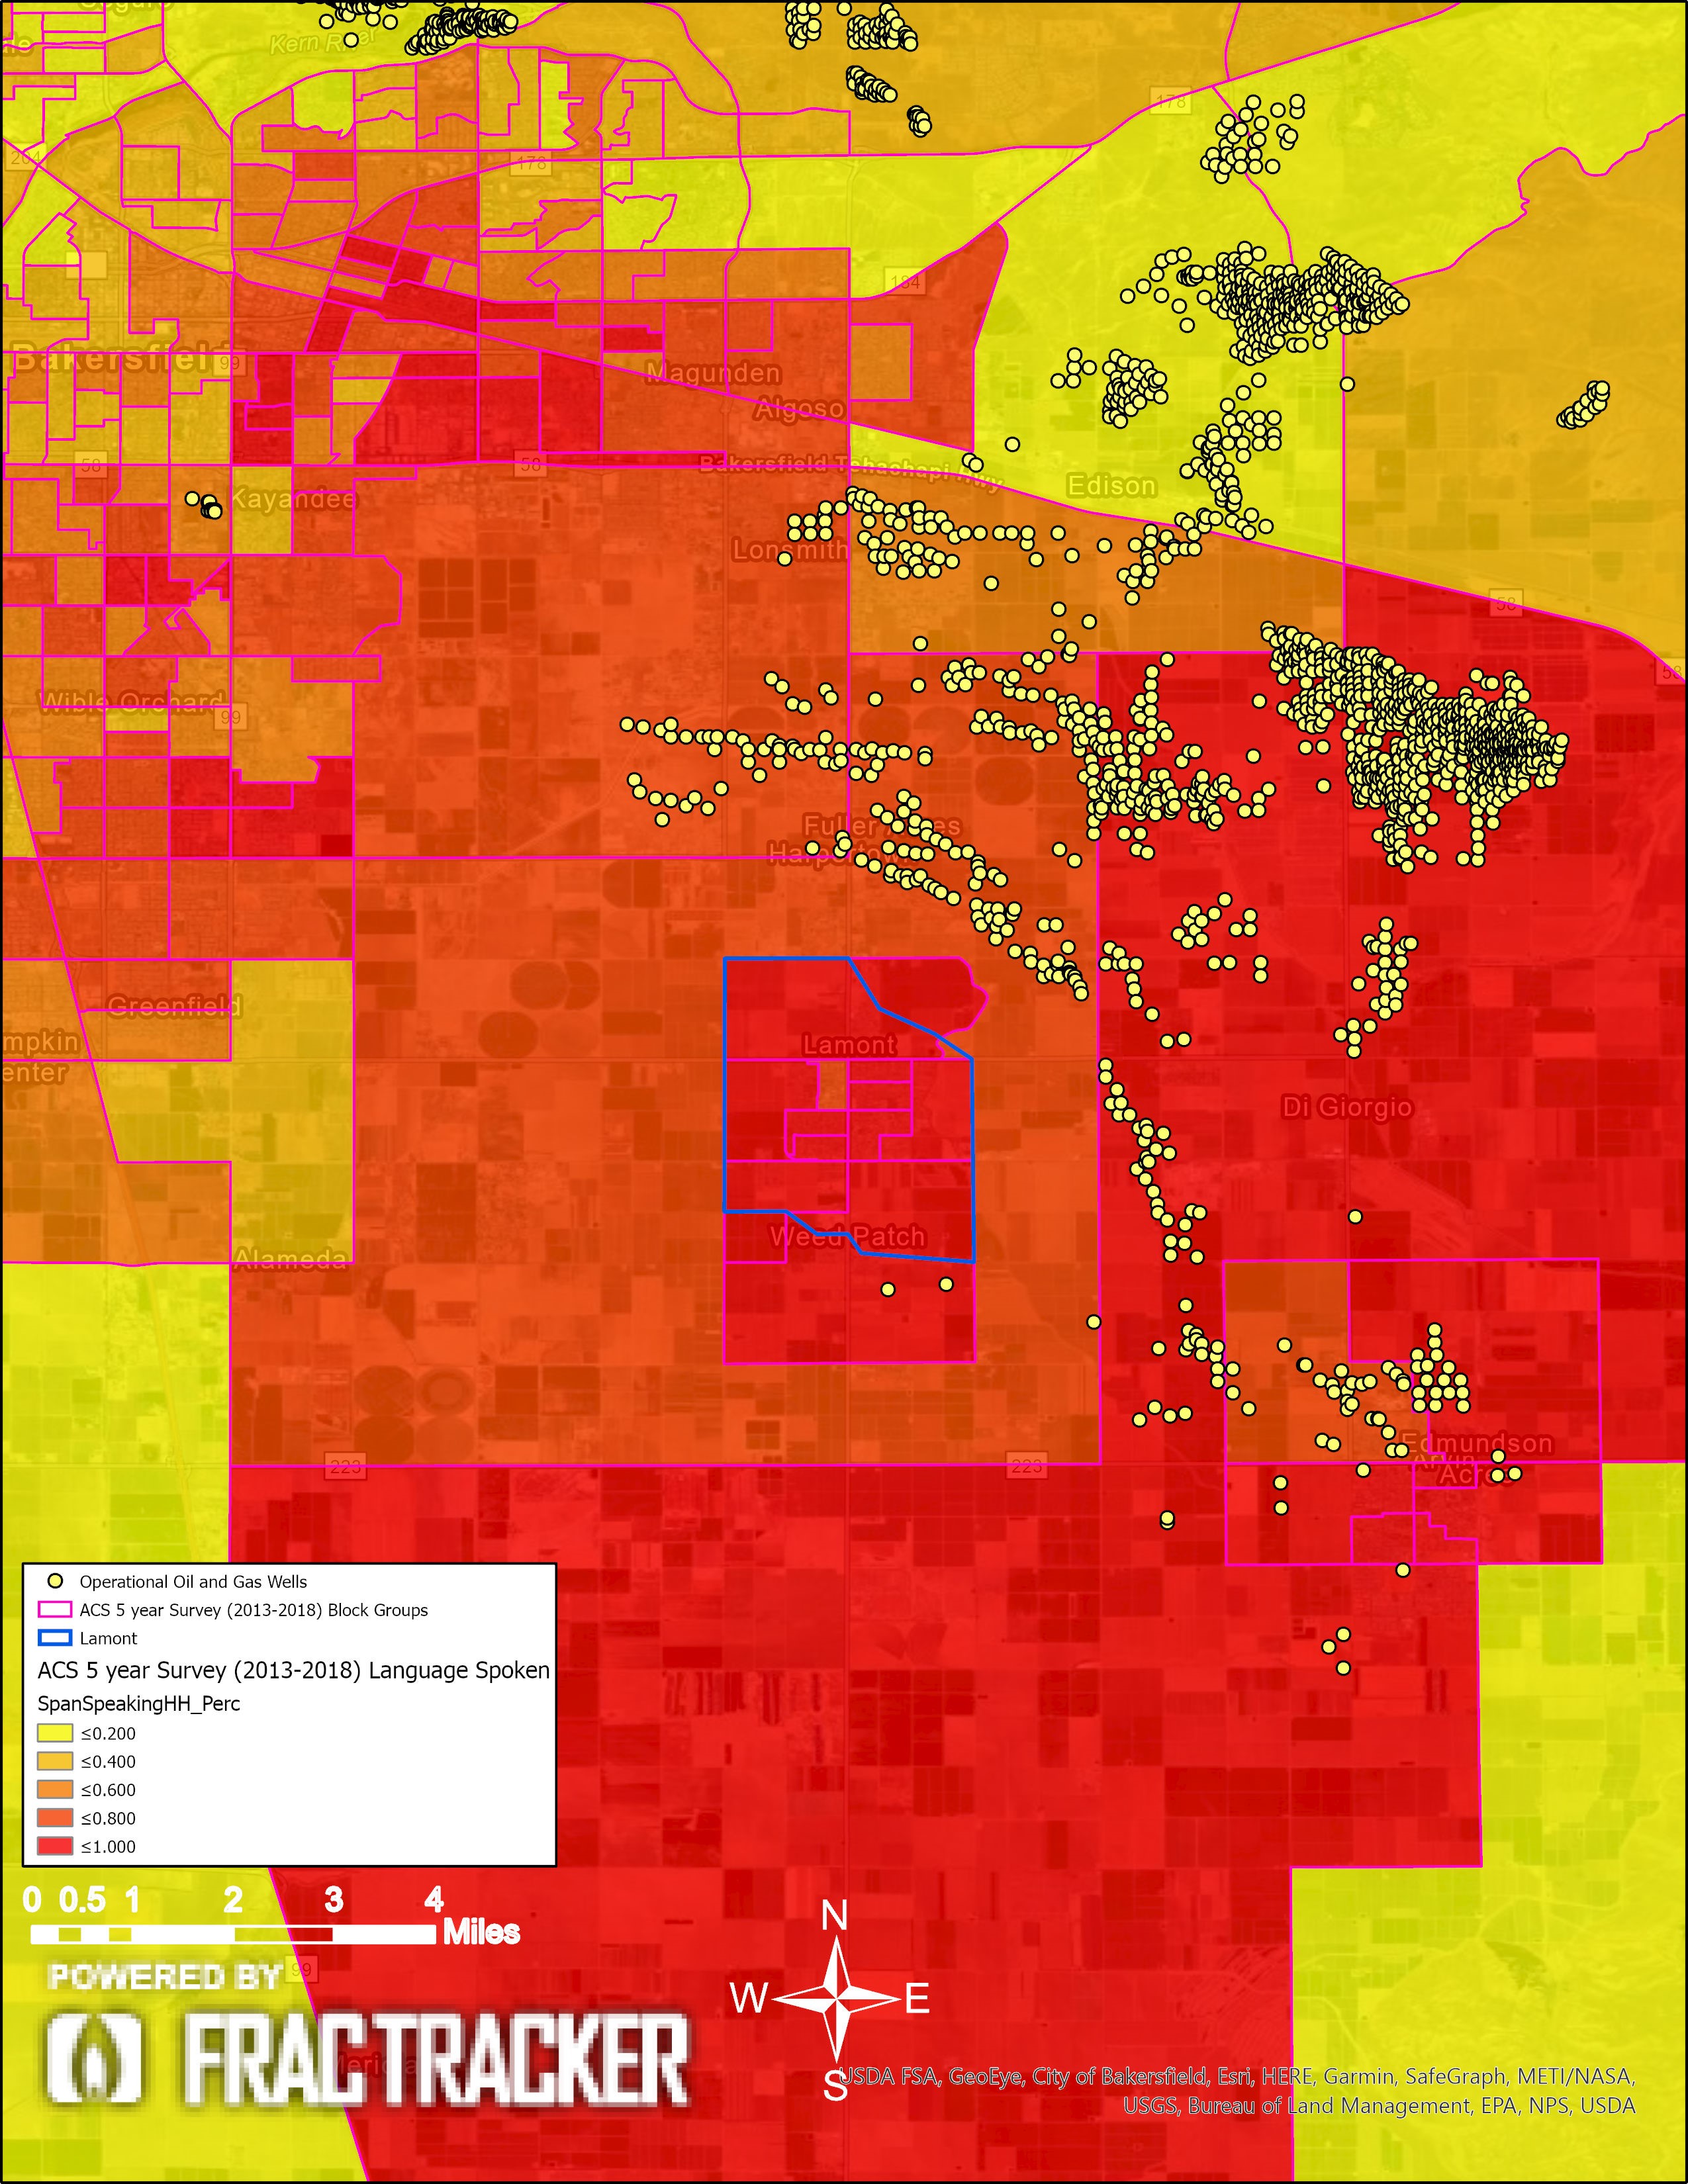
Figure 15. Lamont Spanish-speaking households: This map shows the percentage of the households that speak Spanish as their primary language. In these maps the ACS data is summarized in percentages of one, where, for example, light orange (<.400) refers to areas where 20% – 40% of the households are Spanish speaking.
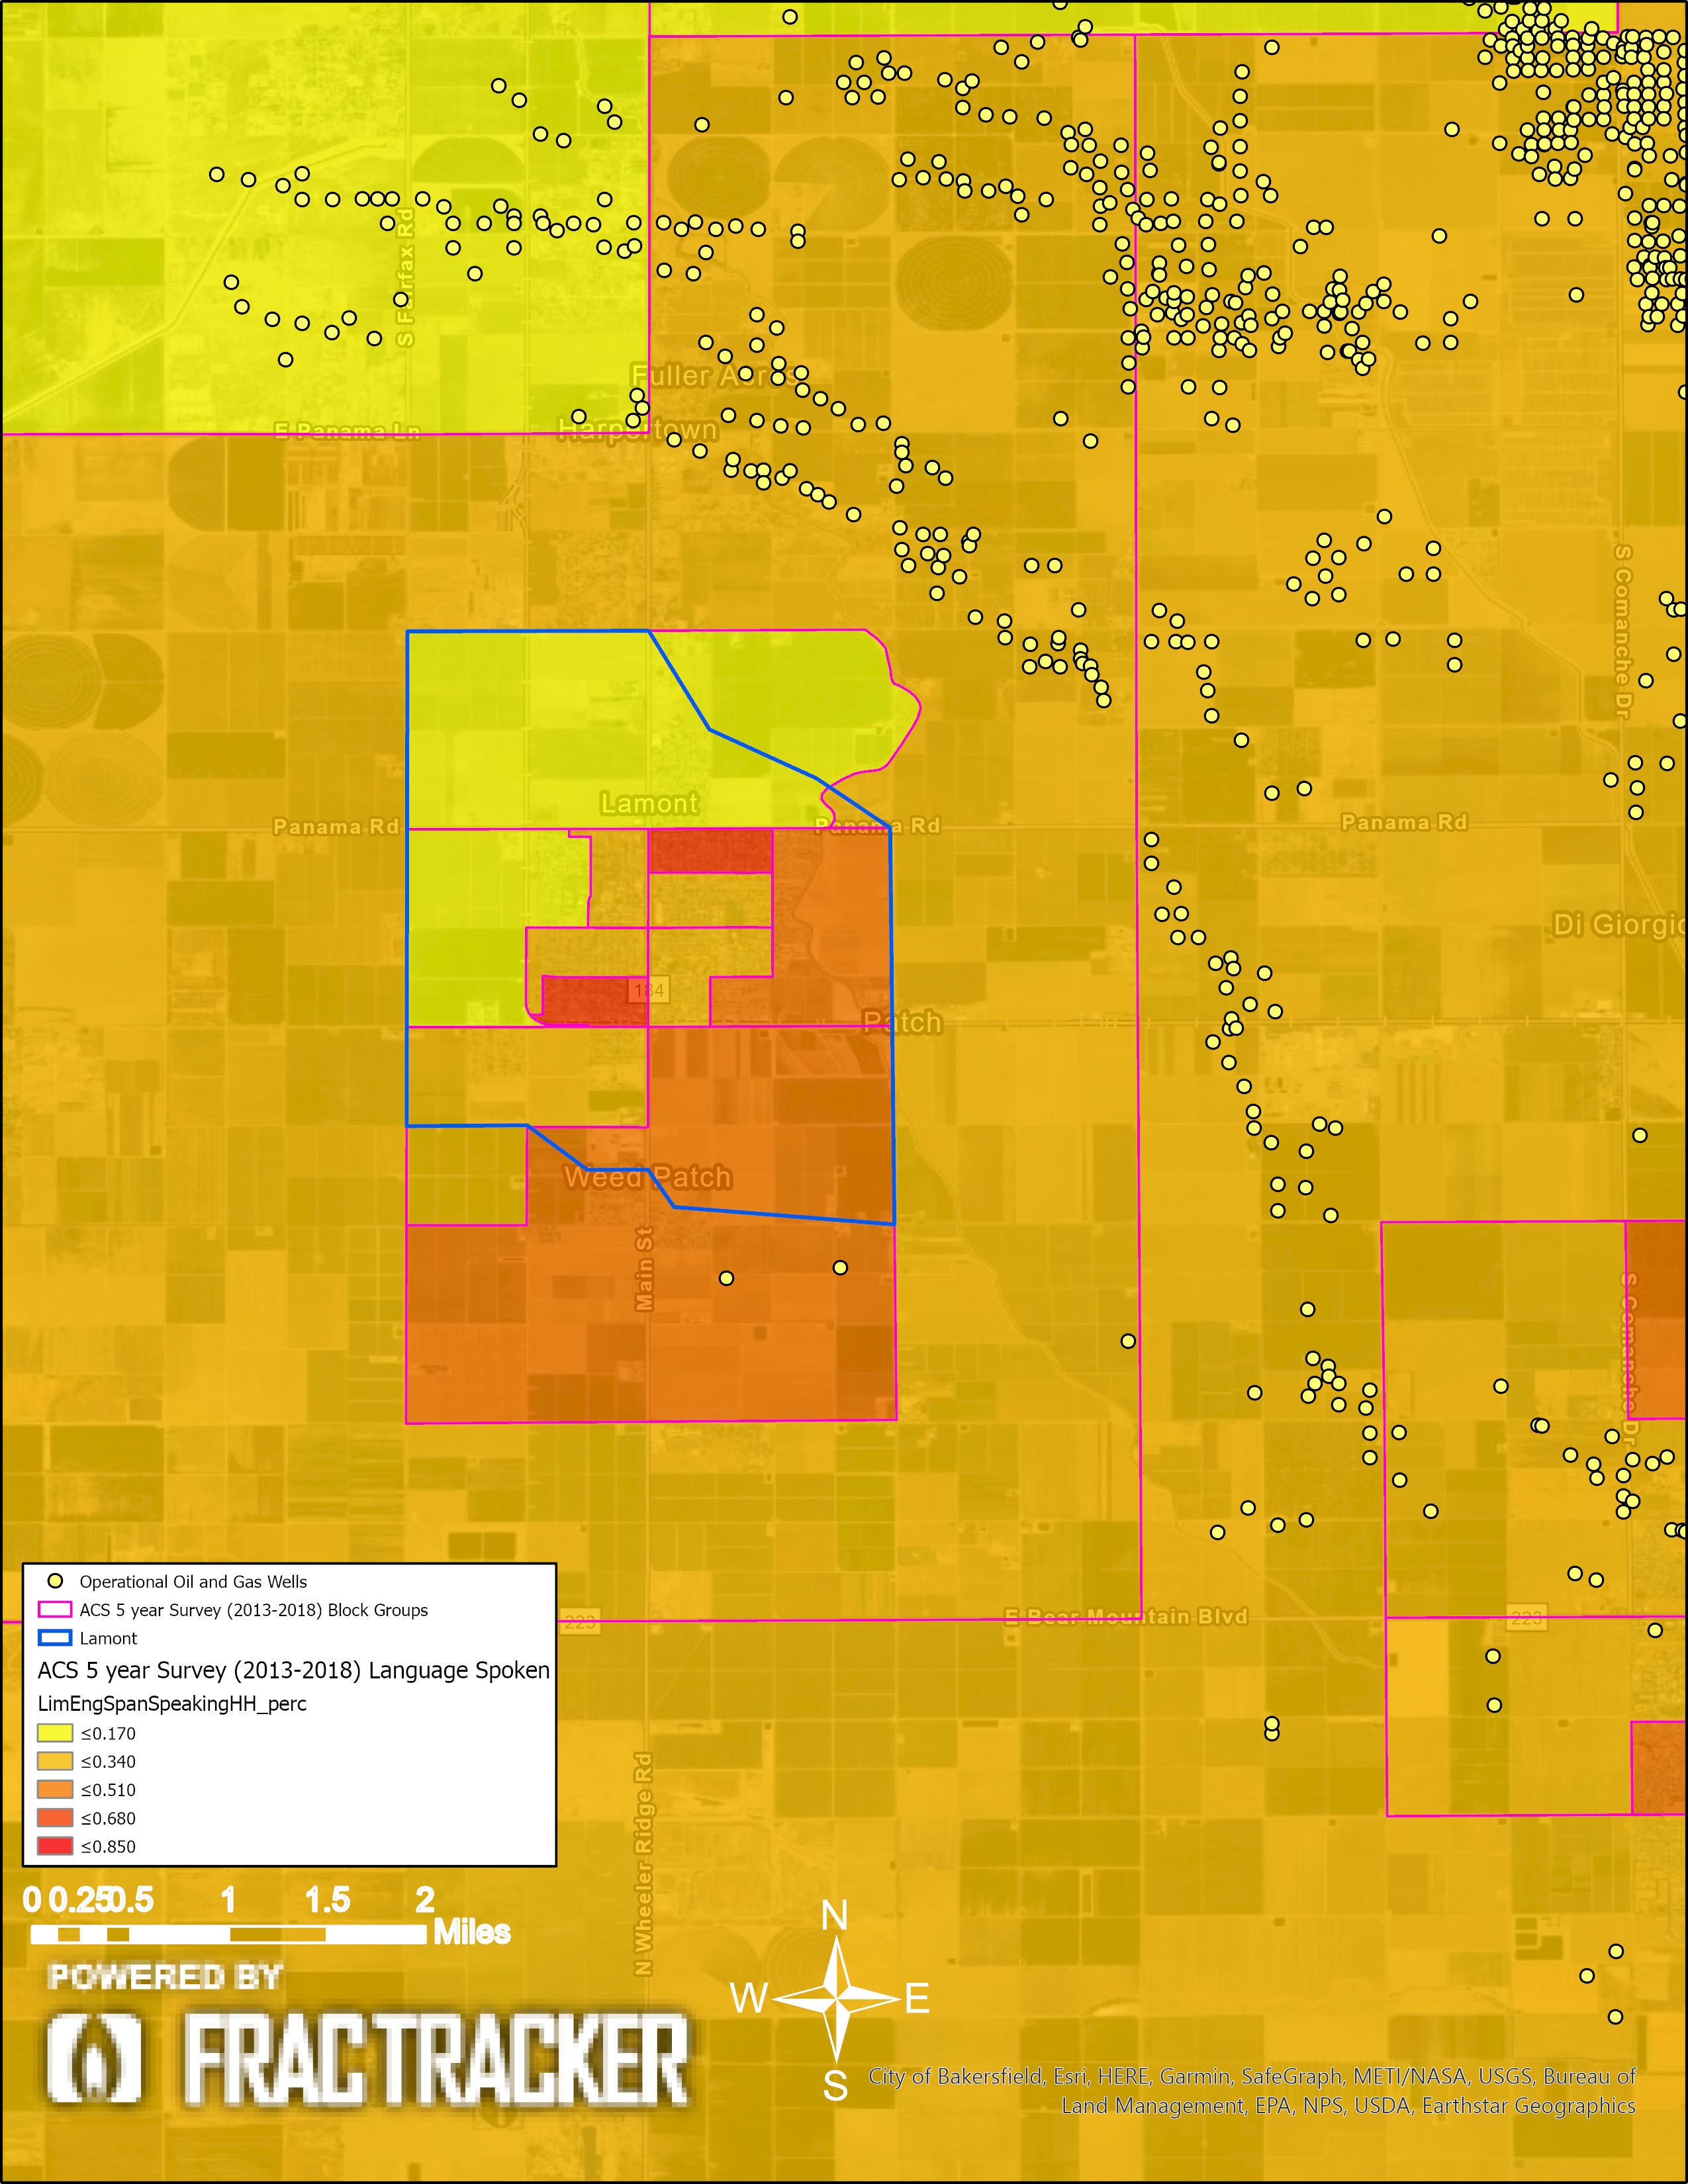
Figure 16. Lamont Limited English Spanish-speaking households: This map shows the percentage of the households that speak Spanish as their primary language, with limited English-speaking proficiency. In these maps, the ACS data is summarized in percentages of one, where, for example, light orange (<.400) refers to areas where 20% – 40% of the households are Spanish speaking and have limited English proficiency.
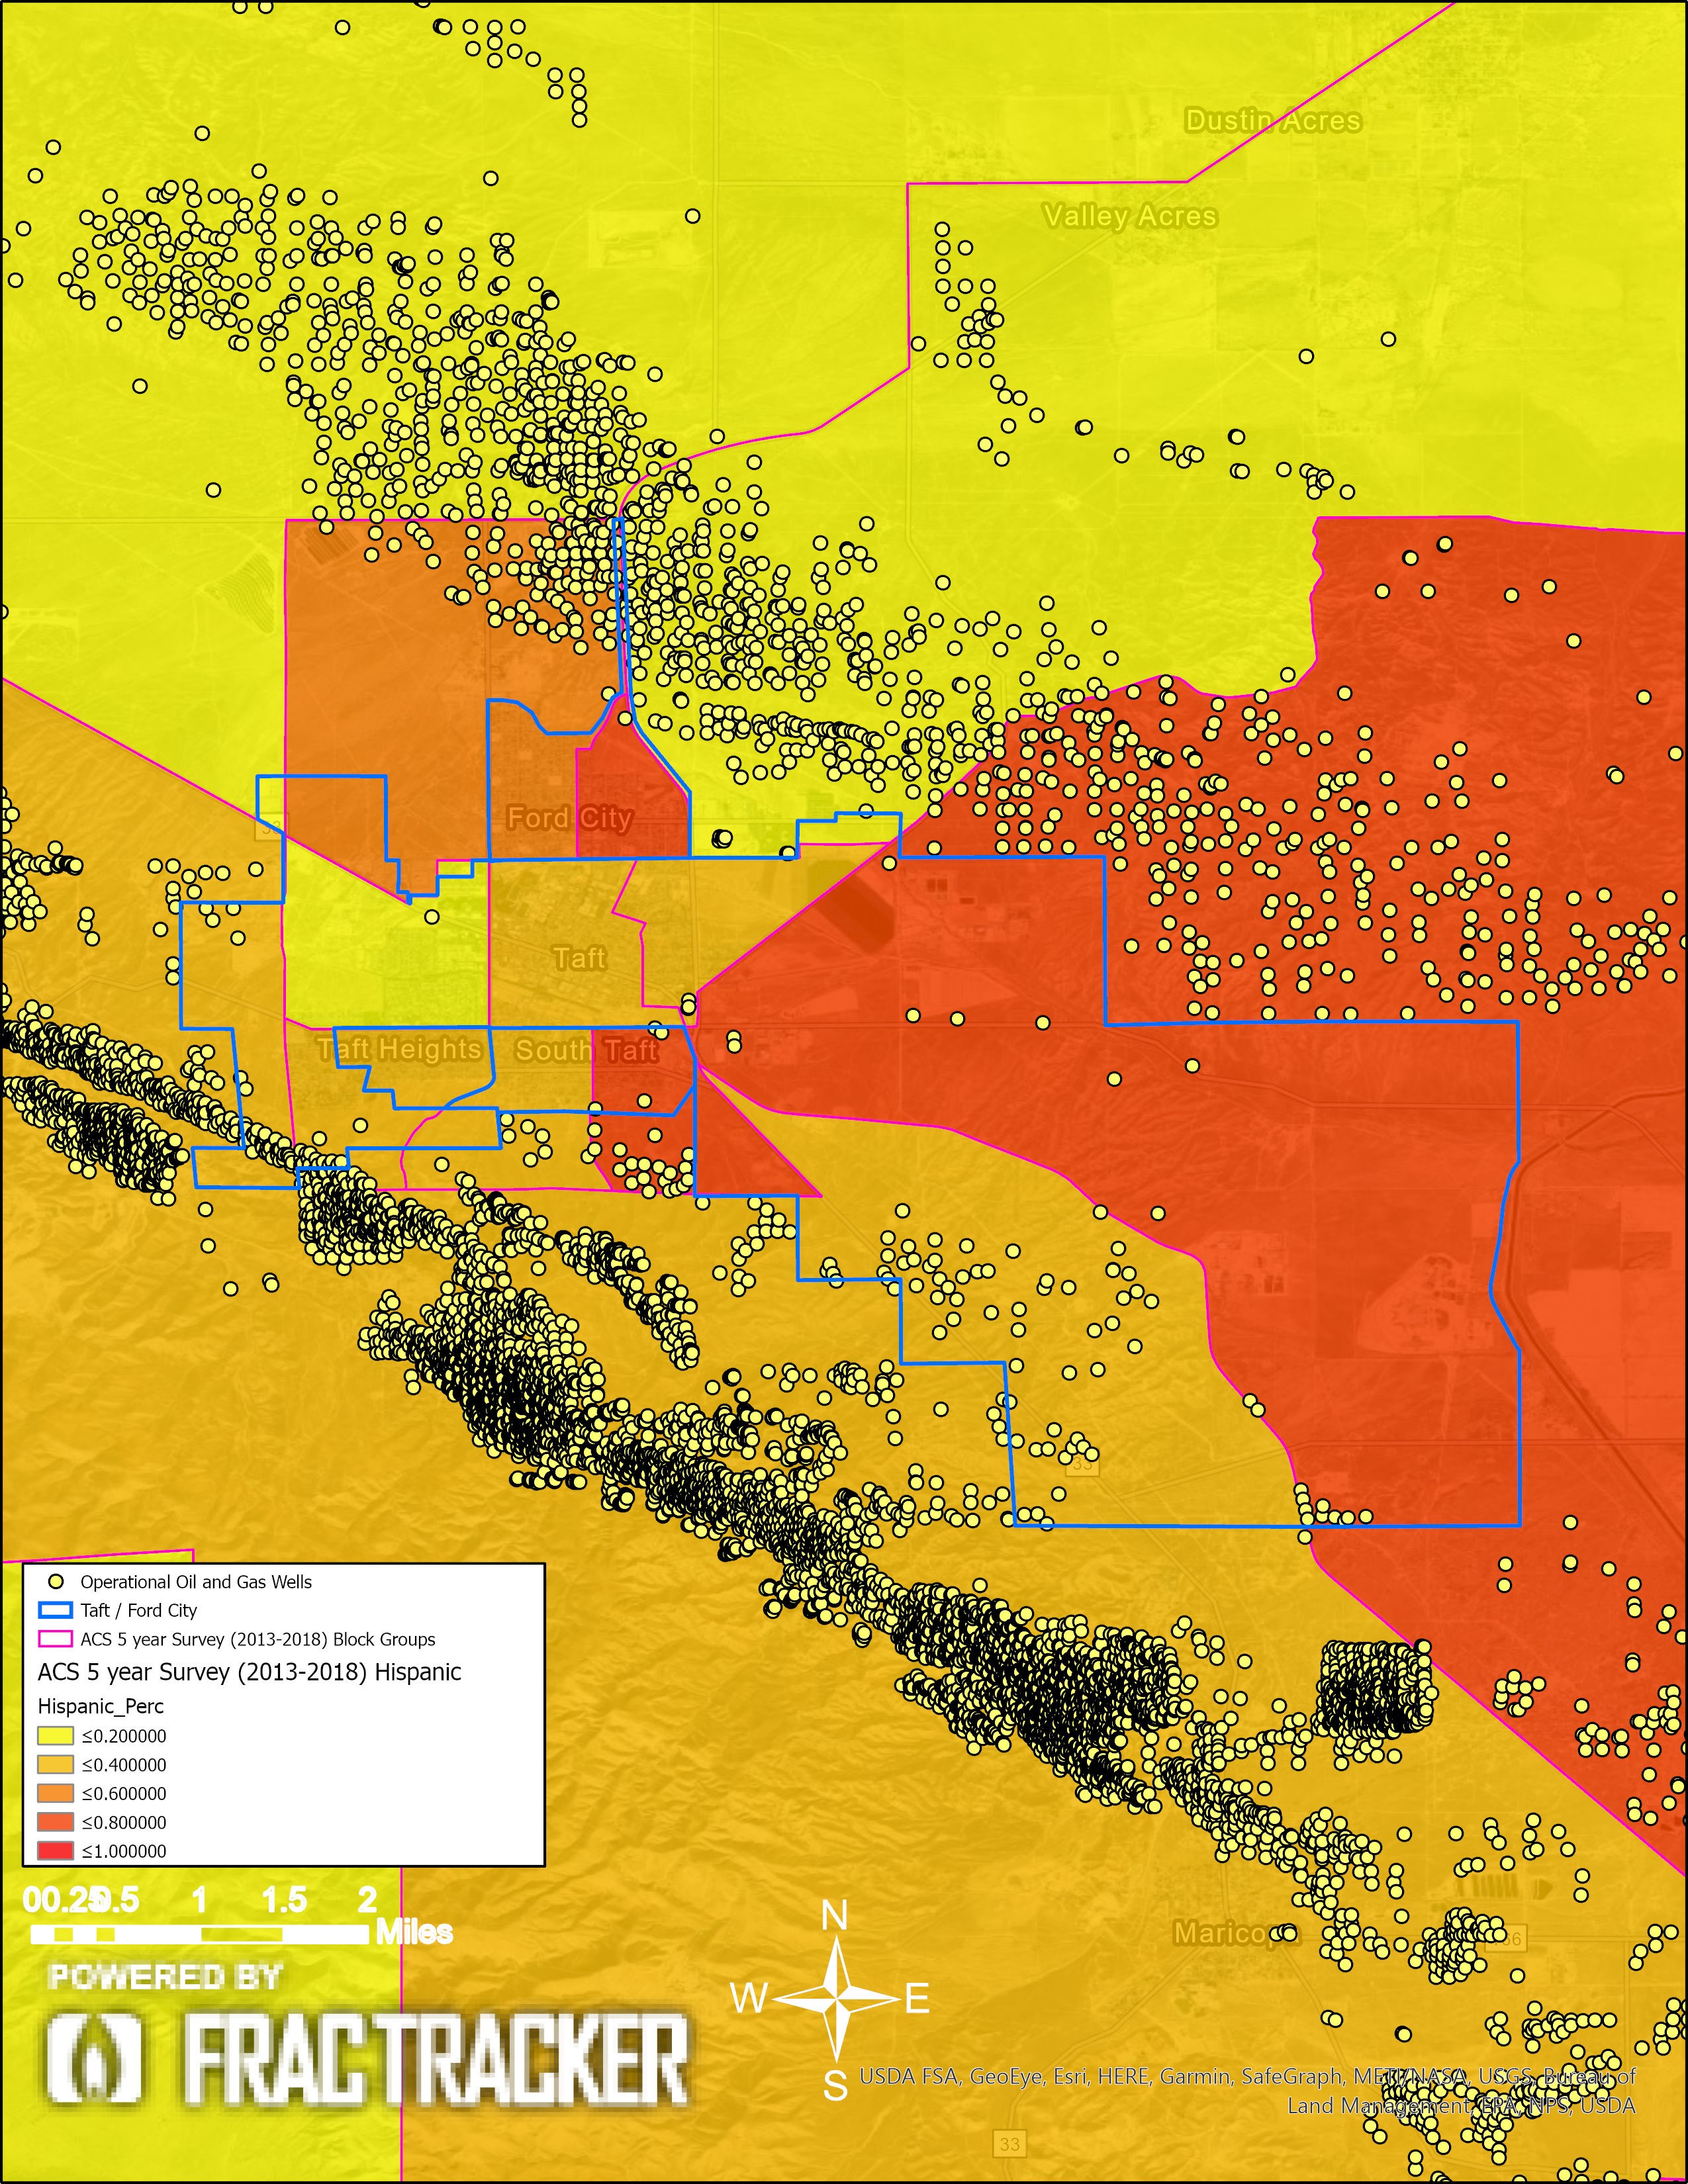
Figure 17. Taft Hispanic population demographics: The map shows the Hispanic percentage of the population. In these maps the American Community Survey data is summarized in percentages of 1, where, for example, light orange (<.400) in the map below refers to areas where 20%-40% of the populations is Hispanic.
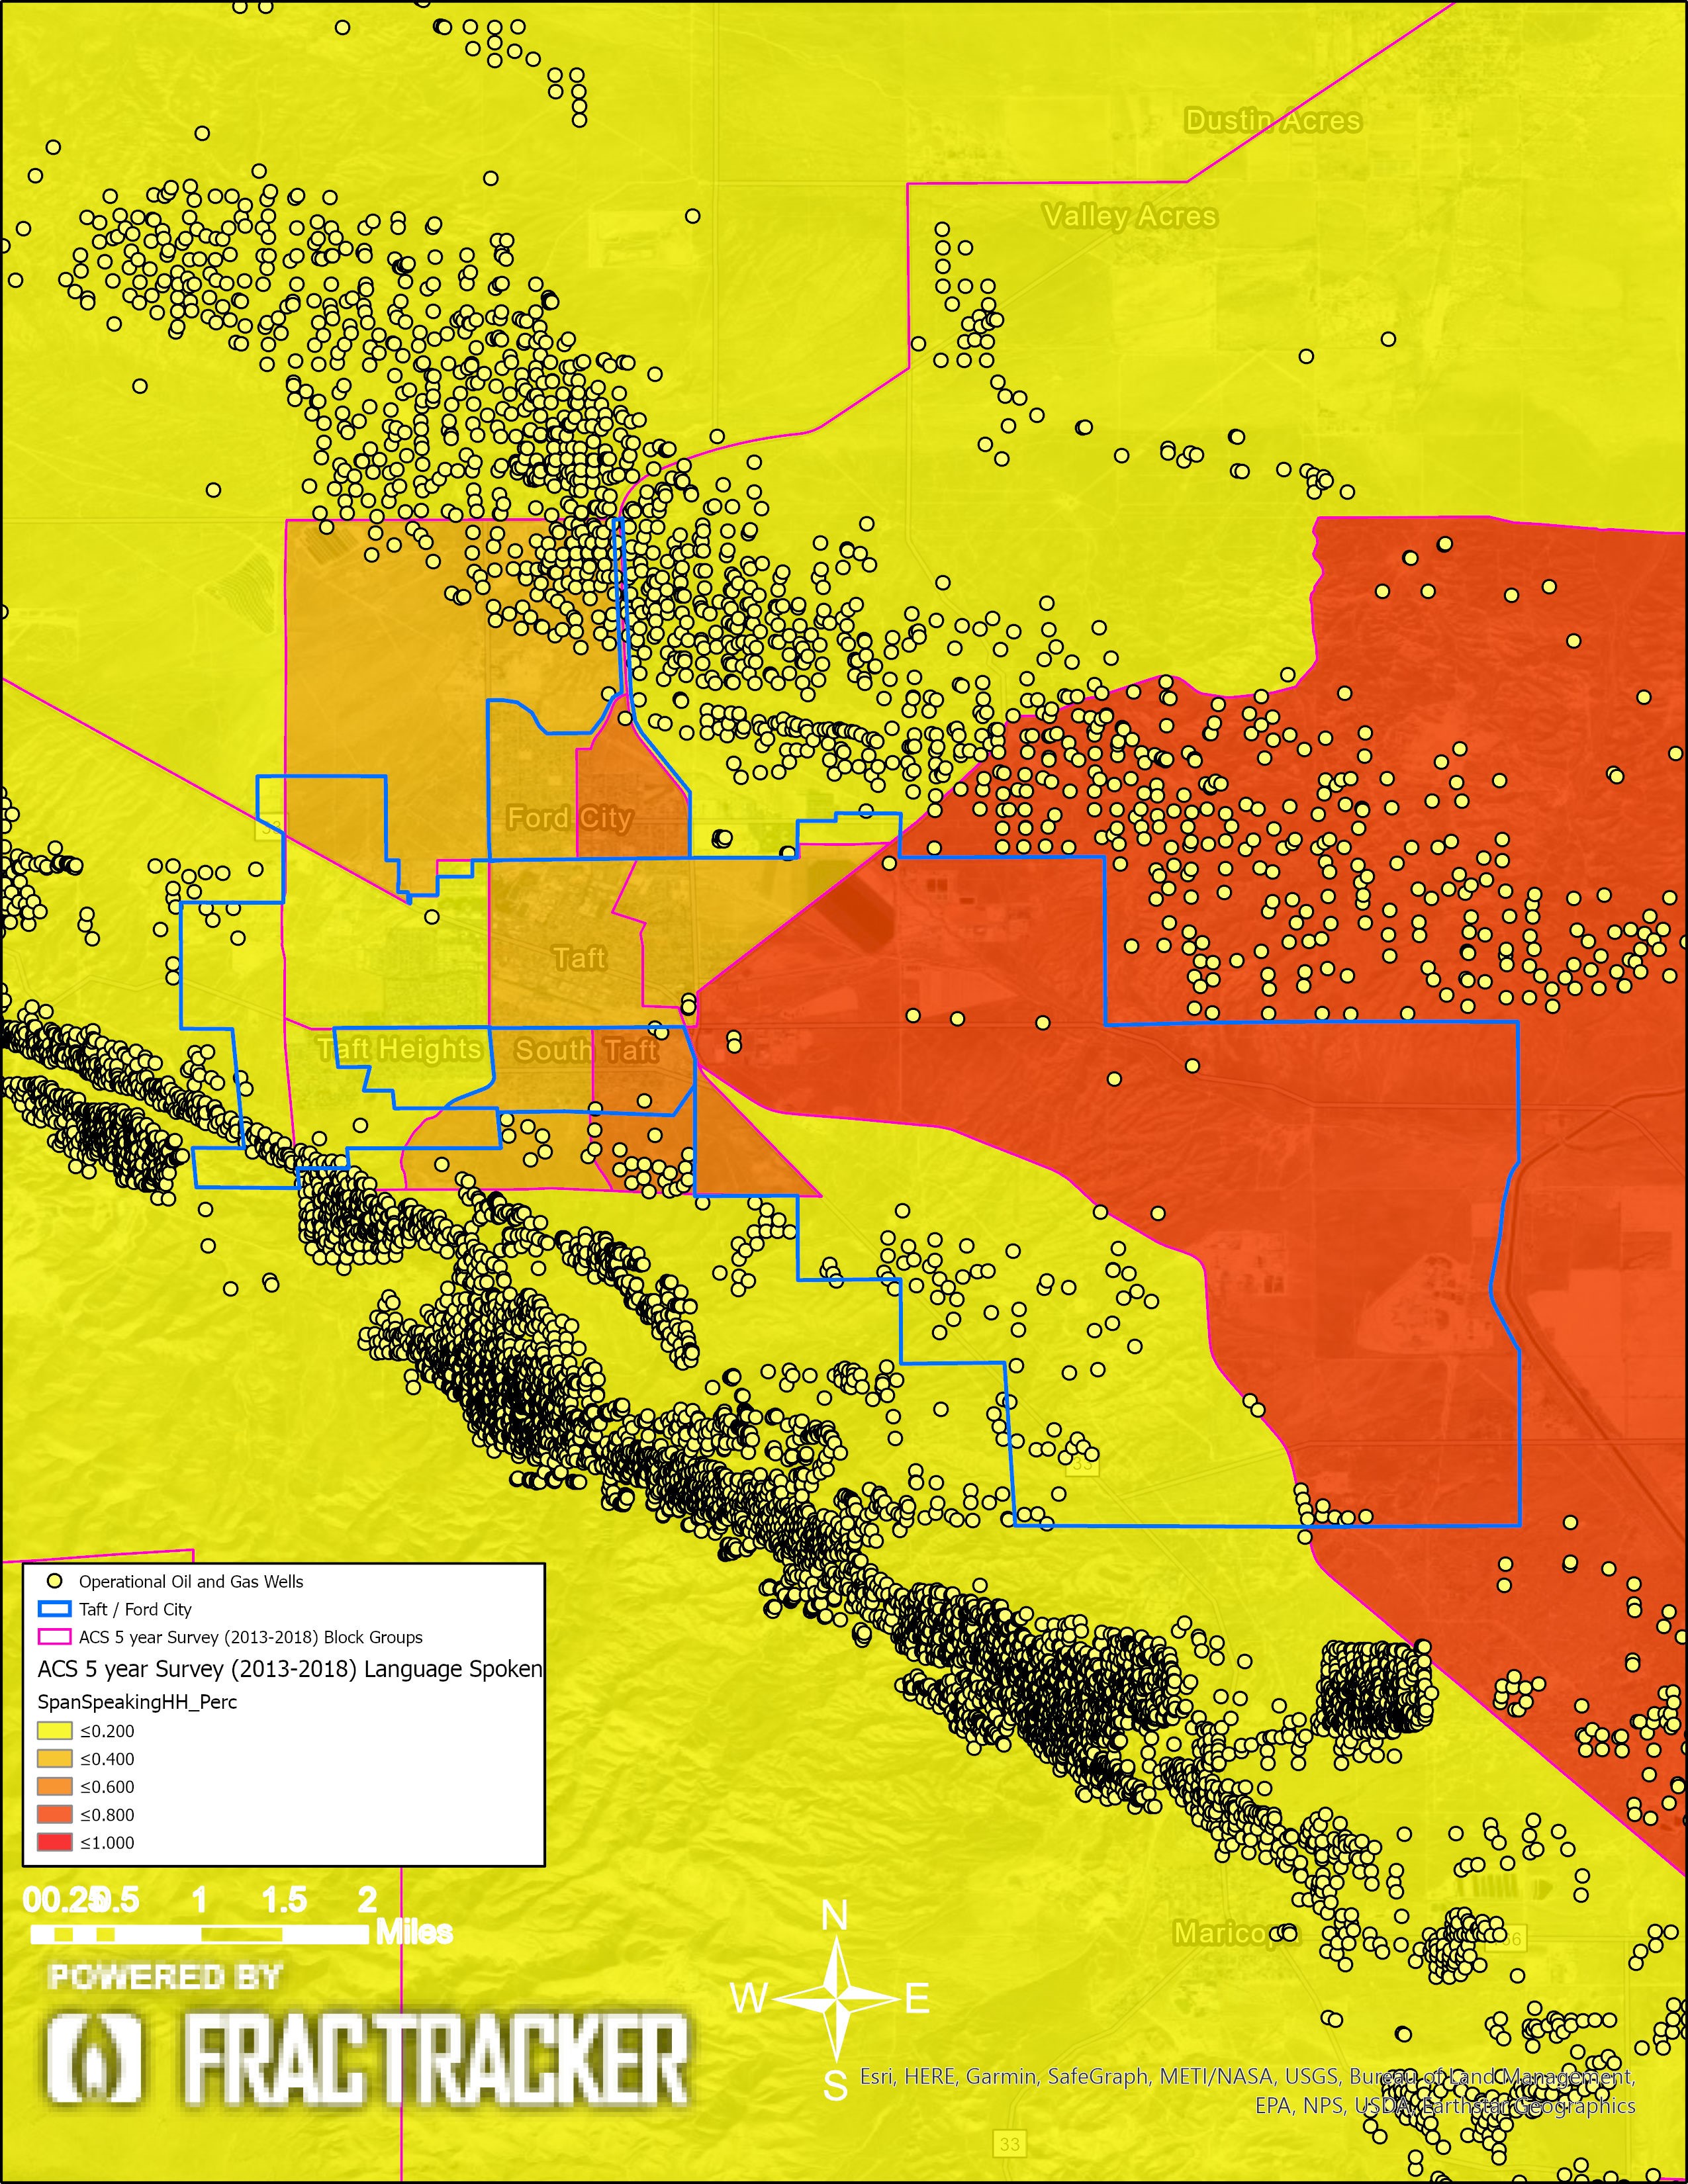
Figure 18. Taft Spanish-speaking households: This map shows the percentage of the households that speak Spanish as their primary language. In these maps, the ACS data is summarized in percentages of one, where, for example, light orange (<.400) refers to areas where 20% – 40% of the households are Spanish speaking.
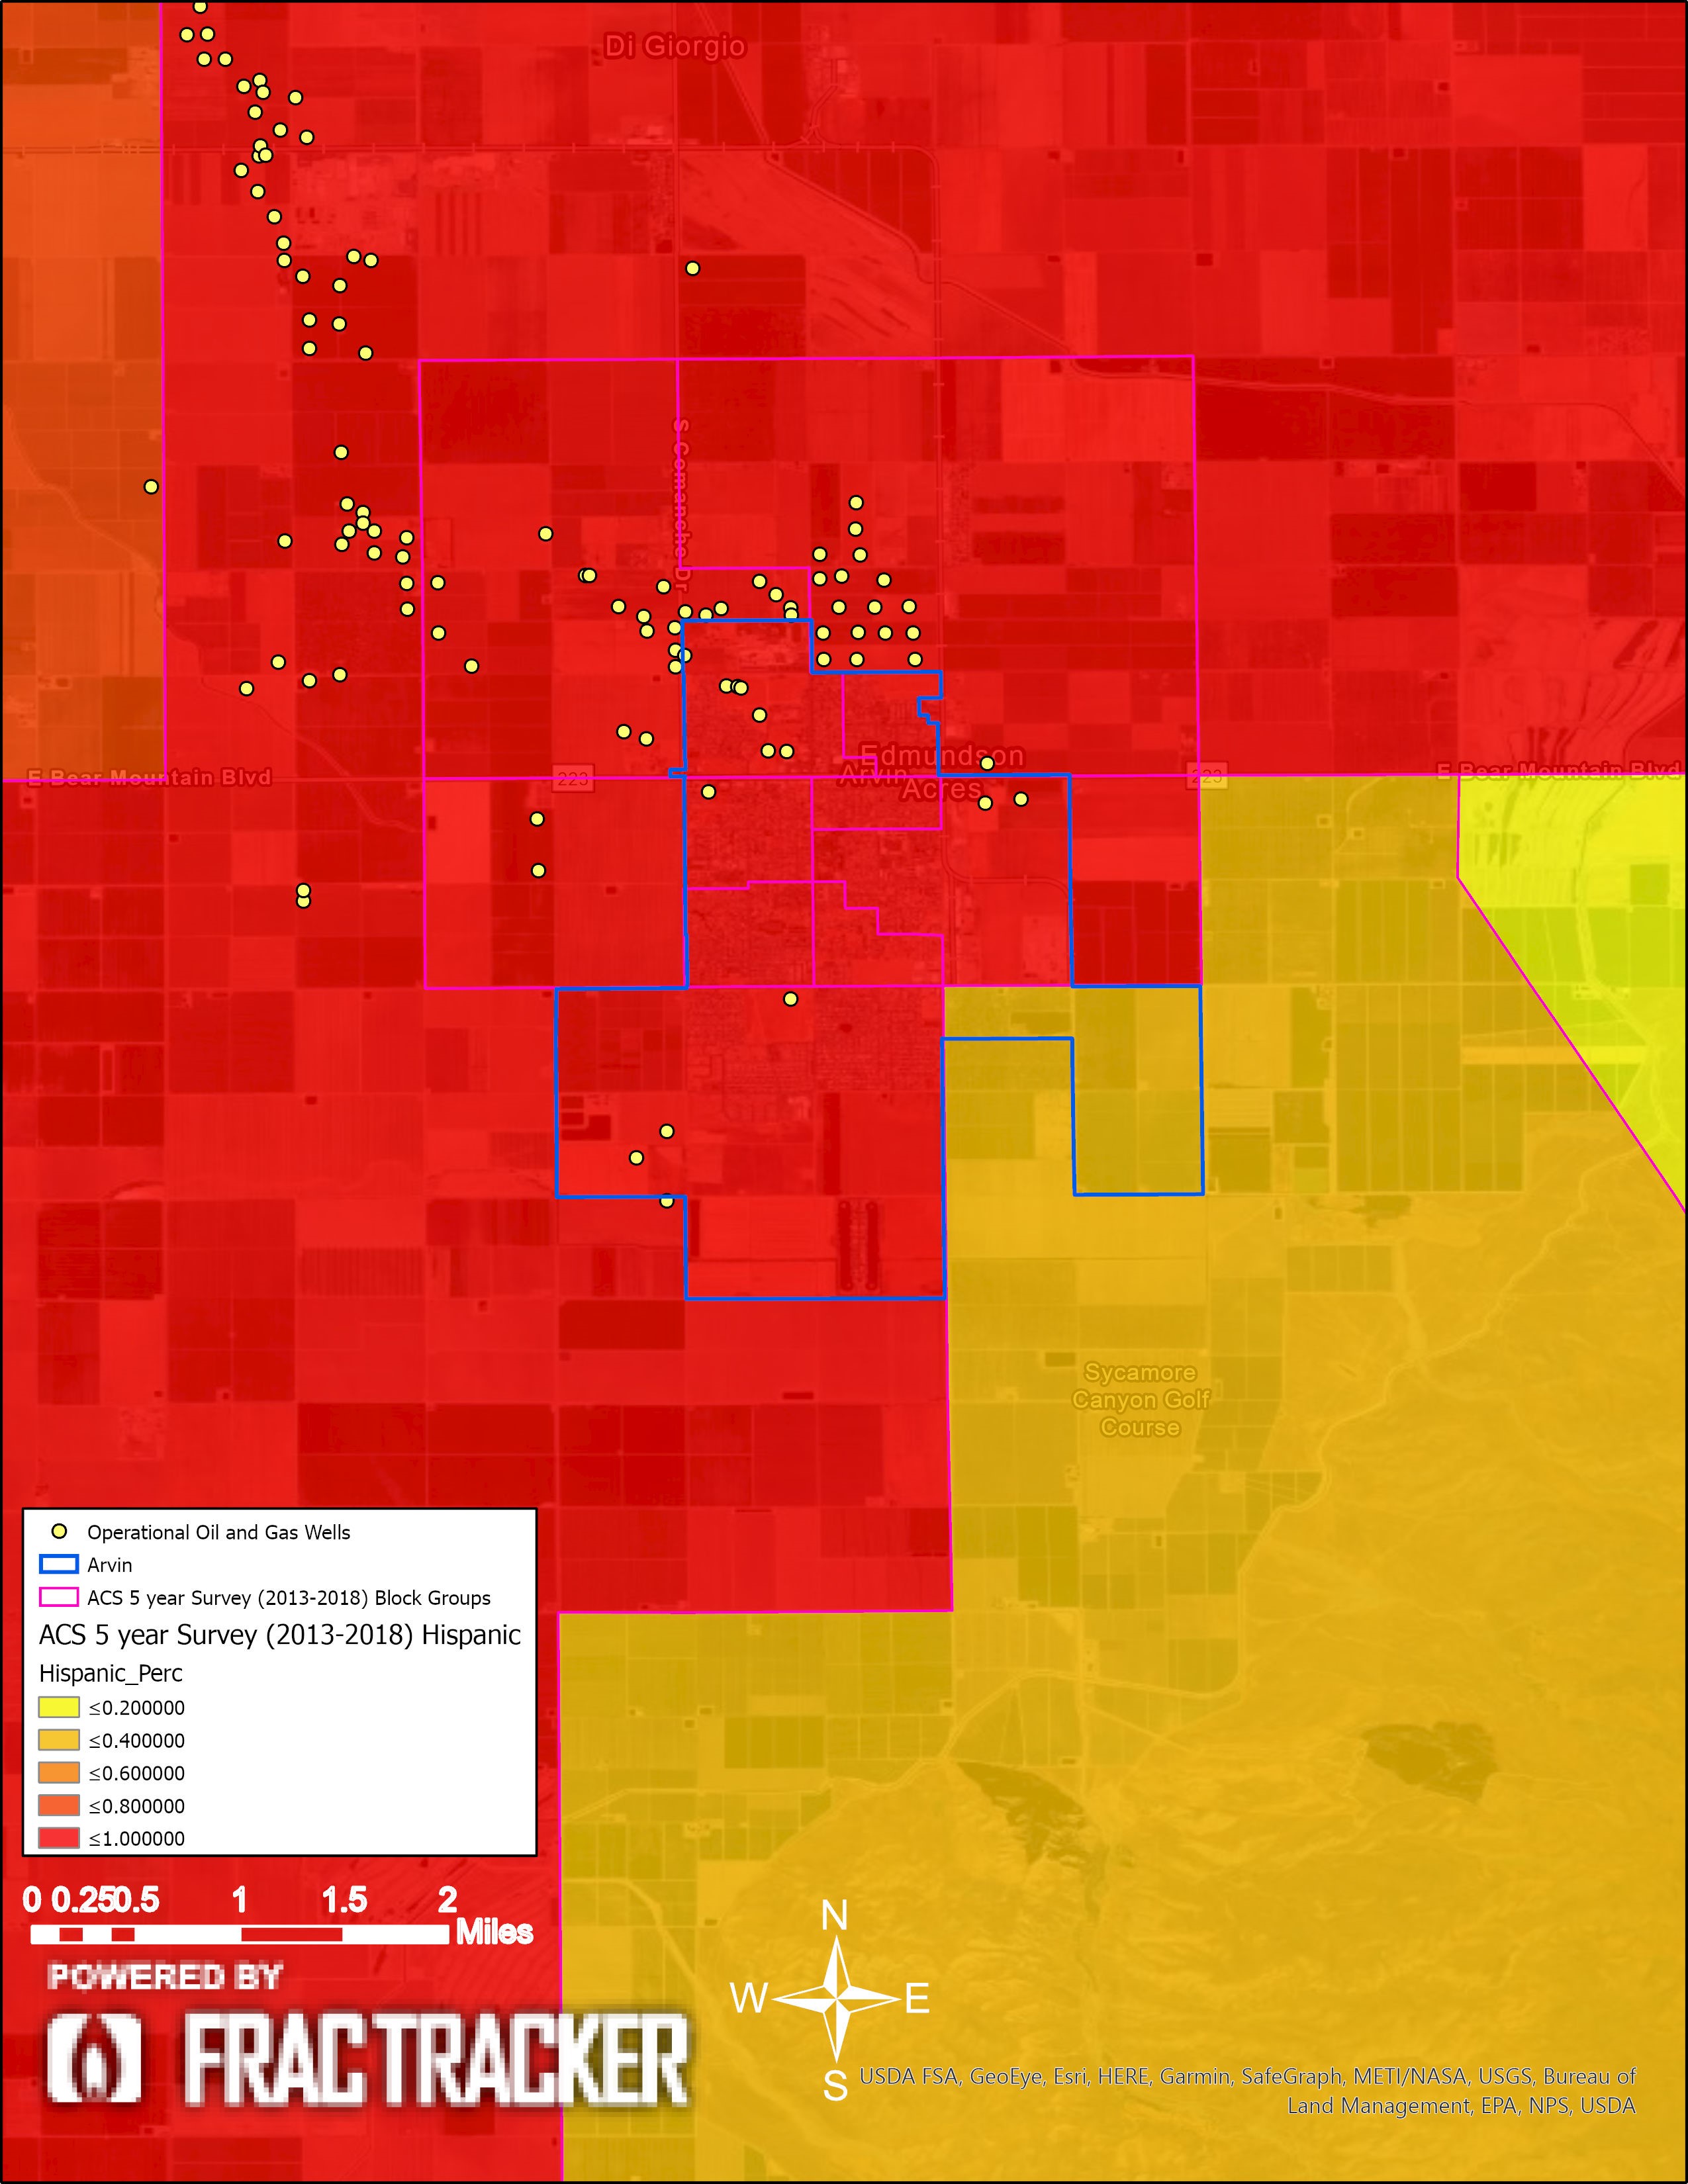
Figure 19. Arvin Hispanic population demographics: This map shows the Hispanic percentage of the population. In these maps, the ACS data is summarized in percentages of one, where, for example, light orange (<.400) refers to areas where 20% – 40% of the populations is Hispanic.
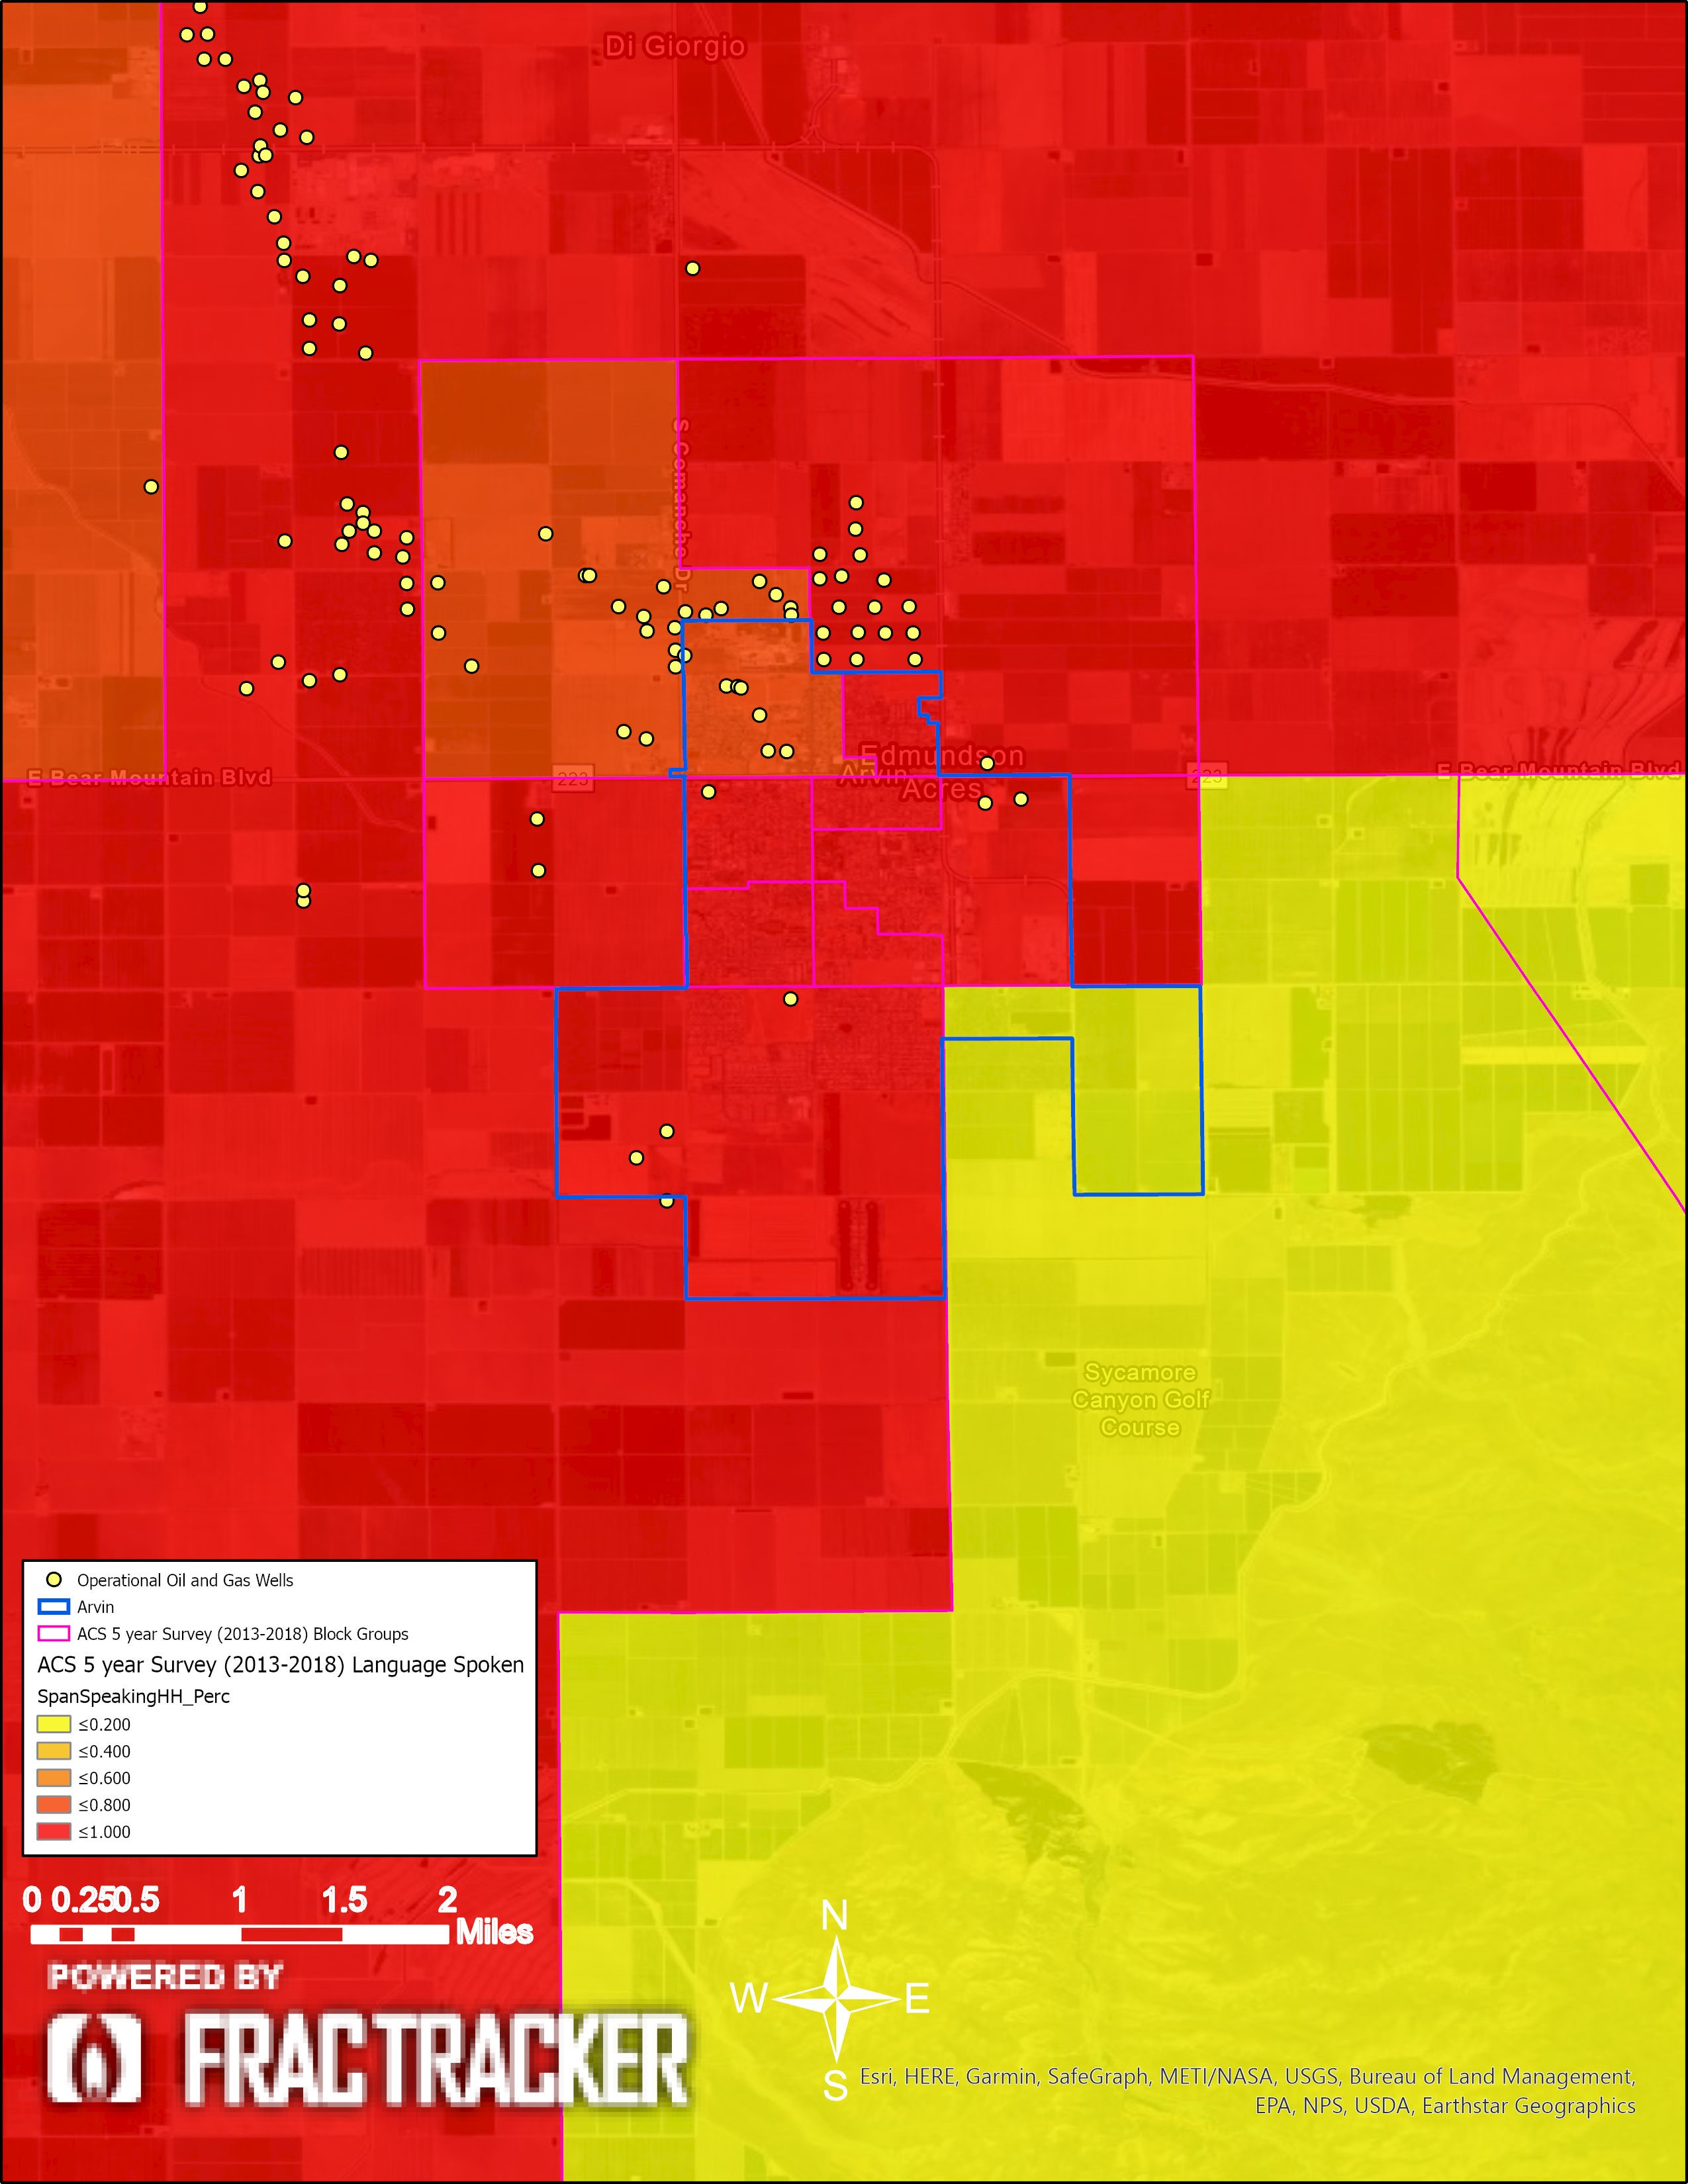
Figure 20. Arvin Spanish-speaking households: This map shows the percentage of the households that speak Spanish as their primary language. In these maps, the ACS data is summarized in percentages of one, where, for example, light orange (<.400) refers to areas where 20% – 40% of the households are Spanish speaking.
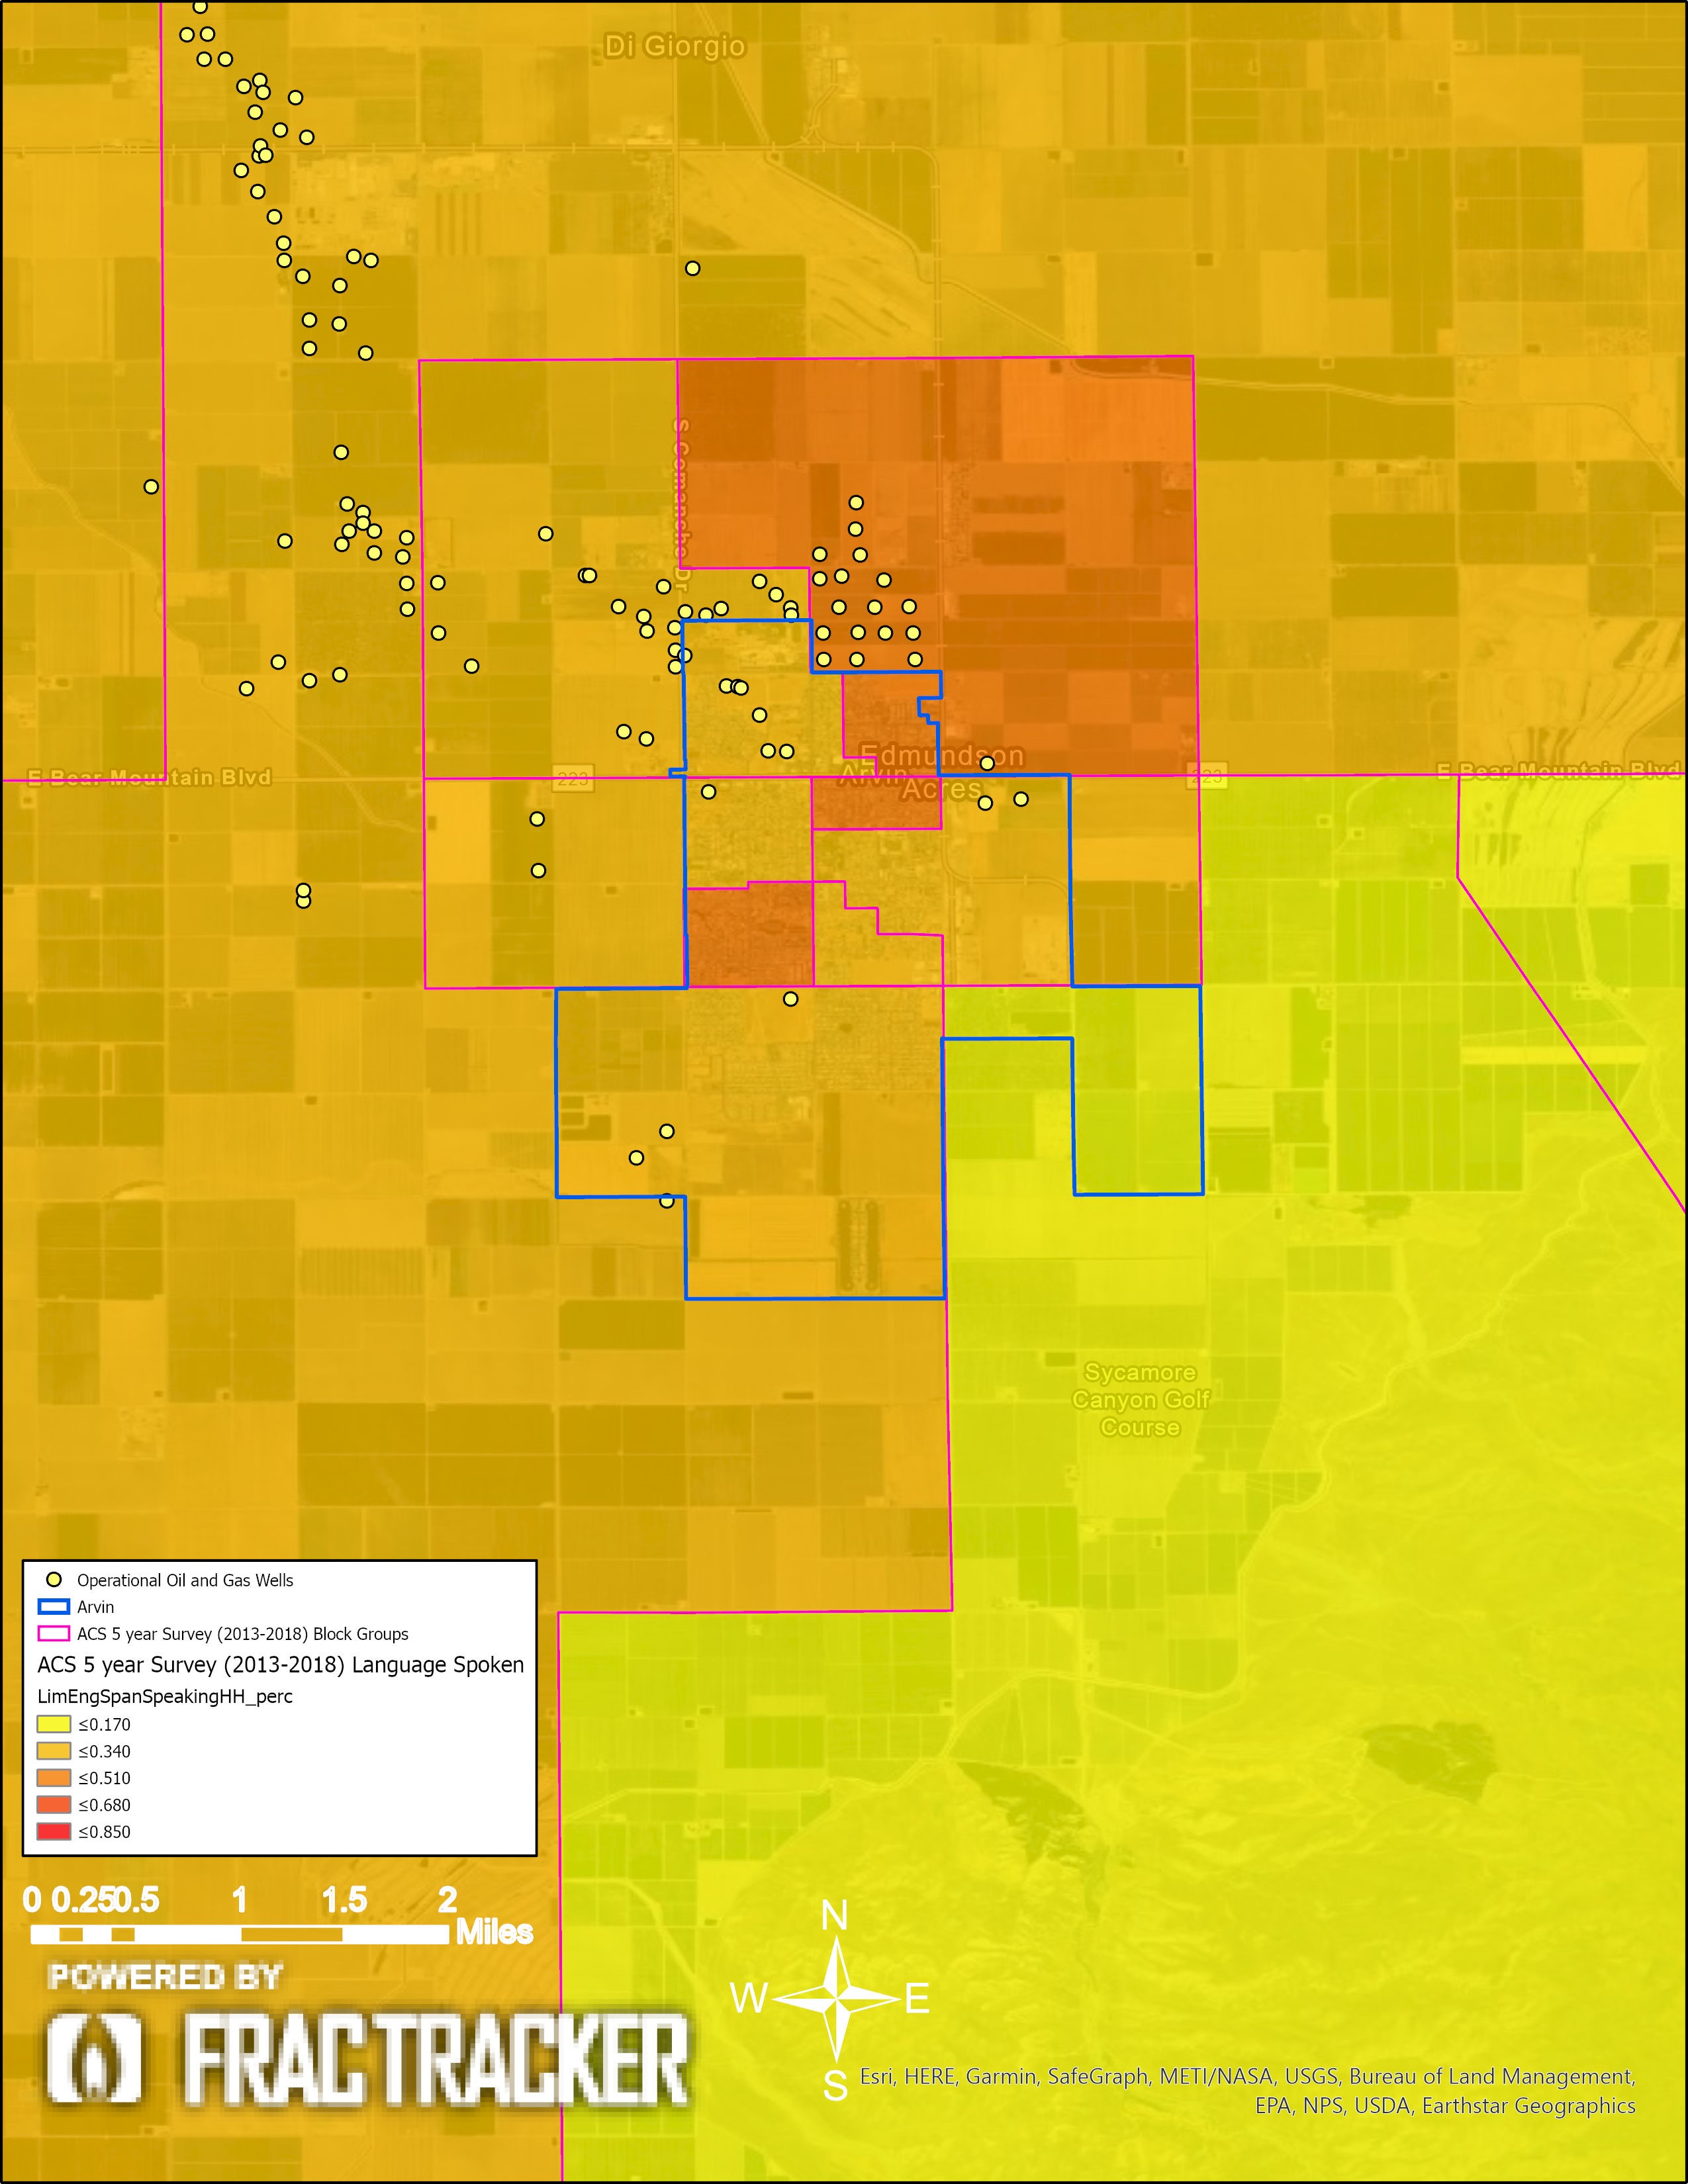
Figure 21. Arvin Limited English Spanish-speaking households: This map shows the percentage of the households that speak Spanish as their primary language, with limited English-speaking proficiency. In these maps, the ACS data is summarized in percentages of one, where, for example, light orange (<.400) refers to areas where 20% – 40% of the households are Spanish speaking, with limited English proficiency.
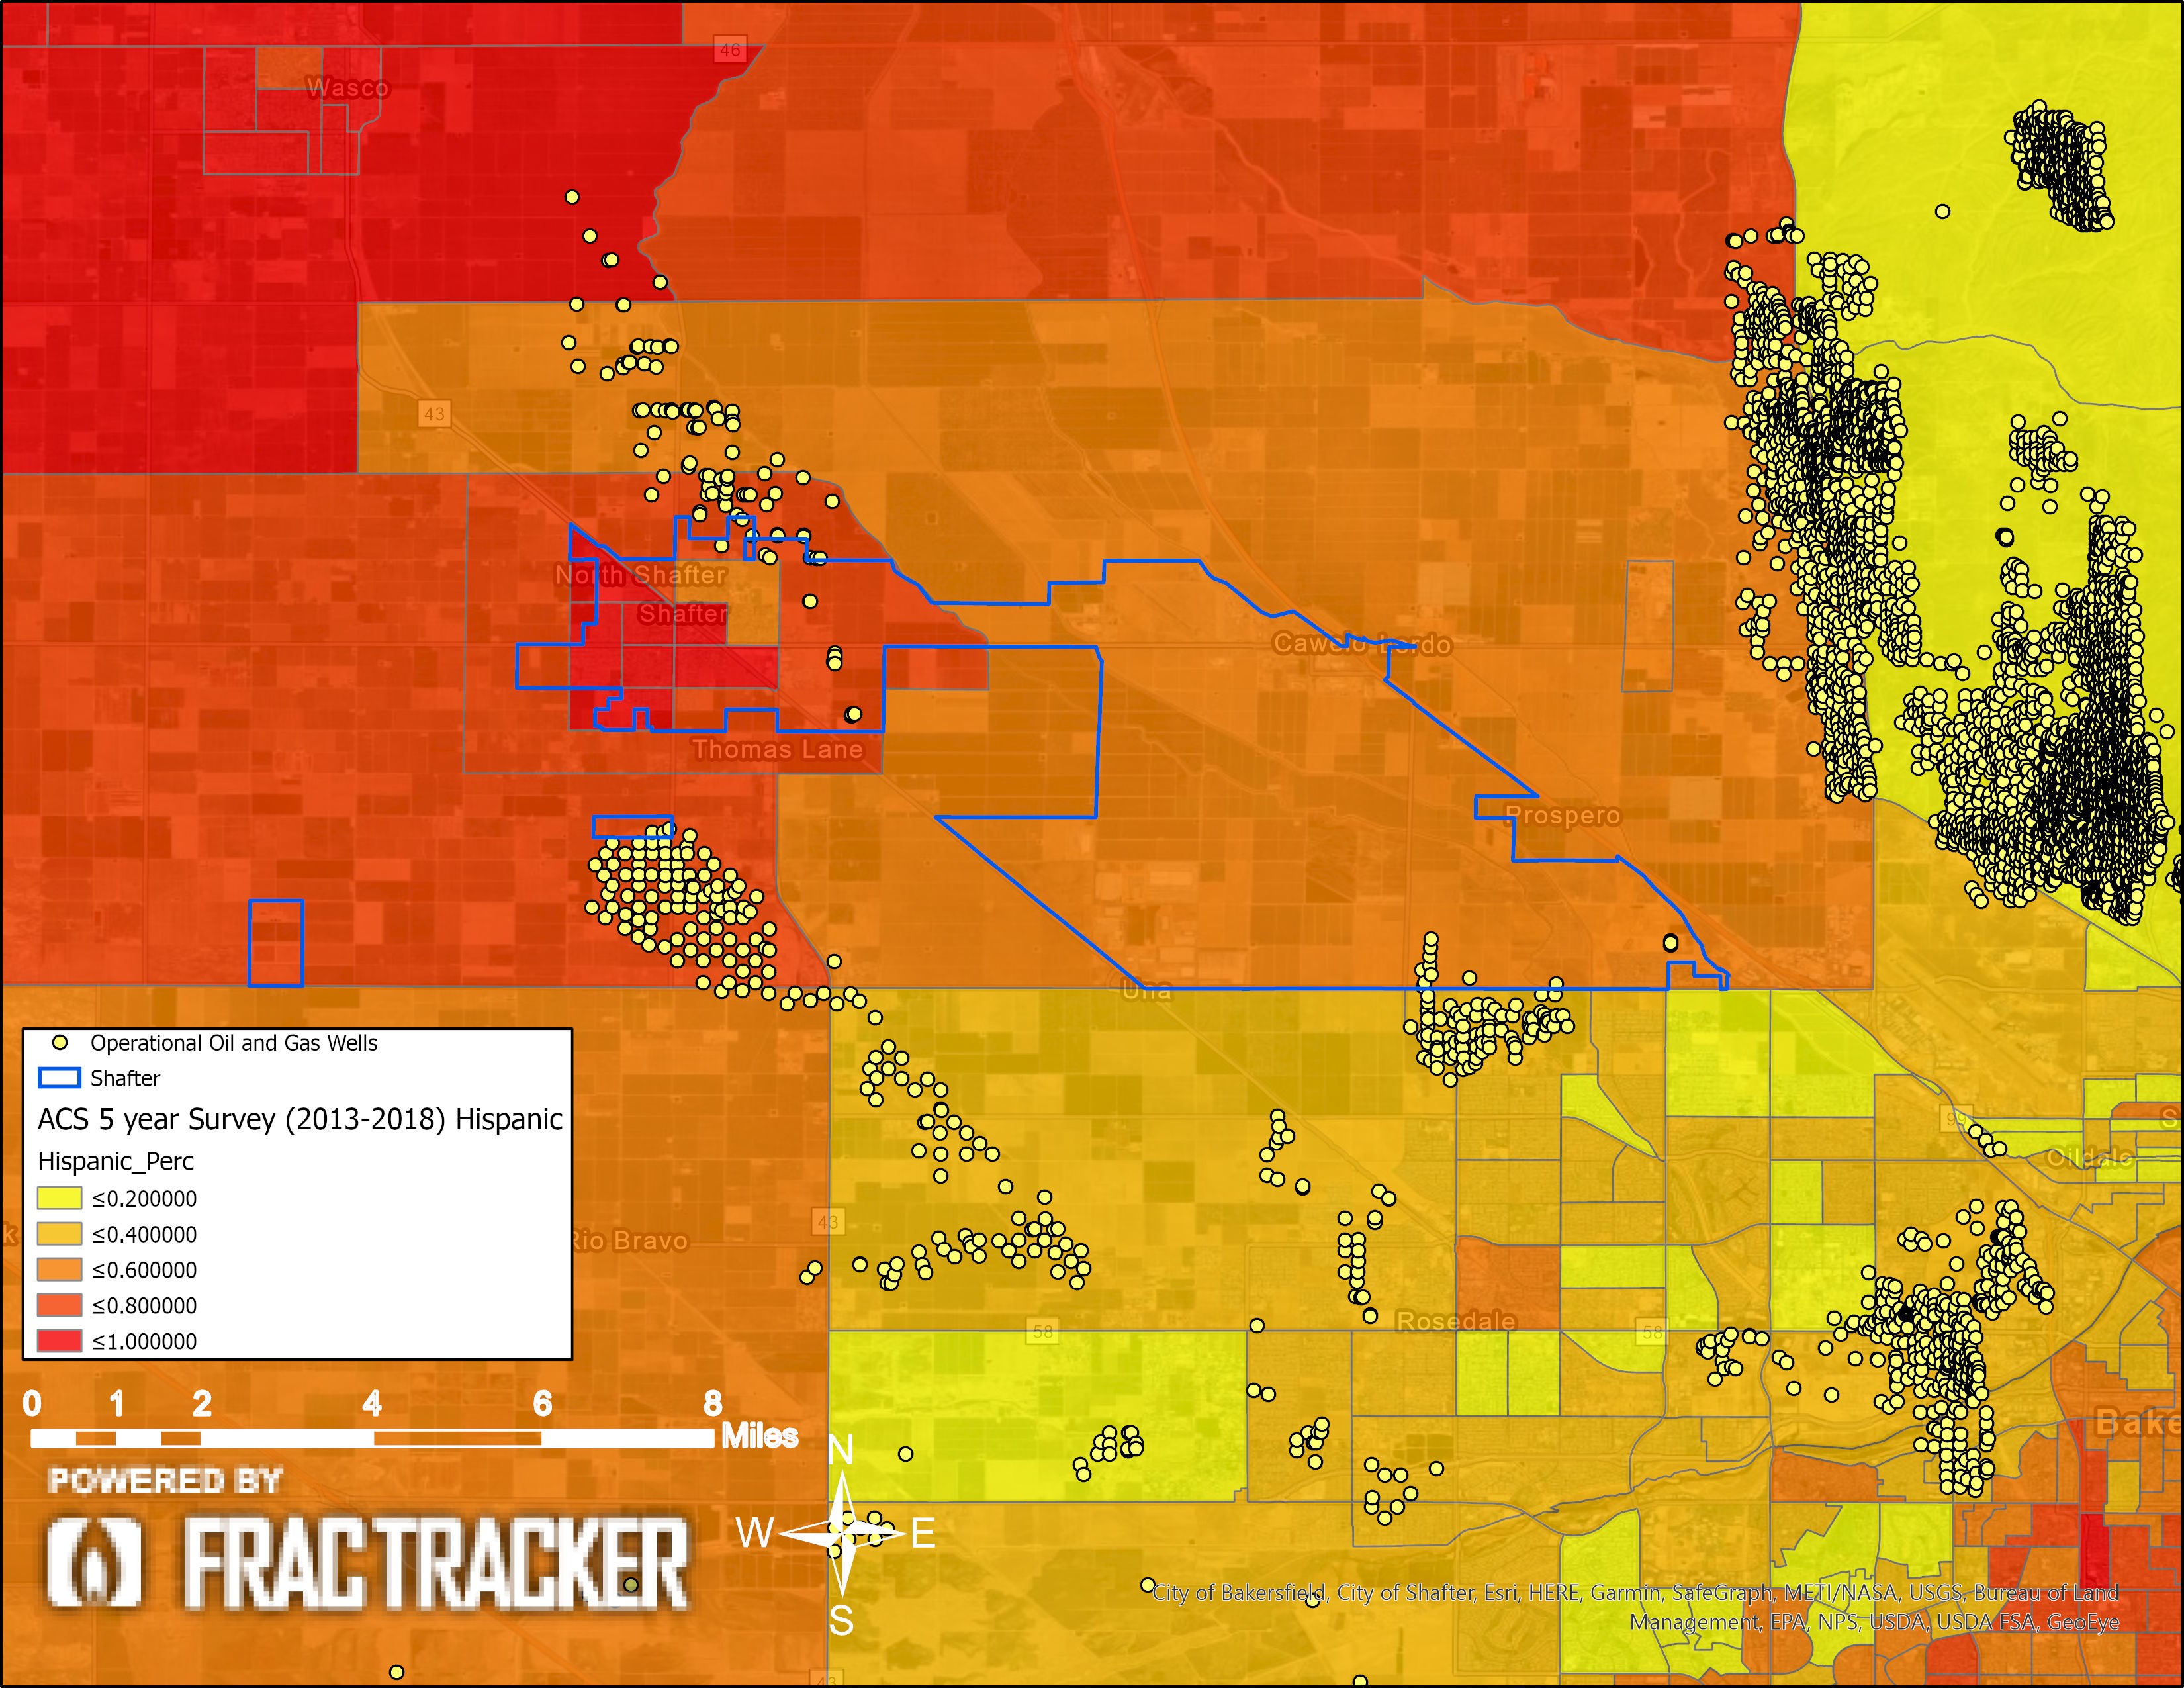
Figure 22. Shafter Hispanic population demographics: This map shows the Hispanic percentage of the population. In these maps, the ACS data is summarized in percentages of one, where, for example, light orange (<.400) refers to areas where 20% – 40% of the populations is Hispanic.
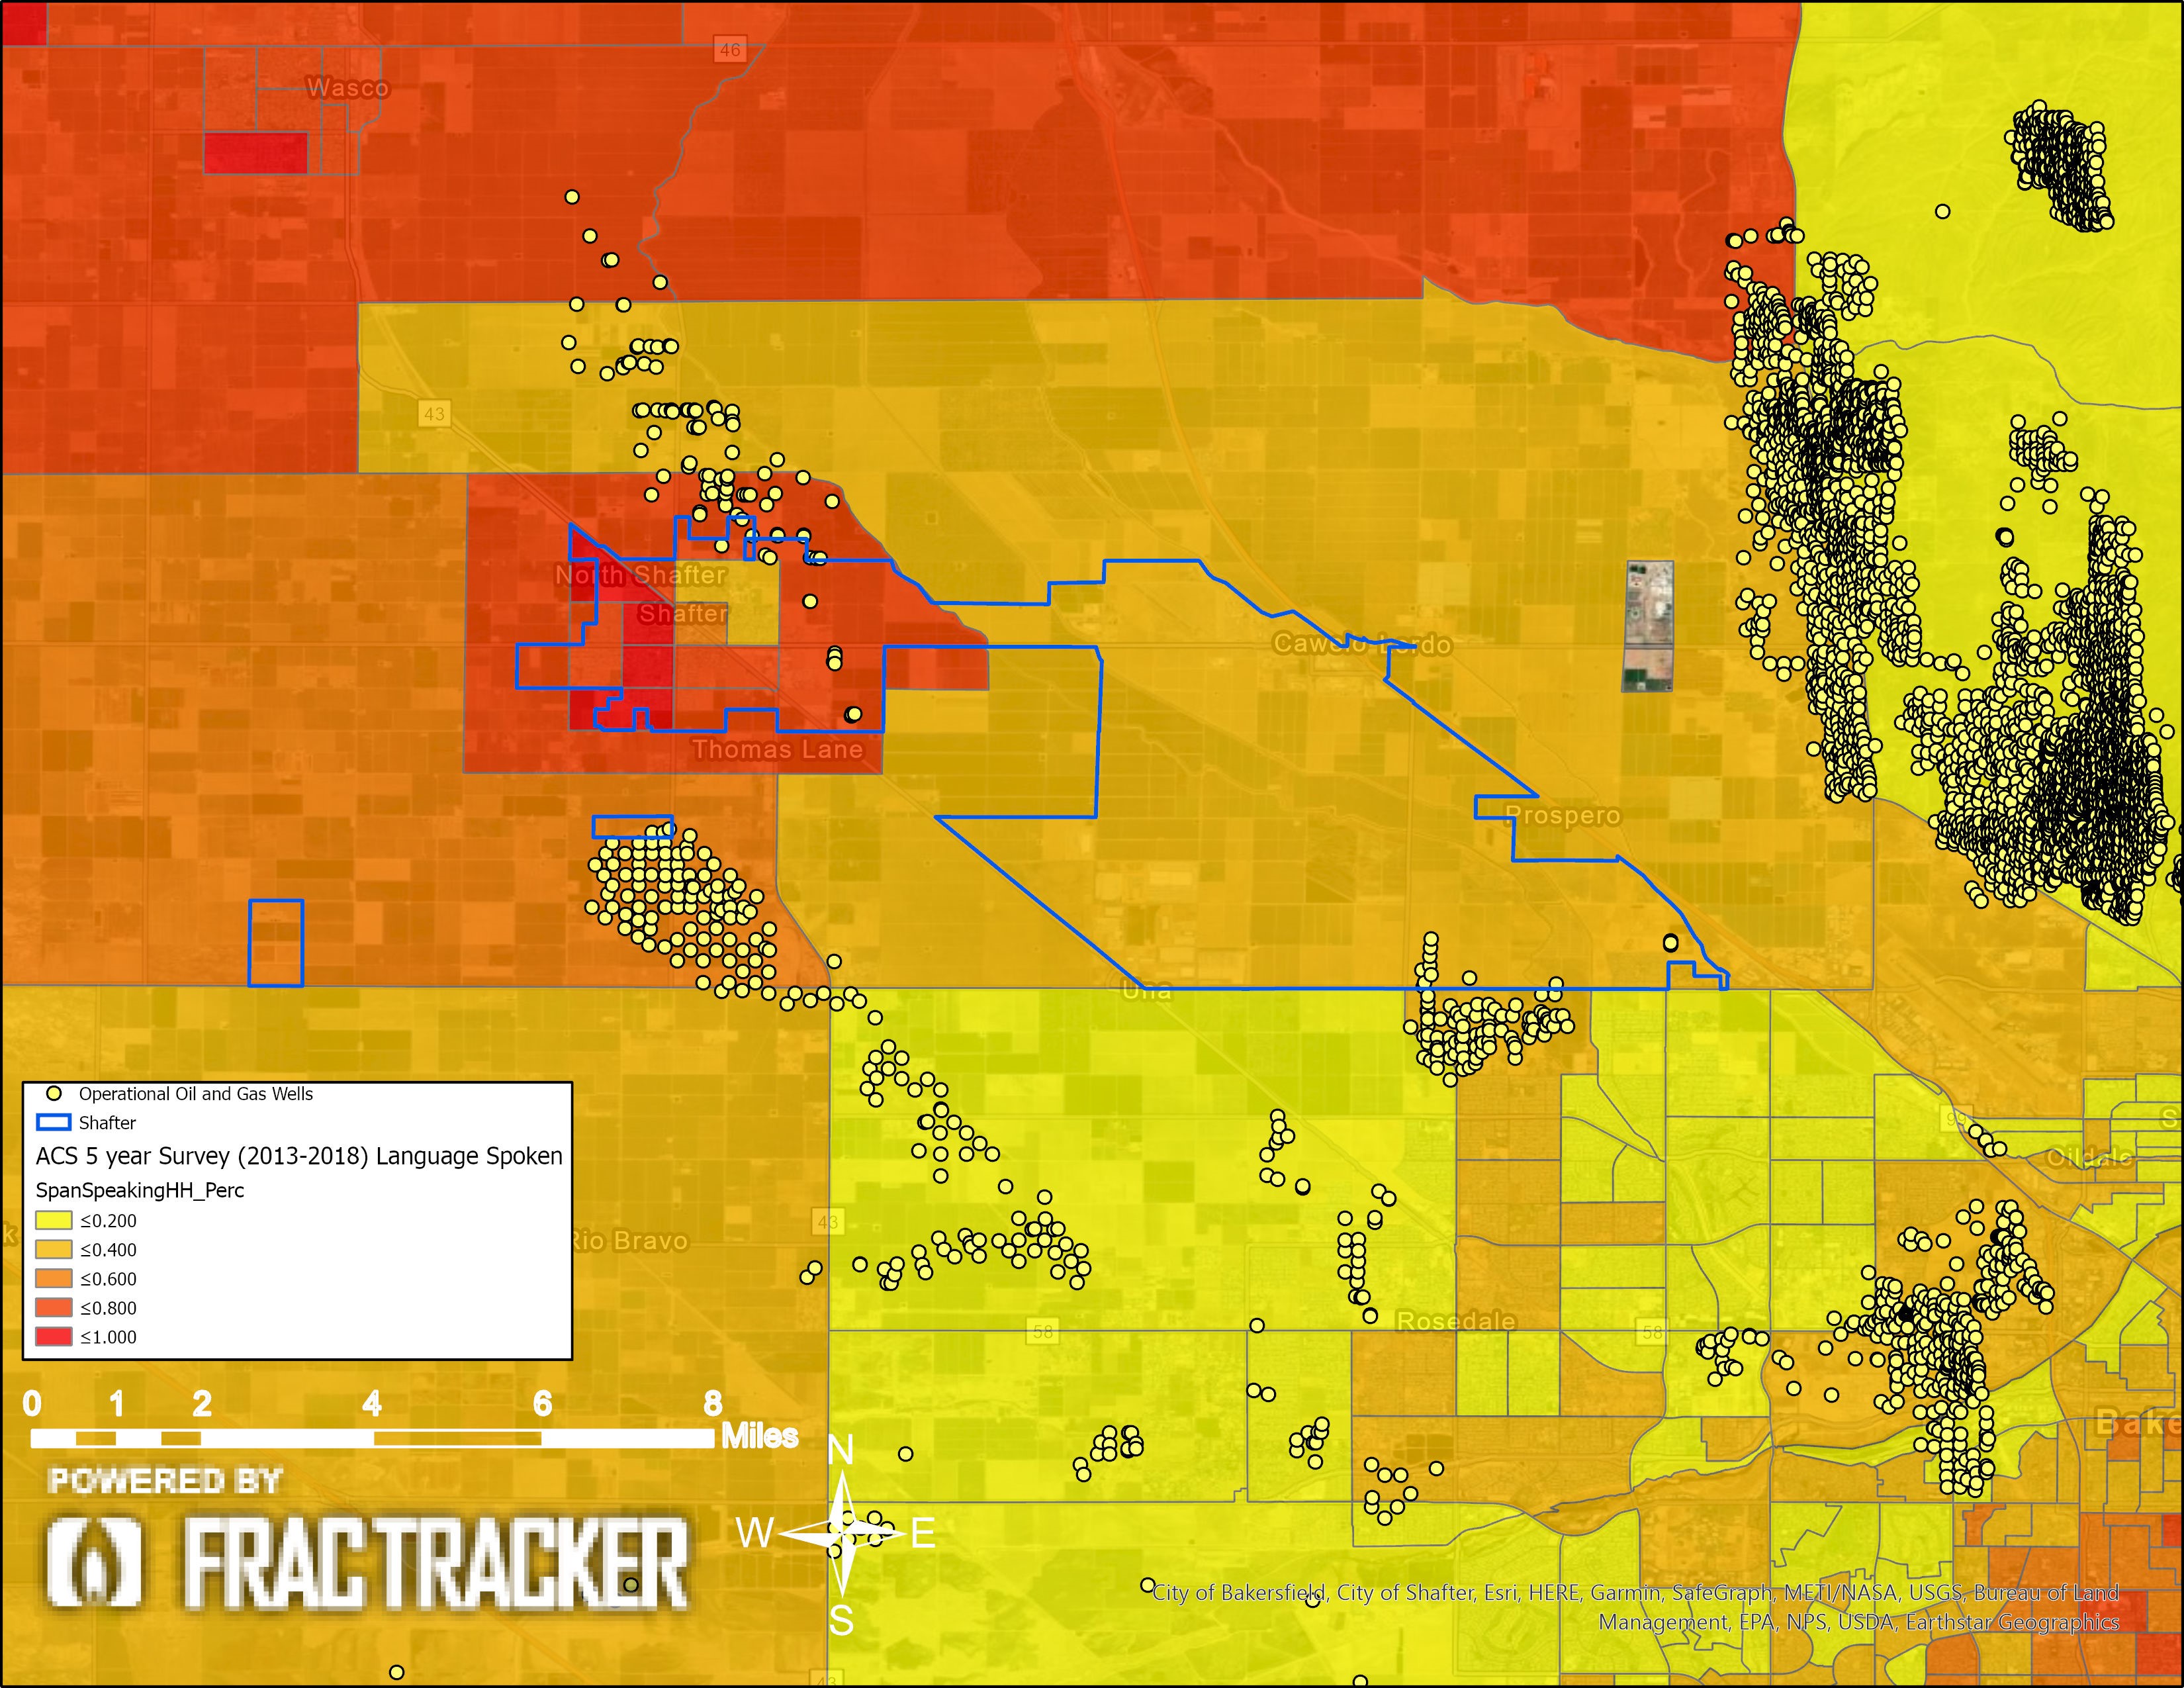
Figure 23. Shafter Spanish-speaking households: This map shows the percentage of the households that speak Spanish as their primary language. In these maps, the ACS data is summarized in percentages of one, where, for example, light orange (<.400) refers to areas where 20% – 40% of the households are Spanish speaking.
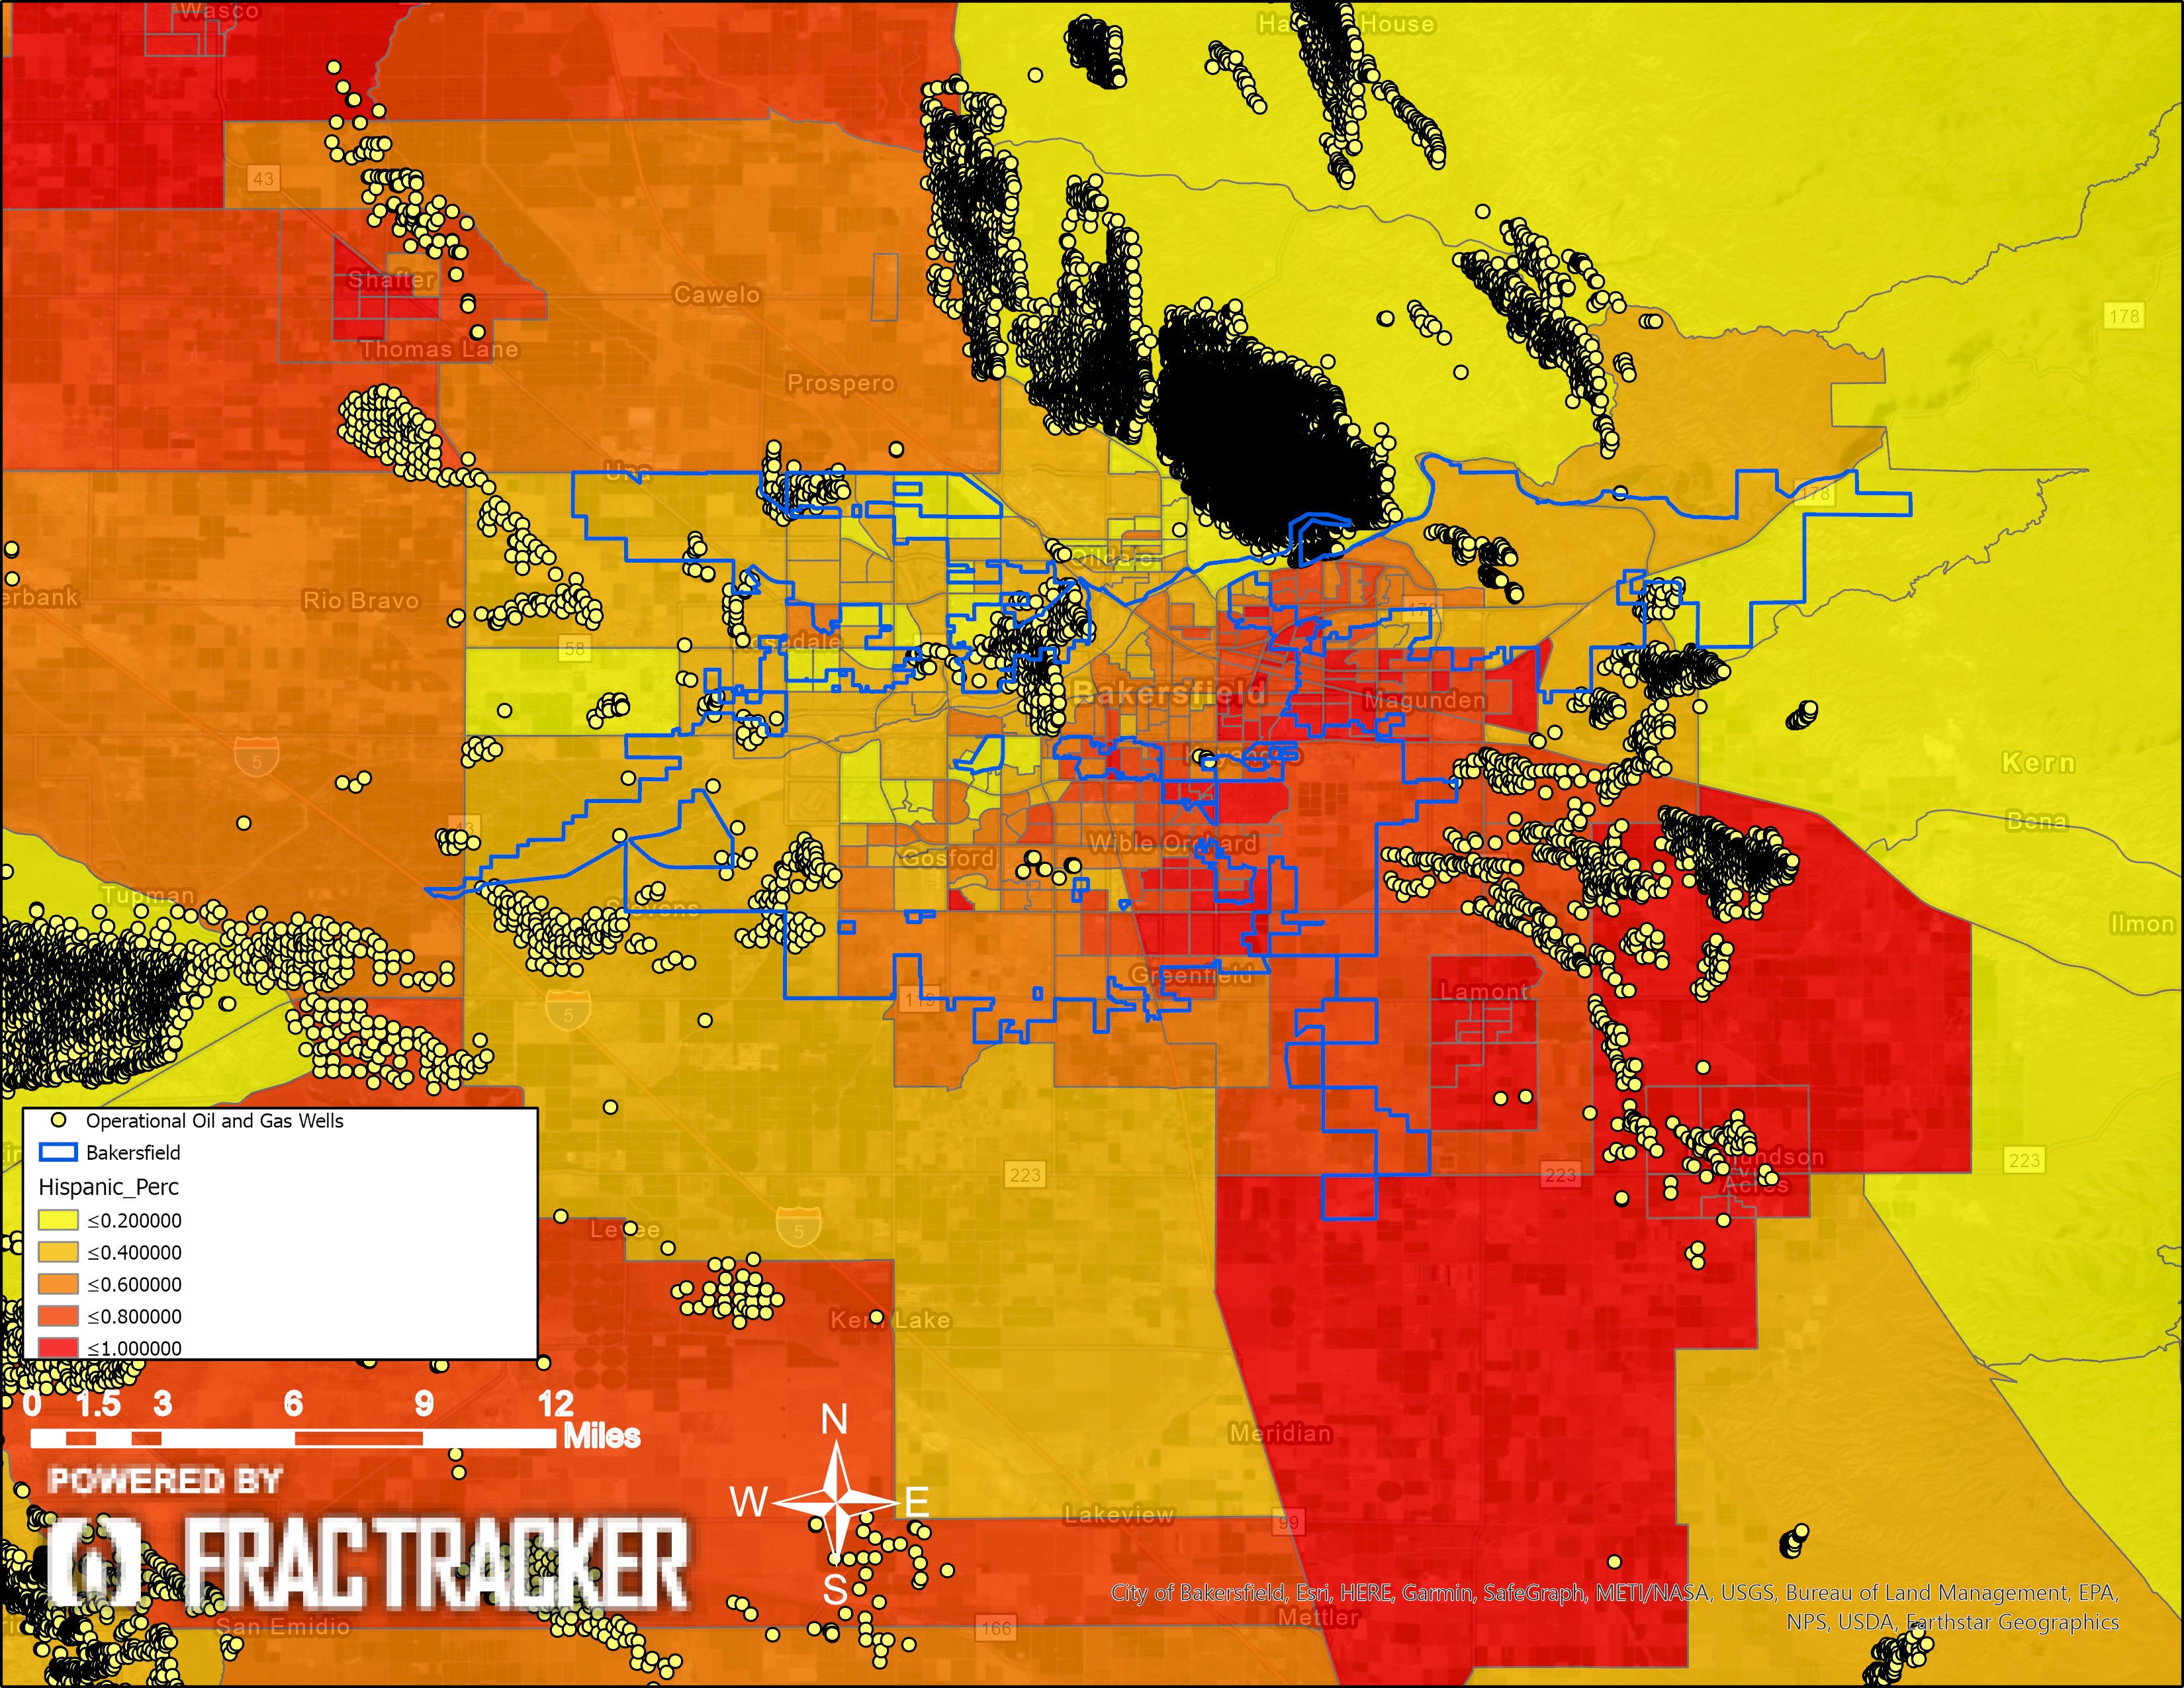
Figure 24. Bakersfield Hispanic population demographics: This map shows the Hispanic percentage of the population. In these maps, the ACS data is summarized in percentages of one, where, for example, light orange (<.400) refers to areas where 20% – 40% of the populations is Hispanic.
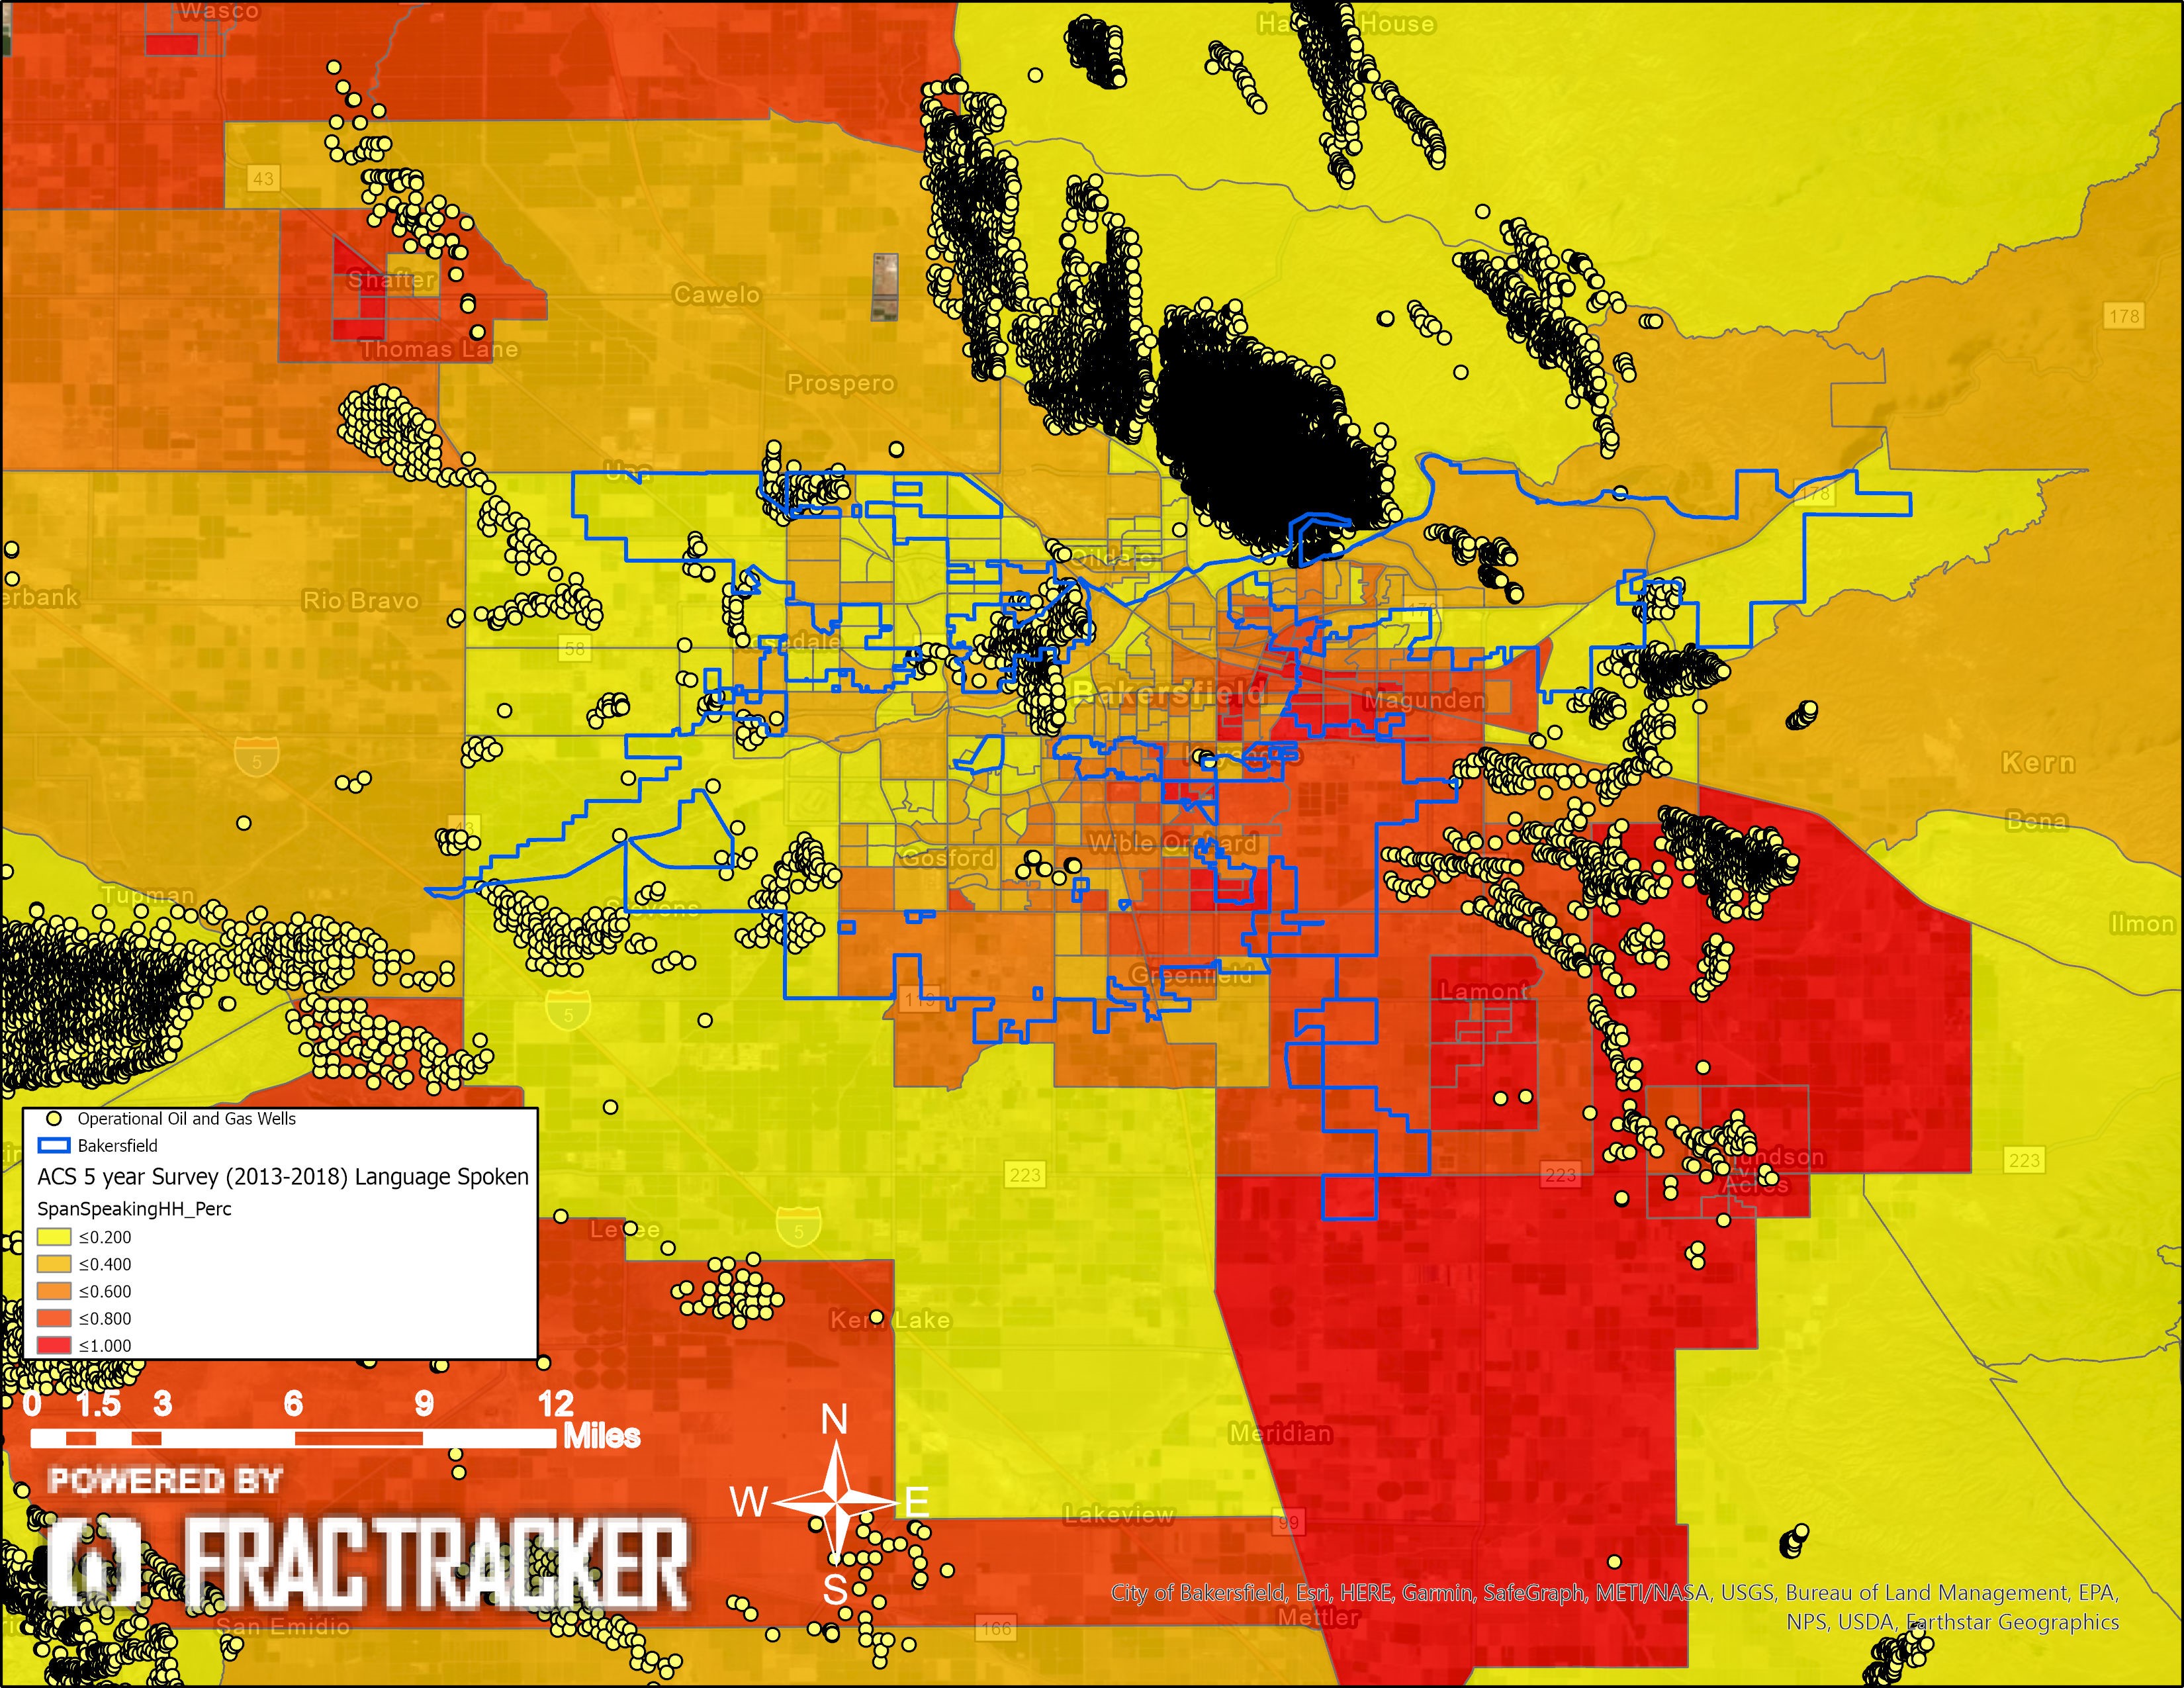
Figure 25. Bakersfield Spanish-speaking households: This map shows the percentage of the households that speak Spanish as their primary language. In these maps, the ACS data is summarized in percentages of one, where, for example, light orange (<.400) refers to areas where 20% – 40% of the households are Spanish speaking.
Conclusions
These maps make it visually clear that the Frontline Communities near oil and gas extraction in Kern County are largely disenfranchised from the democratic process, a direct result of California’s regulatory agencies refusing to provide notices and other important documents and information in Spanish. Additionally, these same communities have limited options, due to economic disparities that make Kern County’s Frontline Communities the poorest in the state of CA. These two factors leveraged against communities prevent them from obtaining self-governance or autonomy over the industrialization occurring in and around their neighborhoods. Furthermore, the demarcations of census boundaries splitting the incorporated and unincorporated cities are essentially gerrymandered to disguise the blatant environmental inequities that exist in Kern County, in direct violation of the California Environmental Quality Act. Kern County must consider these injustices in the development of new environmental impact review requirements for oil and gas operators.
By Kyle Ferrar, Western Program Coordinator, FracTracker Alliance
Addendum
This report was revised on 12/13/20
The following addendum incorporates additional demographics data that more thoroughly describes Frontline Communities in Kern County. We focus on the Frontline Communities closest to intense oil extraction operations. This analysis prioritizes areas with substantial population density. Remote sensing (satellite imagery) data and direct knowledge of Kern County cities was used to define the sample areas for this analysis. These techniques and methods avoid the type of spatial bias that distorted the results of the environmental justice (EJ) analysis in the 2020 Kern County draft EIR (chapter 7 PDF pp.1292-1305).
2020 Kern County Draft EIR
The EJ analysis included in the 2020 Kern County Draft EIR uses the spatial bias of US census designated areas to generate false conclusions. The Draft EIR can do this in two ways:
First, the Draft EIR uses census tracts in the place of smaller census designated areas. The draft EIR states the county conducted, “an analysis of Kern County census tract five-year American Community Survey (ACS) demographic and poverty data for the period was conducted … and the five-year data is the most accurate form of ACS data, has the largest sample size, and is the only ACS data that covers tiny populations.” While this is true about the five-year data, the authors chose to analyze using census tracts, which are much too large to cover small populations. It is not clear why the authors would have chosen census tracts, rather than the higher resolution ‘census block groups’ ACS dataset, as both datasets are readily available from the US Census Bureau.
Additionally, the draft EIR limits the sociodemographic analysis to only census tracts that contain PLSS QTR/QTRS’s ranked as Tier 1, so that it does not include neighboring communities in different census tracts in the demographical analysis. As discussed in the draft EIR, Tier 1 areas contain four or more operational wells in a tiny area. The draft EIR explicitly states that Tier 1 Qtr(s) do not contain schools or healthcare facilities. This trend is not limited to just the Qtr/Qtr sections. The census tracts containing the Tier 1 sections contain very few sensitive receptors, like schools and healthcare facilities. This is because census tracts and other census designated areas are drawn specifically to differentiate between urban and rural/industrial areas. Census tracts containing oil fields cover large rural areas, and intentionally avoid areas with any significant population density. This results in donuts and other strange shapes, where communities in much smaller census tracts (by area) are enveloped by large rural census tracts containing oil fields. As shown in the maps below, this eliminates all communities with any real population density from the draft EIR EJ analysis, even though they are the communities nearest to the oil fields.
In the maps below, census tracts are compared to census block groups, to show the difference in size and nature of their spatial distribution. In most cases, census tracts encompassing populated areas are tiny, and limited to the urban boundaries of cities. In the cases of Shafter and Arvin, the residential census tracts are encircled by a different donut-shaped census tract, actually containing most of the operational wells and oil fields. While the census tracts of the Frontline Communities are within very short distances of operational oil and gas wells and major fields at large, most communities are not included in the Kern 2020 draft EIR EJ analysis. With Lost Hills, the city of Lost Hills is within the same census tract as the Lost Hills oil field and several other extensive oil fields. The city of Lost Hills is the closest community to oil extraction operations in the census tract, and the small city contains just over 50% of the total population within this massive census tract. But because of the sheer size of the census tract, demographics of this Frontline Community are diluted by the vast rural area of northwestern Kern County, which is higher income with demographics 10% less Latino.
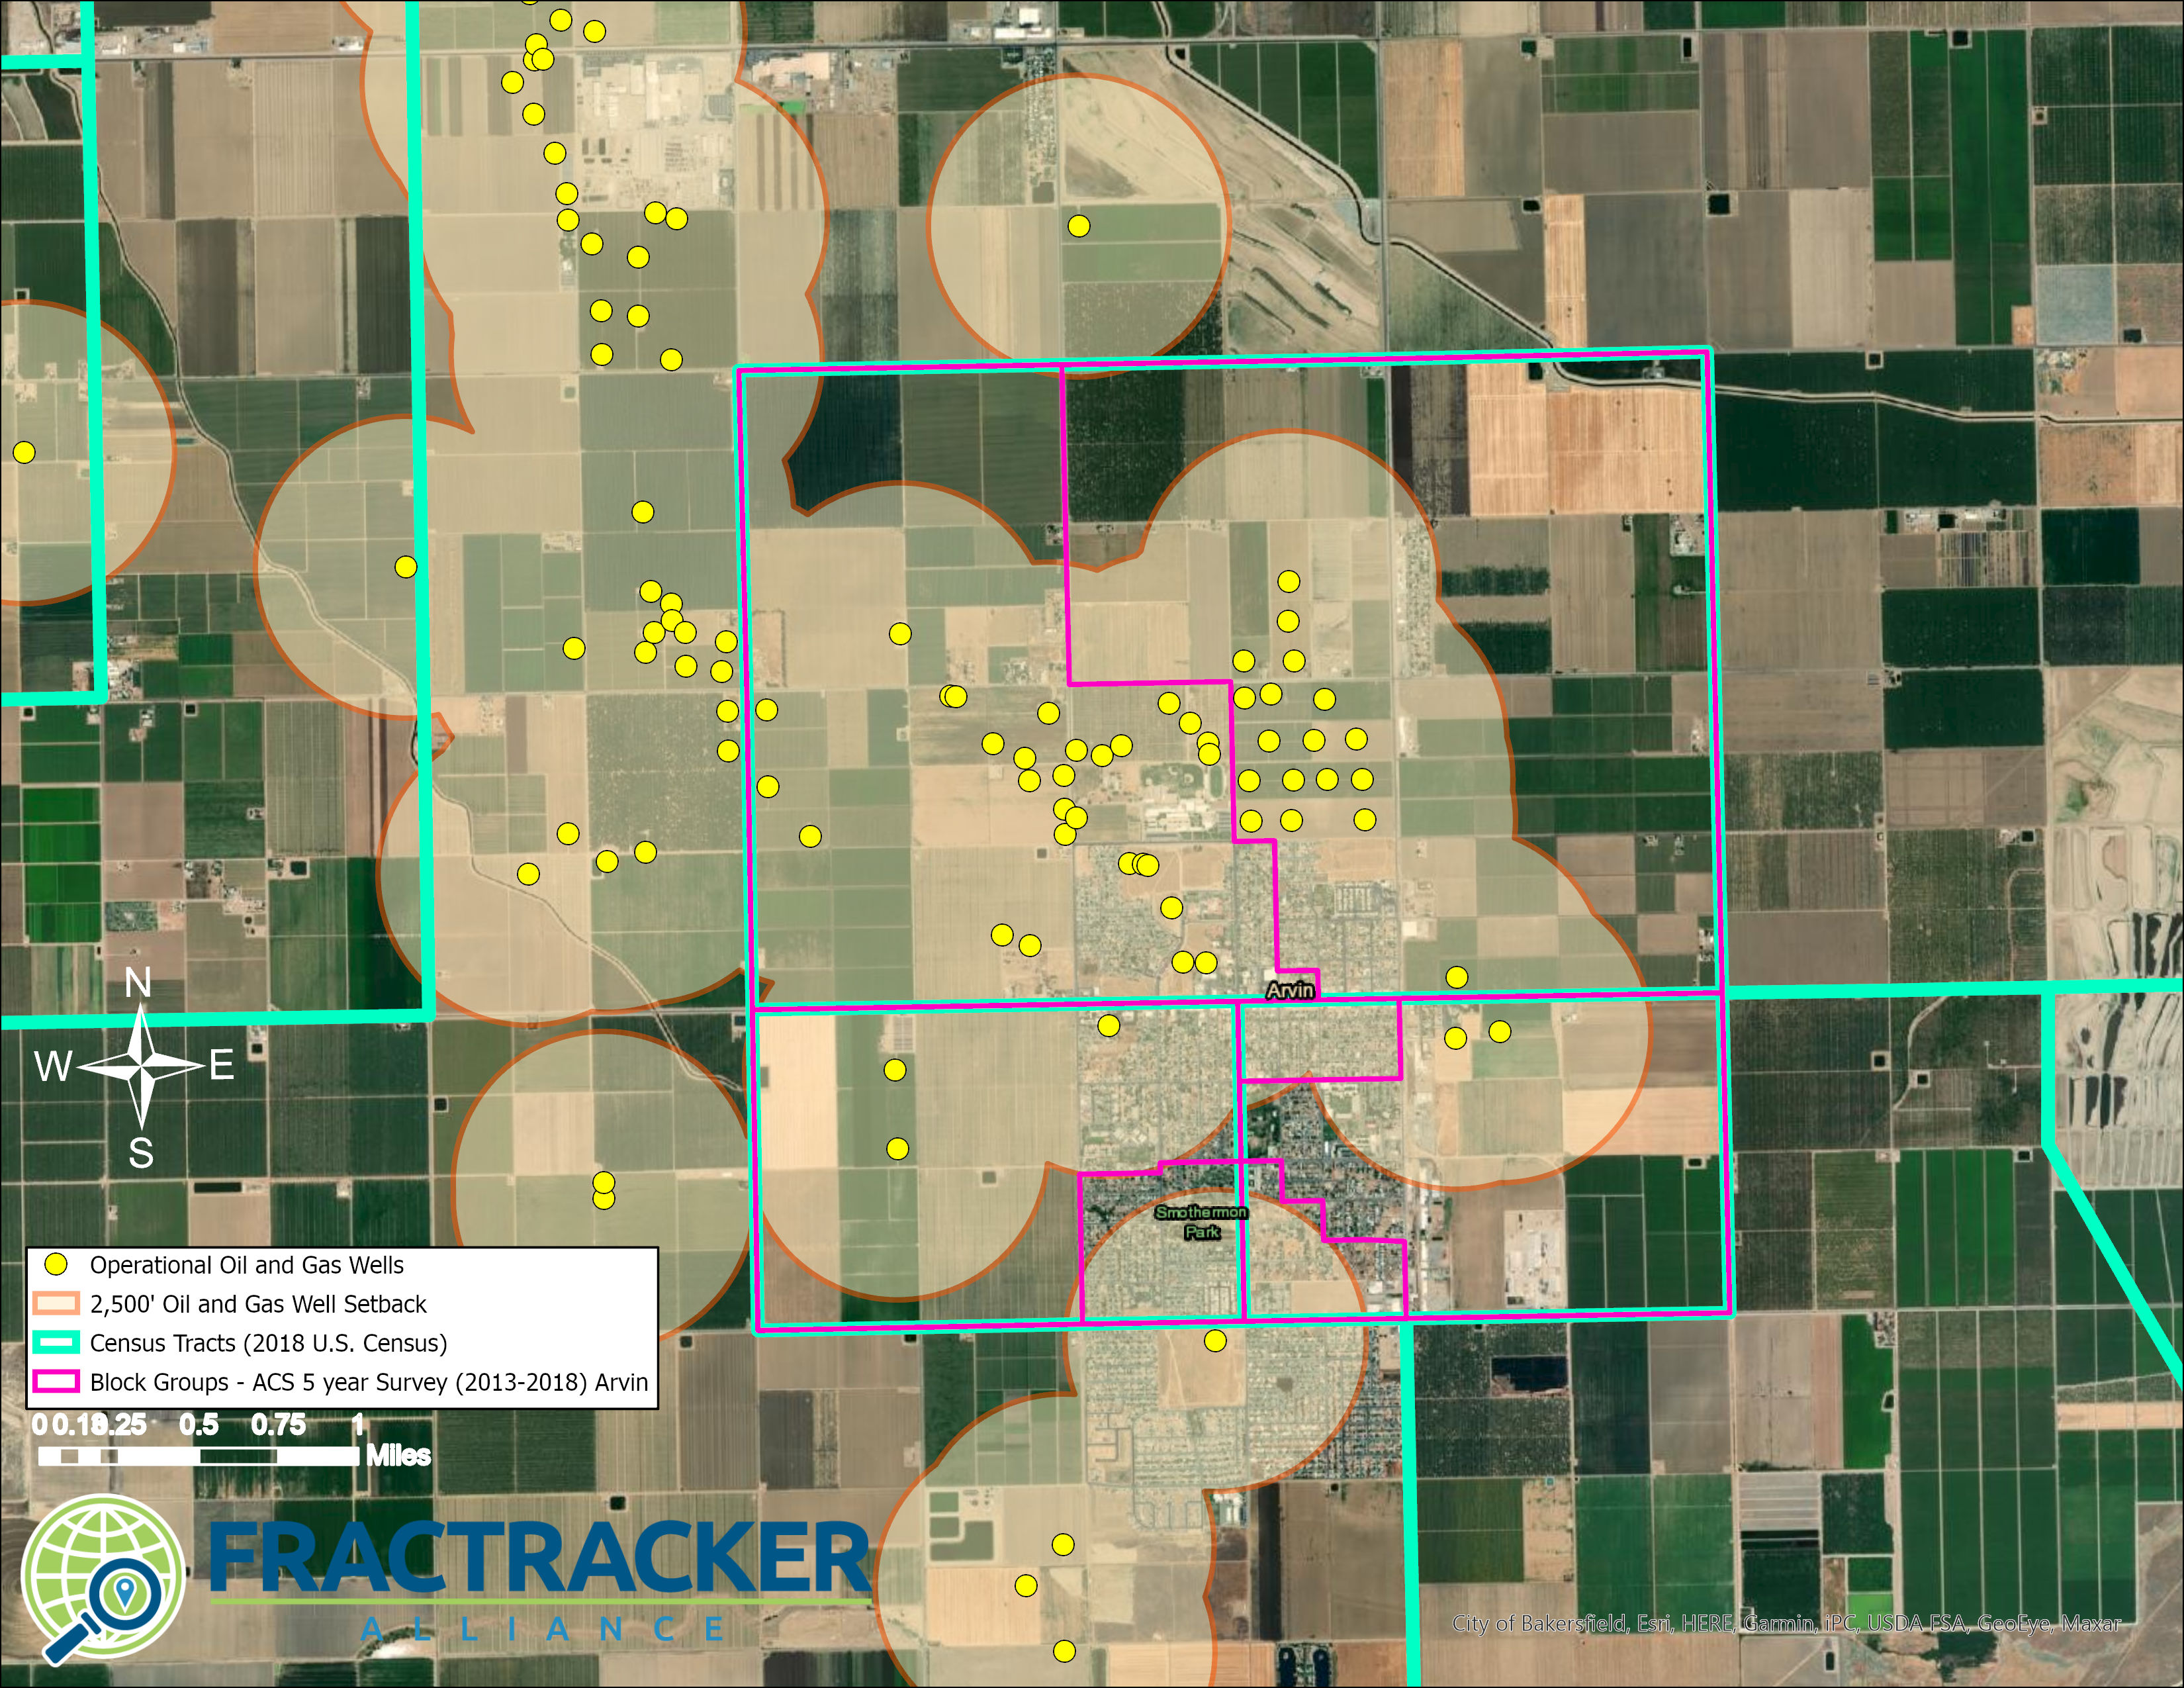 Map A1. Arvin Census Designated Areas. The map shows the city of Arvin and includes both census tracts and census block groups for comparison. It shows operational oil and gas wells in the map, along with 2,500’ buffers. This Frontline Community would be excluded in an analysis that only considers census tracts containing Tier 1 areas negatively impacted by oil and gas extraction operations. The census tracts that make up the majority of the city of Arvin are enveloped on all four sides by one larger census tract that contains most oil and gas wells.
 Map A2. Shafter Census Designated Areas. The map shows the city of Shafter and includes both census tracts and census block groups for comparison. It shows operational oil and gas wells in the map, along with 2,500’ buffers. This Frontline Community would not be included in an analysis that only considers census tracts containing Tier 1 areas negatively impacted by oil and gas extraction operations. The census tract containing the North Shafter oil field forms a donut around the city of Shafter.
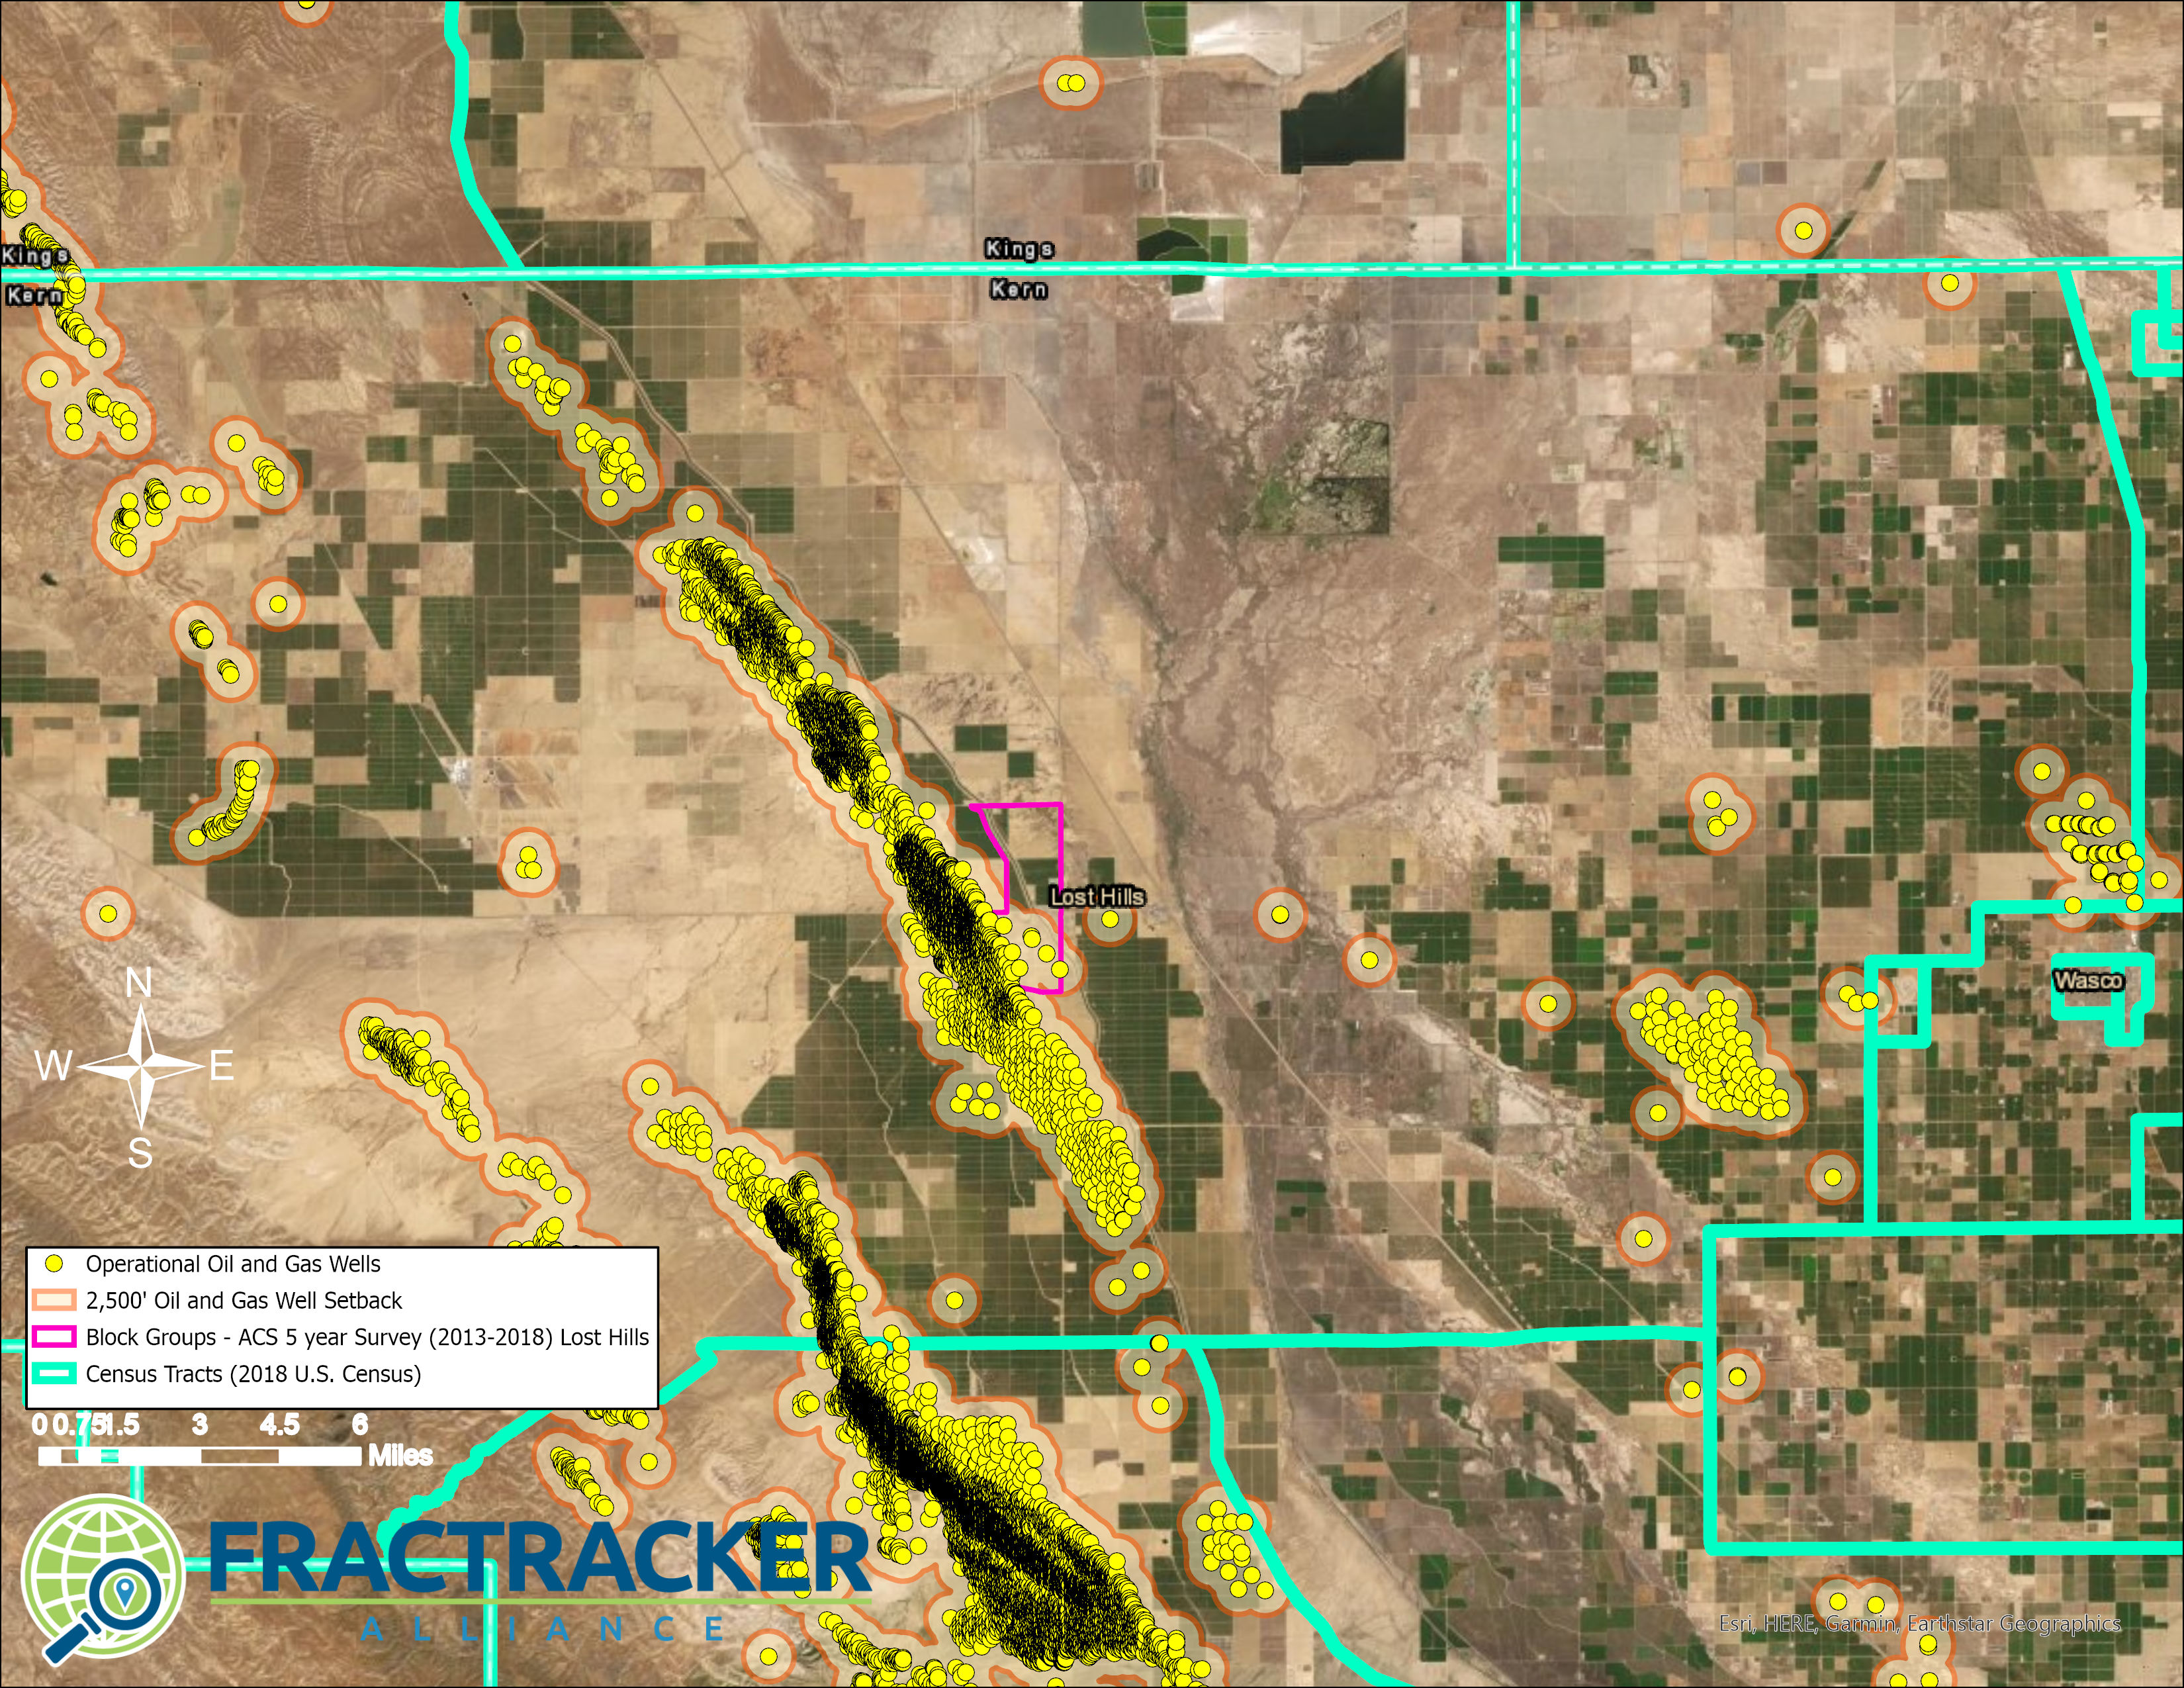 Map A3. Lost Hills Census Designated Areas. The map shows the city of Lost Hills and includes both census tracts and census block groups for comparison. It shows operational oil and gas wells, along with 2,500’ buffers. While the city of Lost Hills may be included in the 2020 Kern draft EIR EJ analysis, the results will not reflect the demographics of the community due to the incredibly large size of the census tract. It does not even entirely fit in the frame of this map!
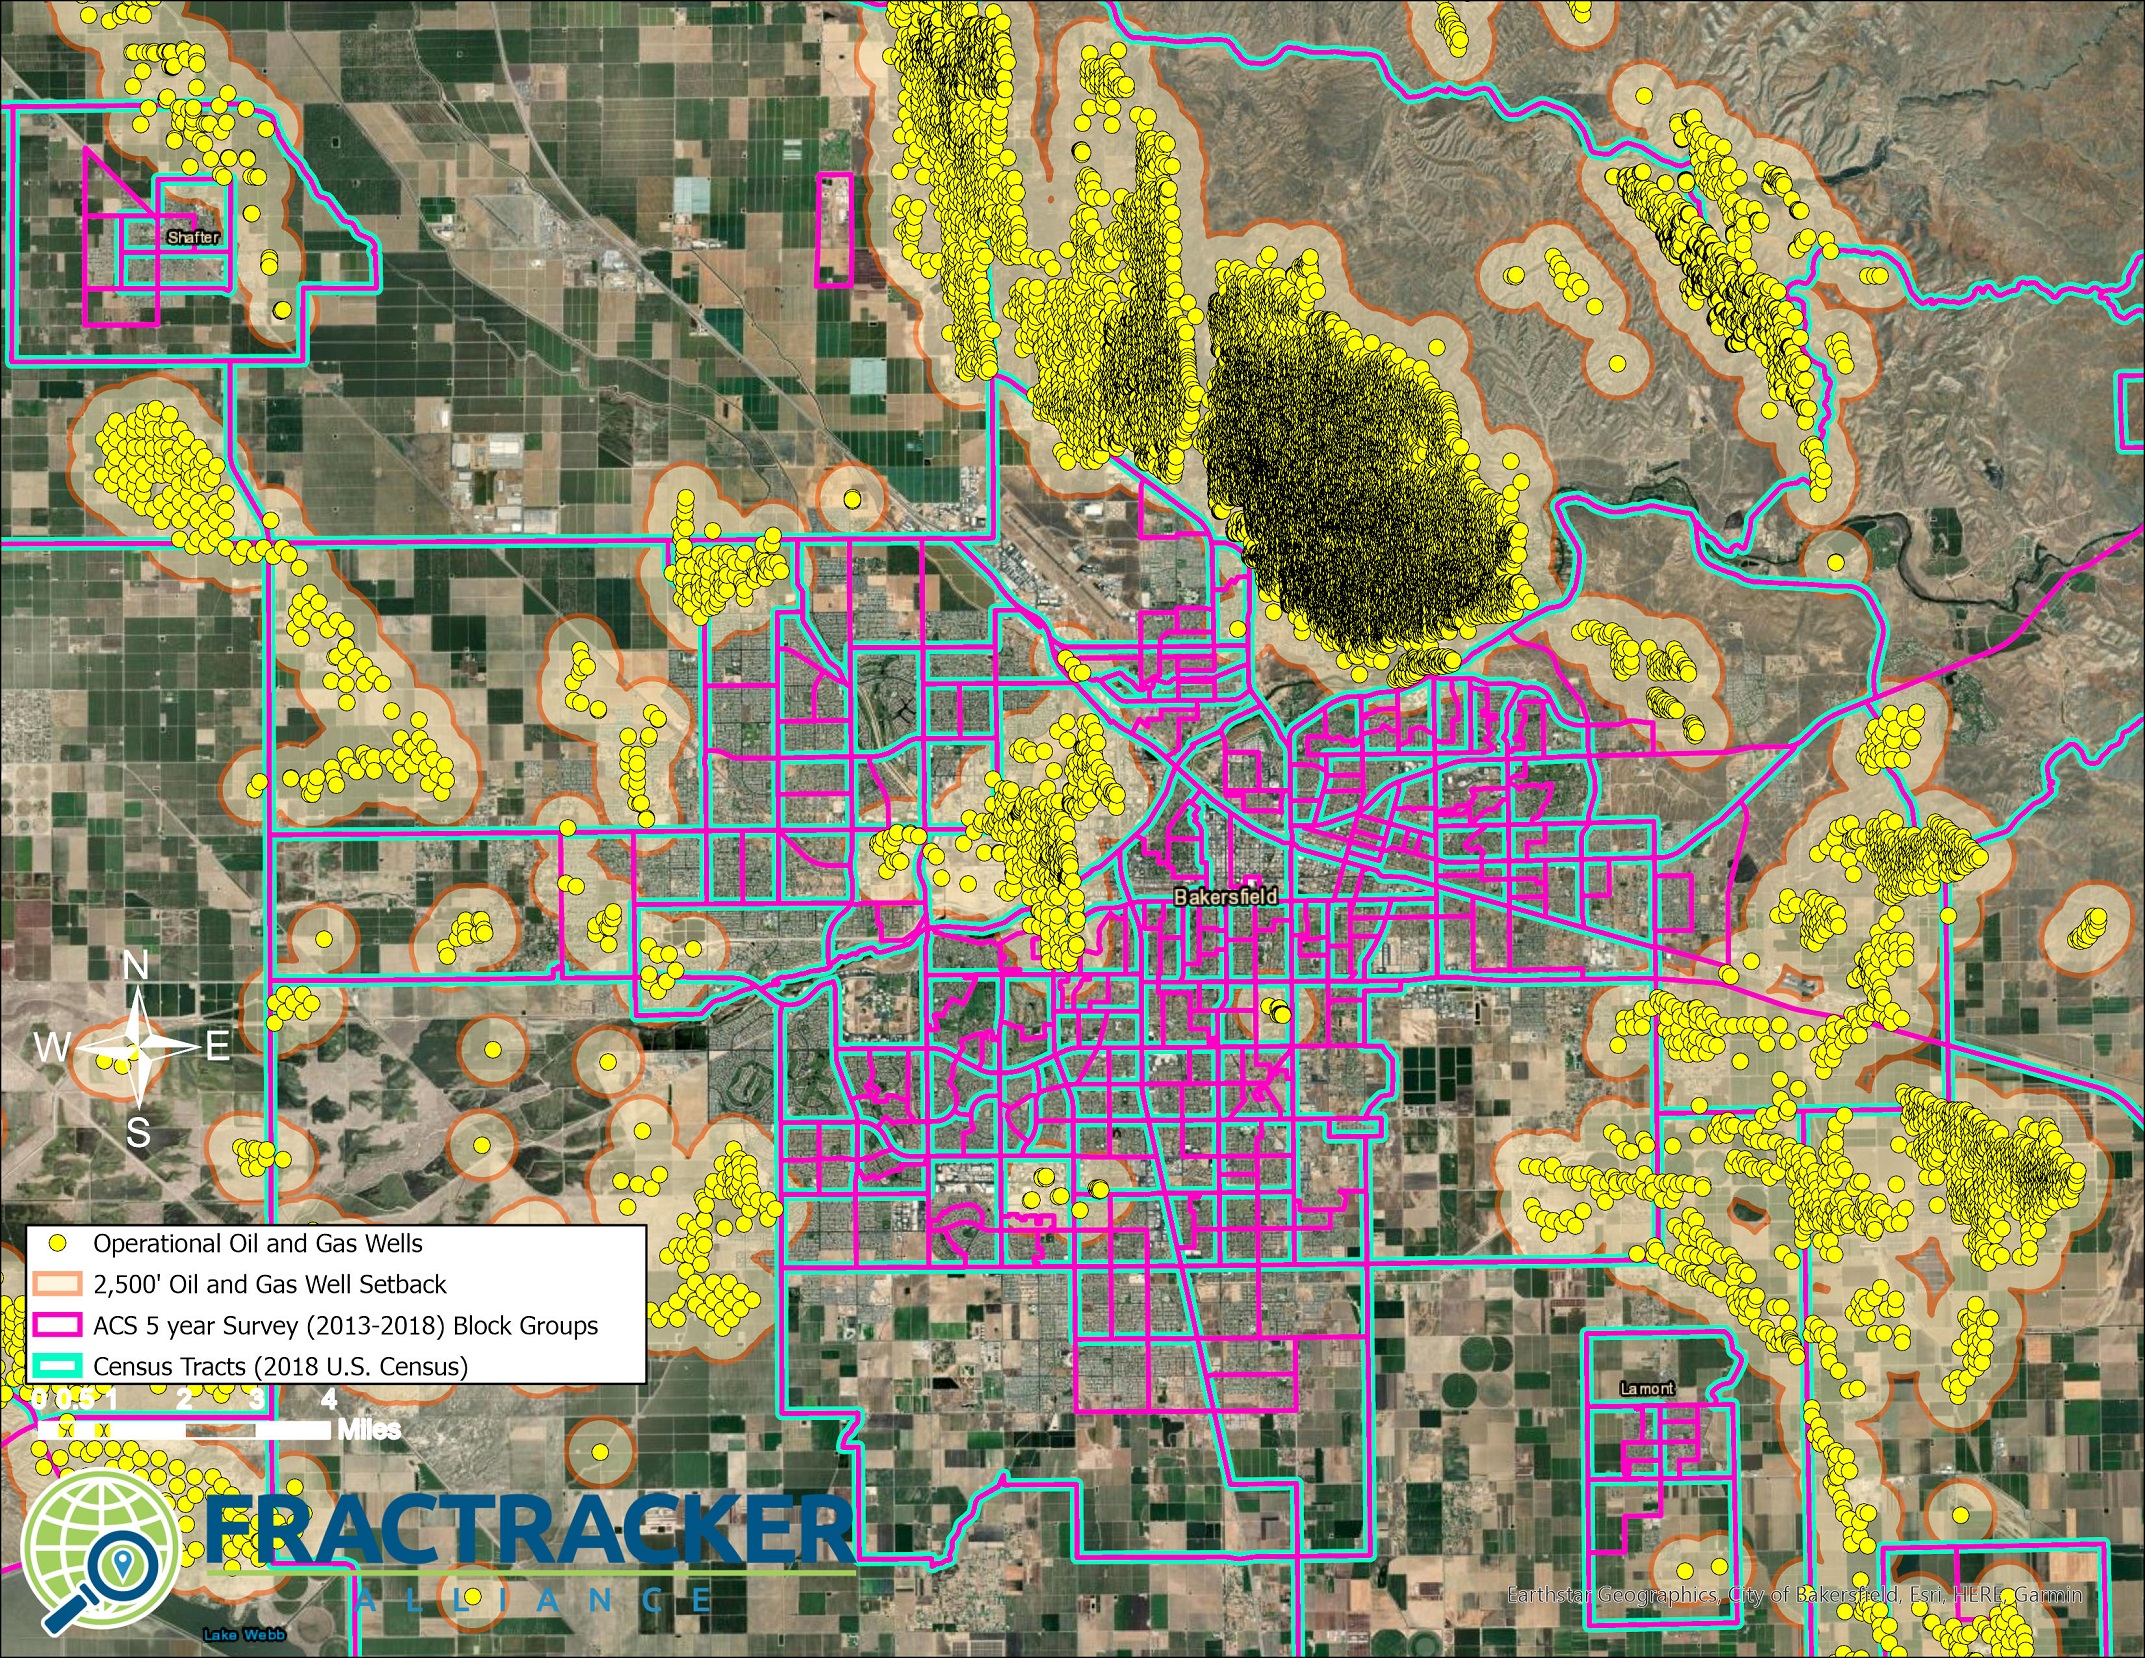 Map A4. Bakersfield Census Designated Areas. The map shows the city of Bakersfield and includes both census tracts and census block groups for comparison. It shows operational oil and gas wells, along with 2,500’ buffers. This Frontline Community would not be included in an analysis that only considers census tracts containing Tier 1 areas negatively impacted by oil and gas extraction operations. The oil and gas wells in the Kern River, Kern Front and other oil fields make up their own unique census tract that also includes extensive areas of rural ‘estate’ zoned lands.
Demographics Analysis
In the initial report below we analyzed the demographics and linguistic isolation of communities who live within 2,500’ of operational oil and gas wells. We found that the urban census block groups closest to Kern’s major oil and gas fields are some of the most linguistically isolated regions in the country. Densely populated block groups near large oil fields in the cities of Lost Hills, Arvin, Lamont and Weepatch suffer from linguistic isolation, where up to 80% of households do not have a proficient english speaker. In the analysis that follows, we focus more on specific Frontline Communities. Generating county-wide statistics using census block groups could result in too much spatial bias. Census designated areas do not have enough uniformity, and those located in and near oil fields are large in area (though would still provide a more accurate picture in comparison to census tracts). Therefore the analyses that follow take a community-centric approach to more accurately describe the demographics of several of Kern’s largest, most populous, Frontline Communities.
Shafter
The City of Shafter, California, is near over 100 operational wells in the North Shafter oil field, as shown below in the map in Figure 2. Technically, the wells are within a donut-shaped census block group (outlined in blue) that surrounds the limits of the urban census block groups (outlined in pink). Shafter’s population of nearly 20,000 is over 86% Latinx, but the surrounding “donut” with just 2,000 people is about 70% Latinx, much wealthier, and with very low population density. The other neighboring rural census areas housing the rest of the Shafter oil field wells follow this same trend.
An uninformed analysis, such as the Kern County EIR, would conclude that the 2,000 individuals who live within the blue “donut” are at the highest risk, because they share the same census designated area as the wells. Notably, the only population center of this census block group (or census tracts, which follow this same trend) is at the opposite end of the block group, far from the Shafter oil field. Instead, the most at-risk community is the urban community of Shafter with high population density; the census block groups within the pink hole of the donut contain the communities and homes nearest the North Shafter field.
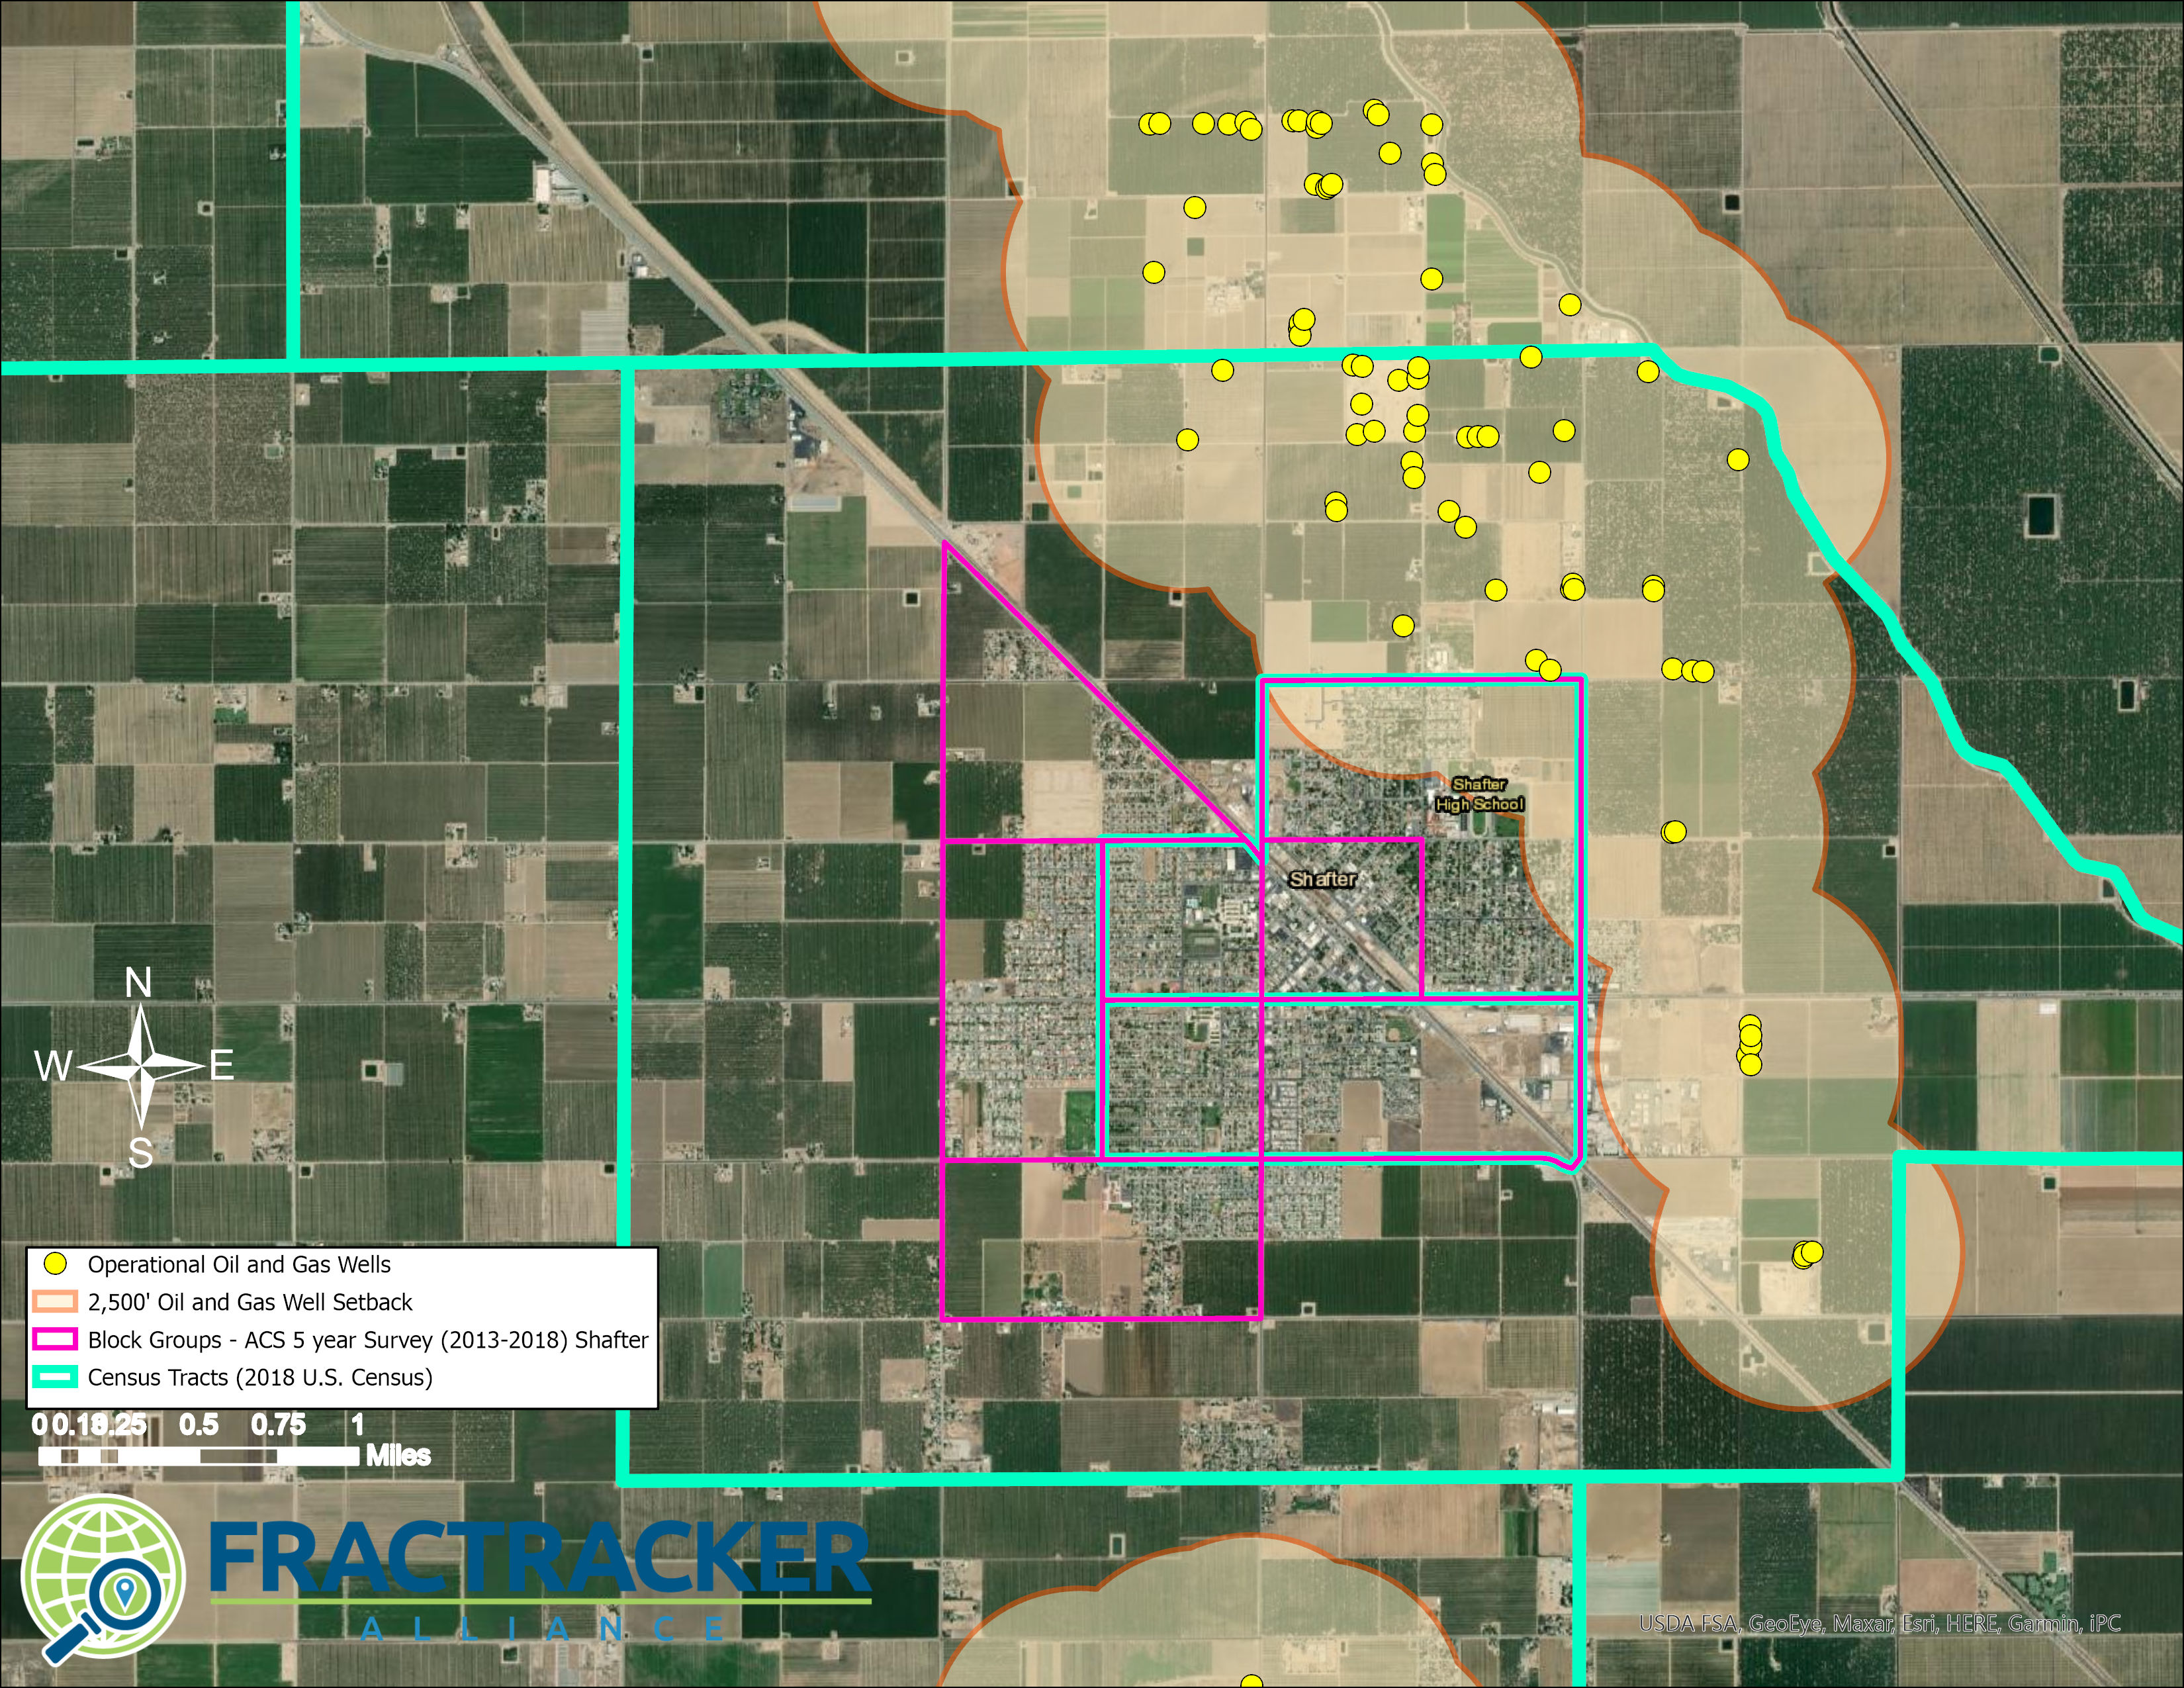 Map A5. The City of Shafter, California is located just to the south of the North Shafter oil field. The map shows the 2,500’ setback distance in tan, as well as the census block groups in both pink and blue. Pink block groups show the urban case populations used to generate the demographic summaries.
Lost Hills, Arvin, and Taft
The cities of Lost Hills, Arvin, and Taft are all very similar to Shafter. The cities have densely populated urban centers within or directly next to an oil field. In the maps below in Figures 3 readers can see the community of Lost Hills next to the Lost Hills oil field. Lost Hills, like the densely populated cities of Arvin and Taft, are located very close to large scale extraction operations. Census block groups that include the most affected area of Lost Hills, outlined in pink, while surrounding low population density census block groups are shown in blue. Most of the areas outlined in blue are zoned as “estate” and “agriculture” areas. The outlines of the city boundaries are also shown, along with 2,500’ and mile setback distances from currently operational oil and gas wells.
Lost Hills is another situation where a donut-shaped census area distorts the results of low resolution demographics assessments, such as the one conducted by Kern County in their 2020 Draft EIR (PDF pp. 1292-1305). Almost all of the wells within the Lost Hills oil fields are just outside of a 2,500’ setback, but the incredibly high density of extraction operations results in the combined impact of the sum of these wells on degraded air quality. While stringent setback distances from oil and gas wells are a necessary component of environmental justice, a 2,500’ setback on its own is not enough to reduce exposures and risk for the Frontline Community of Lost Hills. For these Frontline Communities, a setback needs to be much larger to reduce exposures. In fact, limiting a public health intervention to a 2,500′ setback requirement alone is not sufficient to address the environmental health inequities in Lost Hills, Shafter, and other similar communities.
Lost Hill’s nearly 2,000 residents are over 99% Latinx, and over 70% of the households make less than $40,000 in annual income (which is substantially less than the annual median income of Kern County households [at $52,479]). The map in Figure A6 shows that the Lost Hills public elementary school is within 2,500’ of the Lost Hills oil field and within two miles of over 2,600 operational wells, besides the 6,000 operational wells in the rest of the field.
The City of Arvin has 8 operational oil and gas wells within the city limits, and another 71 operational wells within 2 miles. Arvin, with nearly 22,000 people, is over 90% Latinx, and over 60% of the households make less than $40,000 in annual income.
Additionally the City of Taft, located directly between the Buena Vista and Midway Sunset Fields, has a demographic profile with a Latinx population at least 10% higher than the rest of southern Kern County.
Lost Hills, Arvin, and Taft are among the most affected communities of Kern County and represent a large proportion of the Kern citizens at risk of exposure to localized air quality degradation from oil and gas extraction.
In these cases, if only census tract well counts are considered, like in the 2020 Kern County draft EIR, these Frontline Communities will be completely disregarded. Census tracts are intentionally drawn to separate urban/residential areas from industrial/estate/agricultural areas. The census areas that contain the oil fields are very large and sparsely populated, while neighboring census areas with dense population centers, such as these small cities, are most impacted by the oil and gas fields.
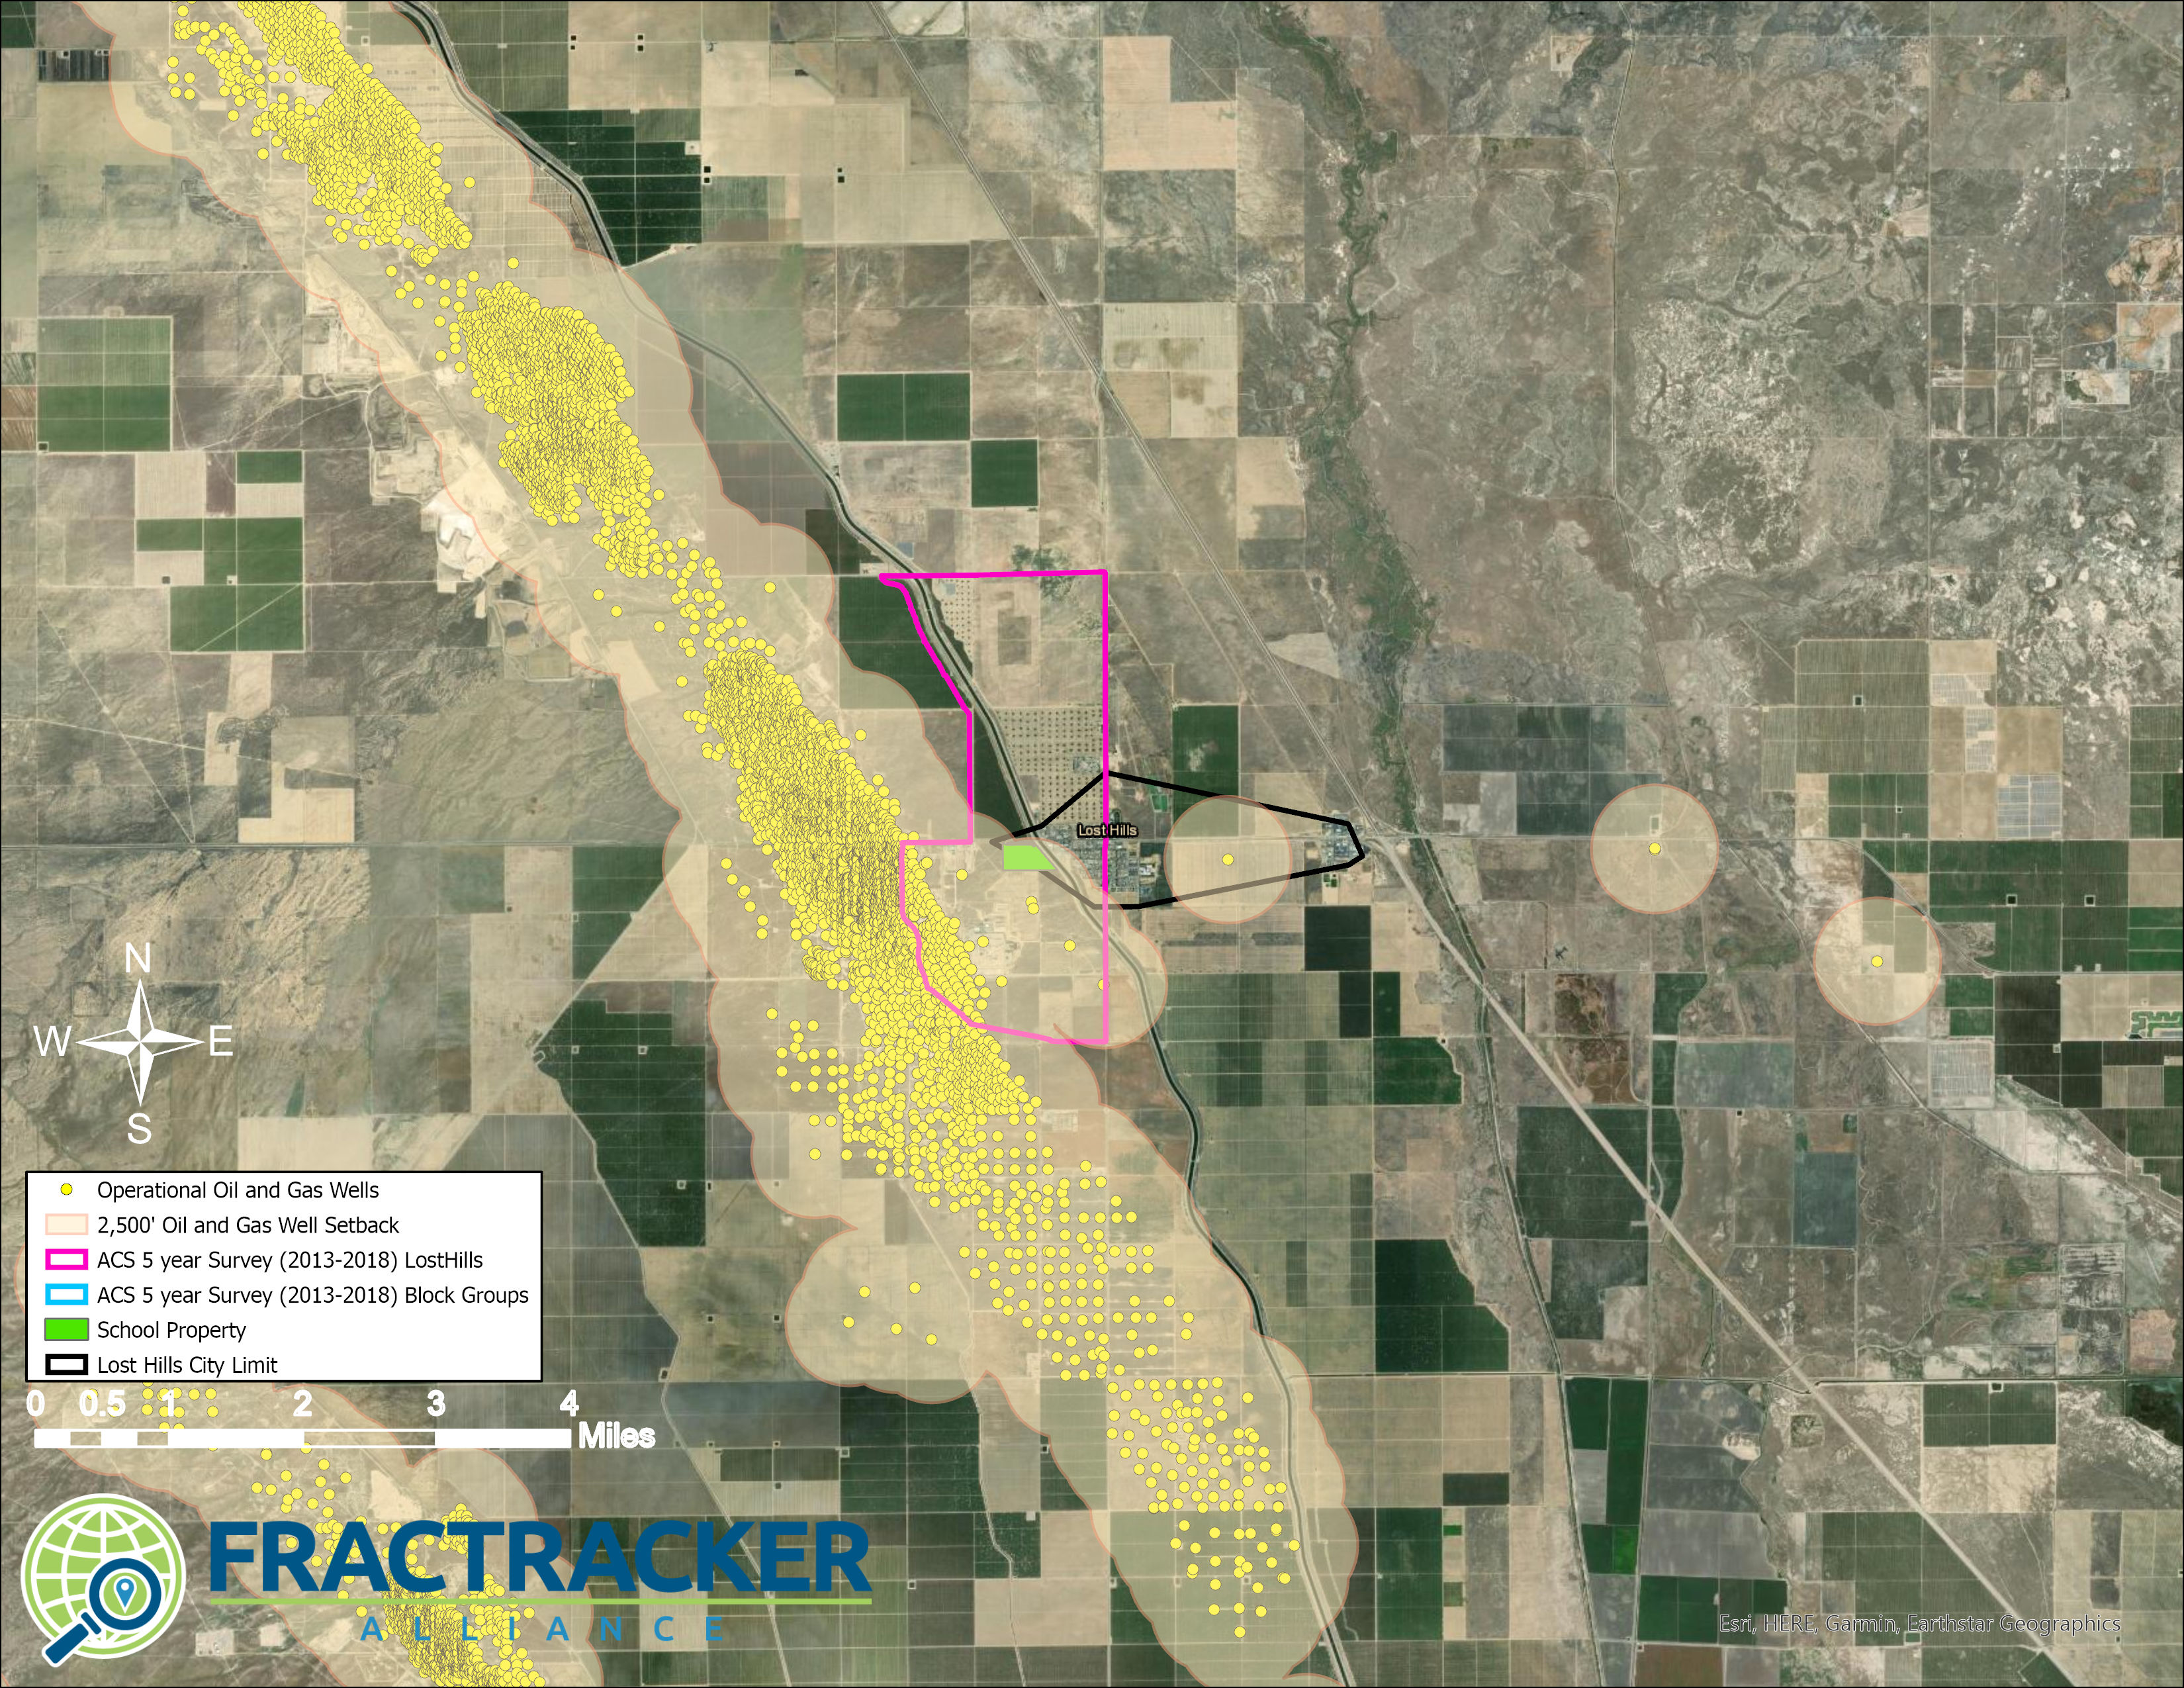 Map A6. The Unincorporated City of Lost Hills in Kern County, California is within 2,500’ of the Lost Hills Oil Field. The map shows the 2,500’ setback distance in tan, and the census block groups in both pink and blue. Pink block groups show the urban case populations used to generate the demographic summaries.
Bakersfield
The City of Bakersfield is a unique scenario. It is the largest city in Kern County and as a result suburban developments surround parts of the city. Urban flight has moved much of the wealth into these suburbs. The suburban sprawl has occurred in directions including North toward the Kern River oil field, predominantly on the field’s western flank in Oildale and Seguro. In the map below in Map A7, these areas are located just to the north of the Kern River.
This is a poignant example of the development of cheap land for housing developments in an area where oil and gas operations already existed; an issue that needs to be considered in the development of setbacks and public health interventions and policies. This small population of predominantly white, middle class neighborhoods shares similar risks as the lower-income Communities of Color who account for most Bakersfield’s urban center. Even though these suburban communities are less vulnerable to the oppressive forces of systemic racism, real estate markets will continue to prioritize cheap land for development, moving communities closer to extraction operations.
Regardless of the implications of urban sprawl and suburban development,it is important to not disregard environmental risks for all communities. The demographics of the at-risk areas of the city of Bakersfield are predominantly Non-white (31%) and Latinx (60%), particularly as compared to the city’s suburbs (15% Non-white and 26% Latinx). About 33,000 people live in the city’s northern suburbs, and another 470,000 live in Bakersfield’s urban city center just to the south of the Kern River oil field. The urban population of Bakersfield is exposed to the local and regional negative air quality impacts of the Kern River and numerous other surrounding oil fields making it a disparately impacted community.
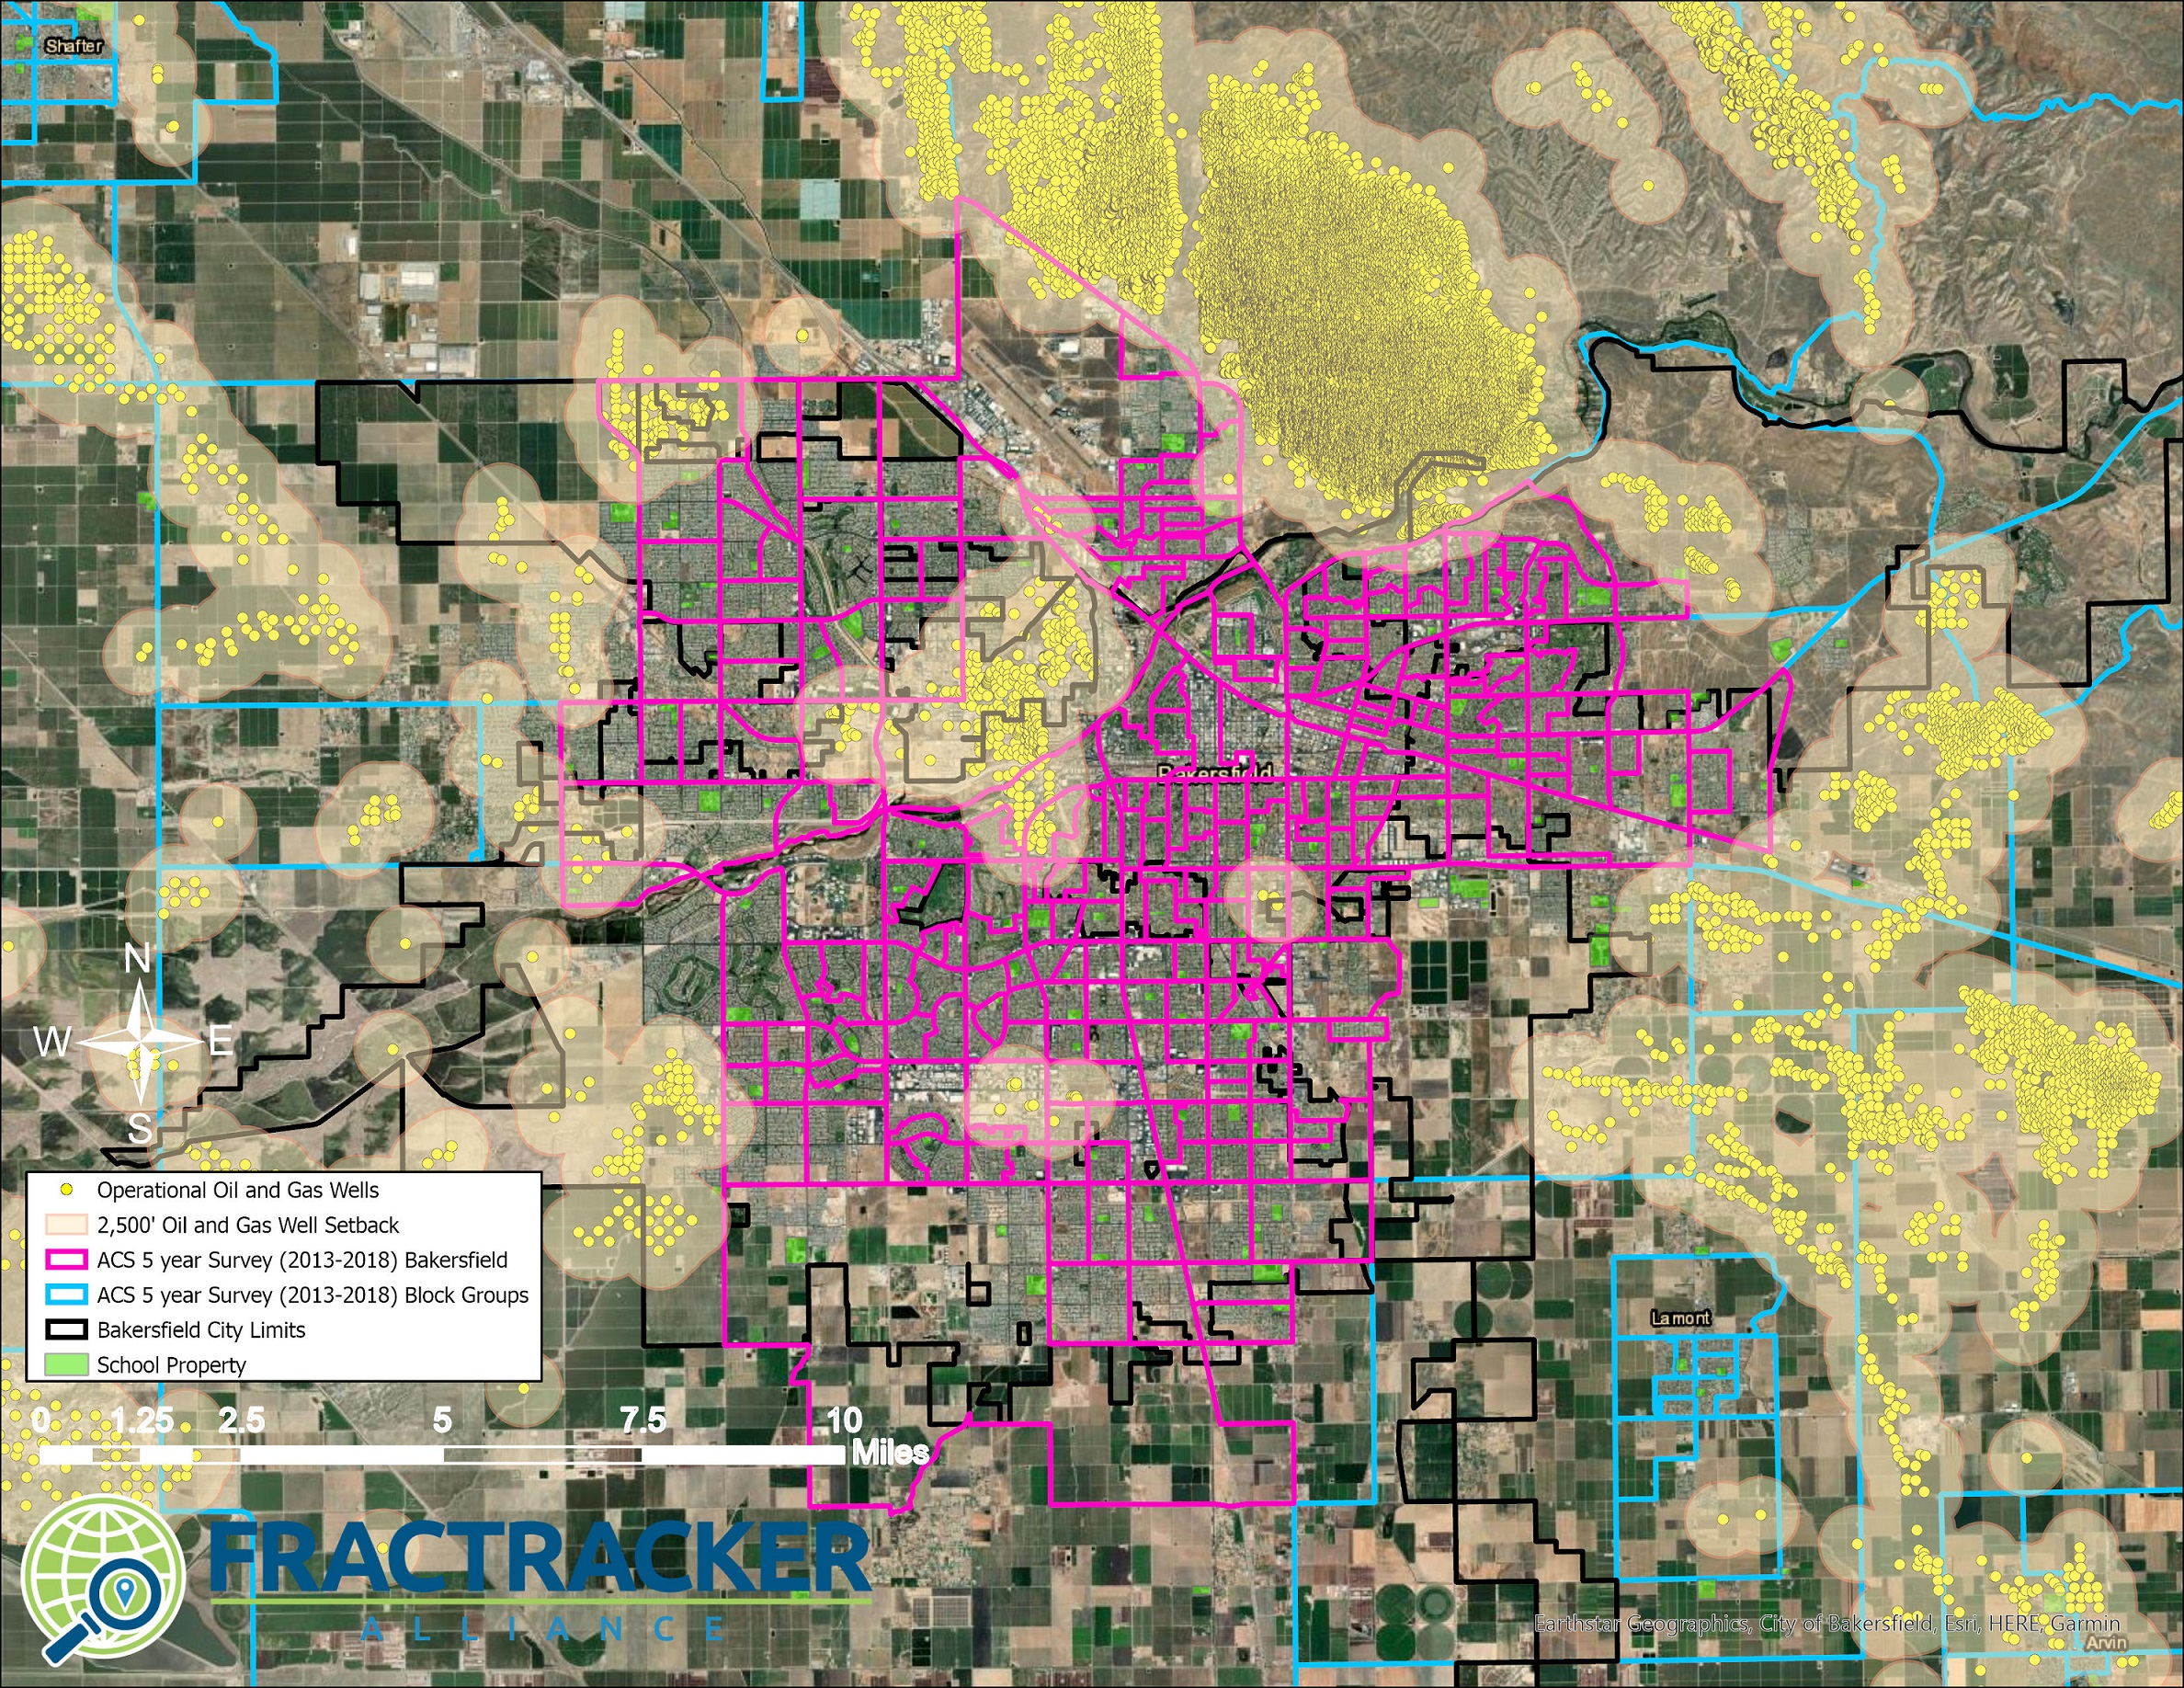 Map A7. Map of the city of Bakersfield in Kern County, California between several major oil fields including the Kern Front oil field. The map shows the 2,500’ setback distance in tan, and the census block groups in both pink and blue. Pink block groups show the urban case populations used to generate the demographic summaries.
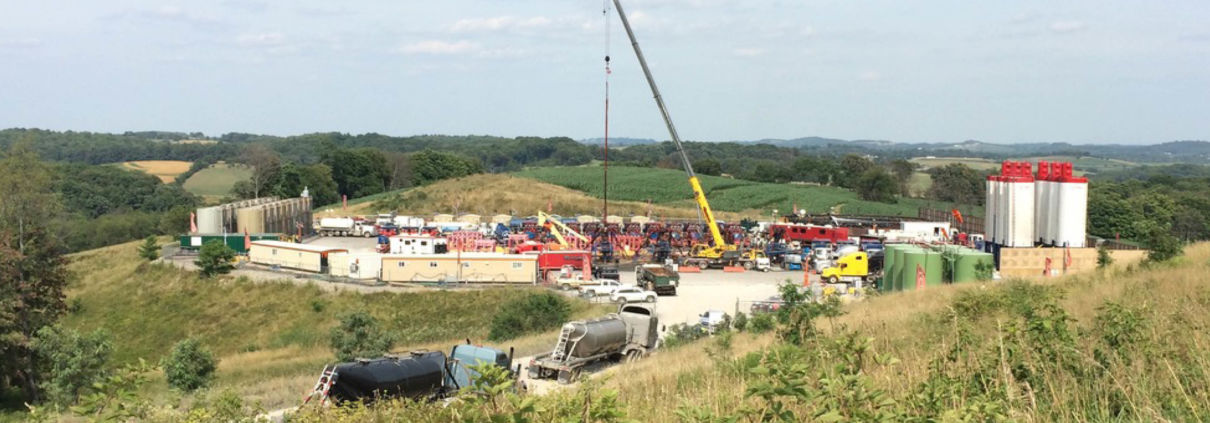 Image courtesy of Lois Bower-Bjornson from the Clean Air Council.
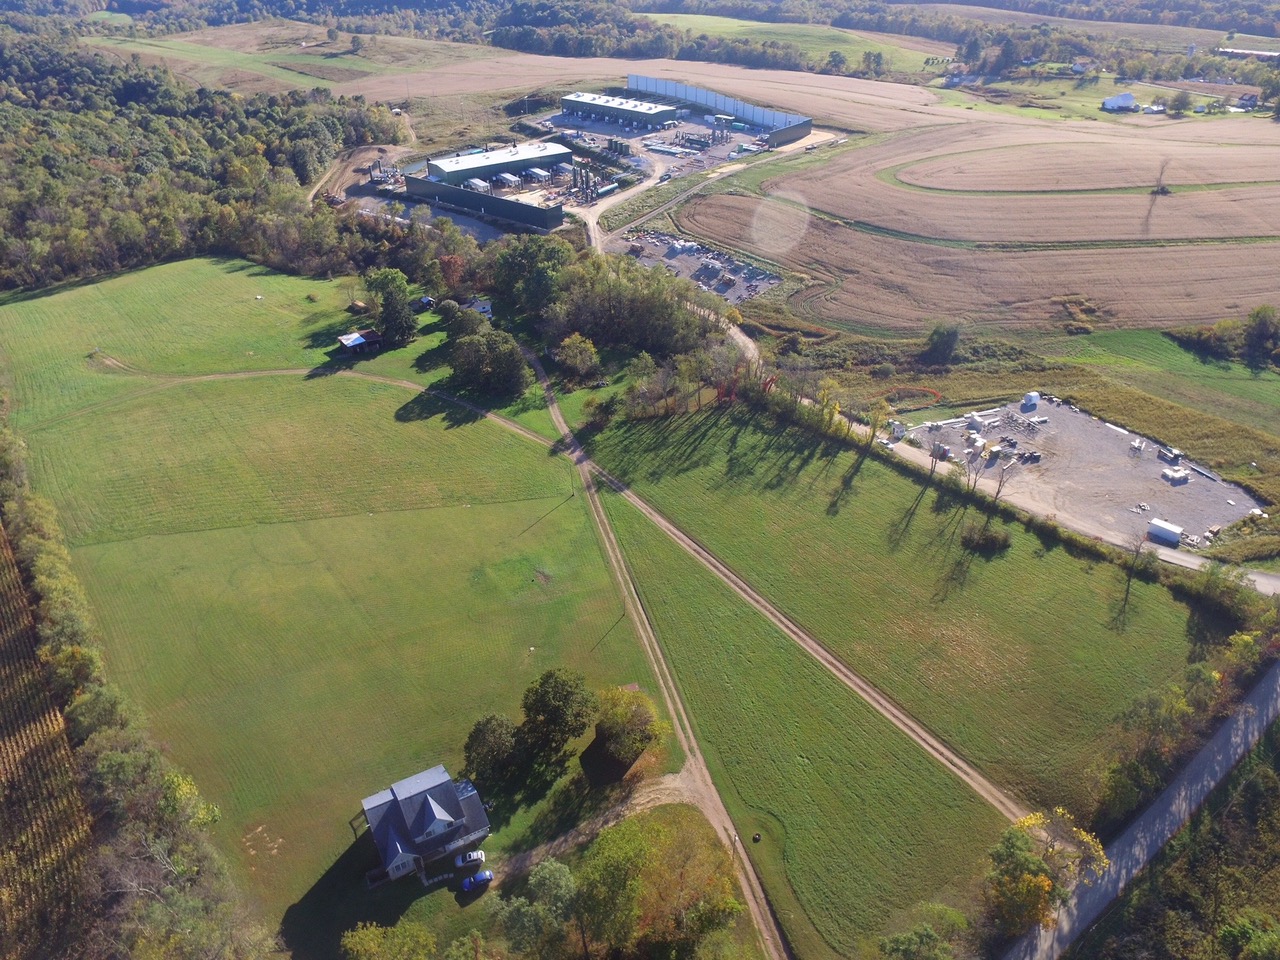
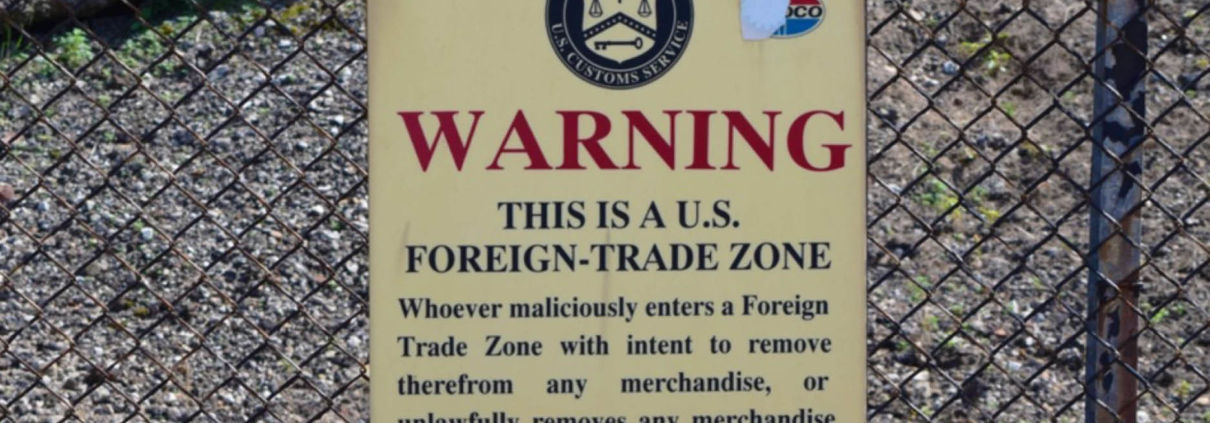
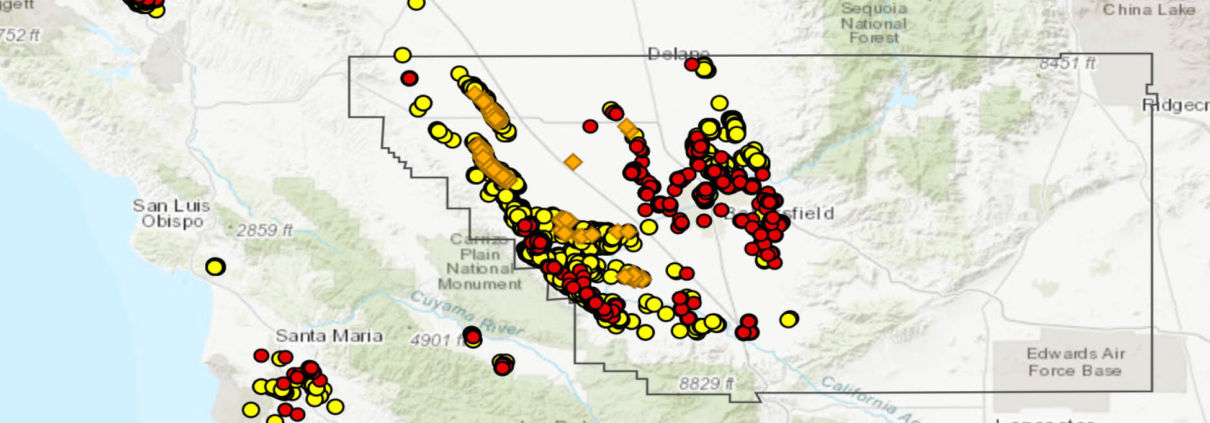
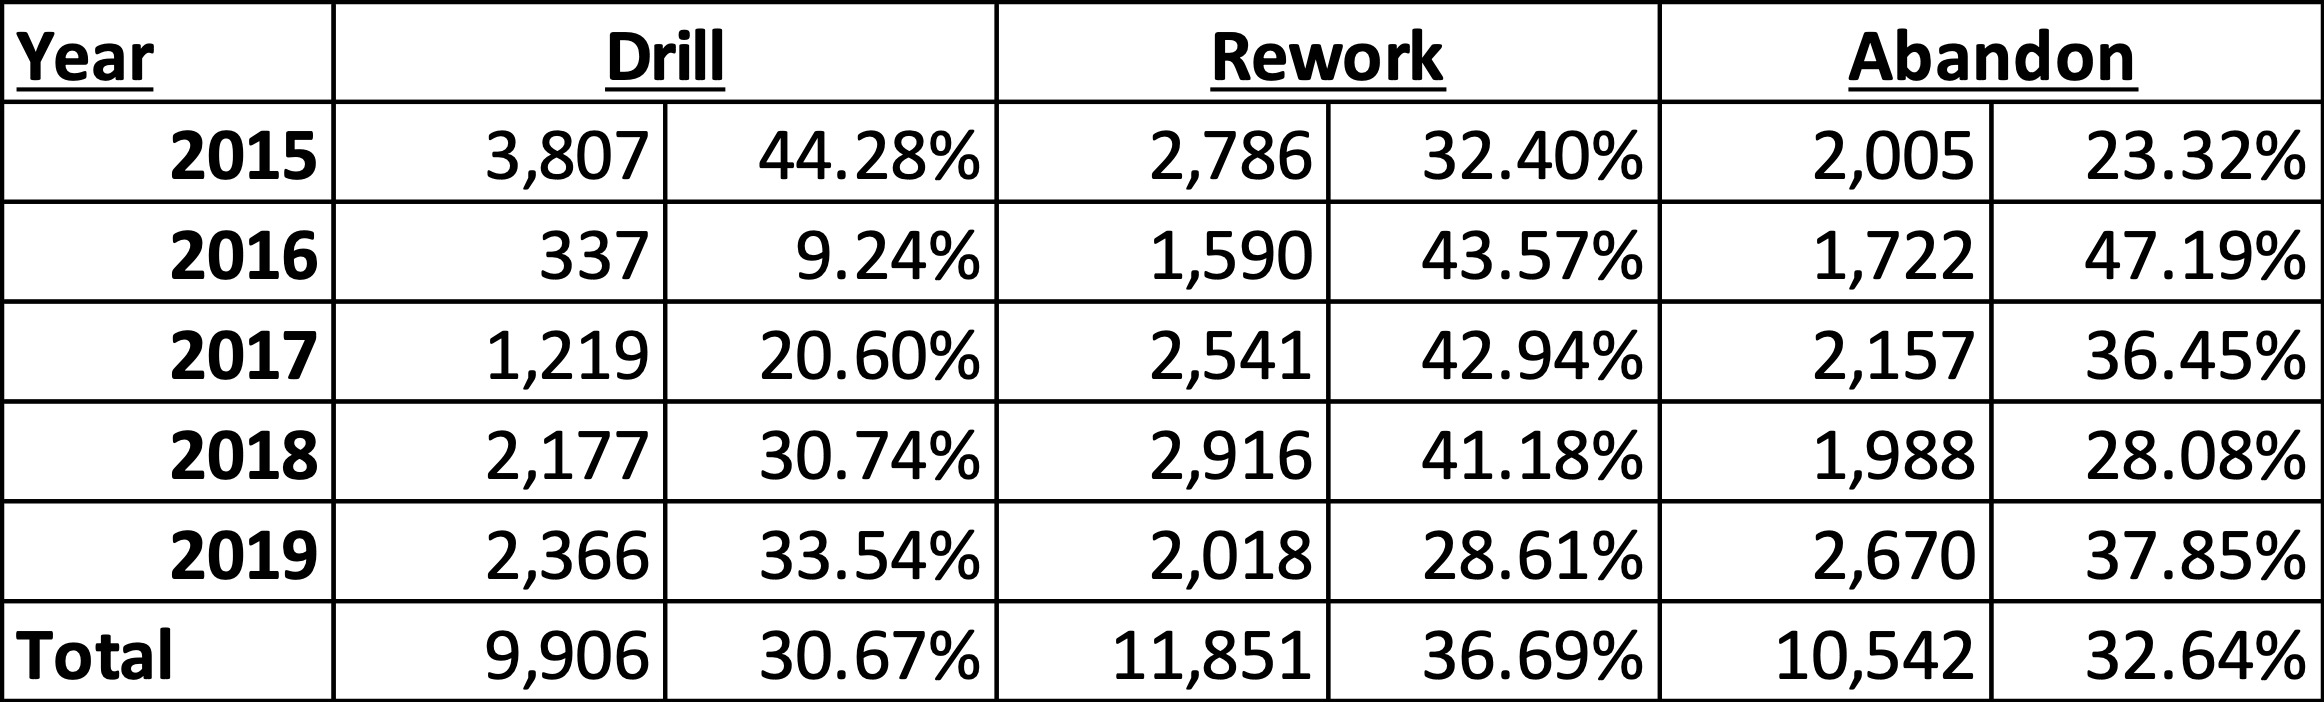
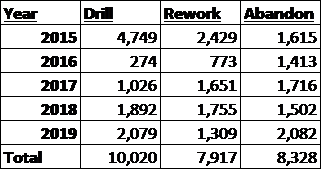

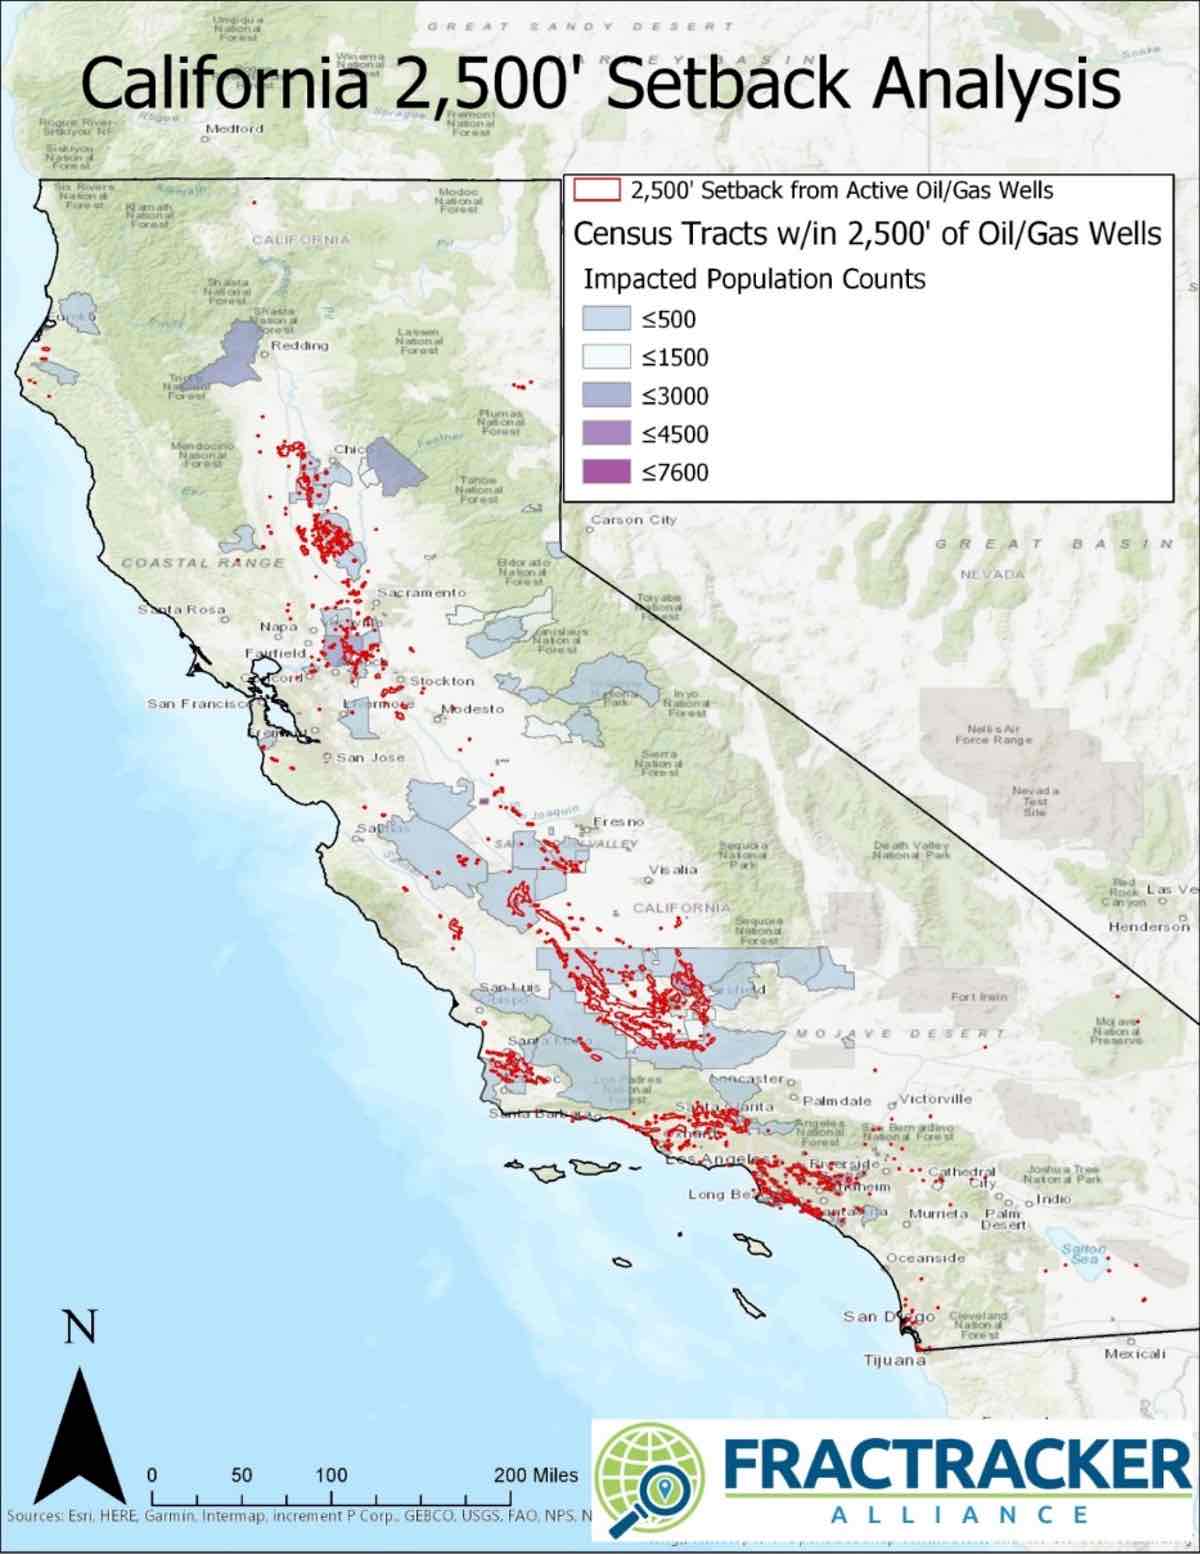
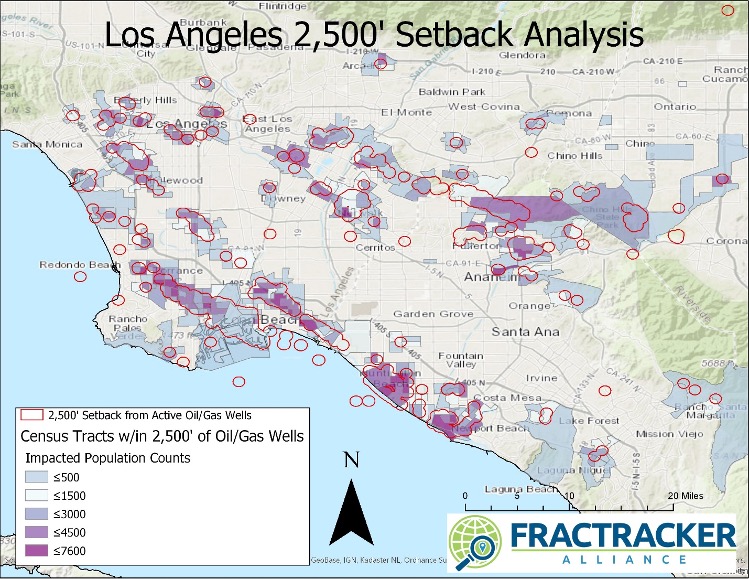
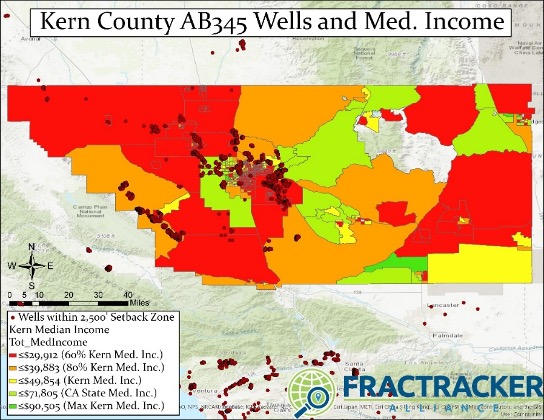
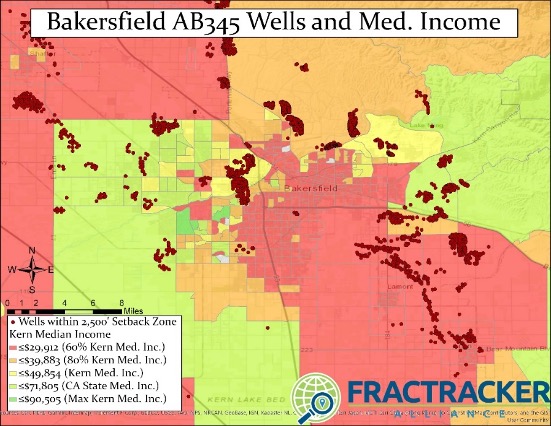
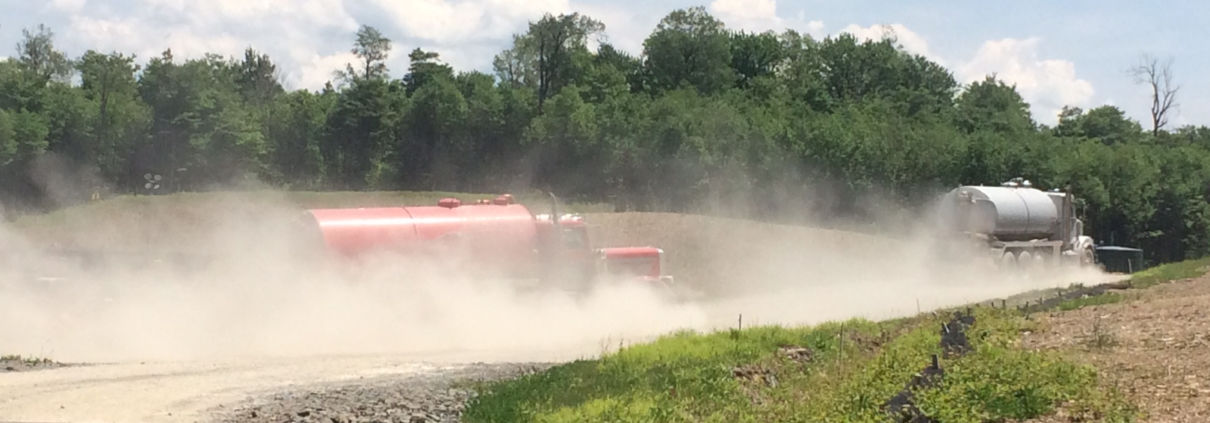
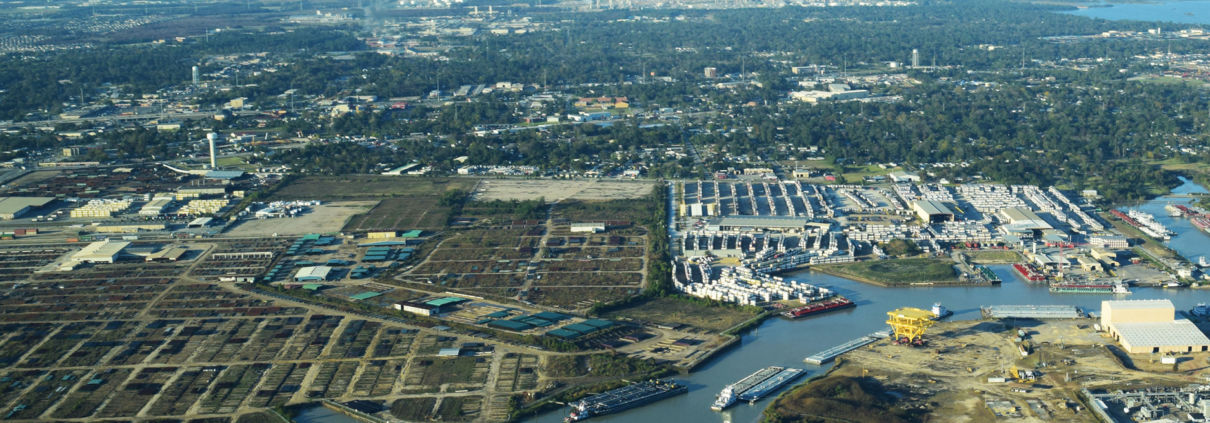 Photo by Ted Auch, FracTracker Alliance, with aerial support by LightHawk