California Denies Well Stimulation Permits
California regulators recently denied 21 well stimulation permit applications—a welcomed move in the right direction—but not enough.
California regulators recently denied 21 well stimulation permit applications—a welcomed move in the right direction—but not enough.
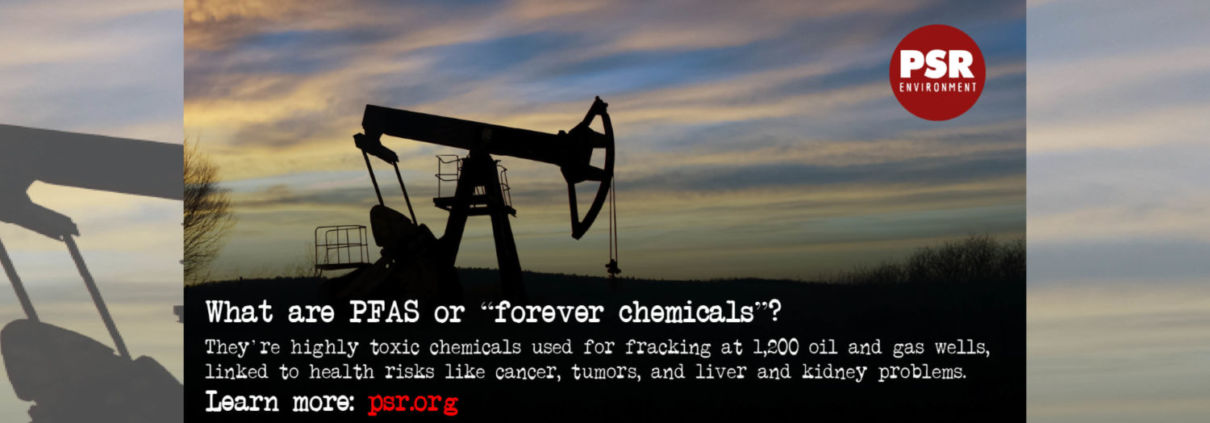
FracTracker Alliance released a new map identifying the locations of over 1,200 oil and gas wells using toxic “forever chemicals” in Arkansas, Louisiana, Oklahoma, New Mexico, Texas, and Wyoming.
The Mi’kmaq First Nations people are facing threats to their lands and water due to plans in Nova Scotia proposed by AltaGas.
In December 2019, Plains All-American and Valero pipeline companies announced plans to build the 49-mile Byhalia Pipeline through southwestern Tennessee and northwestern Mississippi. The proposed Byhalia Connection Pipeline is a 24-inch, high pressure (1500 psi) conduit, conveying crude oil coming Oklahoma, bound for the Gulf coast. The pipeline, which is designed to carry up to 420,000 barrels of oil a day, provides a link between the Diamond Pipeline to the west and the Capline Pipeline to the east. Construction is planned to begin in early 2021, and be completed by year’s end. Plains All-American insists that all safety precautions are being considered, but the outcry among residents and environmental advocates has been considerable.
Many factors—environmental, geological, social, and economic—have emerged as reasons that this pipeline should not move ahead. And industry most certainly didn’t count on pushback from the local community. Residents, allies, and the media have risen up to challenge the project. In this article, we’ll take a look at the story from various perspectives, augmented by FracTracker’s mapping insights.
UPDATE: On Friday, July 2, 2021, Plains All American announced that it would be abandoning its plans to build the controversial Byhalia Connection Pipeline. As one activist involved in the fight proudly stated, “We’ve shown them that we aren’t the path of least resistance. We are the path of resilience.” Read more about this momentous victory for the people of South Memphis here.
Environmental and hydrological
Demographics and disaster preparedness
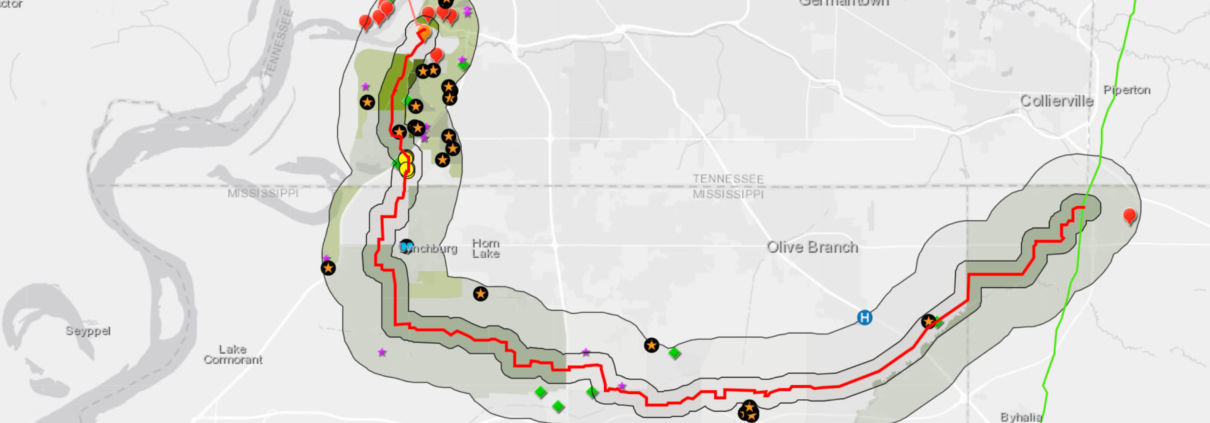
This interactive map looks at the various risks associated with the proposed Byhalia Connection Pipeline. The map contains all of the data layers related to the topics in this article. Scroll down in this article to find interactive maps separated out by topic. All data sources are listed in the “Details” section of the maps, as well as at the end of this article. Items will activate in this map dependent on the level of zoom in or out.
View Full Screen | Updated March, 2021
The 49-mile route of the proposed Byhalia Connection Pipeline passes through a patchwork of rural, suburban, and urban landscapes. Along the route, the pipeline would cross seven named waterways — Johnson Creek, Hurricane Creek, Bean Patch Creek, Camp Creek, Short Brook, Camp Creek Canal, and Coldwater Creek — and also pass immediately adjacently to a nearly 5-mile-long wetlands complex that surrounds the Coldwater River. But the natural environment is home to many more waterways than those that have official names on topographic maps. According to FracTracker’s inspection of National Wetlands Inventory data collected by the United States Fish and Wildlife Service, the proposed pipeline crosses or touches 62 streams in 102 separate locations, 25 forested wetlands, an emergent wetland, 17 ponds, and one lake.
Close to the City of Memphis, 0.8 miles of the pipeline would run directly through the Davis Wellfield Wellhead Protection Zone. The proposed pipeline is located over the extraordinary Memphis Sands Aquifer, which provides potable water for more than 400,000 people. Memphis Light, Gas and Water (MLGW) Company pumps water from over 175 artesian wells in Shelby County, Tennessee, alone—right in the path of the pipeline route. The aquifer itself is a sensitive resource, already under demand by the human population of the area, as well as many industries such as breweries and as a supply of cooling water for a nearby power plant.
Memphis Sands Aquifer is part of the larger Middle Claiborne Aquifer, a groundwater and geological unit in the lower Mississippi drainage. Technically speaking, the Memphis Sands portion of the aquifer is located in Tennessee, but is continuous with the Sparta Sands Aquifer, located in Mississippi. In the eastern portion of the Byhalia Connection’s proposed route, wetlands along Coldwater River are directly part of the recharge zone of this aquifer.
To learn more about the hydrologic features that may be impacted by the proposed Byhalia Connection Pipeline, explore our interactive map. When this map is viewed full-size, you can choose to view additional layers from the drop-down Layers menu.
View Full Screen | Last updated March 2021
The Memphis Sands Aquifer lies 350 to 1000 feet under Memphis (see Figure 1), and spans an area of 7500 square miles, roughly the size of Lake Ontario. “It’s one of the best (aquifers) in the world in terms of thickness, aerial content, quality of water”, according to Roy Van Arsdale, Professor of Geology at University of Memphis. Under Shelby County alone — where Memphis is located — the aquifer contains approximately 58 trillion gallons of clean water. Over time, the aquifer has seen threats from overpumping, as the population of Memphis grew. In addition, industrial pollution has turned up in some samples, including cancer-causing benzene. Policy protections on the aquifer have been lacking, although there is increasingly vocal public awareness about the need for more comprehensive groundwater resource protection in the area.
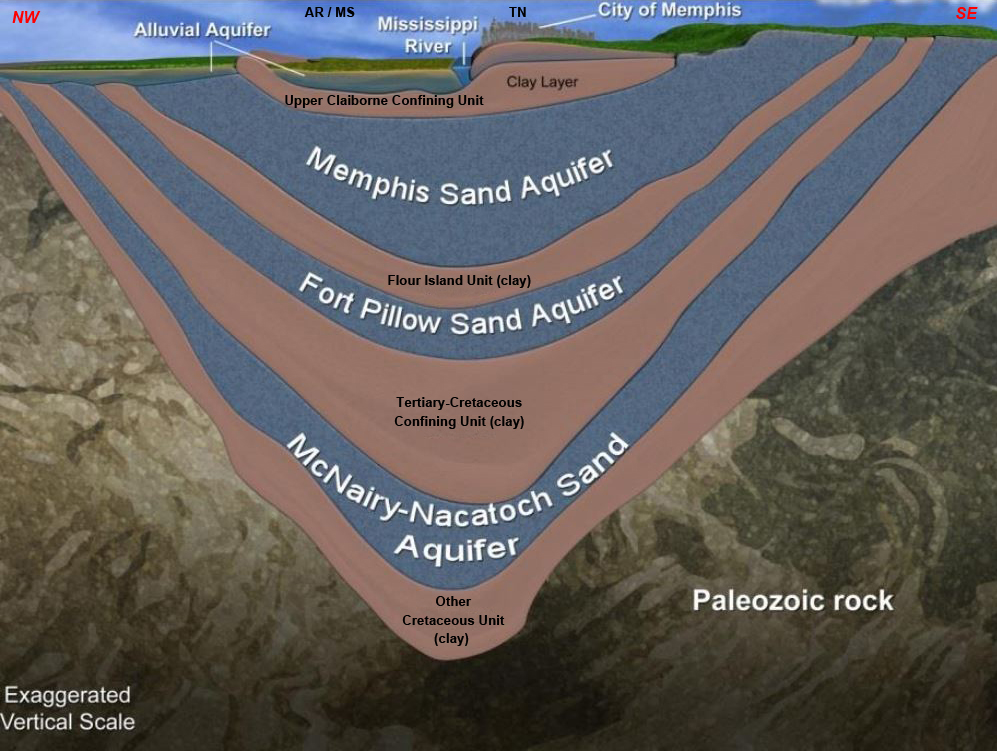
Figure 1. Cross-section of aquifers under Memphis, TN. Graphic modified from here.
Although water withdrawals from the aquifer have declined significantly since 2000 due, in part, to more water-efficient household appliances that reduce demand in comparison with older models, the MLGW pumped 126 million gallons a day from the aquifer in 2015. Consequently, the level of the aquifer has been rising in recent years, as the rate of recharge has exceeded use.
The courts have suggested that the water in the aquifer is an intrastate resource, and that therefore, Mississippi cannot have sole governance over the extraction of the water within its state boundaries. Instead, usage should be through “equitable apportionment.” Further arguments are still pending, as of late 2020. In short, as Figure 1 shows, withdrawal and recharge of the aquifer do not respect state boundaries.
The details of water law, and who can tap into these, and other deep, ancient aquifers, are complex questions in which agriculture, ecology, geology, and technology bump up against each other. All of these interests, not to mention human health, could be heavily impacted by a crude oil pipeline rupture or other accident that resulted in contamination of this groundwater resource.
Crude oil spills release a panoply of volatile organic compounds into the air and water that are extremely harmful to human and environmental health. These include benzene, ethylbenzene, toluene, and xylene. Polycyclic aromatic hydrocarbons (PAHs), such as carcinogenic benzo[a]pyrene, are also released. In addition, if the oil combusts, hydrogen sulfide gas, as well as heavy metals, including nickel, mercury, and cadmium, will become airborne.
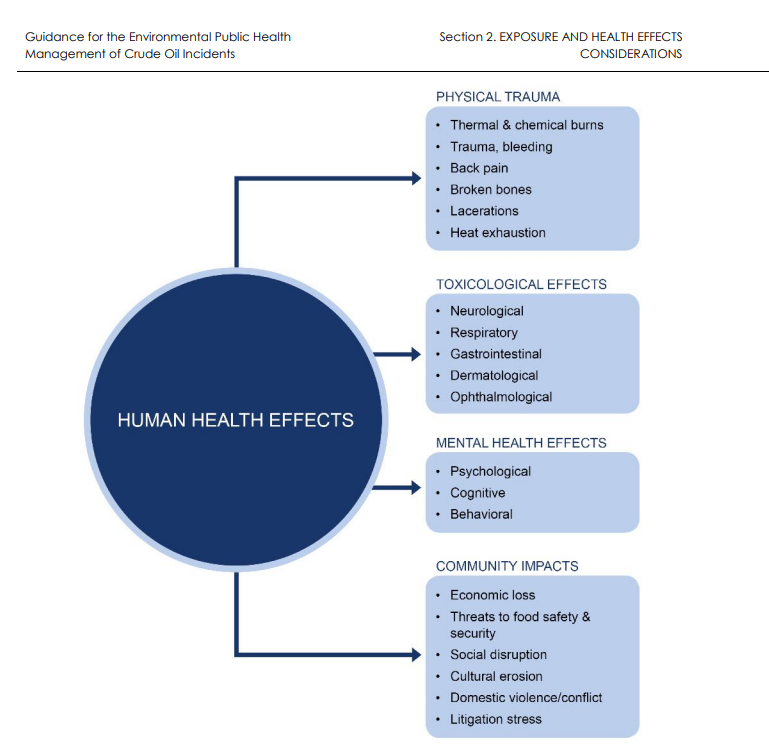
Figure 2. Observed/documented oil spill-induced acute and chronic human health effects. Source: Guidance for the Environmental Public Health Management of Crude Oil Incidents, Health Canada (2018).
The take-away is that crude oil spills from pipelines are not uncommon, result in environmental damage, impacts on the health and safety of workers and nearby residents. Most importantly, despite monitoring and inspections, pipelines fail. A partial list of pipeline failures is shown in the sidebar.
Within the 2-mile buffer of the pipeline, there are 20 facilities that the United States Environmental Protection Agency (US EPA) lists in its Toxic Release Inventory (TRI), including several chemical plants associated with hydrocarbon extraction. Carcinogens such as polycyclic aromatic compounds, benzene, styrene, dioxins, and naphthalene are just a few of the compounds produced by facilities owned by Valero Energy Corporation, Drexel Chemical Company, and other companies within the 2-mile buffer zone of the pipeline, which compound the risks to the populations there. In addition, while the TRI lists exposure to toluene and xylene from these facilities, neither are categorized by EPA’s TRI database as a carcinogen due to a lack of data; however, their deleterious impacts on the central nervous system are undeniable, and well- documented (see examples here and here).
View Full Screen | Updated March, 2021
In this interactive map, you can see sites in the proposed Byhalia Connection route that are listed in the TRI, as well as civic facilities like schools, daycare centers, and health care facilities. When this map is viewed full-size, you can choose to view additional layers from the drop-down Layers menu.
The most active seismic fault line in the eastern United States — the New Madrid Fault — is located about 40 miles from one end of the proposed pipeline (see Figure 2). The last major earthquakes along this fault line occurred in 1811 and 1812. Although the current Richter scale was not in use at that time, first quake in mid-December 1811 was estimated to have had a magnitude of between 7.2 and 8.2, and was followed by an aftershock of about 7.4. In January and February of 1812, there were additional earthquakes of this magnitude. Obviously, at this time in history, there was relatively sparse population in the area, and little infrastructure. Were such a quake to occur today, the outcomes would be catastrophic.
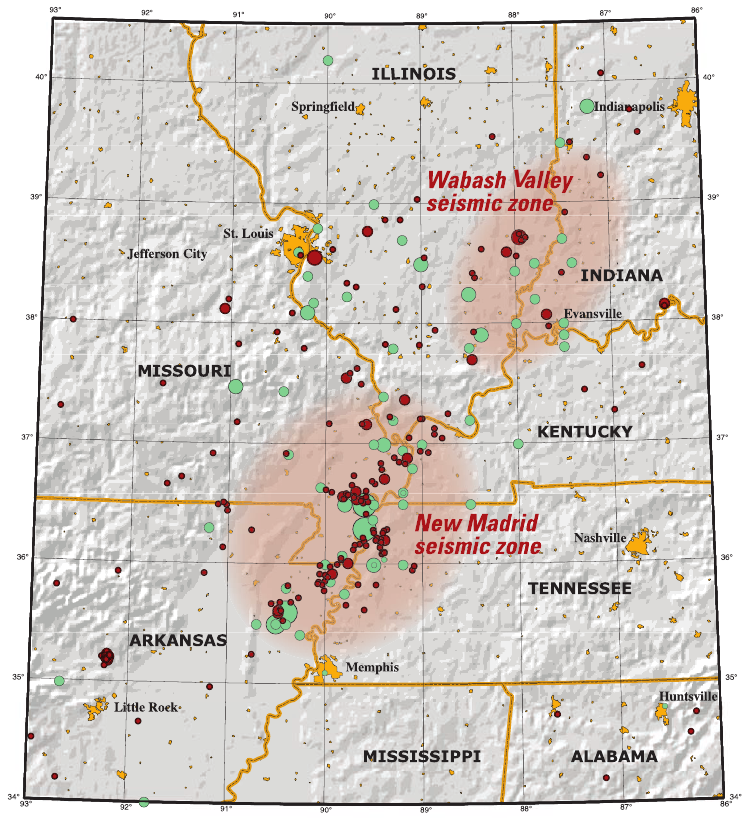
Figure 3: New Madrid Seismic Zone. Source: United States Geological Survey
According to a Wikipedia entry, “[i]n October 2009, a team composed of University of Illinois and Virginia Tech researchers headed by Amr S. Elnashai, funded by the Federal Emergency Management Agency, considered a scenario where all three segments of the New Madrid fault ruptured simultaneously with a total earthquake magnitude of 7.7. The report found that there would be significant damage in the eight states studied – Alabama, Arkansas, Illinois, Indiana, Kentucky, Mississippi, Missouri, and Tennessee – with the probability of additional damage in states farther from the New Madrid Seismic Zone. Tennessee, Arkansas, and Missouri would be most severely impacted, and the cities of Memphis, Tennessee, and St. Louis, Missouri, would be severely damaged. The report estimated 86,000 casualties, including 3,500 fatalities, 715,000 damaged buildings, and 7.2 million people displaced, with two million of those seeking shelter, primarily due to the lack of utility services. Direct economic losses, according to the report, would be at least $300 billion.” Source: University of Illinois report]
Another article on the New Madrid fault added that “….the US Geological Survey and the University of Memphis Center for Earthquake Research estimate there’s a 7 to 10 percent chance of a major quake — one with a magnitude between 7.5 and 8.0 — occurring in the region in the next 50 years….’ The scope is about as big as you could possibly have,’ said Jonathon Monken, director of the Illinois Emergency Management Agency and chairman of the Central U.S. Earthquake Consortium… ‘Putting it in a purely financial context, Hurricane Katrina was a $106 billion disaster. We estimate this would be a $300 billion disaster, the worst in the history of the United States.’”
Earthquake damage to pipelines can occur from movement on the fault itself, soil liquefaction, uplift, and landslides, resulting in potentially catastrophic situations. Engineering solutions to minimize or prevent seismic damage to pipelines do exist. These solutions must be part of the overall pipeline design, however. For example, the Trans-Alaska oil pipeline was constructed with considerations for earthquake impacts in mind. For more information, read about the solution that was implemented there.
This map shows the New Madrid seismic zone in the context of the proposed Byhalia Connection Pipeline. When this map is viewed full-size, you can choose to view additional layers from the drop-down Layers menu.
View Full Screen | Updated March 2021
As eloquently reported in a series of articles in mlk50.com, the siting of the Byhalia Connection Pipeline is not only an issue environmental tied with the natural environment. This is very much an issue of environmental justice, as well. Many of the census blocks along the proposed, preferred route of the pipeline, are 99% Black. Boxtown, a community in southwest Memphis is one of places, and already has a long history of impacts by environmental contamination from the dozens of industries that operate there. Toxic waste from coal power plants includes heavy metals and radioactive materials.
The pipeline route from Memphis to its terminus in Mississippi takes a circuitous route, avoiding wealthier parts of the city and its suburbs, but goes directly through low-income areas, some of which are inhabited by a nearly 100% Black population.
FracTracker looked at US Census data along the pipeline route, and calculated a half-mile (minimum recommended) and two-mile buffer zone from the pipeline right-of-way to consider populations that might be impacted in the case of an accident.
Explore the the demographics along the proposed Byhalia Connection Pipeline route. When this map is viewed full-size, you can choose to view additional layers from the drop-down Layers menu, such as the non-white population ration along the proposed pipeline route.
View Full Screen | Updated March 2021
There are 15,000 people living in the immediate evacuation zone of a half mile from the pipeline. In some parts of South Memphis, within this half-mile evacuation zone, population density is above 4,000 people per square mile, and the Black population approaches 100%. Within a two mile distance, the number climbs to over 76,000. Depending on the direction of the wind, a crude oil-induced fire could spew dangerous levels of volatile organic compounds through the air towards these populations. The disproportional risks to minority and low-income populations make the location of this pipeline — undeniably — an issue of environmental justice.
| Demographic | Within ½ mile of Byhalia Connection Pipeline | Within 2 miles of Byhalia Connection Pipeline |
| Total population | 15,041 | 76,016 |
| Non-white population | 7204 (48%, although some parts of South Memphis are 99+%) | 27,548 (36%, although some parts of South Memphis are 99+%) |
| Low income population | 4272 (28%, although some parts of South Memphis are 90+%) | 43,486(57%, although some parts of South Memphis are 90+%) |
Table 1: Population demographics along the proposed Byhalia Connection pipeline corridor.
Key civic facilities are also located within the half-mile evacuation zone of the pipeline. Were a disaster to occur, would the schools, childcare centers and medical facilities be able to successfully usher their residents and students to safety? Would they have had regular safety trainings to prepare them for this possibility?
| Facility | Within ½ mile of pipeline | Within 2 miles of pipeline |
| Child care | 4 (one within 800 feet) | 30 |
| Public school | 2 (one within 800 feet) | 26 |
| EMS | 2 | 11 |
| Hospital | 0 | 1 |
| Private school | 0 | 1 |
Table 2: Facilities along the proposed Byhalia Connection pipeline corridor (also shown in the interactive map here).
Former Vice President Al Gore voiced his opposition to the Byhalia Connection and put Memphis elected officials on notice during a rally against the pipeline on March 14, 2021.
Source: Article in commercialappeal.com
“Why is it that 64% of the polluting facilities of these pipeline communities are located in or adjacent to Black communities? Why is it that the cancer rate in SW Memphis four times higher than the national average? Why is it that Black children suffer from asthma three times more than white children? Why is it that the death rate from asthma for Black children is ten times higher than for white children?” – Former Vice President Al Gore
And two days later, on March 16th, the Memphis City Council unanimously approved a resolution that opposes the Byhalia Connection Pipeline project.
Approximately 300 property owners adjacent to the pipeline have already accepted monetary compensation to abandon their homes or sell property easements to make way for the pipeline. If a landowner refuses payment offered by the pipeline company for a property easement — often far under market value — the company can take the landowner to court, and seize the property (or portion of it) with no requirement of compensation. Although a majority of property owners accepted the terms of the easements drawn up by Byhalia’s developers, at least 14 did not. When numerous owners refused, nine properties were targeted for taking by eminent domain, and sued by the pipeline company. The Southern Environmental Law Center (SELC) is defending many of these property owners, claiming that the seizures — regardless of whether they are temporary or permanent — do not comply with the criteria of meeting a public good. The oil being transported in the proposed pipeline is entirely bound for export.
“The pipeline company is not created by, affiliated with or owned by the government, and the general public would have no access to the proposed crude oil pipeline… So, there is no ‘public use’ justifying the use of the condemnation power as required by Tennessee law,” said one of SELC’s attorneys. In addition, SELC has cited the illegality of the pipeline route because it runs through the municipal wellfield, and therefore violates permits issued by the Army Corps of Engineers. The Army Corp was still considering this request, as of mid-January 2021.
Furthermore, the eminent domain targeting of land owned by Black Americans in the south is a pointed question of racial justice. Historically, black and brown people throughout the United States have had far lower levels of home ownership than whites. This gap is most pronounced in lower income areas.
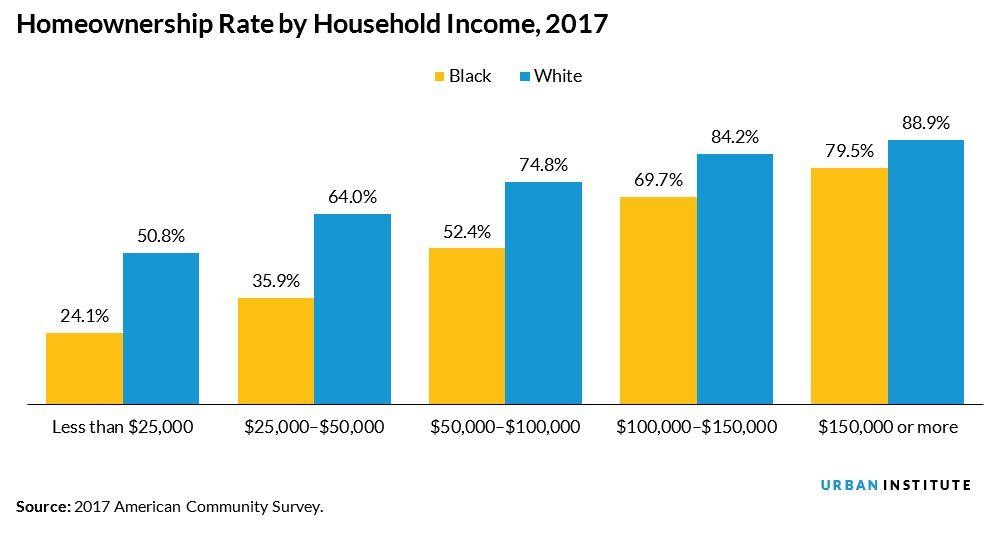
Figure 5: Homeownership rate in the US, by household income (2017). Source: The Urban Institute.
“The 71.9 percent white homeownership rate in 2017 represented a 0.7 percentage point decline since 2010, and the 41.8 percent black homeownership rate represented a 2.7 percentage point decline during that same period. The 30.1 percentage point gap is wider than it was when race-based discrimination against homebuyers was legal.” The Urban Institute
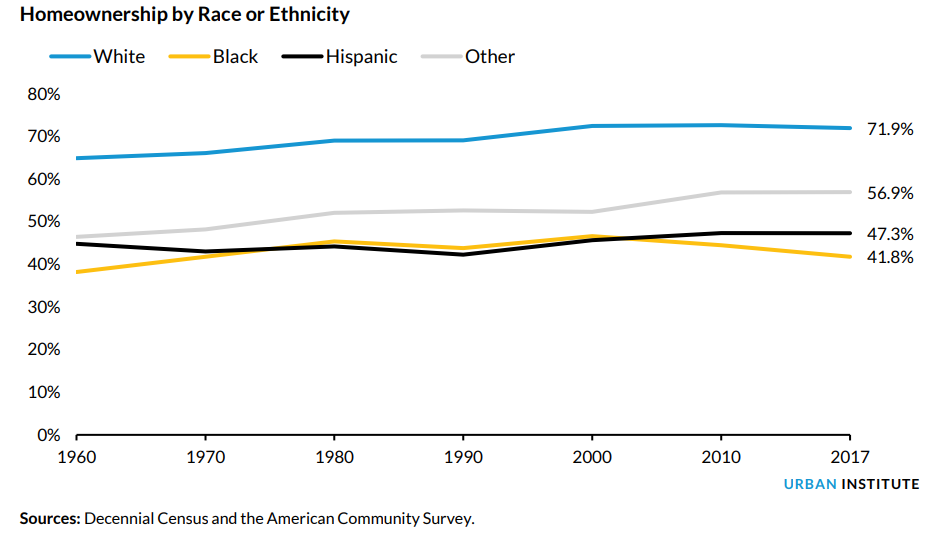
Figure 6: Homeownership in the US by race or ethnicity. Source: The Urban Institute.
Losing land to eminent domain represents a loss of control for a landowner — white or black. But the loss is especially unjust when a property may have been so hard won, and sometimes the result of a multi-generational lineage of ownership, as is the case for many properties along the Byhalia right-of-way.
FracTracker has created an interactive map showing the locations of crude oil spills across the United States between 2010 and 2021, using the most up-to-date information from PHMSA, the Pipeline and Hazardous Materials Safety Administration.
View Full Screen | Updated March, 2021
You can also read more about a wider diversity of hazardous liquid materials accidents analyzed by FracTracker in an article from February 2020, entitled “Pipelines Continue to Catch Fire and Explode”.
A 2020 research paper states, “Modeling and analysis of a catastrophic oil spill and vapor cloud explosion in a confined space upon oil pipeline leaking” provides a stark example of the damage done from the leak and explosion of a crude oil pipeline operating at a third of the pressure proposed for Byhalia.
“It is obvious that the explosion caused big damages to the adjacent buildings, roads, and public structures. Moreover, the explosion, combustion, and the shock wave caused injuries and deaths of workers, pedestrians, and residents. The total affected zone spread nearly 5 km [3.1 miles].”
Note: The oil pipeline shown in Shengzhu, Xu, et al.’s paper in was 28 inches in diameter, and operating at a pressure of between 400 and 660 psi. A vapor cloud from the spill into a municipal drainage area caused this explosion, which killed 62 people and injured 136 in November 2013. The 24-inch, proposed Byhalia pipeline would operate at triple the pressure of the pipeline shown in these photos of its explosion.
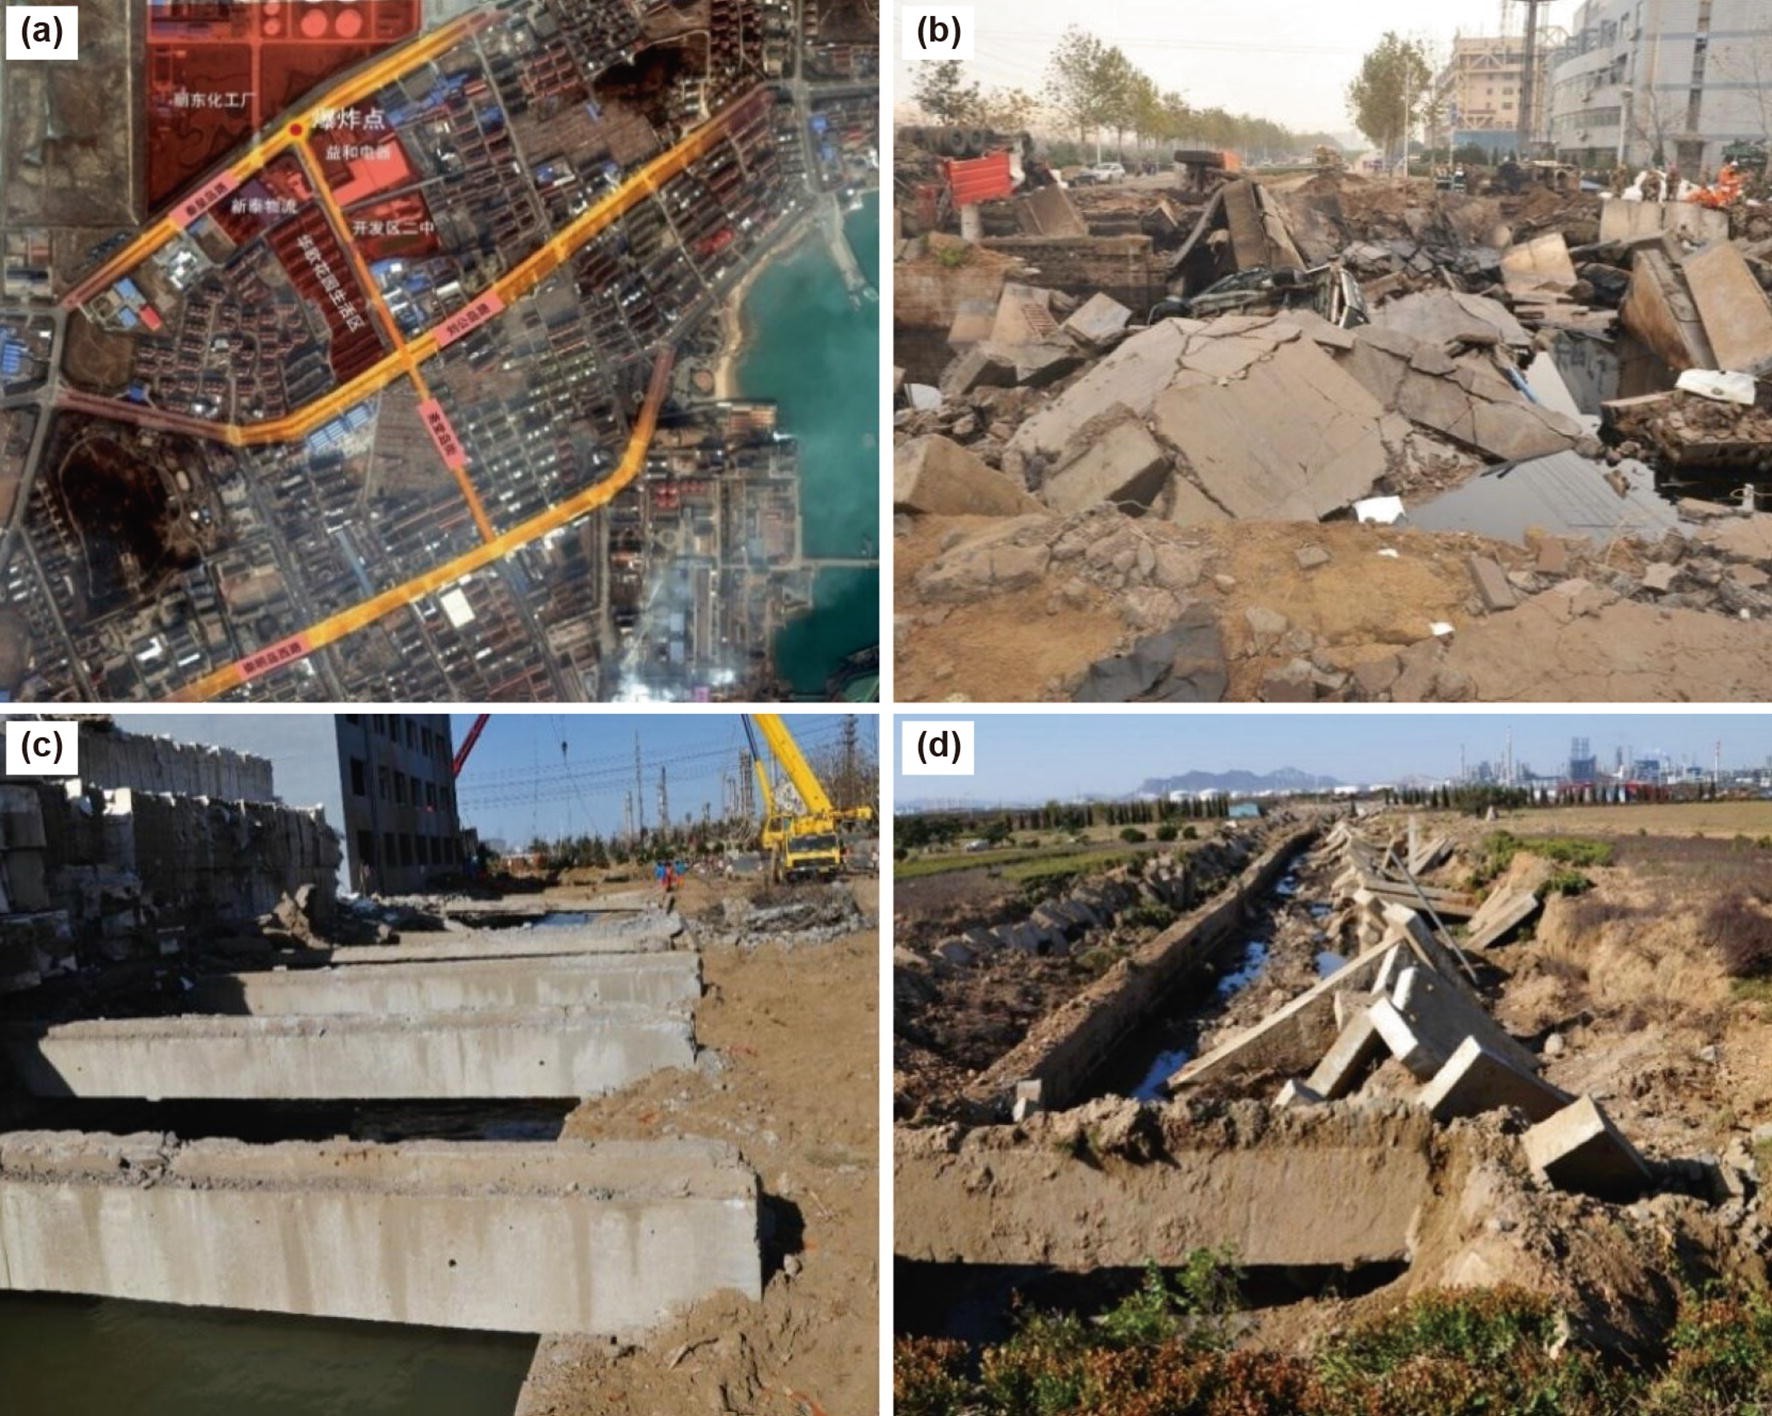
(a) bird’s eye view of the location of the explosion point, (b) scene of the oil spill point after explosion, (c) scene of the nearby street, (d) scene of the drainage of the adjacent plant.
Figure 7: Scene of an oil pipeline explosion site in China. (a) bird’s eye view of the location of the explosion point, (b) scene of the oil spill point after explosion, (c) scene of the nearby street, (d) scene of the drainage of the adjacent plant. Image from Shengzhu, Xu, et al.
Health Canada published the information document Guidance on the Management of Crude Oil Incidents (2018), which details important information about how to deal with crude oil spills. Here are checklists on whether to evacuate or shelter in place and information on determining protective zone distances, particularly downwind of a spill from the 2016 Emergency Response Guidebook.
In case of a large spill: Consider initial downwind evacuation for at least 300 meters (1000 feet).
In case of a fire: If tank, rail car or tank truck is involved in a fire, ISOLATE for 800 meters (1/2 mile) in all directions; also, consider initial evacuation for 800 meters (1/2 mile) in all directions. Source: Petroleum crude oil hazards


The Byhalia Connection Pipeline is receiving considerable scrutiny, both from media sources like the Memphis Daily News and MLK50, as well as advocacy groups including Sierra Club’s Tennessee Chapter, the Southern Environmental Law Center, Memphis Community Against the Pipeline, and Protect Our Aquifer. In a move considered egregious by a vast swath of stakeholders, in early February 2021, the US Army Corps of Engineers approved a Nationwide 12 permit to fast-track the Byhalia project, effectively cutting out public comment from the process, and lightening the environmental review requirements. Because the project touches vulnerabilities in the intersection of environment, economics, health, safety, and social justice, this discussion is not likely to easily recede into the background, despite placating claims by the companies that are poised to profit.
Protests are ongoing, and just recently, on February 22, 2021, United States Congressional Representative Steve Cohen sent a direct appeal to President Biden to revoke a key permit for Byhalia, directly citing the burden the pipeline would impose on long-suffering Black neighborhoods in South Memphis. Simultaneously, the Public Works Department of Memphis is considering a resolution condemning the pipeline, and asking the Memphis Light, Gas, and Water Division to oppose the project.
This story will undoubtedly continue to evolve in the upcoming months.
Regardless of where a pipeline is sited, there are inevitably risks to the environment, and to human communities living nearby. The proposed Byhalia Connection pipeline project is situated in a particularly problematic intersection where environmental justice, hydrology, geology, and risks to human and environmental health intersect. Without taking all of these factors into consideration, a potentially catastrophic cascade of impacts may ensue. Engagement and resistance to the project by the residents in the area, as well as support by advocacy groups, will hopefully result in comprehensive consideration of all the risks. Time will tell whether the project is modified, or simply defeated.
MLK50.com maintains an archive of excellent reading materials on this controversial project that can be found here.
For the past four decades, groups of Alaska Natives including the Gwich’in and Iñupiat, international institutions including the United Nations and the Inter-American Commission on Human Rights, the US government, the state of Alaska, and environmental groups have debated whether or not oil extraction should be allowed in the Arctic National Wildlife Refuge (ANWR).
Made up of 19.3 million acres in northeastern Alaska, ANWR is an area with great cultural significance and ecological richness. Fossil fuel extraction poses significant material, reputational, and human rights risks according to the Gwich’in Steering Committee, a group formed in 1988 in response to proposals to drill for oil in the coastal plain of ANWR, or what they call the Sacred Place Where All Life Begins, Iizhik Gwats’an Gwandaii Goodlit.
In the past few months, the Trump administration issued nine leases, the first ever in the Arctic refuge’s coastal plain, even as major oil companies skipped out on bidding in the area and all major U.S. and Canadian banks pledged not to fund fossil fuel development in the Refuge. The sale was a major flop, which points to the larger movement away from fossil fuels, an inevitable transition reinforced by President Joe Biden’s 60-day moratorium on oil and gas leasing on federal lands.
But despite efforts to protect ANWR, leases that went through under the Trump administration threaten to further violate human rights and damage wildlife.
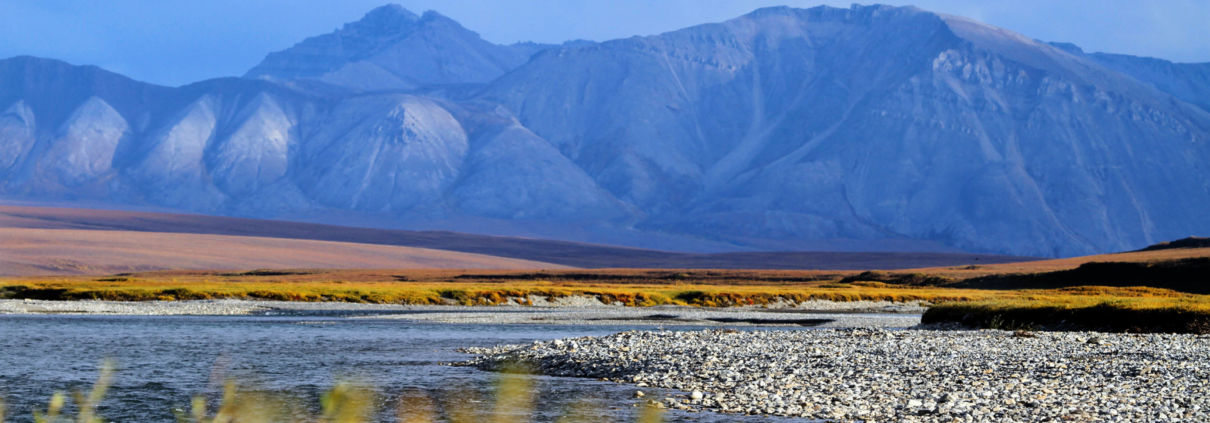
Described as “North America’s Serengeti,” ANWR is the continent’s most intact and remote wilderness environment, a landscape of fragile tundra ecosystems and diverse wildlife. The Refuge is home to more than 40 fish and mammal species and over 200 bird species. Though harsh, the landscape exists in a delicate balance. Specially-adapted plant species thrive during long winters and short growing seasons, supporting annual wildlife migrations and hibernations, ecosystem functions, and a wealth of natural resources.
Of particular significance is Area 1002, mapped in Figure 2 below. The 1.5-million-acre area site within ANWR sits between the north slope of the Brooks Range in Alaska and the Beaufort Sea, and is the summer calving and feeding site of the Porcupine caribou, and a site sacred to the Gwich’in Tribe.
The Porcupine caribou herd has travelled the 1,500-mile trek, the longest documented terrestrial mammal migration in the world, to gather there for at least the past 23,000 years.
The herd is one of the area’s keystone species (i.e., if it were removed from the ecosystem, the landscape’s functional integrity would suffer and drastically change). The 125,000-strong herd plays a key ecological and cultural role in the Refuge, and the distribution and health of the herd is a direct indicator of the health of the entire ecosystem. Their annual journey provides them with good forage and relief from predators and mosquitos.
Oil and gas development could interfere with the Caribou herd’s migrations as industrial disturbances discourage the instinctual movements of pregnant and nursing caribou mothers – especially problematic given their slow reproductive rate – and could diminish the population.
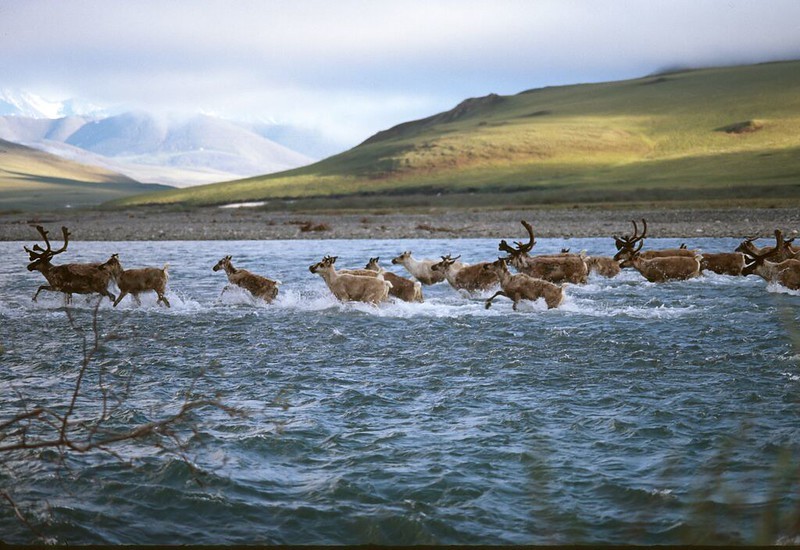
The Porcupine caribou herd in the Arctic National Wildlife Refuge (ANWR), Alaska. Photo courtesy of NWF Blogs, 2015.
ANWR is also the site of oil fields, estimated by the US Geologic Survey in 2001 to contain between 11.6 to 31.5 billion barrels of oil (BBO) versus the 1987 estimate of 4.8 to 29.4 BBO, (95- and 5-percent probabilities) and mean values are 20.7 BBO versus 13.8 BBO (current assessment compared to 1998 assessment). and natural gas liquids (NGLs).
Opponents of drilling in the Arctic – including Indigenous groups, environmental organizations, and scientists – say these figures are outdated and that environmental and public health risks far outweigh any revenue. Proponents claim drilling here would significantly reduce prices and US foreign oil dependence, but such assertions are highly suspect. Market projections have shown that oil and gas exploration and production in ANWR’s North Slope would not increase US energy security or lower gas prices. Resource uncertainty and decreasing demand for fossil fuels nationally reveal a market that lures fewer and fewer investors.
For millennia, the northern Alaskan alpine tundra has been home to Native communities – including the Gwich’in, Hare, Iñupiaq, and Koyukon, who have a legacy of living sustainably in this complex, fragile, and sometimes very demanding, environment (see Figure 1). The health and wellbeing of these communities is intricately tied to the health of the environment surrounding them.
Along Alaska’s coast, outside of ANWR between Prudhoe Bay and Barrow (Utqiagvik) where oil and gas extraction is happening already, the current environmental damage from oil and gas extraction is undeniable. Extractive activities have disconnected wildlife corridors and negatively affected subsistence hunting, and the local tourism industry oriented around polar bear and whale viewing opportunities has suffered.
Though the issue has divided Alaskan communities, all those living in and around ANWR will likely face challenges borne of further oil and gas development.
Alaska’s Native peoples have led a decades-long fight to protect the area from unsustainable oil and gas development. This industry brought jobs, but introduced significant change to the way of life on the North Slope of the Athabaskan Gwazhał (Brook’s Mountain Range). Corporate profit has, in some locations, superseded the rights for health and safety of the Native people of this region.
This map shows the Arctic National Wildlife Refuge in the context of oil fields; Native Alaskan language groups in Alaska and eastward into Canada; along with the habitats of the Central Arctic, Western Arctic, and Porcupine caribou herd — a species held sacred by the Gwich’in people. Please note that the Native Alaskan language group territories should be interpreted somewhat loosely, as it’s difficult to estimate the precise location and distinction between groups. See Figure 2 for a detailed map of the oil fields.

Figure 1: Language groups and natural features of the North Slope of Alaska, FracTracker Alliance, January 2021. Language boundaries were taken from the Alaskan Native Language Center, and data from Alaska DCRA Data. Boundaries of these caribou herds are fluid, and may change from year to year. Caribou herd boundaries digitized by FracTracker from compiled images compiled from U.S. Fish and Wildlife Service, Western Arctic Caribou Herd Working Group, and Wikipedia. Oil and gas area boundaries digitized by FracTracker from compiled images from North Slope Borough: Department of Planning & Community Services, and the U.S. Geological Survey (USGS). Alaska ecoregions (including Coastal Plain) from USGS (link is a direct data download).
President Trump claimed that the January 6, 2021, lease sale’s potential revenue would offset the costs of major 2017 tax cuts.
But pressure from drilling opponents – including Alaskan Natives, environmental activists, and scientists – a global recession, low oil prices, and waning faith and interest in the oil and gas sector curbed expected lease sales. Major oil companies chose to forego the auction – a sale that US banks (and some Canadian institutions) refused to bankroll. The auction received only three bidders – one of which was the State of Alaska – and generated only a fraction of the revenue it was projected to raise. Half of the parcels drew no bidders at all.
This map shows parcels purchased by three entities during the January 6, 2021 lease sale in Area 1002, a site of particular cultural and ecological importance within ANWR.

Figure 2: Results of the January 6, 2021 oil and gas lease sale in Area 1002, FracTracker Alliance, January 2021. Data layer for oil and gas lease area digitized by Karen Edelstein using a Bureau of Land Management map.
Despite the lukewarm response, the BLM received 13 bids on 11 lease tracts (symbolized in Figure 2, above, with diagonal red lines). This area spans 437,804 acres, is valued at a little over 14.4 million dollars and is estimated to contain eight billion barrels of recoverable oil.
Knik Arm Services and Regenerate Alaska each secured one parcel. Half of the sale’s revenue will go to the federal government, and half will go to the State of Alaska. The leases auctioned off are renewable and active for ten years. The BLM announced on January 19 that it signed and issued leases on nine of the 11 tracts. View the record of lease sales here.
The Trump Administration’s leasing decision followed 40 years of gridlock over oil and gas exploration and drilling in one of the nation’s most pristine environments. The timeline below outlines major developments in the struggle to protect ANWR:
1960: President Dwight Eisenhower establishes an 8.9-million-acre expanse in Alaska’s tundra as the nation’s first ecosystem-scale conservation area, specifically for its “unique wildlife, wilderness, and recreational values.”
1972: The Arctic Slope Regional Corporation (ASRC) was recognized under the Alaska Native Claims Settlement Act, which transferred 44 million acres to Indigenous control and instigated the creation of 12 regional, private, for-profit companies intended to represent and protect Indigenous business interests and their ownership of the land and its resources.
1977: Margaret Murie, American naturalist, author, adventurer, and conservationist and recipient of the Presidential Medal of Freedom stood before Congress on behalf of the Arctic National Wildlife Refuge, testifying to why we must defend our last wild places.
1980: President Jimmy Carter signs into law the Alaska National Interest Lands Conservation Act (ANICLA), which expands the protected area to 19.3 million acres and renames it the Arctic National Wildlife Refuge (ANWR). The Act mandates that potential oil reserves in the 1.5-million-acre Coastal Plain be considered for development only with Congress’ authorization.
1987: Under President Ronald Reagan, an Environmental Impact Statement (EIS) for ANWR’s oil and gas exploration is drafted, and the US Department of Interior recommends Congress open the Coastal Plain for exploration.
2002 – 2003: During President George W. Bush’s Administration, the House repeatedly approves drilling in ANWR – only to be met with the Senate’s rejection.
2012: The Gwich’in people present and defend a Resolution to Protect the Birthplace and Nursery Grounds of the Porcupine Caribou Herd to Congress and the President. The Resolution recognizes and affirms their right to continue and protect their way of life and the protection of the caribou they revere and depend on.
2015: President Barack Obama’s Administration releases the U.S. Fish & Wildlife Service’s Comprehensive Conservation Plan for ANWR, calling for core areas – including the Coastal Plain – to be designated as wilderness, the highest level of protection for public lands.
2017: Following House instructions, the Senate Energy & Natural Resources Committee legislates $1 billion in revenue creation between 2018 – 2027, and to that end, passes an ANWR drilling provision. President Donald Trump signs the bill into law through the Tax Cuts & Jobs Act, which makes several significant changes to individual income tax and — notably – mandates energy and job creation and economic growth for future generations, through which the Trump Administration and Republican lawmakers advance fossil fuel industry expansion. The law includes the ANWR lease provision as a way to generate revenue to offset the associated tax cuts, in turn opening up the Coastal Plain to drilling.
April, 2018: Gwich’in Council International (GCI) publishes Impact Assessment in the Arctic: Emerging Practices of Indigenous-led Review, identifying the strategic approaches Indigenous governments are taking as they lead their own major project assessment.
“Gwich’in Council International (GCI) represents 9,000 Gwich’in in the Northwest Territories (NWT), Yukon, and Alaska as a Permanent Participant in the Arctic Council; the only international organization where Indigenous peoples have a seat at the decision-making table alongside national governments. GCI supports Gwich’in by amplifying our voice on sustainable development and the environment at the international level to support resilient and healthy communities.”
December, 2018: The Trump administration’s Bureau of Land Management (BLM) released a draft environmental impact statement (DEIS) for oil and gas leasing in ANWR. Many opposed the DEIS as a violation of indigenous rights. The Center for American Progress analyzed public opinion concerning drilling in the refuge and found that an overwhelmingly majority opposed to drilling the refuge. Of the 1 million comments submitted in response to the draft EIS, 99 percent opposed the proposed oil and gas activity.
March 26, 2019: Gwich’in leaders from across the United States and Canada were joined by faith leaders, scientists, and veterans to stand before Congress and testify on behalf of the Arctic National Wildlife Refuge and its coastal plain, and to support passage of The Arctic Cultural and Coastal Plain Protection Act. Witnesses included Ms. Bernadette Demientieff, Executive Director, Gwich’in Steering Committee; The Honorable Galen GilbertChief, Arctic Village Council; The Honorable Dana Tizya-Tramm, Chief, Vuntut Gwitchin First Nation; The Honorable Victor Joseph, Chief/Chairman, Tanana Chiefs Conferece; Mr. Sam Alexander, Board Member, Gwich’in Council International; Mr. Fenton Rexford, Advisor to the Mayor of the North Slope Borough, Tribal Member, Native Village of Kaktovik; Rev. Mark Lattime, Bishop of Alaska, The Episcopal Church; Dr. Steven Amstrup, Chief Scientist, Polar Bears International; Mr. Chad Brown, Founder, Soul River, Inc.; Mr. Richard Glenn, Executive Vice President, External Affairs, Arctic Slope Regional Corporation; Mr. Matthew Rexford, Tribal Adminisrator, Native Village of Kaktovik.
October 2019: The Gwich’in Steering Committee, Cultural Survival, Land is Life, First Peoples Worldwide, and the American Indian Law Clinic at the University of Colorado submitted a report to the the United Nations Human Rights Council. In the report, “Observations on the State of Indigenous Human Rights in the United States of America,” groups state that “The government of the United States has repeatedly failed to protect the human rights of the Gwich’in by aggressively pursuing oil and gas development in the Coastal Plain of the Arctic National Wildlife Refuge without first obtaining the Free, Prior and Informed Consent of the Gwich’in Nation.”
September 2020: Fifteen states sue the Trump Administration over drilling in ANWR, and two more lawsuits from environmental and social justice organizations and Indigenous groups assert that oil operations would violate the rights of Indigenous populations and threaten the landscape and wildlife it sustains. BLM withdraws approximately 460,000 acres from the plan after extensive comment and protest from Alaskan Natives, environmental nonprofit organizations, and the Canadian government, though the majority of the leases remain on the table.
In the same month, the U.S. Department of the Interior (DOI) released the Final Environmental Impact Statement (EIS) for the Coastal Plain Oil and Gas Leasing Program. Its release was a clear suppression of science and public opinion.
U.S. Secretary of the Interior David Bernhardt made the following dubious claims: “Affordable energy and great paying energy jobs help power our nation’s economy, which is clearly thriving under President Trump’s policies,” stated. After rigorous review, robust public comment, and a consideration of a range of alternatives, today’s announcement is a big step to carry out the clear mandate we received from Congress to develop and implement a leasing program for the Coastal Plain, a program the people of Alaska have been seeking for over 40 years.”
December 2020: The Gwich’in Steering Committee, including Tribal Governments and Village Councils, and more than a dozen conservation groups seek a temporary restraining order and preliminary injunction prohibiting Trump from approving and issuing oil and gas leases along the Coastal Plain. The filing asserts that it is well-known and documented that seismic exploration would cause irreparable harm to the landscape, its biodiversity, and its people, as well as their tribal archaeological and cultural resources – negative impacts that go beyond the lease tracts granted to purchasers, because it promises rights-of-way and easements that breach parcel boundaries.
January 5, 2021: The day before the lease auction, an Alaskan judge denies the lawsuit from Indigenous and environmental groups arguing that the lease sales were based on inadequate, outdated environmental review. The judge claims the group didn’t provide enough evidence of environmental transgressions to warrant an injunction.
“This is bum news but it’s not going to stop us from fighting to protect it,” said Bernadette Demientieff, chair of the Gwich’in Steering Committee that brought the lawsuit. “This is sacred land to the Gwich’in. This is our way of life, and we’re not going to just allow anyone to come in and destroy our way of life, because our children are going to be the ones who have to live with the destruction that they caused.”
January 6, 2021: President Trump opens up the lease sale in a public auction hosted and streamed live on the BLM website.
January 19, 2021: On their last full day in office, the Trump Administration announces it had officially issued oil and gas leases in ANWR. The outgoing administration also tried to push through a law requiring banks to finance many industries, including oil and gas companies and assault weapons manufacturers, that major institutions – counting JP Morgan Chase and Goldman Sachs – announced they would no longer finance.
January 20, 2021: President Joe Biden signed 17 executive orders his first day in office – 30 in the first three days – that reverse several of his predecessor’s environmentally-damaging policies . Biden directed the Secretary of the Interior to “place a temporary moratorium on all activities of the Federal Government relating to the implementation of the Coastal Plain Oil and Gas Leasing Program, as established by the Record of Decision signed August 17, 2020, in the Arctic National Wildlife Refuge. The Secretary shall review the program and, as appropriate and consistent with applicable law, conduct a new, comprehensive analysis of the potential environmental impacts of the oil and gas program.”
Subsequently, the Department of the Interior issued Secretarial Order No. 3395, implementing a 60-day suspension of new oil and gas leasing and drilling permits for federal land and water.
On the same day, one of the preexisting lease holders, 88 Energy, published an update related to its operations on the North Slope of Alaska, stating plans to extract oil from the Coastal Plain by drilling directionally into the land from state land.
The Gwich’in Steering Committee released the following statement in response: “The Gwich’in Steering Committee opposes all forms of development and calls on Regenerate Alaska and its parent company, 88 Energy, to halt its plans.”
January 27, 2021: Biden issues a pause on oil and gas leasing in non-tribal federal lands and offshore waters, which lengthened the 60-day moratorium issued the week prior. He also ordered the creation of an interagency working group to prioritize economic revitalization of communities dependent on fossil fuels, and to focus on transitioning these workers to cleaner energy industries.
“We’re not going to lose jobs; we’re going to create jobs,” Biden said in his remarks about this executive order. Republicans criticized this move, saying it will eliminate jobs and hurt US businesses, but Biden’s order didn’t apply to all permitting. He added, “We’re not going to ban fracking,” a point he emphasized in his 2020 presidential campaign.
Did we miss anything? Let us know if you have important milestones to add to the timeline above!
Despite his plan to temporarily halt oil and gas leasing, Biden has approved at least 31 drilling permits since his inauguration. The Department of the Interior – whose top officials Biden put in charge of oil permitting decisions – states that the order, set to expire March 20, does not equate to a drilling permit freeze and does not apply to tribal lands. However, energy companies are still worried they may not be able to secure permits.
There are a few tactics that Biden can use to delay oil and gas exploration in ANWR, including reopening the Department of Interior’s record of decision (ROD), instituting a bid rejection, or delaying permits that companies need to search for oil and build infrastructure – though it is possible that companies could secure their leases and just wait for the administration to change (in their favor).
But if Biden wants to stick to his plan for a “just energy transition,” and advance his environmental justice, racial equity, and job creation priorities, he has to listen to Alaskan Natives and integrate their interests moving forward. Their input and right to manage their lands must be prioritized.
“We are eager to hear the Biden administration’s plan to replace the economy that it’s brought to a standstill, and look forward to working side-by-side with the President to create new, sustainable solutions,” said Voice of the Arctic Iñupiat (VOICE) President Sayers Tuzroyluk.
Voice of the Arctic Iñupiat is a nonprofit organization and communication network working across North Slope communities to address and participate in legislation, regulations, and government programs to protect their culture, and to ensure natural resource development in a safe and responsible manner.
Biden will also need to prioritize fossil fuel industry workers whose livelihoods are uncertain from his extended moratorium – for people in ANWR, and in other US communities.
Regulatory actions to open ANWR for drilling in ANWR have significant and potentially grievous implications for Alaska’s Native peoples, and do not bode well for Alaska’s air, water, and landscape, and the biodiverse species such as the Porcupine caribou that call it home.
Increased fossil fuel activity will also continue to alter the landscape and hinder its function by disconnecting migration and breeding habitat, disturbing and/or displacing animal populations, threatening their survival, and destroying the delicate ecological balance of the Coastal Plain.
However this issue is resolved, the rights of Alaskan Natives should be foremost in future decision-making and is of utmost importance to the future of their epic lands. Following their leadership, there’s hope that the solution will be equitable for both people and the environment
Gwich’in Steering Committee – The Gwich’in Steering Committee was formed in 1988 in response to proposals to drill for oil in the Sacred Place Where Life Begins, the coastal plain of the Arctic National Wildlife Refuge.
The Gwich’in Place Name and Story Atlas is an interactive Story Map that invites visitors to explore the culture, history, traditional knowledge, and land use of the Gwich’in through Gwich’in place names. The Atlas is the result of more than two decades of collaboration between the Gwich’in Social and Cultural Institute, Gwich’in Elders, and traditional land users living in the Gwich’in Settlement Region communities of Aklavik, Fort McPherson, Inuvik and Tsiigehtchic.
The Gwich’in Elders’ Biographies Research Project is a project of the Gwich’in Social & Cultural Institute’s Department of Cultural Heritage. Researchers interviewed 24 elders from the four Gwich’in communities, and collected their life histories. Many of the elders describe a very traditional lifestyle of moving seasonally on the land, being the last generation to live in this traditional manner. Their stories communicate their love and knowledge of the land, and speak to the importance of family ties, place names, legends, and historical events. They also offer snapshots of the sweeping changes the Gwich’in experienced in the 20th century.
The Right to be Cold is Sheila Watt-Cloutier’s memoir of growing up in Quebec’s Arctic on the front lines of climate change. “It is the story of an Inuk woman finding her place in the world, only to find her native land giving way to the inexorable warming of the planet.” She became one of the most influential Indigenous environmental, cultural, and human rights advocates in the world. She served as the elected Canadian president of the Inuit Circumpolar Council from 1995 to 2002, and in 2002 she was elected its international chair. She launched the world’s first international legal action on climate change through a petition to the Inter-American Commission on Human Rights.
Saqiyuq: Stories from the Lives of Three Inuit Women by Nancy Wachowich, Apphia Agalakti Awa, Rhoda Kaukjak Katsak and Sandra Pikujak Katsak offers a collection of stories from a grandmother, daughter, and granddaughter from the Baffin Island community of Pond Inlet, Nunavut. Saqiyuq is the Inuktitut word for ‘a strong wind that suddenly shifts direction.’ Their stories illustrate the shift in Inuit life from nomadic subsistence hunting to permanent settlement in communities, and offer insight into the “enforced acculturation of the Inuit and the imposition of religious and cultural values useless to Inuit culture.”
A Moral Choice: The Human Rights Implications for the Gwich’in of Drilling in the Arctic National Wildlife Refuge by the Gwich’in Steering Committee, 2005.
Alaskan Natives https://www.alaskan-natives.com/
The Northern Alaska Environmental Center https://northern.org/
Environment America https://environmentamerica.org/blogs/environment-america-blog/ame/our-decades-long-campaign-defend-arctic-national-wildlife-refuge
NRDC https://www.nrdc.org/protect-arctic-national-wildlife-refuge
The Arctic Institute https://www.thearcticinstitute.org/topics/climate-and-environment/
The Arctic Council https://arctic-council.org/en/news/environment-and-climate/
Social | Legislation & Politics | Wildlife & Ecology
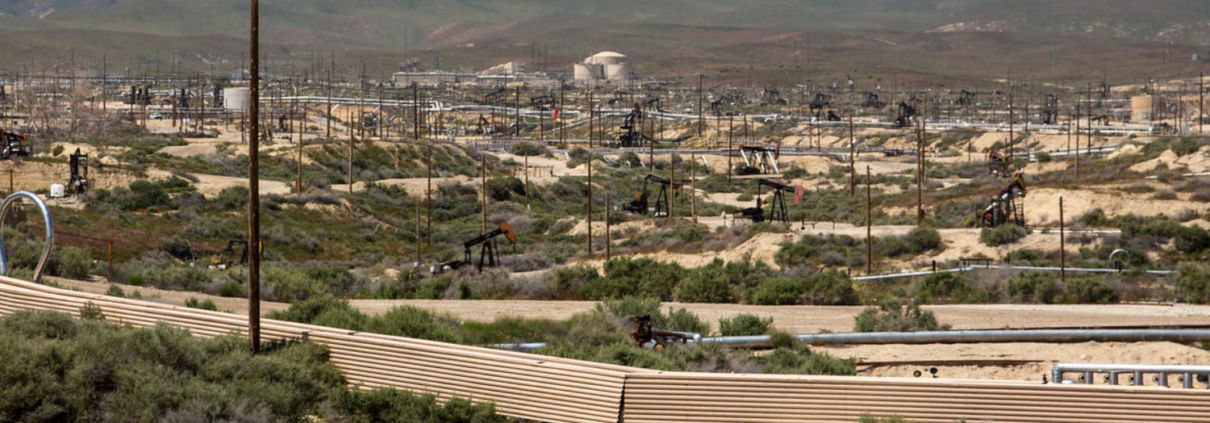
This article focuses on the city of Arvin as an example to show how some Frontline Communities in California are completely surrounded by an unrelenting barrage of carcinogenic and toxic air pollutants from oil and gas wells. Kern County’s proposed environmental impact report (EIR) would streamline the approval of an additional 67,000 new oil and gas wells in the County and thus further degrade air quality. We provide several recommendations for how local and state decision-makers can better protect public health from these serious threats.
Upstream greenhouse-gas and volatile organic compound (VOC) emissions from oil and gas extraction have been drastically under-reported throughout the United States, and California’s emissions regulations for oil and gas production wells are not comprehensive enough to protect Frontline Communities. The contribution of VOCs from the oil and gas extraction sector is responsible for California’s central valley and Kern County communities being exposed to the worst air quality in the country. As carcinogens, air toxics, and precursors to ozone, VOC’s present a myriad of health threats.
The contribution of VOCs from the well-sites in Kern, in addition to the cumulative burden of the Central Valley’s degraded air quality, puts Kern residents at considerable risk. Obvious loopholes in the California Air Resources Board’s oil and gas rule must be addressed immediately, and revised to prevent the cumulative impact of multiple exposure sources from causing additional documented negative health impacts. Additionally Kern County’s proposed environmental impact report (EIR) would streamline the approval of an additional 67,000 new oil and gas wells in the County and thus further degrade air quality. It is crucial that the EIR is instead revised to eliminate extraction near sensitive populations. (For more details on this proposal, see our more in depth environmental justice analysis of Kern County and our article on the proposed EIR.)
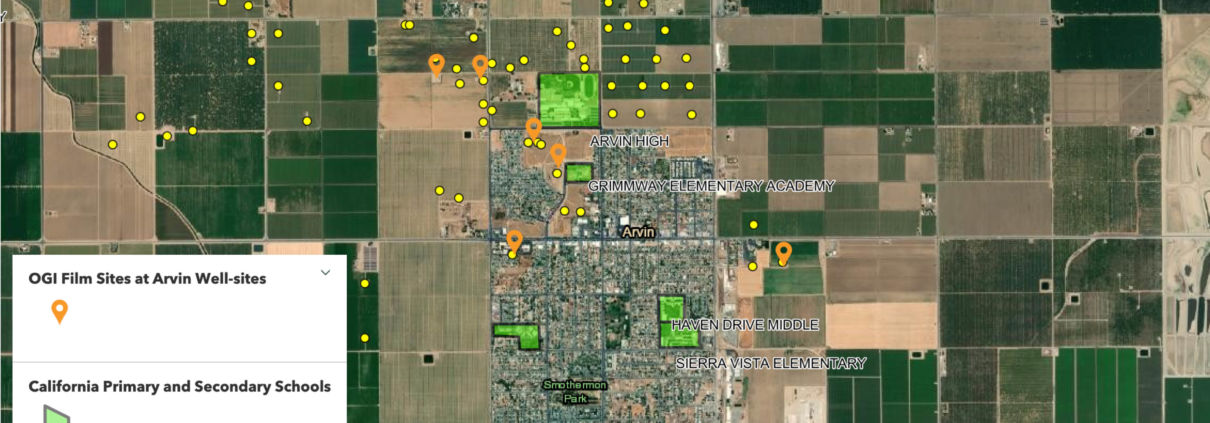
In support of establishing new public health rules that protect Frontline Communities, Earthwork’s Community Empowerment Project, in collaboration with the Central California Environmental Justice Network and FracTracker Alliance, has focused on documenting the uncontrolled emissions from extraction sites within and surrounding the small city of Arvin, California. Using infrared cameras with state of the art optical gas imaging (OGI) technology, the team documented major leaks at multiple well-sites. Footage from Arvin spans the years from 2016-2020. A collection of this footage has been compiled into the interactive story map that follows.
This StoryMap explores how current California regulations fail to stop emissions from tanks on oil and gas well-sites by looking at examples of emissions from well-sites in Arvin, California. Place your cursor over the image and scroll down to advance the StoryMap and explore a series of maps charting the fracking-for-plastic system. Click on the icon in the bottom left to view the legend.
View Full Sized Map | Updated 3/4/21
The cases of uncontrolled emissions in the story map provides just an example of the inventory of uncontrolled emissions sources in Kern County, and California at large. Finding and filming emissions sources while using OGI cameras in California is not at all uncommon, otherwise there would not be seven prime examples just in the City of Arvin. Prior to 2018, emissions from these well-sites went completely unregulated. While the California oil and gas rule (COGR) was developed to address greenhouse gas emissions from small sources, certain aspects of the rule are not being enforced by the local air districts. Rather than requiring tanks to have closed evaporation systems the air districts allow operators to set pressure/vacuum hatches to open and emit toxic and carcinogenic vapors when pressure builds inside tanks. While this is a safety mechanism on tanks, in practice it allows tanks to be consistent sources of exposure that put neighboring communities at risk. Specifically, California Code of Regulations, Title 17, Division 3, Chapter 1, Subchapter 10 Climate Change, Article 4, § 95669, Leak Detection and Repair, Paragraph I states that “Hatches shall remain closed at all times except during sampling, adding process material, or attended maintenance operations.”
New research from Harvard, Berkeley and Stanford has shown that living near oil and gas drilling and extraction exposes Frontline Communities to emissions of VOC’s and ozone that put them at risk for a variety of health impacts. Researchers at Stanford have linked proximity and density of oil and gas wells to preterm birth for pregnant mothers (Gonzalez et al. 2020), even at large distances. Similar research from UC Berkeley showed mothers living near oil and gas drilling and extraction are also at risk of birthing infants with low birth weight (Tran et al. 2020). The study found pregnant people who lived within 0.62 miles (1 kilometer) of the highest producing wells were 40% more likely to have low birth weight babies and 20% more likely to have babies who were small for their gestational age compared to people living farther away from wells or near inactive wells only. Most recently, new research from Harvard University shows that even very low ambient levels of ozone, particulate matter (PM2.5), and nitrogen dioxide increased hospitalizations for cardiac and respiratory conditions (Wang et al. 2021). These are the primary and secondary pollutants emitted from oil and gas extraction sites and also result from burning fossil fuels. The magnitude of the impact on public health is also much larger than previously considered. Another article recently published by researchers at Harvard shows that fossil fuel air pollution is responsible for 18% of total deaths, worldwide (Vohra, et al. 2021).
While the COGR rule is a step in the right direction to reduce emissions, oil and gas’s legacy of degradation to ambient air quality has placed the Central Valley in the worst categories for these pollutants in the country. This puts Kern residents at considerable risk. The local health department continues to report improved conditions and increased numbers of healthy air days, but the truth is the mean, median and maximum values of ozone concentrations at US EPA monitoring locations in Kern County have remained relatively constant at harmful levels from 2015-2019. Expanding the data to 2020 shows a two sharp decreases in ambient levels of pollutants that correspond to decreases in reported production volumes for the county. The first decrease in 2016 corresponds to a drop in production following the institution of State Bill requirements for fracking permits. The decrease in 2020 is a result of the slowed production and burning of fossil fuels related to the Covid-19 Pandemic, as shown below in Figure 1.
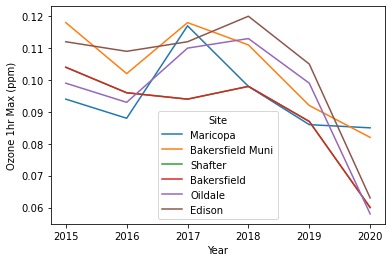
Figure 1. Plot of annual Maximum 1 hour Ozone concentrations at all monitoring locations in western Kern County. Ozone concentrations are presented in parts per million. Annual trends in ambient concentrations of ozone. Note the decrease in concentrations in 2016 and in 2020. Both events correlate to decreases in production.
Using the U.S. EPA’s AirData mapping portal, air quality data for Kern County was exported, compiled and plotted to show trends over time. Above in Figure 1, annual ambient concentrations of ozone are shown. The trends of ambient concentrations follow similar trends in the spatial and temporal distribution of CalGEM reported production volumes. FracTracker Alliance is conducting more thorough analyses of these correlations, so stay tuned for future reports.
The locations of these monitoring locations are shown below in the map in Figure 2. Note that there are not any monitors in northwestern Kern, near large oil fields including North Belridge and Lost Hills. The communities near these fields, such as the City of Lost Hills are predominantly Latinx with elevated levels of linguistic isolation and poverty.
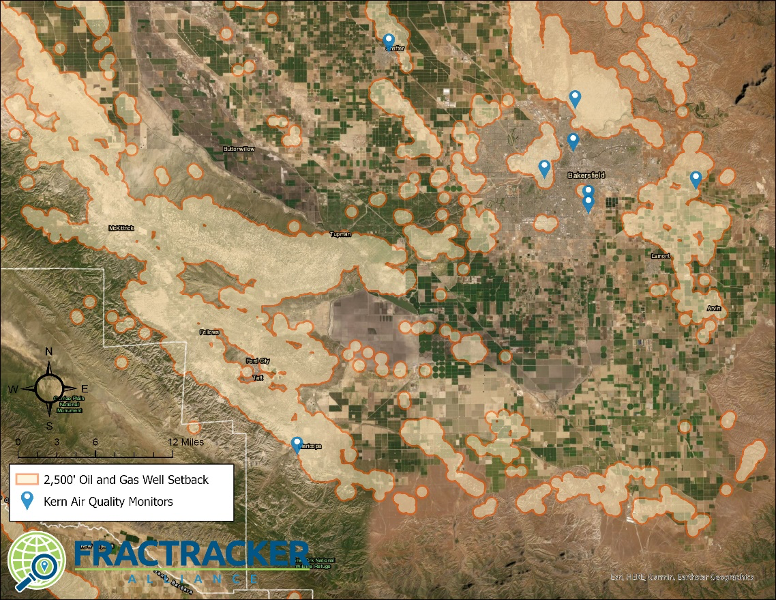
Figure 2. Map of Air Quality Monitors in Kern County.
Permitting new oil and gas wells in Kern County is certain to degrade the already harmful local and regional ambient air quality of the Central Valley. Kern County’s proposed EIR, as it stands will streamline an additional 67,000 sources of VOCs to the inventory of emissions already impacting communities. The health impacts from concentrations of ozone are well established, and the release of VOCs are major risk driver for communities living closest to oil and gas extraction operations as well as for regional public health. Together, these primary and secondary pollutants create a major risk driver for Kern County communities. Globally, these emissions are responsible for upwards of 8 million premature deaths annually. The burden on Frontline Communities in Kern County is likely much higher, and will only grow if the currently drafted EIR is passed. Additional air quality monitoring stations in northwestern Kern County should be installed immediately to help track air quality impacts.
To reduce this harm to Frontline Communities, California Senator Scott Weiner has submitted a new senate bill. Senate Bill 467 would stop the issuance of hydraulic fracturing permits and create a public health setback distance of 2,500 feet from homes, schools and other health care facilities for all new drilling permits. The bill would also create a program to provide new training and job opportunities for workers who would be negatively impacted by the bill. Senate Bill 467 provides the first step for a green transition away from the health impacts resulting from fossil fuel industries.
Built on sound data and ample research, FracTracker recommends the following measures be taken to protect the health of California’s overburdened Frontline Communities: Kern County should revise its environmental impact report to address the onslaught of harmful oil and gas emissions (EIR), California Air Resources Board’s oil and gas rule should close its loophole allowing emissions from the pressure/vacuum hatch on the tank to be exempt from regulation, and legislators should educate themselves on the importance of 2,500 foot setbacks requirements for oil and gas wells.
FracTracker’s public comments regarding recommendations to modify the Kern County Draft Environmental Impact Report (EIR): https://www.fractracker.org/a5ej20sjfwe/wp-content/uploads/2021/03/Kern.EIR_.comments_FracTrackerAlliance_3.8.21_compressed.pdf
FracTracker California articles, maps, and imagery: https://www.fractracker.org/map/us/california/
Earthwork’s Community Empowerment Project: https://www.youtube.com/playlist?list=PL9BS7nDf-8tqlaUT8pc0Yr0Tpfl0UFDMK
Newsom Well Watch, a collaboration between FracTracker and Consumer Watchdog: https://newsomwellwatch.com/
Infrastructure | Health & Safety | Legislation & Politics | Social
Southwest Detroit and neighboring South Rockwood in Monroe County could not be more different demographically, but one thing they have in common is a consistent battle with the extractives industry.
With environmental advocates Theresa Landrum and Doug Wood, FracTracker created a Story Map to document what this infrastructural buildout in Southeastern Michigan looks like from the air, how it has displaced entire neighborhoods, and how it has forever changed their quality of life, in the name of short-term profiteering.
“Marathon is a prime example of corporate polluters continuing
to choose profit over safeguards for our public health.”
– Congresswoman Rashida Tlaib
Each year, FracTracker Alliance gives out its Community Sentinel Award for Environmental Stewardship. We had an amazing group of candidates this year, and the four winners are extremely brave, persistent, insightful, and collaborative activists representing diverse communities all over the country.
I have had the good fortune to interact with two of the winners – Theresa Landrum and Brenda Jo McManama – quite frequently over my time at FracTracker. This year’s Sentinel Award winners and all its previous recipients are passionate and persistent fighters for environmental justice in their own backyards and around the United States.
It is around this time of year that all the negativity involved in the fight against fossil fuel industries dissolves away for me as I find myself inspired and humbled by the Sentinel winners. Theresa and Brenda Jo constantly inspire me and FracTracker to strive to do more, do better, and remain cleareyed as to whom we serve. All the Community Sentinel nominees are exemplars of what it is to walk authentically and humbly through life.
However, I am going to spend the next couple paragraphs speaking specifically about Ms. Landrum, because it is she that I have come to know and work quite well with since COVID-19 was something we thought would be gone by June.
I had heard so many amazing things about Ms. Landrum from a common comrade, Mr. Doug Wood, whom FracTracker has written about with respect to the silica sand mining he is fighting and dubious pro-mining legislation being pushed in Michigan’s Statehouse, but I had never met her in person. That changed on a scorching hot day this past June, when Doug, Theresa, and I met (socially distanced) in the shadow of Marathon Petroleum’s refinery at Detroit’s Kemeny Recreation Center, just a couple stones throws across I-75 (see images below).
Incidentally, this is the same refinery that Congresswoman Rashida Tlaib (D, MI-13) has been railing against for years, including in a statement she issued on yet another incident at
the refinery:
“Marathon is a prime example of corporate polluters continuing to choose profit over safeguards for our public health. It is time to say enough is enough of Marathon’s constant disregard of the health and safety of residents who live, work, and visit the surrounding communities. Marathon has perpetrated numerous incidents detrimental to our communities and must be held accountable – they clearly cannot be trusted to protect our health. I look forward to discussing the need to hold Marathon and other entities who poison our community accountable and solutions to make our communities breathe and live free at the upcoming congressional field hearing I am hosting with other members of Congress, experts, and grassroots activists here in Detroit.”
Scroll horizontally to see additional images:
It did not take more than 30 seconds for me to realize that Theresa was an authentic and persistent fighter for her community, and that she belongs on the Mt. Rushmore of EJ advocates – as does Doug Wood and all of the Community Sentinel nominees past, present, and future.
After meeting at the recreation center, I followed Theresa around with my drone, capturing footage and images of the worst actors in the 48217 zip code of Southwest Detroit, as well as of River Rouge and Ecorse. This turned out to be the first of three trips to meet with Theresa throughout the summer and fall of 2020.
During each trip and across dozens of phone conversations, Theresa explained to me what industry has done to Southwest Detroit, how she has gone about combatting it, and the way that Lansing treats Wayne County.
It struck me that much of her experience overlaps with the stories I have heard in disparate demographics, from soybean farmers in LaSalle County, Illinois, to dairy farmers in Western Wisconsin, all the way to coalminers in Central Appalachia.
Their stories illustrate the near universal tale of how industry needs and welfare demands take precedence over the rights of citizens. It is the story of globalization, shareholder returns, and political/economic elites ignoring, mocking, or being deaf and blind to the needs of their constituents and the crimes being committed in the name of progress and Gross Domestic Product (GDP).
One thing Theresa and I have spent quite a bit of time discussing is the overlap in environmental justice across demographics, and how superficial differences have been weaponized to divide us, leaving only corporations and their political handmaids to benefit. Industry beneficiaries and politicians have colluded to declare in the words of Thomas Frank’s latest book “The People, No!” Yet, it is people like Theresa, Doug, Brenda Jo, and all the other environmental activists we celebrate who are and will be instrumental in bridging those divides, and guiding the citizenry to pivot, to identify and defeat the real Leviathan – the Hydrocarbon Industrial Complex in all its manifestations and with all its tentacles spread out across this country.
The best way I know how to return the favor to folks like Theresa is to continue to do what FracTracker does best, and what I hope I am doing well, which is documenting the infrastructure and landscapes that are or have been in the crosshairs of industry, whether it be steel, coal, oil, or in the case of our name – fracked natural gas.
I have been working with Theresa and Doug on a Story Map that illustrates the scale and scope of industrial impacts in southeastern Michigan, from US Steel’s Zug Island to Sylvanian Mineral’s frac sand mine in South Rockwood. As I mentioned above, we have outlined the plight of Doug and Dawn Wood in their fight against their neighbor Sylvanian Minerals. However, with respect to Southwest Detroit, it is critical that we give a bit of background to the region’s cultural significance. For that, I am going to refer to Ms. Landrum’s own words, shared below:
By Theresa Landrum
During the first and second waves of the early 20th Century Great Migration, African Americans came from the South to Michigan’s communities of Ecorse (48229), River Rouge (48218), and Southwest Detroit (48217), AKA the “Triple Cities,” seeking factory jobs in the surrounding industries; U.S. Steel (formerly Great Lakes Steel), Ford Motor Company, Zug Island, Dana Corporation, and BASF Chemicals. During this time, many white men enlisted in the armed forces, and employers needed workers – so companies recruited southern African Americans to fill the jobs.
This region is one of the first African American settlements in Michigan after World War II, where Black people could actually buy homes, which helped establish metro Detroit’s Black middle class.
By the 1930s and 40s it was a self-sustaining area rich with opportunities, a mecca for Black-owned businesses, like gas stations, stores, jazz clubs, restaurants, hotels, laundromats, dry cleaners, and much more. It was also the home of Black professionals: doctors, pharmacists, policemen, florists, bakers, dentists, teachers, lawyers, and realtors thrived here, and was the site of one of Michigan’s first Black hospitals, Sidney A. Sumby Memorial Hospital, built by Black doctors.
The thread that ties these three communities/zip codes together is their formation of (what was then) Ecorse Township. Their division came after the City of Detroit expressed interest in annexing the River Rouge area. River Rouge incorporated into a village to ward this off, but Detroit was able to annex the Southwest 48217 area in 1922, thus segmenting Ecorse Township into three parts.
Fast forward to the 1950s, when Detroit’s landscape changed forever with the government’s declaration of “Eminent Domain” that claimed many African American homes for construction of the I-75 Expressway, which runs right through the center of Southwest Detroit’s (SWD) 48217 community. As I-75 was constructed, Ohio Oil (which officially became Marathon Oil in 1962) also increased its footprint in the area by acquiring nearly 100 acres and destroying a wetland habitat to expand its storage tank farm, which to date has over 100 storage tanks.
Marathon expanded again in 2007 with the announcement of the $2.2 billion Detroit Heavy Upgrade Project (DHOUP), where they would transition to refining dirty tar-sands from Alberta, Canada. This increased production to 120,000 barrels of crude per day, and thus increased the expulsion of harmful, pollutive emissions into the nearby neighborhoods. The project was completed in 2012, which also resulted in Marathon buying over 400 homes in the SWD 48217 (Oakwood Heights) area, further encroaching into residential communities.
Theresa was a recipient of the 2020 Community Sentinel Award for Environmental Stewardship, presented by FracTracker Alliance and Halt the Harm Network. Read more about her story here.
I asked Dawn and Doug Wood to send me their thoughts on what it is like living next to Sylvanian Minerals and US Silica’s frac sand mine in South Rockwood, Michigan. I extracted (and clarified where necessary) the excerpts below that clearly illustrate their frustrations with their community, local, and federally elected officials, as well as the mine operators:
“[The] list of insurmountable mini-nightmares of living next to a frac sand mine [is endless at this point]. [Ten] years ago, they wanted to annex this quarry. [Our] village government has exercised no control over this corporation. [T]he village and the quarry refuse to do any air monitoring, [and] the residents who voted [in favor of] this quarry continue to be silent against any controls over this quarry. Residents seem to fear retaliation if they speak out against [the] village/quarry, [and to this day we] can’t quite explain the community’s lack of outrage … [We] have been shaking our head for years about this … It’s like the pandemic, it is invisible, yet it is killing people … [and] we are living in a polluted community, so our lungs are already taxed [which amplified the impacts of COVID]. [We] have been petitioning for air monitors and dust controls for four years, [and to add insult to injury] after ten years of this bull- – – -, the industry proposes Senate Bill 431 to totally strip communities of their controls, allowing mines to expand whenever they want, and new quarries to just be approved wherever they want [which has prompted the industry to correctly assume] they are entitled. PURE MICHIGAN is the state slogan. We think that’s PURE BULL- – – -!!”
Southwest Detroit and neighboring South Rockwood in Monroe County could not be more different demographically, but one thing they have in common is a consistent battle with the extractives industry.
We built this Story Map to identify the industrial bad actors and census-level indicators such as mean annual income, and most importantly, to present a growing library of georeferenced drone footage and imagery we have collected over the years.
There have been dozens of other industrial projects foisted on the Triple Cities area of Detroit during this period and to the present day. The goal of this Story Map was to document with drone photography what this infrastructural buildout looks like from the air, how it has displaced and been incorporated directly into neighborhoods – and in the case of Sylvanian Mineral’s South Rockwood facility operating adjacent to good people like the Woods – how it has forever changed their quality of life, in the name of short-term profiteering.
We will continue to “infill” and expand this Story Map in the coming months and years, especially throughout greater Wayne County and the surrounding counties, as southeastern Michigan continues to act as a chokepoint for all manner of industrial and fossil fuel operators and activities. Furthermore, this collaborative effort with Ms. Landrum demands her community’s involvement and acceptance. We also strive to make this project a valuable resource for Michigan-based environmental NGOs and the state’s excellent journalists, like Steve Neavling at Detroit MetroTimes, and Evan Kutz at Great Lakes Beacon.
We plan to update this Map with more culturally significant imagery from the Detroit Public Library and The Wayne State Walter Reuther Library to include media focusing on labor strife, police violence, and the rich tradition and history of the region’s artistic heritage. Additionally, we will expand the depth and breadth of our drone imagery library, as well as continue our nascent effort to collect the stories of regional elders who speak to Southwest Detroit as one of the fulcrums of African American culture, and who explore how industrial colonialism has decimated much the area’s sense of place and community pride.
However, I am confident and hopeful that with progressive voices like Congresswoman Tlaib, committed journalists like those previously mentioned, and activists like Ms. Landrum passing the torch to a younger generation of activists, Southwest Detroit’s condition will take a turn for the better.
We wrote about the impacts that SB 431 would have on Michigan’s community and ecosystems last summer, when we were outlining some of the industry’s efforts in Statehouses across the country to weaken environmental regulations – and in some cases, the democratic process itself. SB 431, in particular, would have made the process of operating a sand and gravel mine in Michigan much easier, by way of removing local participation. As the Metamora Land Preservation Alliance (MLPA) wrote in opposition to the bill, this legislation would have allowed for “uncontrolled gravel mining” throughout the state. However, in a bit of good news, a large coalition of Michigan environmental organizations was able to defeat this bill with the MLPA, writing the following on its Facebook page:
“KILLER GRAVEL BILLS DEFEATED!!!
SENATE BILLS 431/849 DEFEATED!
NO SENATE VOTE THIS YEAR – BILLS ARE DEAD!
After almost 18 months of battling in Lansing – Senate Bills 431 & 849 (sponsored by Senator Hollier (D) Detroit) – have been defeated. They will not be coming up for a vote this calendar year, and by Senate rules they will therefore expire. Thus ending, for this year, the dire threat of uncontrolled gravel mining, endangerment of our groundwater, and loss of control of how our communities grow and develop. Make no mistake – this was a serious threat to Michigan’s citizens and communities – and it was a no-holds-barred fight in Lansing.”
Wins for communities over corporations like this are rare, indeed, and should be celebrated. Congratulations to the Woods, MLPA, and all the Michigan communities and organizations that pushed back against this bill. You are true Community Sentinels!
By Ted Auch PHD, Midwest Program Director
and
Theresa Landrum, of Detroit, Michigan, 48217. The Original United Citizens of Southwest Detroit; 48217 Community and Environmental Health Organization; Michigan Advisory Council on Environmental Justice; Sierra Club Detroit Chapter, MEJC Clean Air Council; Michigan PFAS action response team
New research shows that low-income communities and communities of color that are most impacted by oil and gas extraction (Frontline Communities) in California are at an elevated risk for preterm birth, low birth weight, and other negative birth outcomes. This is in addition to the elevated risks of cancer; risks for respiratory, cardiovascular, and pulmonary disorders; and risks for eyes, ears, nose, throat, and skin irritation that Frontline Communities face, among others. Public health interventions including setback requirements for oil and gas drilling are necessary to address the environmental health endemics documented in Frontline Communities.
This report focuses on the two immediate stakeholders impacted by oil and gas well drilling setbacks: Frontline Communities and oil and gas operators. First, using U.S. Census data this report helps to define the Frontline Communities most impacted by oil and gas extraction. Then, using GIS techniques and California state data, this report estimates the potential impact of a setback on California’s oil production. Results and conclusions of these analyses are outlined below.
Demographics
CalEnviroScreen
Spatial Bias
Well Density
Shafter
Lost Hills, Arvin, and Taft
Bakersfield
Ventura
Los Angeles
Los Angeles
Kern County
The energy focused on instituting policies to protect the health of Frontline Communities in California from the negative impacts of oil and gas extraction is at an all-time high. In August 2020, Assembly Bill 345 was heard in the State Senate’s Natural Resources Committee, but was blocked from reaching the Senate floor for a vote. The bill would have required the Geologic Energy Management Division in the Department of Conservation (CalGEM) to establish a minimum setback distance between oil and gas production and related activities and sensitive receptors like homes, schools, and hospitals. While this strong effort to establish health and safety setbacks through the state legislature may have failed, the movement has paved the way for local actions. Additionally, California is in the midst of a statewide public health rule-making process to address the health impacts of oil and gas extraction currently experienced by Frontline Communities.
In related advocacy, Frontline Community groups in California recommended a minimum 2500’ setback based on scientific studies, including a 2015 report by the California Council on Science and Technology which identified “significant” health risks at a distance of one-half mile from drill sites. A recent grand jury report from Pennsylvania recommended 5,000’ setbacks, with 2,500’ as a minimum requirement to address the most impacted communities. Additionally, the state of Colorado has recently adopted 2,000’ setbacks for homes and schools, while the existing 2,000’ setback has had minimal impacts on oil and gas production.
In September 2020, Governor Newsom declared the deadline for the first draft of the pre-regulatory rule-making report will be the first of January 2021. FracTracker Alliance has therefore completed an updated assessment of the Frontline Communities most impacted by oil and has projected the potential impact on oil and gas extraction operations. An interactive map of oil and gas activity and Frontline Communities is shown below in Figure 1. The map identifies the operational (active, idle, and new) oil and gas wells located within 2,500’ and 1 mile buffer zones from sensitive receptors, defined as homes, schools, licensed daycares and healthcare facilities.
The impacts of oil and gas drilling do not stop at 2,500’, as regional groundwater contamination and air quality degradation of ozone creation and PM2.5 concentrations are widespread hazards of oil and gas extraction. Phasing out wells within 2,500’ of homes will reduce the negative health effects for the Frontline Communities bearing the brunt of the risks associated with living near oil and gas wells, as well as reduce regional environmental hazards. These risks include over 24 categories of health impacts and symptoms associated with 14 bodily systems, including eyes, ears, nose, and throat; mental health; reproduction and pregnancy; endocrine; respiratory; cardiovascular and pulmonary; blood and immune system; kidneys and urinary system; general health; sexual health; and physical health among others. The most regularly documented health outcomes include mortality, asthma and respiratory outcomes, cancer risk including hematological (blood) cancer, preterm birth, low birth weight and other negative birth outcomes.
The interactive map below in Figure 1 shows the operational oil and gas wells located within 2,500’ of sensitive receptors, including homes, schools, healthcare facilities, prisons, and permitted daycares. Overall in the state of California, 16,724 operational (8,618 active, 7,786 idle, and 320 new) wells are located within the 2,500’ setback. Of the total ~105,000 operational (62,000 active, 37,400 idle, and 6,000 new), about 16% are within the setback. These wells accounted for 12.8% of the total oil/condensate produced in California in 2019. Table 1 below shows the counties where these wells are located, by well permit status. It bears noting that these figures on well location and production represent only a snapshot of current industry activity. As discussed below, current setback proposals would provide a phase out period for existing wells that would greatly reduce any immediate impact on production. Further, directional and even horizontal drilling is common in California, meaning operators can relocate their surface drilling equipment to safer distances and still access oil and gas reserves to maintain production.
Table 1. Status of wells within the 2,500’ setback zone, by county. The table shows the counts of wells located within the 2,500’ setback from homes and other sensitive receptors, broken out by the status of the wells.
| Well Count by Status | |||
| County | Active | New | Idle |
| Kern | 3,501 | 234 | 2,171 |
| Los Angeles | 2,580 | 29 | 3,006 |
| Orange | 914 | 13 | 816 |
| Ventura | 534 | 7 | 600 |
| Santa Barbara | 198 | 17 | 241 |
| Los Angeles Offshore | 168 | 2 | 51 |
| Glenn | 133 | 76 | |
| San Joaquin | 97 | 71 | |
| Monterey | 88 | 9 | 95 |
| Fresno | 86 | 6 | 137 |
| Sutter | 73 | 71 | |
| Tulare | 65 | 1 | 30 |
| Colusa | 47 | 80 | |
| Tehama | 38 | 34 | |
| Solano | 30 | 0 | 65 |
| Sacramento | 22 | 1 | 38 |
| San Bernardino | 14 | 29 | |
| Humboldt | 12 | 11 | |
| Alameda | 7 | 3 | |
| Contra Costa | 5 | 1 | 16 |
| San Benito | 3 | 4 | |
| San Luis Obispo | 2 | 14 | |
| Yolo | 1 | 13 | |
| Grand Total | 8,618 | 320 | 7,786 |
Figure 1. Map of California operational oil and gas wells with 2,500’ and one mile setback distances. One mile setbacks are included as a minimum recommendation of this report based on peer reviewed literature. This report recommends the state of California consider one mile as a minimum setback distance to protect Frontline Communities. As you zoom into the map additional, more detailed layers will appear.
In this article we conducted spatial analyses using both the demographics of Frontline Communities and the amount of oil produced from wells near Frontline Communities. This assessment used CalGEM data (updated 10/1/20) to map the locations of operational oil and gas wells and permits, as shown above in Figure 1. The analyses of oil production data utilized CalGEM’s annual production data reporting barrels of oil/condensate. GIS analyses were completed using ESRI ArcGIs Pro Ver. 2.6.1 with data projected in NAD83 California Teale Albers.
Wells within 2,500’ and 1 mile of sensitive receptors were determined using GIS techniques. This report defines sensitive receptors as residences, schools, licensed child daycare centers, healthcare facilities. Sensitive receptor datasets were downloaded from California Health and Human Services, and the California Department of Education.
We used block group level “census designated areas” from American Community Survey (2013-2018) demographics to estimate counts of Californians living near oil and gas extraction activity. Census block groups were clipped using the buffered datasets of operational oil and gas wells. A uniform population distribution within the census blocks was assumed in order to determine the population counts of block groups within 2,500’ of an operational oil and gas well, 2,500’ to 1 mile from an operational well, and beyond 1 mile from an operational well. Census demographics and total population counts were scaled using the proportion of the clipped block groups within the setback area (Areal percentage = Area of block group within [2,500’; 2,500’-1 mile; Beyond 1 mile] of an operational well / Total area of block group).
This conservative approach provided a general overview of the count and demographics of Californians living near extraction operations, but does little to shed light on most impacted Frontline Communities; specifically urban areas with dense populations near large oil fields. More granular analyses at the local level were necessary to address the spatial bias resulting from non-uniform census block group dimensions and population density distributions, as well as the distribution of operational oil and gas wells within the census block groups. Consequently, we conducted further analysis utilizing customized sample areas for each oil field, which were selected manually using remote sensing data. Full census blocks were used to summarize the actual areas and the urban populations constituting the majority of Frontline Communities.
In the localized, static maps that follow, the census blocks included in the population summaries are shown in pink, while the surrounding census blocks are shown in blue. As seen in Table 2, census data for this initial environmental justice assessment was limited to “Race” (Census Table XO2), “Hispanic or Latino Origin” (Census Table XO3) and several other indicators including “Annual Median Income of Households” (Census Table X19) and “Poverty” (Census Table X17).
As a baseline, it is important to provide statewide estimations to track the total number of Californians living near oil and gas extraction operations. This analysis showed that about 2.17 million Californians live within 2,500’ of an operational oil and gas well, and about 7.37 million Californians live within 1 mile. The demographics of these communities at and between these distances is shown below in Table 2, alongside demographic estimates of the California population living beyond 1 mile from an oil and gas well. Census block groups closer to oil and gas wells have higher proportions of Non-white (calculated by subtracting “White Only” from “Total Population”) and Latinx (“Hispanic or Latino Origin”) populations, as well as higher proportions of low-income households, based on both median annual income and poverty thresholds. The analysis show that communities living closer to oil and gas wells have higher percentages of non-white and Latinx populations when compared to the population living beyond 1 mile from an operational oil and gas wells. Communities closer to oil and gas wells are also more likely to be closer to the poverty threshold with lower median annual household incomes.
Table 2. The table shows statewide demographics at multiple distances from operational oil and gas wells. Included are estimates of the non-white and Latinx proportions of the populations within set distances from operational oil and gas wells. The percentage of populations within several poverty thresholds were also summarized, along with median annual household income and age.
| Distance from an operational oil and gas well | |||
| Indicators of Disparity | Within 2,500′ | 2,500′ – 1 Mile | Beyond 1 Mile (Statewide) |
| Demographics: Non-white | 44.44% | 43.56% | 39.16% |
| Demographics: Latinx | 43.25% | 44.97% | 37.79% |
| Poverty: Under Poverty Threshold | 15.01% | 14.97% | 14.12% |
| Poverty: Under 1.5X Poverty Threshold | 24.31% | 24.85% | 23.25% |
| Poverty: Under 2X Poverty Threshold | 33.59% | 34.25% | 32.17% |
| Median Annual Household Income < $40k | 30.09% | 30.73% | 28.72% |
| Median Annual Household Income <$75k | 53.53% | 54.36% | 51.76% |
| Age: 0-5 years | 6.08% | 6.12% | 6.37% |
| Age: <18 years | 21.54% | 22.12% | 23.39% |
| Age: 65+ | 13.17% | 13.11% | 13.68% |
| Demographics: White only | 55.56% | 56.44% | 60.84% |
CalGEM operational wells data was also overlaid on CalEnviroScreen 3.0 (CES) indicators of environmental health. CES is provided by the Office of Environmental Health Hazard Assessment (OEHHA), on behalf of the California Environmental Protection Agency (CalEPA).
CalEnviroScreen data, like U.S. Census data, is also aggregated at the census block group level. While this data can also suffer from the same spatial bias as the statewide analysis above, CES is still very useful to visualize and map the regional pollution burden to assess disparate impacts. The results of the analysis are shown below in Table 3. Counts of operational oil and gas wells for ranges of CES percentile scores. Higher percentiles represent increased environmental degradation or negative health impacts as specified. Of note, the majority of operational oil and gas wells are located in census tracts with the worst scores for air quality degradation and high incidence of low birth weight.
The large number of wells located in the 60-80th percentile rather than the worst (80-100th percentile) is a result of spatial bias, and the many factors that are aggregated to generate the CES Total Scores. These factors include relative affluence and other indicators of socio-economic status. The majority of the worst (80th-100 percentile for Total CES Score) census block groups are located in low-income urban census block groups, many in Northern California cities that do not host urban drilling operations.
This spatial bias results from edge effects of census block groups, where communities living near oil and gas extraction operations may not live in the same census block groups as the oil and gas wells, and are therefore not counted. The authors would recommend future analyses be designed that use CES data to assess disparate impacts in the census block groups most impacted by oil and gas extraction. Neighboring census block groups that do not physically contain operational wells still suffer the consequences of proximity.
For the asthma rankings, the majority of wells are located in the best CES 3.0 percentile (0-20th percentile) for Asthma. While there is much urban drilling in Los Angeles, the spatial bias in this type of analysis gives more weight to the majority of oil and gas wells that are located in rural areas, which historically have much lower asthma rates. This is a result of the very high incidence of asthma in cities without urban drilling such as the Bay Area and Sacramento (80-100th percentile).
Table 3. Counts of operational oil and gas wells in select CalEnviroScreen 3.0 indicators census tracts.
| Operational Well Counts by CES3.0 Percentile | |||||
| 0-20%ile | 20-40%ile | 40-60%ile | 60-80%ile | 80-100%ile | |
| PM2.5 Air Quality Degradation | 5,708 | 4,237 | 16,614 | 7,089 | 69,987 |
| Ozone Air Quality Degradation | 2,238 | 5,435 | 6,107 | 9,898 | 79,957 |
| Contaminated Drinking Water | 1,019 | 1,675 | 53,452 | 6,214 | 41,206 |
| High Incidence of Low Birth Weight | 10,186 | 13,368 | 14,995 | 3,236 | 58,036 |
| High Incidence of Asthma | 40,247 | 19,827 | 18,902 | 4,867 | 19,792 |
| Total CES 3.0 | 1,583 | 5,756 | 15,671 | 65,356 | 12,985 |
Using census data to assess the demographics of those communities most affected by oil and gas drilling can produce misleading results both because of how census designated areas (census tracts and block groups) are designed and because of the uneven distribution of residents within tracts. For example, the majority of Californians who live closest to high concentrations of oil and gas extraction, such as the Kern River oil field, do so in residentially zoned cities and urban settings. In most Frontline Communities the urban census designated areas do not actually contain many wellsites. Instead urban census designated areas are located next to the “estate” and “industrial” (including petroleum extraction) zoned census designated areas that contain the well-sites.
Estate and industrially zoned census designated areas contain the majority of well-sites in Kern County. They are much larger than residentially zoned areas with very low population densities and higher indicators of socioeconomic status. Population centers within the estate zoned areas are often located on the opposite end and farther from well sites than the lower income communities and communities of color living in the neighboring, residentially-zoned census designated areas (e.g., Lost Hills and Shafter). In these cases the statewide demographic summaries above misrepresent the Frontline Communities who are truly closest to extraction operations. Localized environmental justice demographics assessments can also be manipulated in this way.
For instance, The 2020 Kern County draft EIR (chapter 7 PDF pp. 1292-1305) used well counts aggregated by census tracts to conclude that wells in Kern County were not located in disparately impacted communities. Among other requirements for scientific integrity, the draft Kern EIR fails to take into account how the shape, size, and orientation of census designated areas affect the results of an environmental justice assessment. In addition, the EIR uses low-resolution data summarized at the census tract level. Census tracts are much too large to be used to investigate localized health impacts or disparities. Using these blatantly inadequate methods, the draft EIR even claimed Kern County’s oil and gas wells are predominantly located in higher income, white communities, which is outright wrong. For more specific criticisms of the Draft EIR read the FracTracker analysis of the 2020 Kern County EIR.
Results from these types of analyses can be very misleading. Using generalized methods of attributing wells to specific census designated areas does little to identify the communities most impacted by the localized environmental degradation resulting from oil and gas extraction operations, particularly when large census areas such as census tracts are used.
This report therefore takes a different approach, focusing directly on California’s most heavily drilled communities. To understand who and which communities are most harmed by the large-scale industrial oil and gas extraction operations in California, spatial analyses must be refined to focus individually on the communities closest to the highest density extraction operations. For the analyses below, census block groups within 2,500’ of ten different Frontline Communities, all located near some of California’s largest oil and gas fields, were manually identified. The selected block groups’ major population centers were all located within the 2,500’ buffers. Unlike the statewide analysis above, the localized analyses below do not assume homogenous population distributions. Using these methods, FracTracker has identified and demographically described some of the most vulnerable California communities most at risk to the impacts of oil and gas extraction. In the maps below, the “case” census block groups used to generate descriptive demographic summaries of at risk communities bordering extraction operations are outlined in pink, while surrounding census block groups are outlined in light blue.
The analyses above are important to understand some of the public health risks of living near oil and gas drilling in California. Yet the methods above used statewide aggregation of well counts and static buffers that do not not show the spectrum of risk resulting from well density. Numerous Frontline Communities in California are within 1 mile or even 2,500’ of literally thousands of oil and gas wells. Conversely, there are many census areas in California that have been included within the spatial analysis of the full state, as described above, located near a single low producing well. Therefore the above methods conservatively summarize demographics and dilute the signal of disparate impacts for low income communities of color. Those methods are not able to differentiate between such scenarios as living near one low-producing well in the Beverly Hills golf course versus living in the middle of the Wilmington Oil Field.
As with any toxin, the dosage determines the intensity of the poison. In environmental sciences, increasing exposure to toxins by increasing the number of sources of a toxin can increase the dosage and therefore the severity of the health impact. The impact of well density has been documented in numerous epidemiological studies as a significant indicator of negative health outcomes, including recently published reports from Stanford University and The University of California – Berkeley linking adverse birth outcomes with living near oil and gas wells in California (Tran et. al 2020, Gonzalez et. al 2020). Therefore the rest of this report focuses on the Frontline Communities living near large oil extraction operations–i.e., oil fields with high densities of operational oil and gas wells.
Toggle between the sections below by clicking in the upper left corner of the title bar.
Shafter
The City of Shafter, California, is located near more than 100 operational wells in the North Shafter oil field, as shown below in the map in Figure 2. Technically, the wells are located within a donut-shaped census block group (outlined in blue) that surrounds the limits of the urban census block groups (outlined in pink). Shafter’s population of nearly 20,000 is over 86% Latinx, but the surrounding “donut” with just 2,000 people is about 70% Latinx, much wealthier, and with very low population density. The other neighboring rural census areas housing the rest of the Shafter oil field wells follow this same trend.
An uninformed analysis, such as the Kern County EIR, would conclude that the 2,000 individuals who live within the blue “donut” are at the highest risk, because they share the same census designated area as the wells. Notably, the only population center of this census block group (or census tracts, which follow this same trend) is at the opposite end of the block group, farthest from the Shafter oil field. Instead, the most at-risk community is the urban community of Shafter with high population density; the census block groups within the pink hole of the donut contain the communities and homes nearest the North Shafter field.
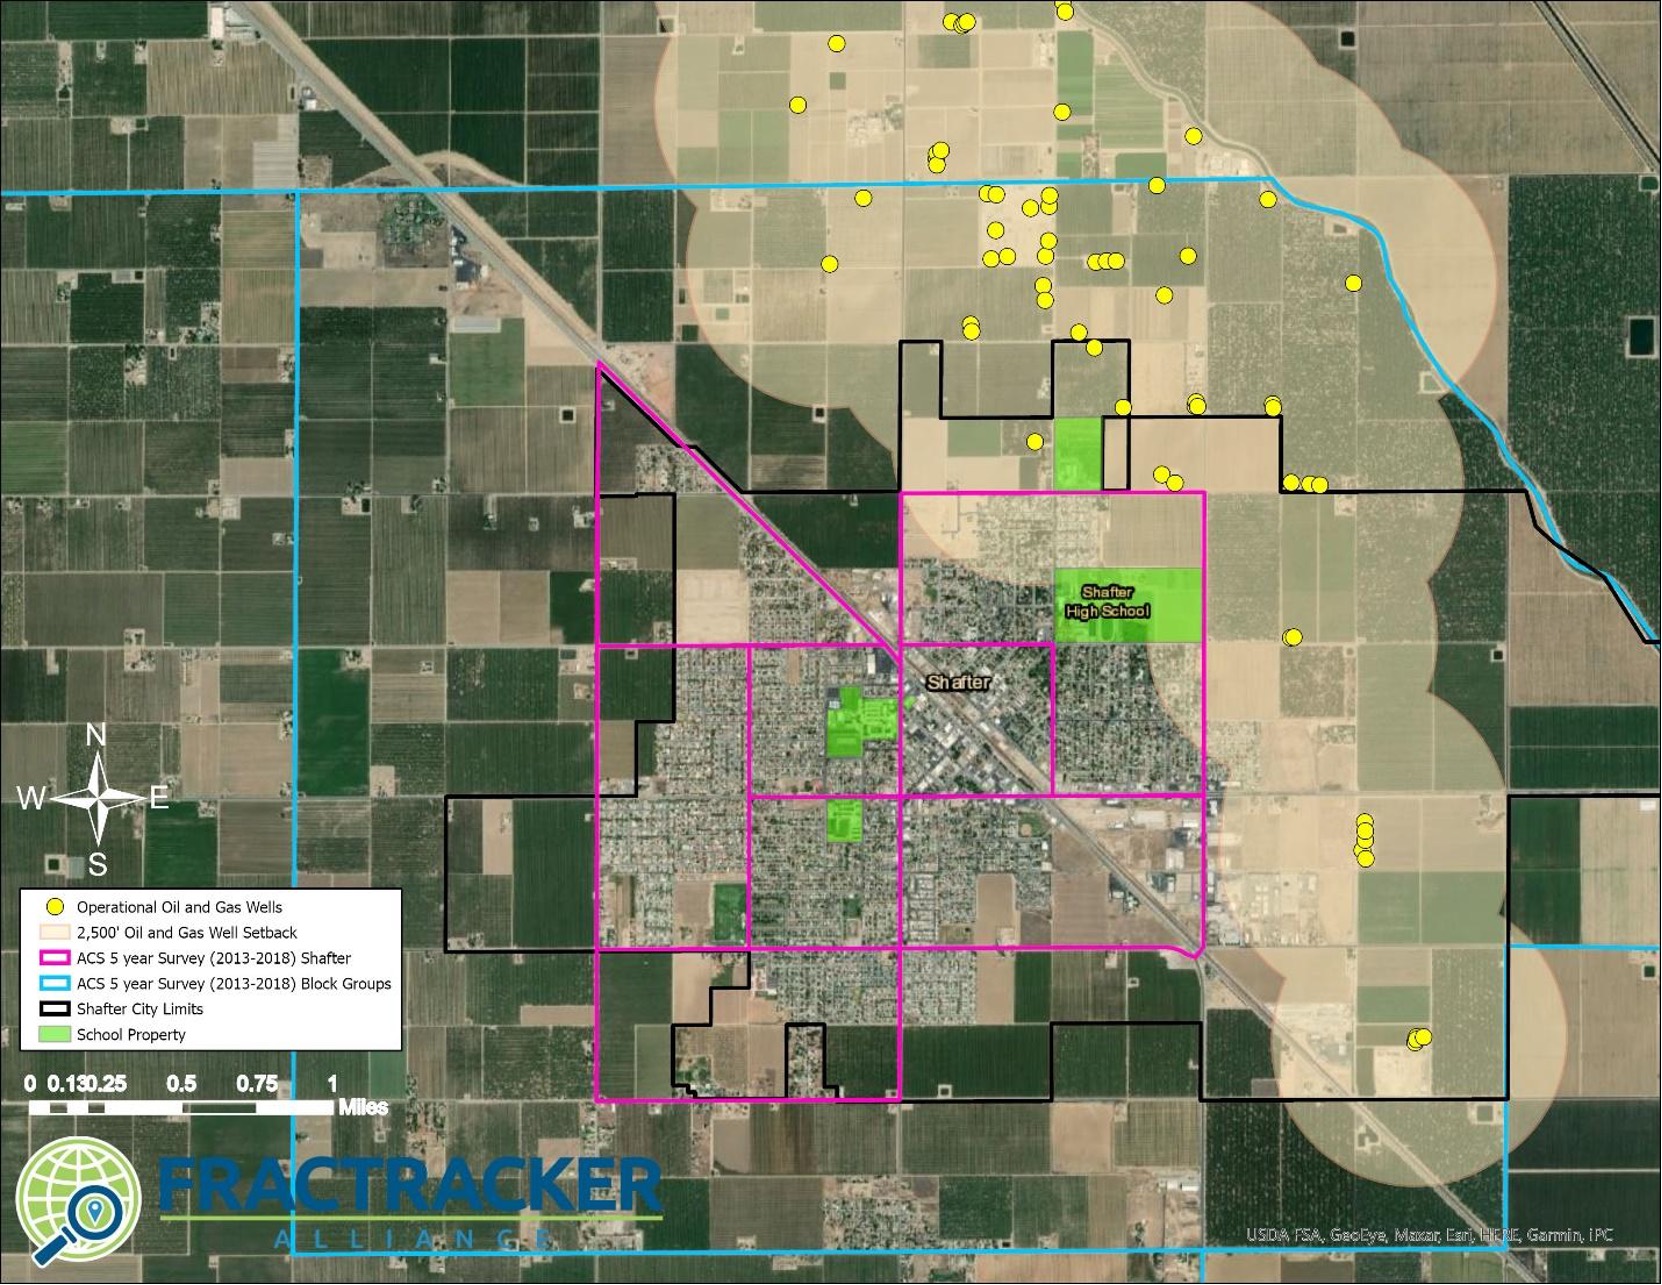
Figure 2. The City of Shafter, California is located just to the south of the North Shafter oil field. The map shows the 2,500’ setback distance in tan, as well as the census block groups in both pink and blue. Pink block groups show the urban case populations used to generate the demographic summaries.
Lost Hills, Arvin, & Taft
The cities of Lost Hills, Arvin, and Taft are all very similar to Shafter. The cities have densely populated urban centers located within or directly next to an oil field. In the maps below in Figures 3 readers can see the community of Lost Hills next to the Lost Hills oil field. Lost Hills, like the densely populated cities of Arvin and Taft, are located very close to large scale extraction operations. Census block groups that include the most impacted area of Lost Hills is outlined in pink, while surrounding low population density census block groups are shown in blue. The majority of the areas outlined in blue are zoned as “estate” and “agriculture” areas. The outlines of the city boundaries are also shown, along with 2,500’ and 1 mile setback distances from currently operational oil and gas wells.
Lost Hills is another situation where a donut-shaped census area distorts the results of low resolution demographics assessments, such as the one conducted by Kern County in their 2020 Draft EIR (PDF pp. 1292-1305). Almost all of the wells within the Lost Hills oil fields are just outside of a 2,500’ setback, but the incredibly high density of extraction operations results in the combined impact of the sum of these wells on degraded air quality. While stringent setback distances from oil and gas wells are a necessary component of environmental justice, a 2,500’ setback on its own is not enough to reduce exposures and risk for the Frontline Community of Lost Hills. For these Frontline Communities, a setback needs to be much larger to reduce exposures. In fact, limiting a public health intervention to a setback requirement alone is not sufficient to address the environmental health inequities in Lost Hills, Shafter, and other similar communities.
Lost Hill’s nearly 2,000 residents are over 99% Latinx, and over 70% of the households make less than $40,000 in annual income (which is substantially less than the annual median income of Kern County households [at $52,479]). The map in Figure 3 shows that the Lost Hills public elementary school is located within 2,500’ of the Lost Hills oil field and within two miles of more than 2,600 operational wells, in addition to the 6,000 operational wells in the rest of the field.
The City of Arvin has 8 operational oil and gas wells within the city limits, and another 71 operational wells within 2 miles. Arvin, with nearly 22,000 people, is over 90% Latinx, and over 60% of the households make less than $40,000 in annual income.
Additionally the City of Taft, located directly between the Buena Vista and Midway Sunset Fields, has a demographic profile with a Latinx population at least 10% higher than the rest of southern Kern County.
Lost Hills, Arvin, and Taft are among the most impacted densely populated areas of Kern County and represent the most Kern citizens at risk of exposure to air quality degradation from oil and gas extraction.
In all of these cases, if only census tract well counts are considered, like in the 2020 Kern County draft EIR, these Frontline Communities will be completely disregarded. Census tracts are intentionally drawn to separate urban/residential areas from industrial/estate/agricultural areas. The census areas that contain the oil fields are very large and sparsely populated, while neighboring census areas with dense population centers, such as these small cities, are most impacted by the oil and gas fields.
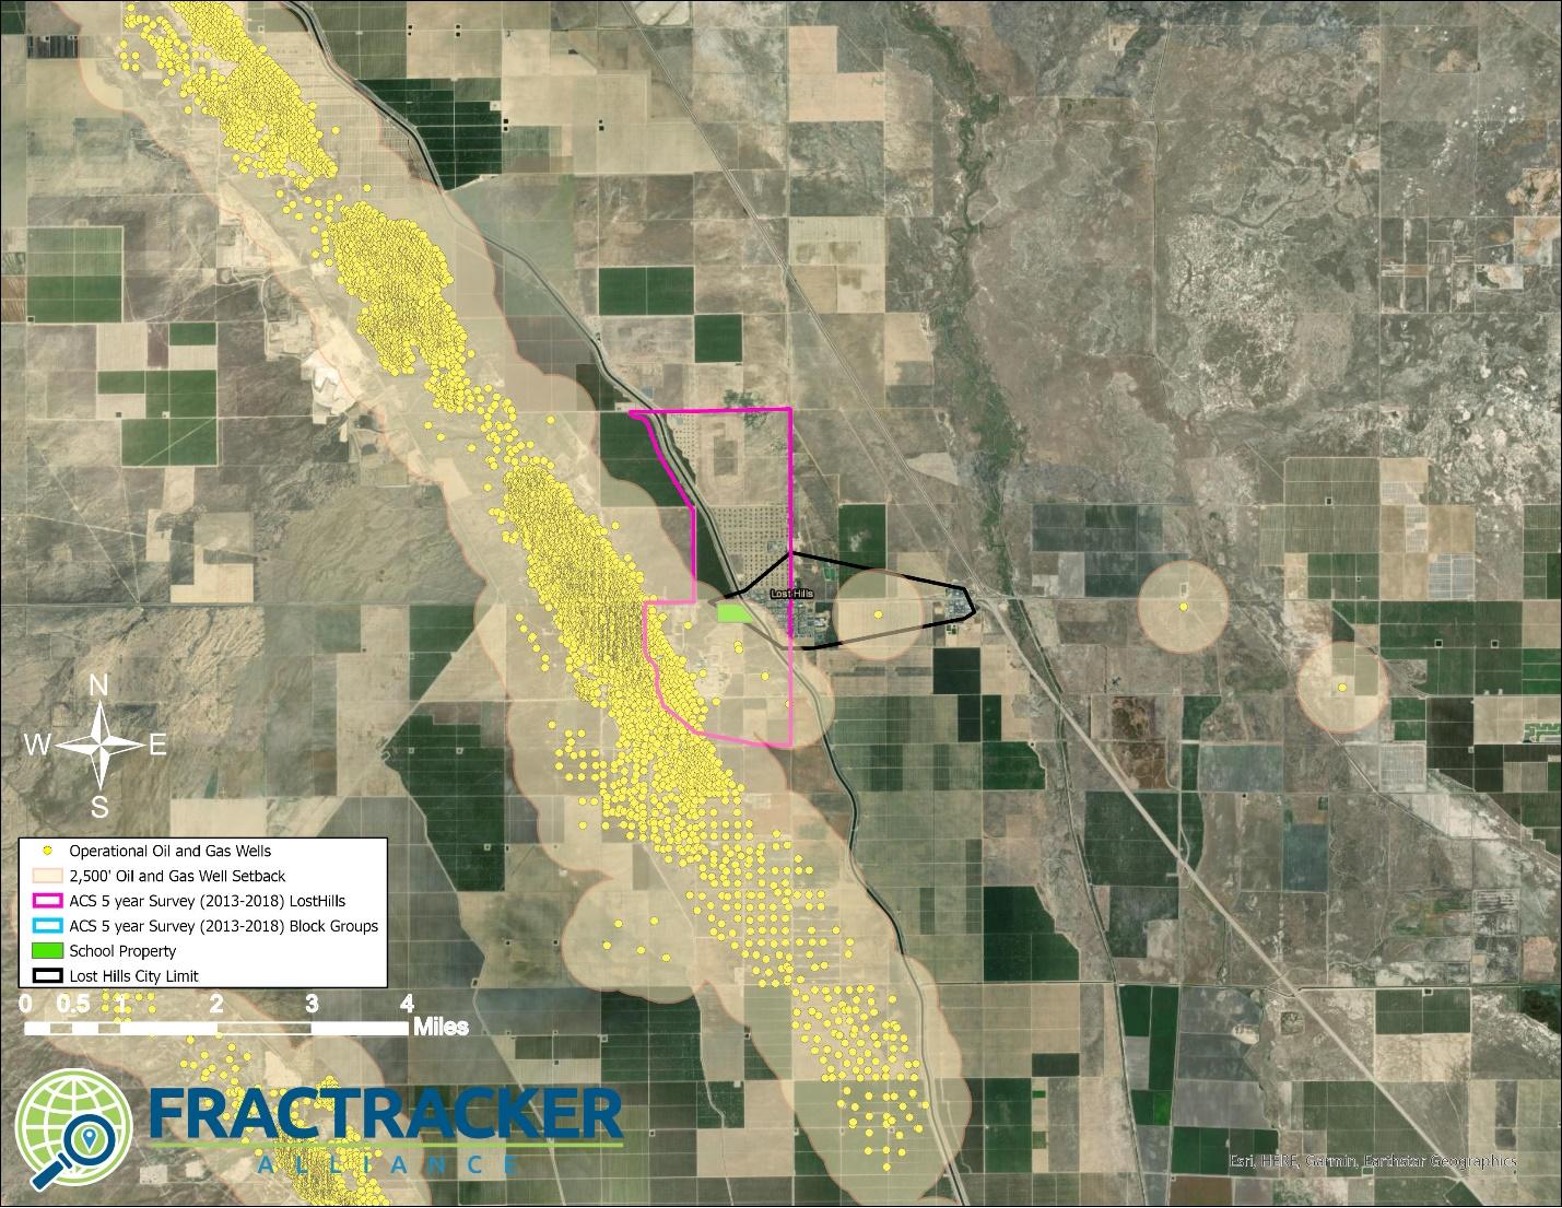
Figure 3. The Unincorporated City of Lost Hills in Kern County, California is located within 2,500’ of the Lost Hills Oil Field. The map shows the 2,500’ setback distance in tan, as well as the census block groups in both pink and blue. Pink block groups show the urban case populations used to generate the demographic summaries.
Bakersfield
The City of Bakersfield is a unique scenario. It is the largest city in Kern County and as a result suburban developments surround parts of the city. Urban flight has moved much of the wealth into these suburbs. The suburban sprawl has occurred in directions including North toward the Kern River oil field, predominantly on the field’s western flank in Oildale and Seguro. In the map below in Figure 4, these areas are located just to the north of the Kern River.
This is a poignant example of the development of cheap land for housing developments in an area where oil and gas operations already existed; an issue that needs to be considered in the development of setbacks and public health interventions and policies. This small population of predominantly white, middle class neighborhoods shares similar risks as the lower-income Communities of Color who account for the majority of Bakersfield’s urban center. Even though these suburban communities are less vulnerable to the oppressive forces of systemic racism, real estate markets will continue to prioritize cheap land for development, moving communities closer to extraction operations.
Regardless of the implications of urban sprawl and suburban development, it is important to no disregard the risks to the demographics of the at-risk areas of the city of Bakersfield are predominantly Non-white (31%) and Latinx (60%), particularly as compared to the city’s suburbs (15% Non-white and 26% Latinx). About 33,000 people live in the city’s northern suburbs, and another 470,000 live in Bakersfield’s urban city center just to the south of the 16,500 operational wells in the Kern River, Front, and Bluff oil fields. The urban population of Bakersfield is a large Frontline Community exposed to the local and regional negative air quality impacts of the Kern River and numerous other surrounding oil fields.
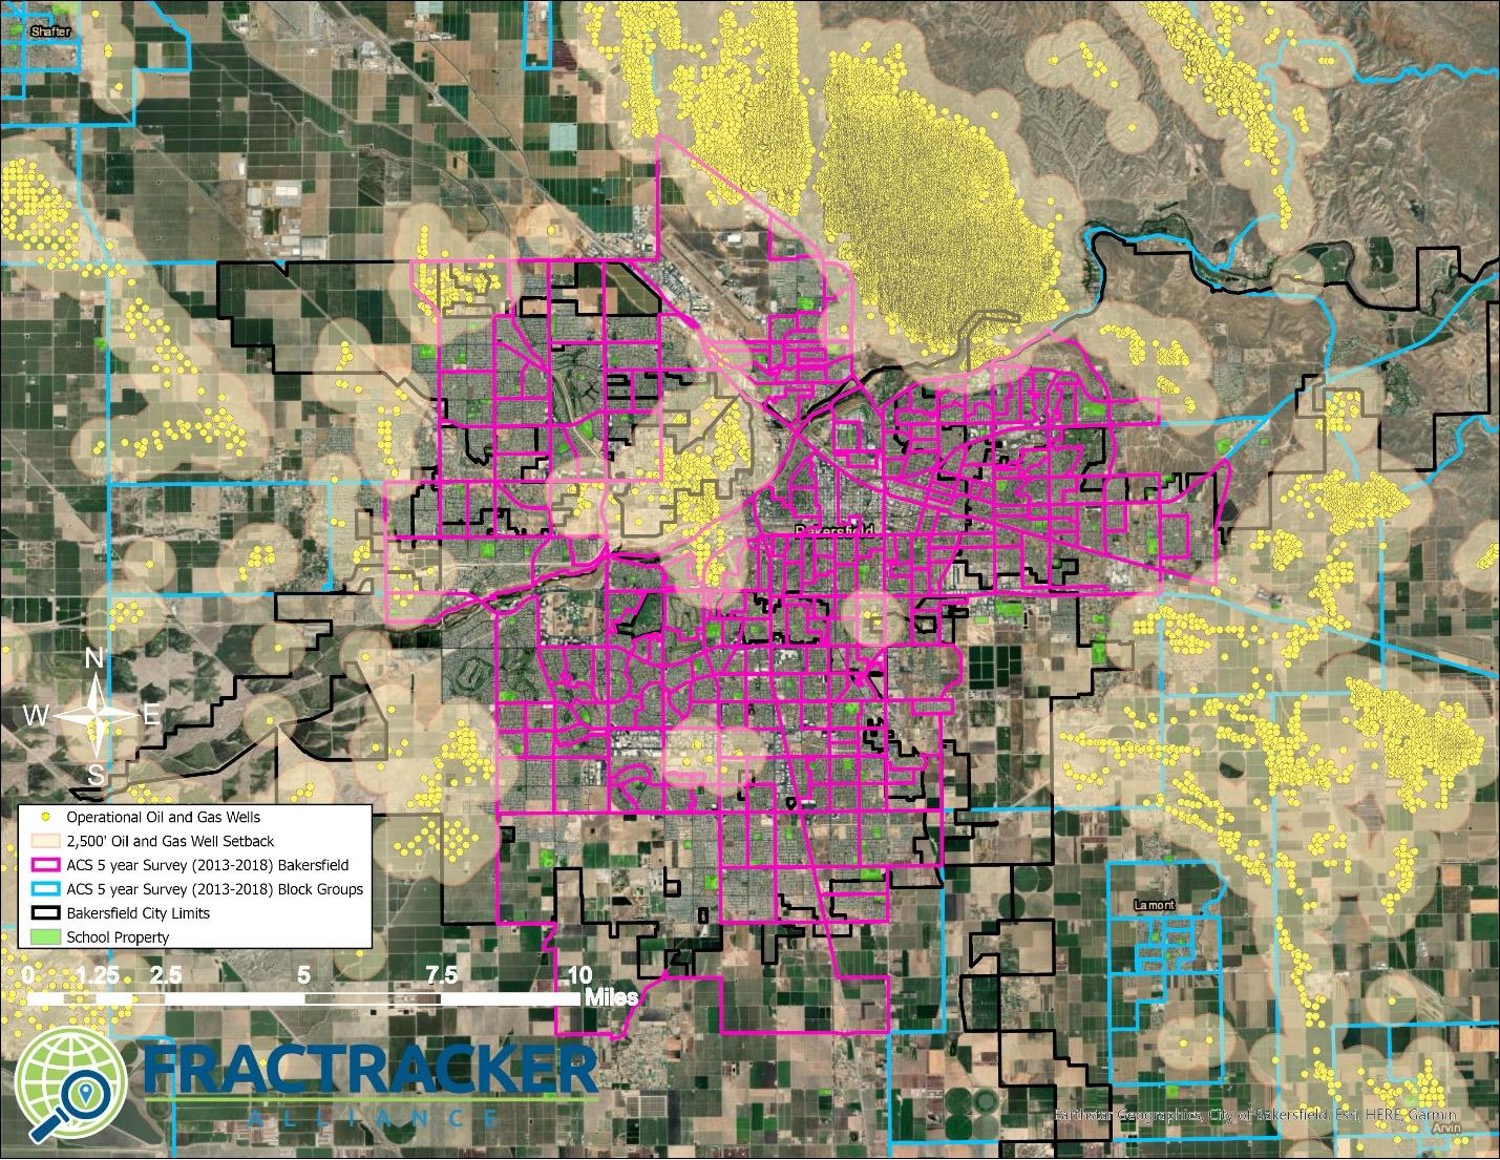
Figure 4. Map of the city of Bakersfield in Kern County, California located between several major oil fields including the Kern Front oil field. The map shows the 2,500’ setback distance in tan, as well as the census block groups in both pink and blue. Pink block groups show the urban case populations used to generate the demographic summaries.
Ventura
The City of Ventura and the proximity of the Ventura oil field is a similar situation to cities in Kern. The urban center of Ventura is bisected by the Ventura oil field’s nearly 1,200 operational wells. While over 70% of the city’s population is Latinx, the very sparsely populated census areas also containing portions of the oil field are 34% Latinx.
In the map below in Figure 5, take note of the population distribution within the portion of the city closest to the oil field versus the census areas to the east. While a statewide or less granular analysis would assume an evenly distributed population density, in this localized analysis, it is clear that the most vulnerable Frontline Communities are the urban centers closest to the oil fields. Even though the census blocks to the east contain oil and gas wells, the populations are less at risk because the population centers are located farther from the oil field.
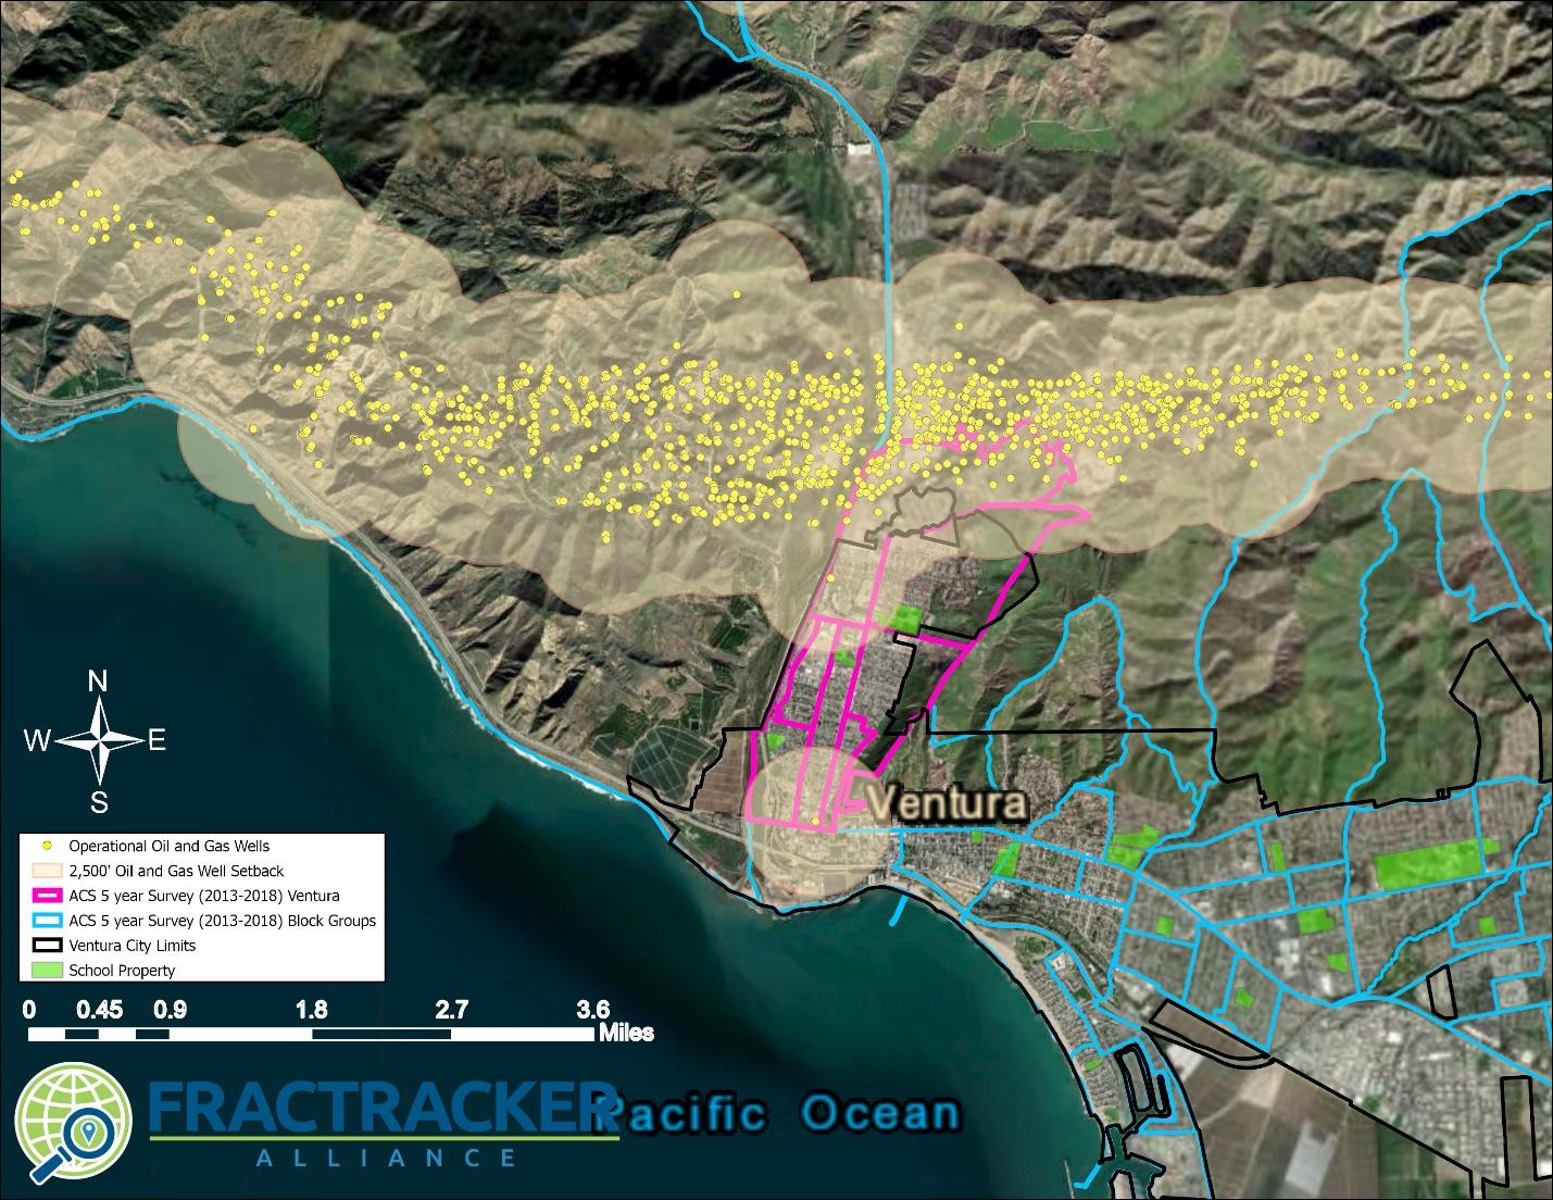
Figure 5. Ventura Oil Field in Ventura, California census areas within the 2,500’ setback area. The map shows the 2,500’ setback distance in tan, as well as the census block groups in both pink and blue. Pink block groups show the urban case populations used to generate the demographic summaries.
In Los Angeles County, Inglewood, Wilmington, Long Beach, and Los Angeles City are some of the largest oil and gas fields. There are many areas in Los Angeles where a single low-producing well is located in an upper middle class suburb, on a golf course, or next to the Beverly Hills High School.
While all well sites present sources of exposure to volatile organic compounds (VOCs) and other air toxics, these four oil fields have incredibly high densities of oil and gas wells in urban neighborhoods. The demographics of the Frontline Communities located within 2,500’ of these major fields are presented below in Table 4. These areas are additionally lower income communities; for example, over 50% of annual household incomes in the census areas surrounding the Los Angeles City oil field are below $40,000, while the Los Angeles County median annual income is over $62,000.
Table 4. Demographics for Frontline Communities living within 2,500’ of Los Angeles’s major oil and gas fields along with counts of operational wells in the fields are shown in the table. The demographic “Latinx” is the count of “Hispanic or Latino Origin” population, and “non-white” was calculated by subtracting “white only” from “total population.”
| Oil Field | Well Count | Non-white (%) | Latinx (%) |
| Inglewood | 914 | 62% | 11% |
| Wilmington | 2,995 | 56% | 63% |
| Long Beach | 687 | 50% | 30% |
| Los Angeles City | 872 | 69% | 59% |
| Ventura | 1,193 | 10% | 72% |
Toggle between the sections below by clicking in the upper left corner of the title bar.
Inglewood
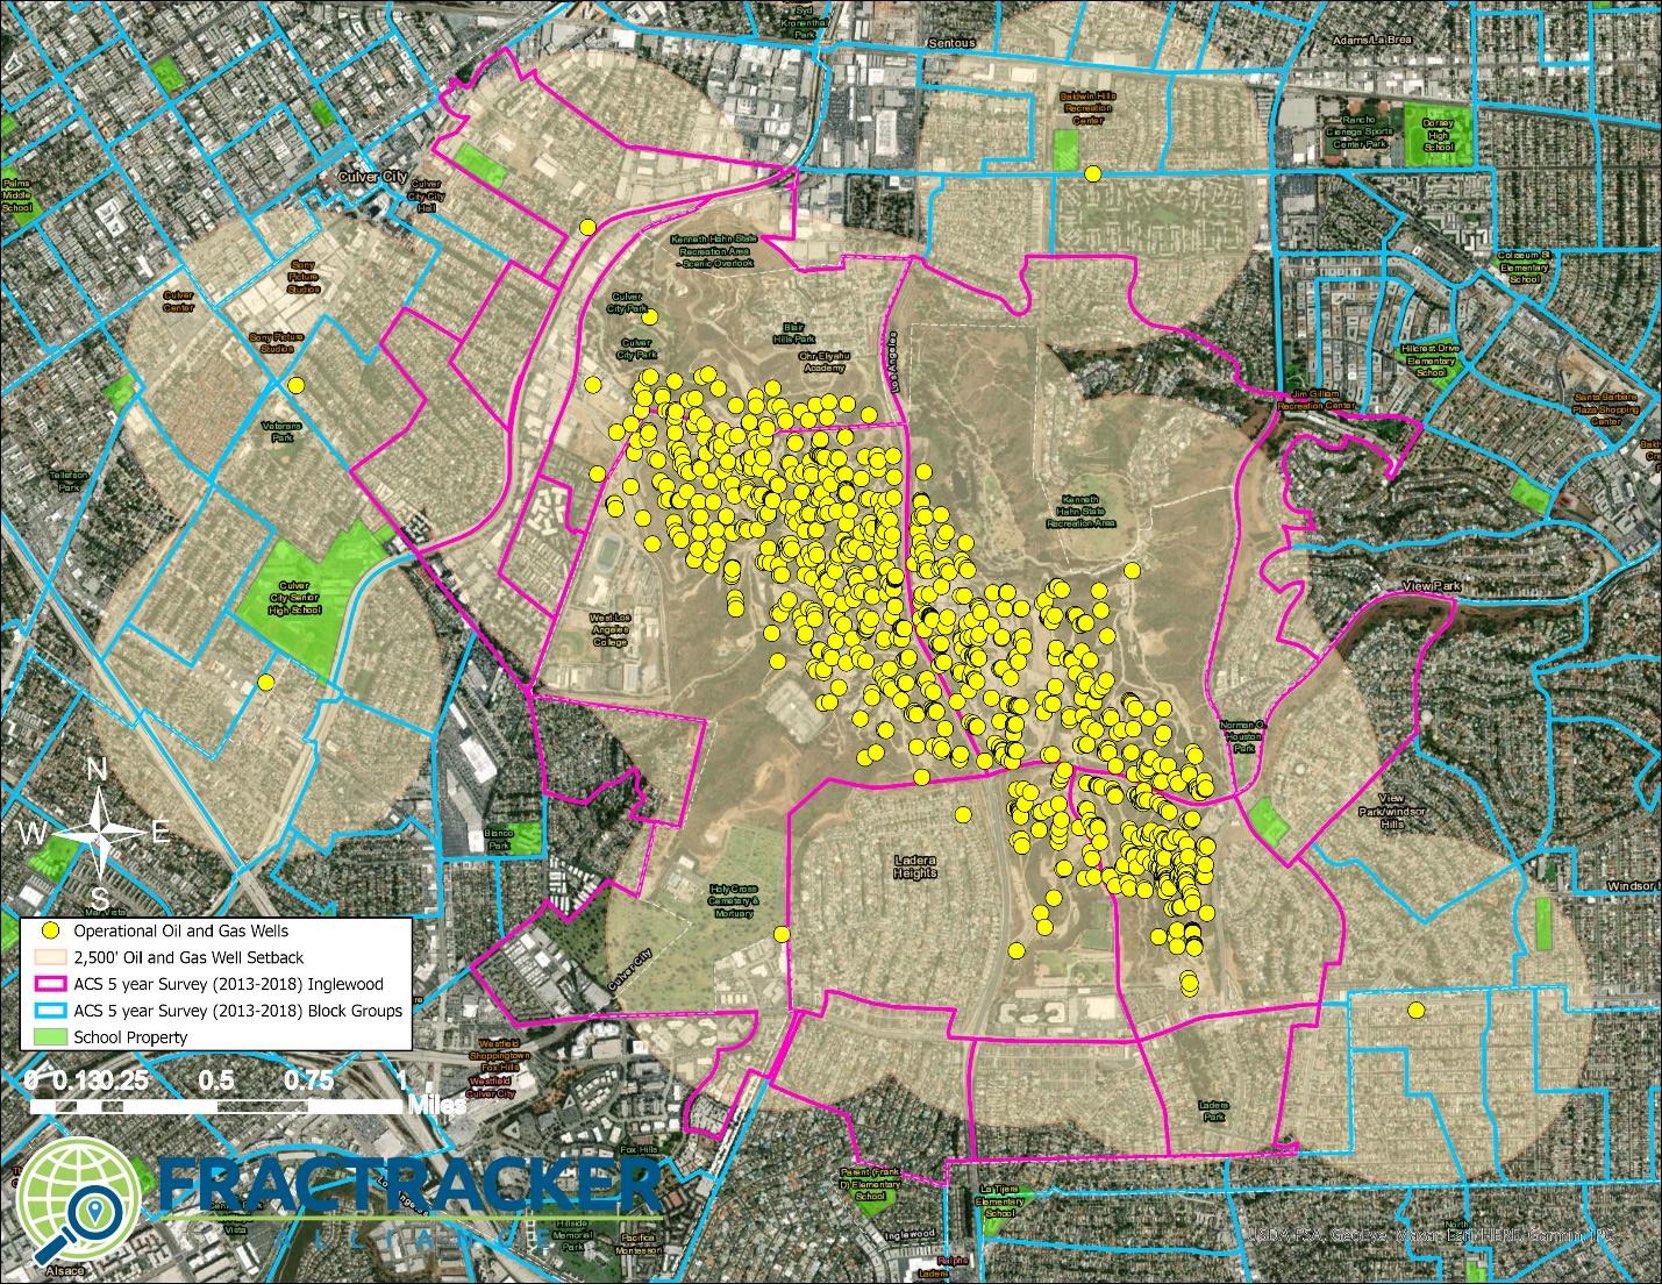
Figure 6. Inglewood Oil Field Frontline Community, Inglewood, California census areas within a 2,500’ setback area. The map shows the 2,500’ setback distance in tan, as well as the census block groups in both pink and blue. Pink block groups show the urban case populations used to generate the demographic summaries.
Wilmington
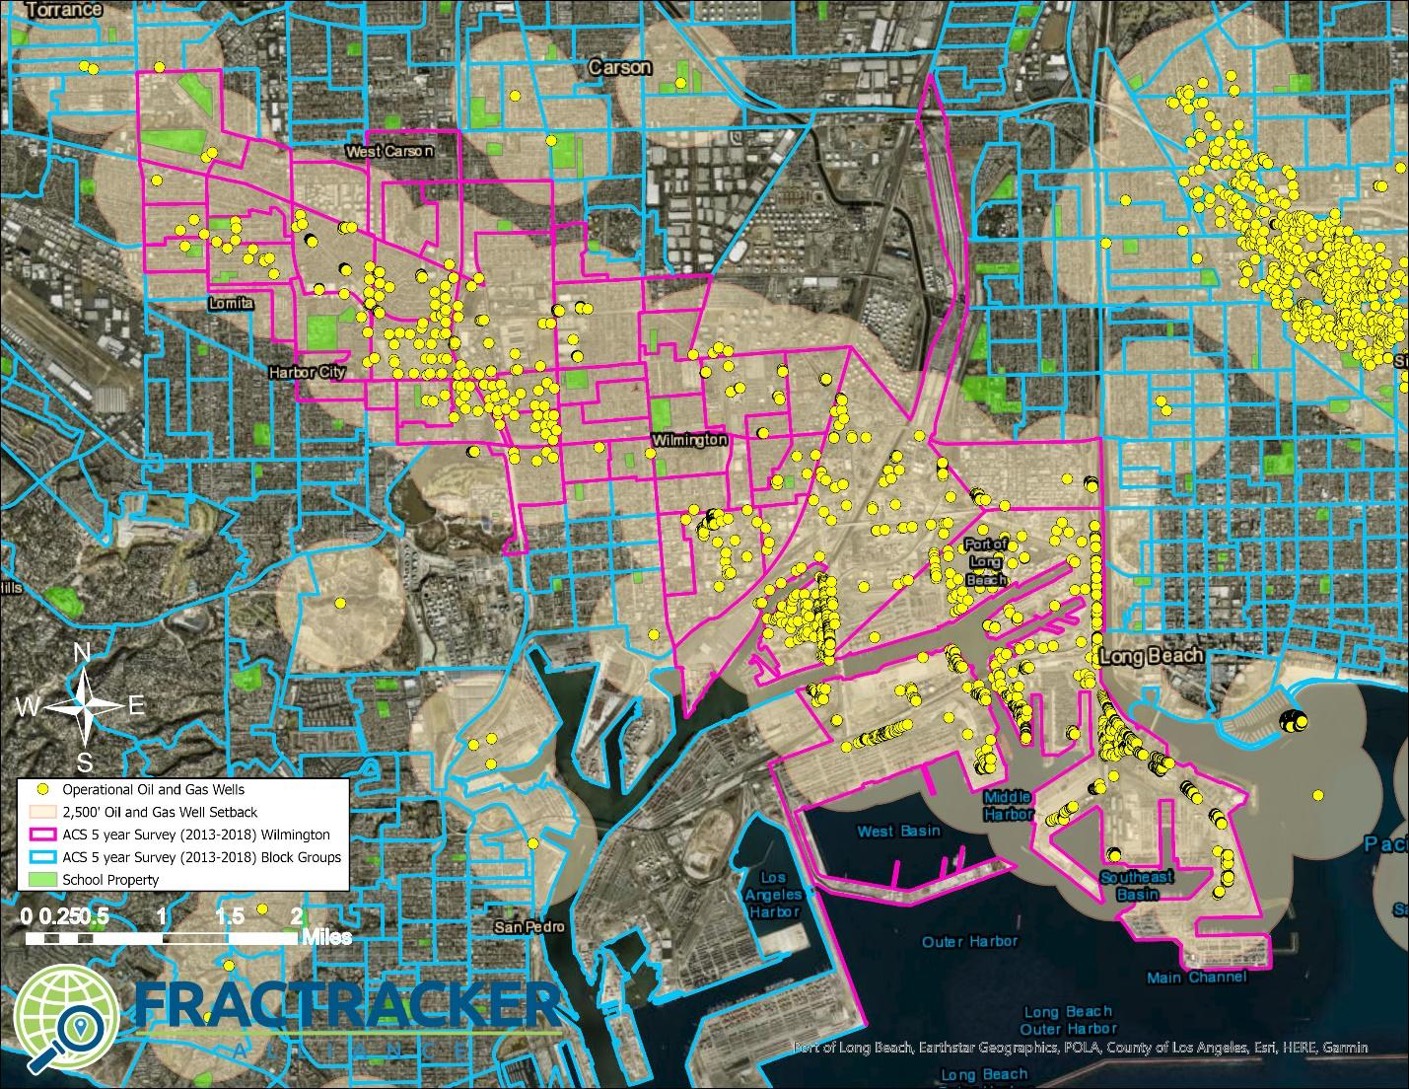
Figure 7. Wilmington Oil Field Frontline Community, Wilmington, California census areas within a 2,500’ setback area. The map shows the 2,500’ setback distance in tan, as well as the census block groups in both pink and blue. Pink block groups show the urban case populations used to generate the demographic summaries.
Long Beach
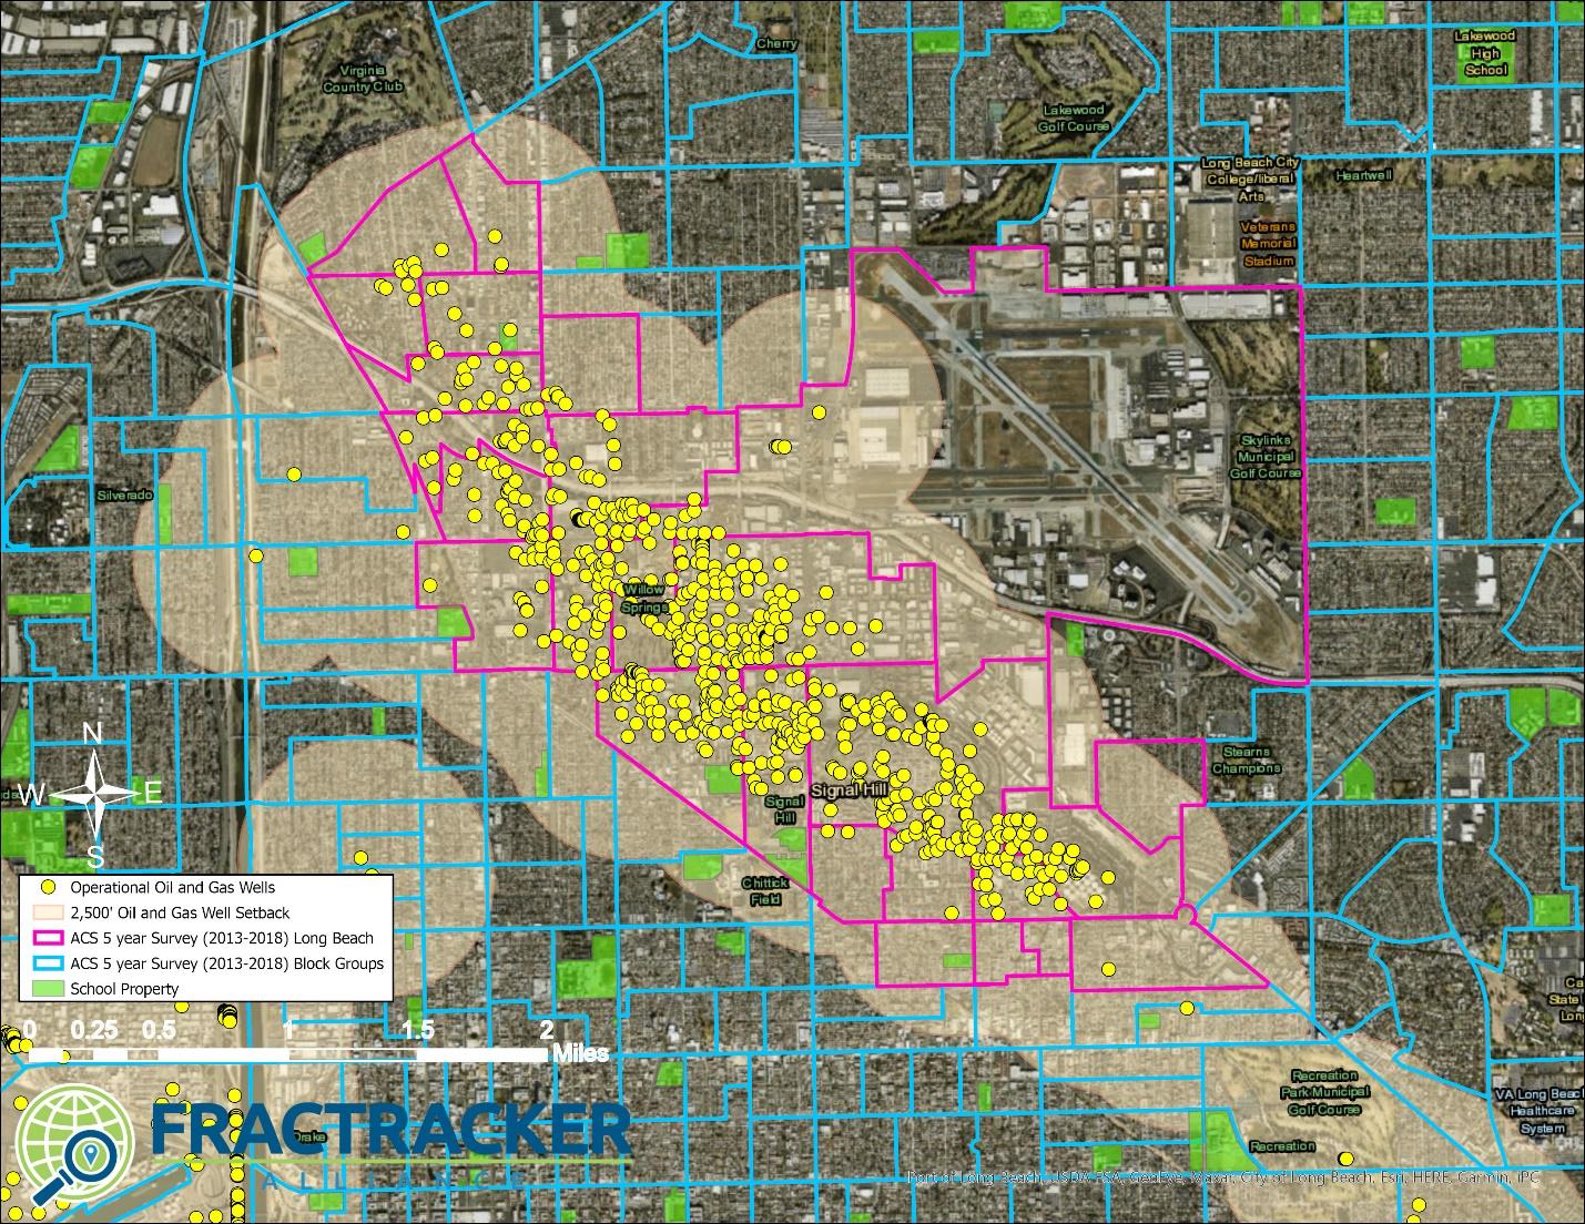
Figure 8. Long Beach Oil Field Frontline Community, Long Beach, California census areas within a 2,500’ setback area. The map shows the 2,500’ setback distance in tan, as well as the census block groups in both pink and blue. Pink block groups show the urban case populations used to generate the demographic summaries.
Los Angeles City
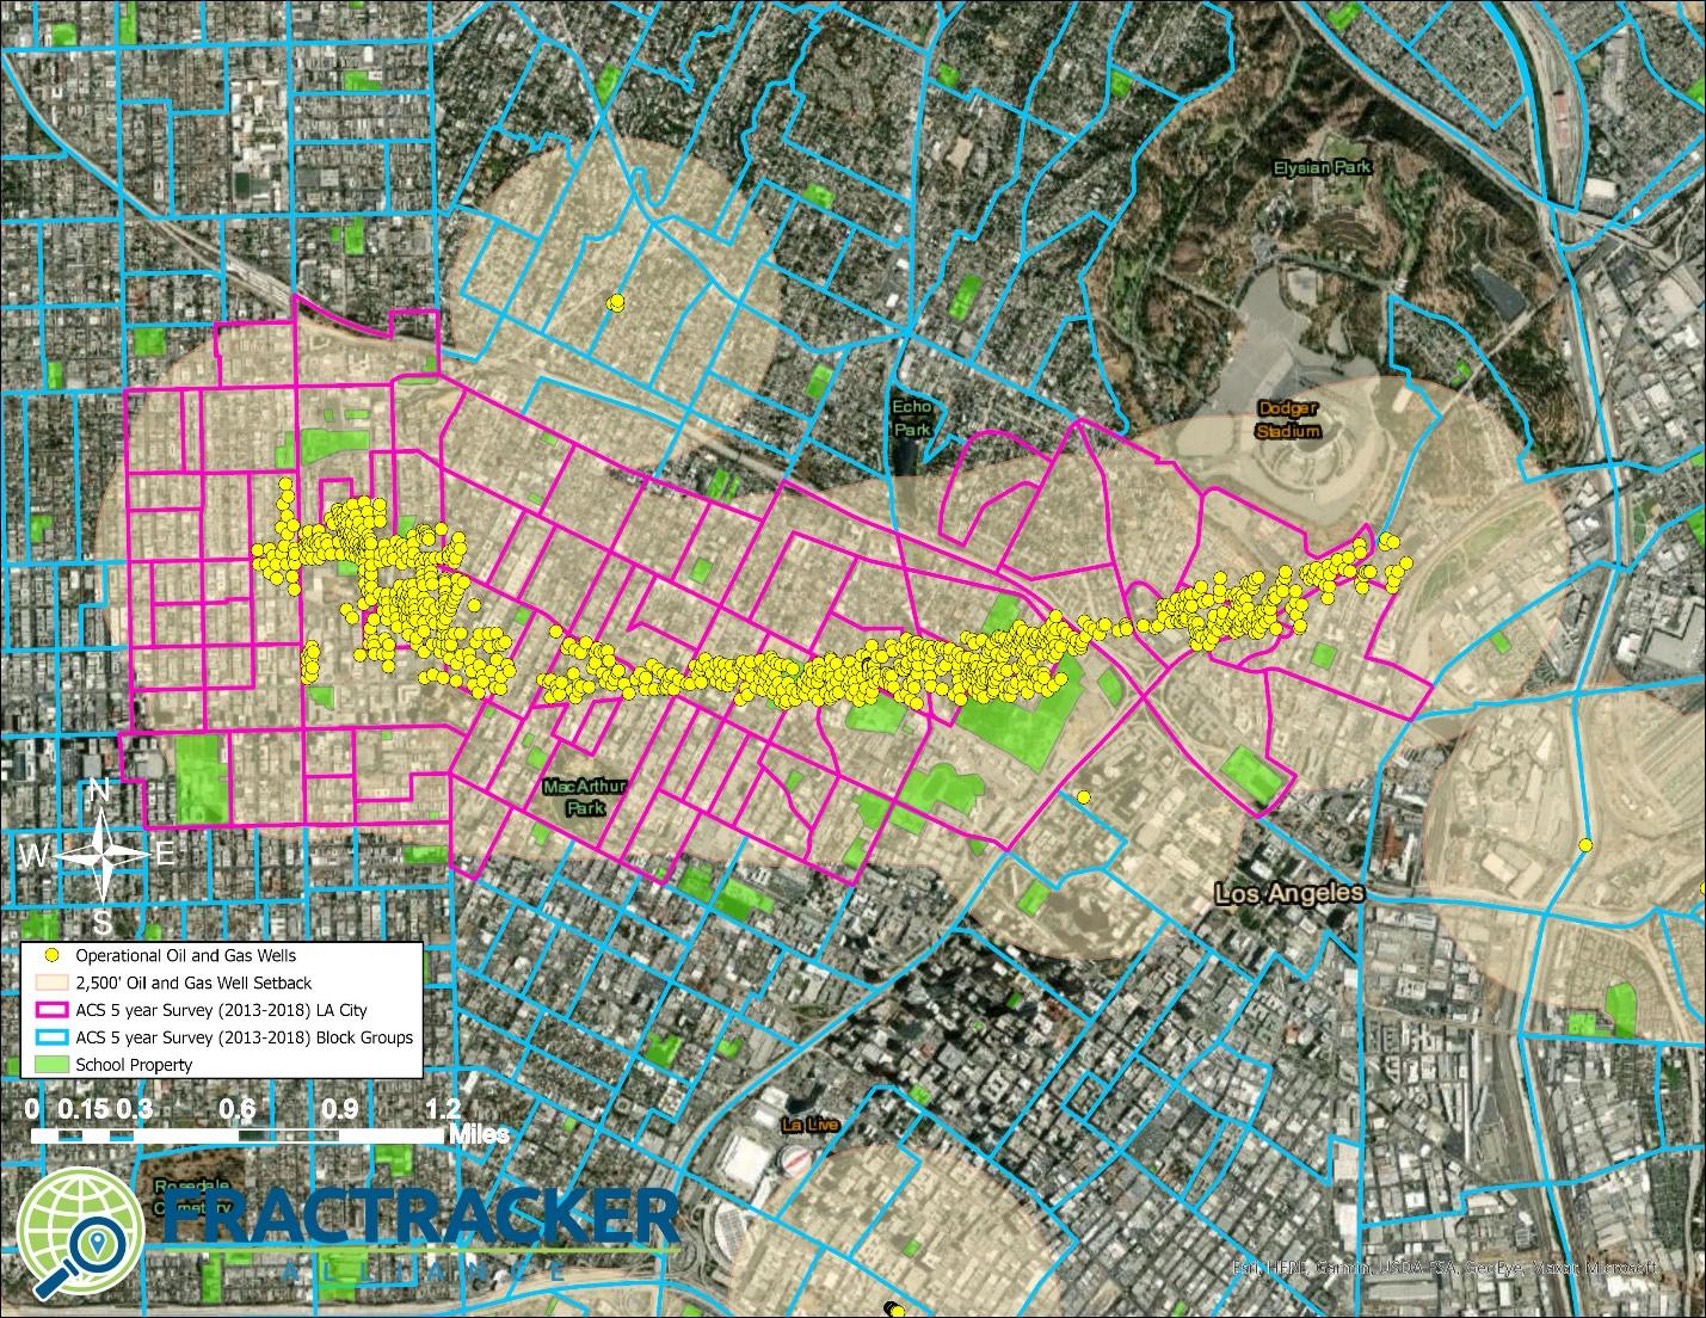
Figure 9. Los Angeles City Oil Field Frontline Community census areas within a 2,500’ setback area. The map shows the 2,500’ setback distance in tan, as well as the census block groups in both pink and blue. Pink block groups show the urban case populations used to generate the demographic summaries.
The creation of public health policies such as 2,500’ setbacks to help protect Frontline Communities is controversial in California as many state legislators are still beholden to the oil and gas industry. The industry itself pushes back strongly against any proposal that could affect their bottom line, no matter how insignificant the financial impact may be. When AB345 was proposed, the industry’s lobbying organization Western States Petroleum Association claimed that institution of 2500’ setbacks would immediately shut down at least 30% of California’s total oil production. This number is an outright fabrication.
As shown in Table 1 above, a 2,500’ setback would impact the less than 9,000 active and new wells; 42% in Kern County and 29% in Los Angeles County. Ventura and Orange Counties are a distant 3rd and 4th, respectively. These counts are further broken down by field in Table 5 below. Statewide these wells accounted for just 12.8% of California’s current oil production by volume (as reported in barrels of oil/condensate by CalGEM), which is much smaller than the wholly unsubstantiated 30% decline claimed by industry.
Table 5. Counts of wells by well status for operational (active, idle, and new) oil and gas wells located within a 2,500’ setback. Fields include the count of wells within the 2,500’ setback and the amount of oil produced from those wells within the setback. The percentage of total oil from that field is also included.
| Oil Field | County | Well Count | Well Ct % of Total | 2019 Oil Prod (BBLS) | Oil Prod % of Total |
| Wilmington | Los Angeles | 2,514 | 83% | 2,292,669 | 22% |
| Kern River | Kern | 1,338 | 9% | 2,121,071 | 12% |
| Inglewood | Los Angeles | 891 | 97% | 1,806,354 | 96% |
| Midway-Sunset | Kern | 1,892 | 10% | 1,614,081 | 8% |
| Ventura | Ventura | 287 | 24% | 1,202,764 | 31% |
| Long Beach | Los Angeles | 687 | 100% | 1,036,506 | 100% |
| Brea-Olinda | Los Angeles | 695 | 97% | 967,223 | 95% |
| Huntington Beach | Orange | 528 | 83% | 753,494 | 42% |
| Placerita | Los Angeles | 448 | 100% | 508,182 | 100% |
| Santa Fe Springs | Los Angeles | 304 | 99% | 421,719 | 72% |
| Cat Canyon | Santa Barbara | 115 | 10% | 418,697 | 36% |
| Beverly Hills | Los Angeles | 156 | 100% | 351,877 | 100% |
| McKittrick | Kern | 334 | 18% | 346,738 | 10% |
| Montebello | Los Angeles | 227 | 98% | 318,657 | 97% |
| Fruitvale | Kern | 286 | 80% | 316,184 | 75% |
| San Ardo | Monterey | 180 | 13% | 313,339 | 4% |
| Torrance | Los Angeles | 219 | 100% | 307,413 | 100% |
| Seal Beach | Los Angeles | 175 | 88% | 282,790 | 74% |
| Shafter, North | Kern | 70 | 78% | 267,256 | 66% |
| Edison | Kern | 520 | 41% | 261,098 | 39% |
| Brentwood | Contra Costa | 4 | 100% | 230,868 | 100% |
| Oxnard | Ventura | 124 | 82% | 214,884 | 100% |
| Sansinena | Los Angeles | 162 | 100% | 207,474 | 100% |
| Poso Creek | Kern | 320 | 16% | 193,533 | 4% |
| Rosecrans | Los Angeles | 94 | 100% | 174,720 | 100% |
| Rio Bravo | Kern | 80 | 74% | 166,444 | 82% |
| Richfield | Orange | 231 | 100% | 165,426 | 100% |
| Coyote, East | Orange | 81 | 100% | 163,639 | 100% |
| San Vicente | Los Angeles | 48 | 100% | 162,940 | 100% |
In the case that setback regulations are crafted both to prohibit new drilling and to phase out existing operations within the setback distance, the industry would have the opportunity to respond with measures that preserve the majority of production volumes, particularly in the Central Valley. For example, in Kern County, the overwhelming majority of new wells drilled in 2020 are directional or horizontal; these drilling technologies would allow operators to access the same below ground resources from surface locations that are further away from and safer for communities. Further, for existing wells within the 2,500’ setback, current proposals would institute a phase out period. Existing wells could be allowed to continue to operate under the terms of their current permits but not allowed to expand or rework their operations to increase or extend production; alternatively (or in addition), well operators could continue for a prescribed timeframe formulated to allow them to recoup their investment (called “amortization”).
It is clear that the oil fields of Los Angeles would be the most impacted if setbacks phased out the wells responsible for the highest risk to Frontline Communities. The majority of Los Angeles’s urban oil fields are located entirely within 2,500’ of homes, schools, healthcare facilities and daycares.
As shown above in Table 5, wells within the setback produce 96% of the oil in the Inglewood fields, 84% in the Long Beach field, and 100% of the oil in several other smaller fields. With the phase out of these wells, oil extraction would cease in these fields. Most of these fields produce very low volumes of oil and already have high counts of idle wells, 28% idle in Wilmington, 25% in Inglewood, and 56% in Long Beach for example. The sole outlier of this trend is the Wilmington field. The majority of production in the Wilmington field comes from wells located in the Long Beach harbor, enough of them located outside of the 2,500’ setback such that while 83% of the Wilmington field wells are within the 2,500’ setback, these wells account for only 22% of the field’s overall production.
The situation in Kern County is quite the opposite of Los Angeles, where the majority of operational wells are located within 2,500’ of homes, residences, and other sensitive receptors like healthcare facilities. In Kern, the overwhelming majority of wells are located beyond 2,500’ and even 1 mile from sensitive receptors. While the Midway-Sunset and Kern River fields have the most wells within the 2,500’ setback area, those wells make up a small percentage of the total operational wells in the fields. As can be seen in the map in Figure 1, wells within the 2,500’ setback zone in the large Kern oil fields are entirely located on the borders of the fields. Overall, a 2,500’ setback in Kern County would only affect 7.1% of active/new wells, accounting for 5.97% of the county’s production.
The oil and gas industry and operators in states including Texas, Colorado, North Dakota, Pennsylvania, Ohio, West Virginia, New Mexico, and Oklahoma are very vocal of their ability to avoid surface disturbance and target oil and gas pools located under sensitive receptors (homes, schools, healthcare facilities, endangered species habitat etc.) using directional drilling. According to the industry, directional drilling has been used for nearly a century to extract resources from areas where surface disruption would impact sensitive communities and habitats.
The same is true for California, especially in Kern County and especially recently. An October 2020 draft environmental impact report by the Kern County Planning and Natural Resource Department disclosed that in a dataset of 9,803 wells drilled from 2000 to 2020 by the California Resources Corporation, the majority of wells were drilled directionally (46%) or horizontally (10%), as opposed to vertically. More recent wells in the County have utilized directional and horizontal drilling even more heavily: a 2020 dataset of wells drilled county-wide indicates that 76% were drilled directionally and an additional 7% were drilled horizontally; only 17% were drilled vertically. These statistics indicate that, even if all wells neighboring Frontline Communities in Kern County were to be phased out (itself a small percentage of the total number of wells in the county), there would only be a small impact on Kern County oil production owing to the prevalence of non-vertical techniques that allow operators the flexibility to access reserves from different surface locations. As noted previously, if all oil production from within the 2,500’ setback zone were to be immediately eliminated statewide, it would mean a maximum decrease of just 12.8% of California’s current annual oil production. But the availability of directional and horizontal drilling in Kern County, where the lion’s share of all drilling statewide occurs, means it is more likely that the decrease in production will be significantly less than 12.8% and likely much less than 10%.
Any assertion that a 2,500’ setback would immediately affect oil production is baseless because current setback proposals would institute a phase out period for existing wells. For example, existing permitted wells could be allowed to continue to operate under the terms of their current permits but not allowed to expand or rework their operations to increase or extend production. Alternatively, under a policy approach known as amortization, well operators could continue for a prescribed timeframe formulated to allow them to recoup their investment.
If wells within the setback distance are phased out pursuant to a “no rework” policy, operators would be afforded some time to maximize production in order to ensure that operators receive a sufficient return on their investment under the terms of their existing permits before they shut down. Under such an approach, older wells with increasing risks of fugitive emissions through leaks at the surface and well casing failures could be sequentially phased out by placing a ban on rework permits not required for maintenance or safety. CalGEM permitted well reworks, including sidetracks and deeper drills, increase production and the lifespan of wells. The catalog of rework permits can be found on the CalGEM website.
Based on CalGEM’s production data from 2018 and 2019, a phase out effectuated by disallowing well reworks would result in an annual reduction of less than 1% of total oil production. Of the 52,997 wells reporting oil/condensate production volumes in 2018, 338 received a rework permit in the same year. In 2019, of the 48,860 wells reporting oil production volumes, 285 received rework permits. By volume, the wells that received rework permits accounted for 0.87% of oil production in 2018 and just 0.04% in 2019.
The oil and gas industry in California has consistently pushed back against Frontline Communities who demand public health protections against emissions from oil and gas operations. This occurs even when there will be little to no impact reducing production. It is an industry policy to refuse any concessions and oppose all measures, even to protect public health, by leveraging the industry’s wealth at every level of the political hierarchy.
Fatefully, 2020 has resulted in multiple wins for public health in California. While the failure of AB345 made it clear that the California state legislature is still beholden to the fossil fuel industry, the momentum has continued. Community grassroots groups in Ventura County successfully passed a 1,500’ setback ordinance for occupied dwellings and 2,500’ setbacks for sensitive receptor sites including healthcare facilities and schools. Just south of Ventura, the County of Los Angeles is also in the midst of a rule-making process that is considering multiple setbacks, including 1,000’ to 2,500’ distances. And a committee of the Los Angeles City Council just voted to develop a proposal that would phase out oil drilling across the city as a non-conforming use.
While Ventura and Los Angeles are making progress, Kern County is creating a new process to streamline oil and gas well permitting and has even proposed to decrease the existing zone-specific 300’ setbacks from homes to 210’.
Kern County Frontline Communities and the rest of California also deserve the same consideration as residents of Ventura and Los Angeles Counties. The research is clear that a setback of at least one mile in addition to more site specific public health interventions are necessary to reduce the negative health impacts resulting from these industrial operations within and neighboring Frontline Communities.
By Kyle Ferrar, Western Program Coordinator, FracTracker Alliance
FracTracker and Public Lab, with support from Save the Hills Alliance, produced “Undermined,” an audio story featuring interviews with three residents impacted by the Hi-Crush Mine in Augusta, Wisconsin.
![]()
216 Franklin St, Suite 400, Johnstown, PA 15901
Phone: +1 (717) 303-0403 | info@fractracker.org
FracTracker Alliance is a 501(c)3 non-profit: Tax identification number: 80-0844297
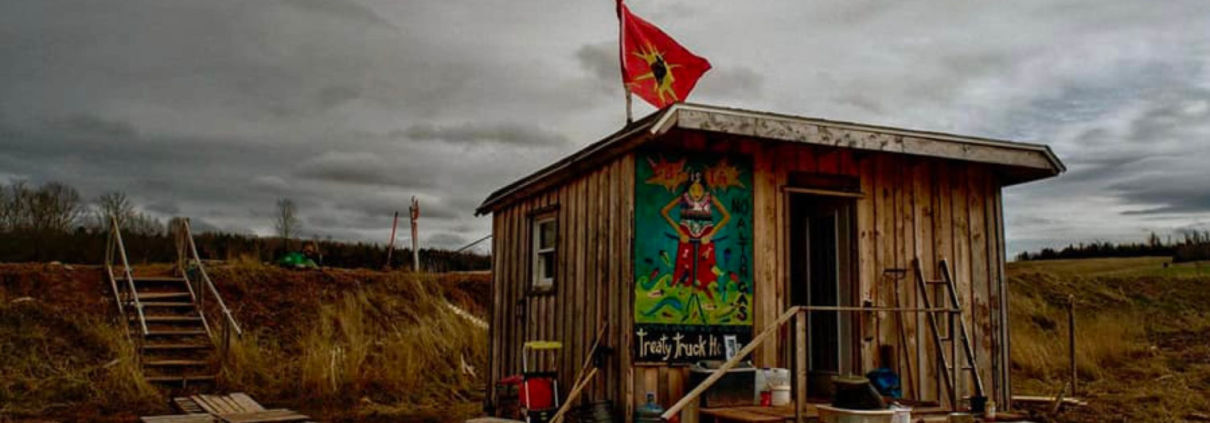 Jared Durelle

")
