8 Maps to Strengthen Environmental Justice Policy in Pennsylvania
Pennsylvania’s environmental justice policy is an important tool for protecting marginalized communities from harm – but it needs your input!
Pennsylvania’s environmental justice policy is an important tool for protecting marginalized communities from harm – but it needs your input!
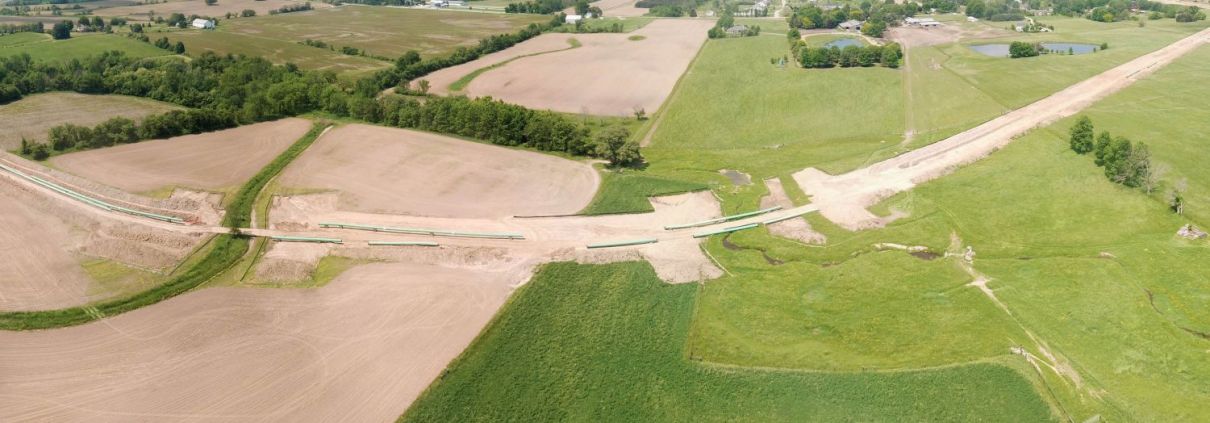
This story map contains audio clips and quotes from local officials and residents on the impacts of oil & gas pipelines in their communities.
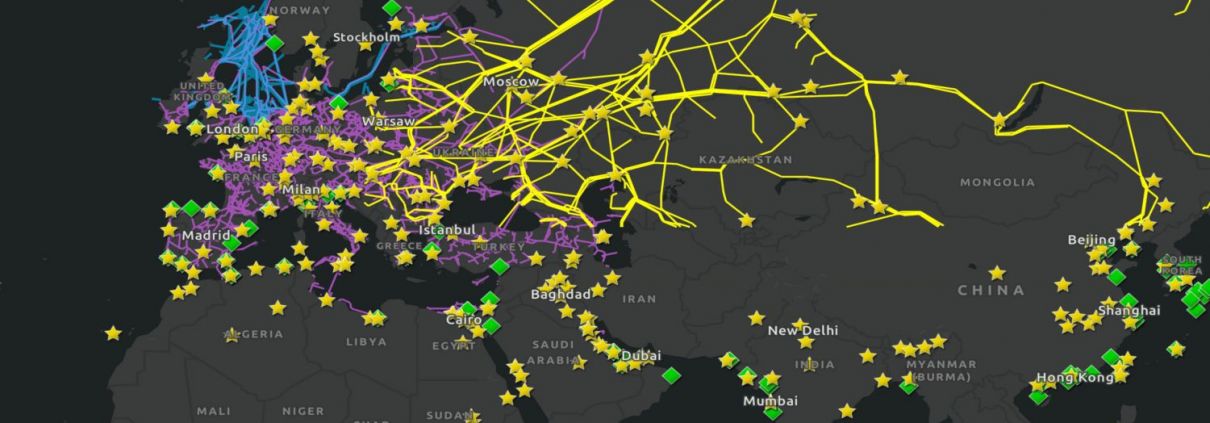
This story map explores how the West’s failure to transition from fossil fuels to renewable energy is funding Russia’s invasion of Ukraine

The story of Victoria Switzer, a Dimock resident who is leading the charge to protect Burdick Creek and Dimock from toxic fracking waste.
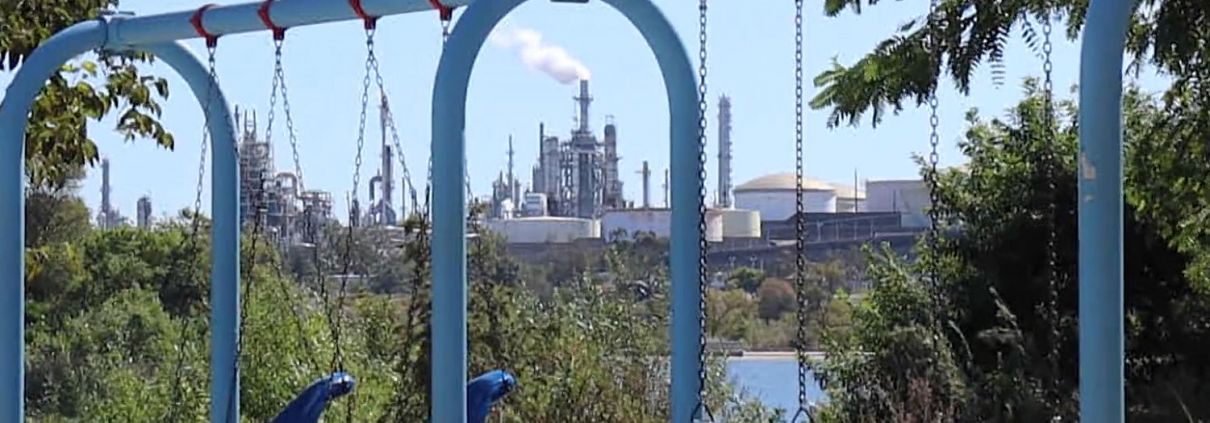
FracTracker’s Erica Jackson outlines ten things she learned in Break Free From Plastic’s virtual Toxic Tours.
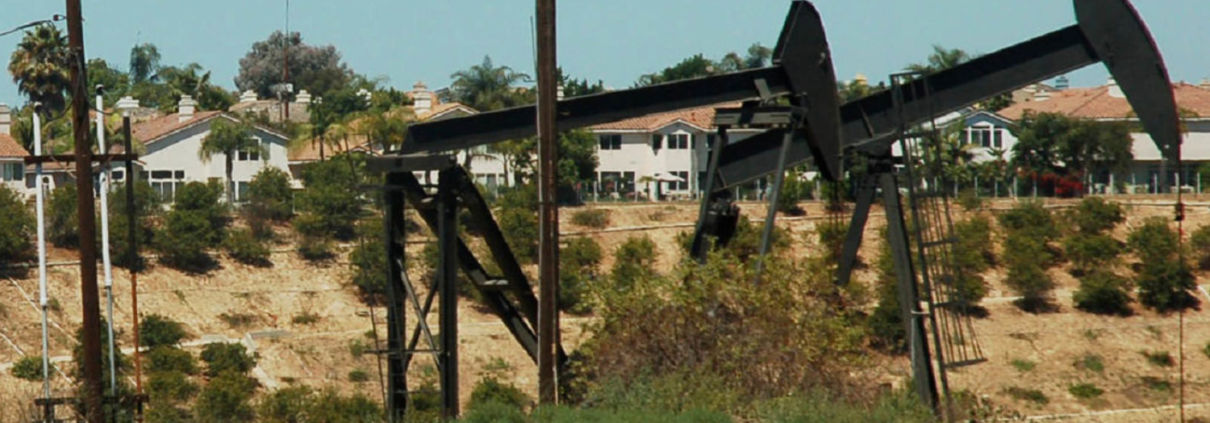
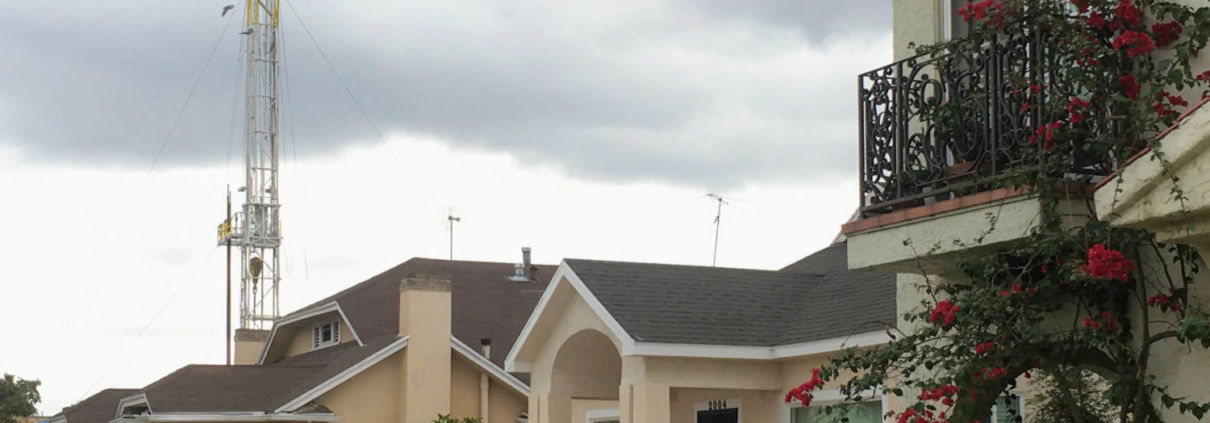
Oil & gas wells in Los Angeles disproportionately impact marginalized communities, producing dangerous levels of invisible, toxic emissions.
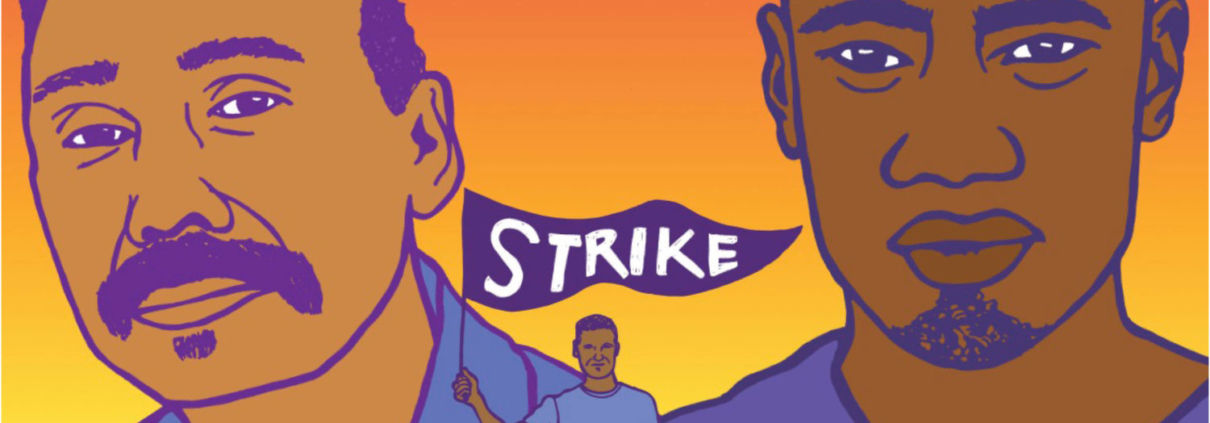
California prisoners are on the frontlines of the environmental justice movement, thousands living within 2,500’ of operational O&G wells.
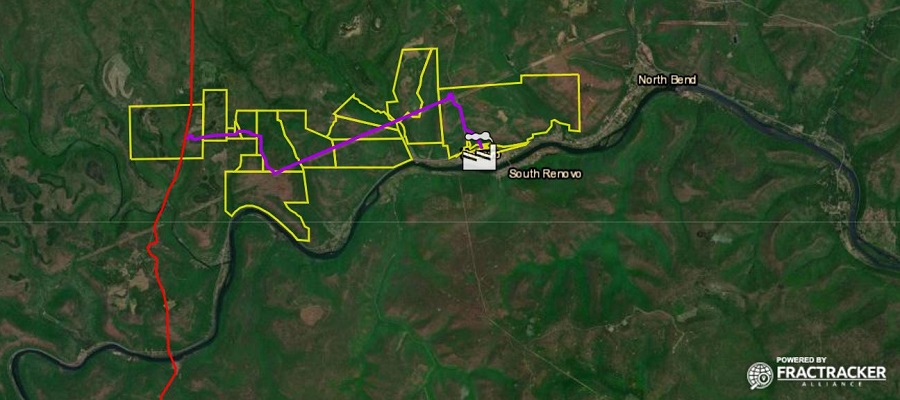
Residents and local advocacy groups are fighting a new power plant in Renovo, PA, planned to be constructed on an abandoned rail yard.
California drilling permits continue while Frontline communities and grassroots groups call for an immediate moratorium and 2,500′ setback.
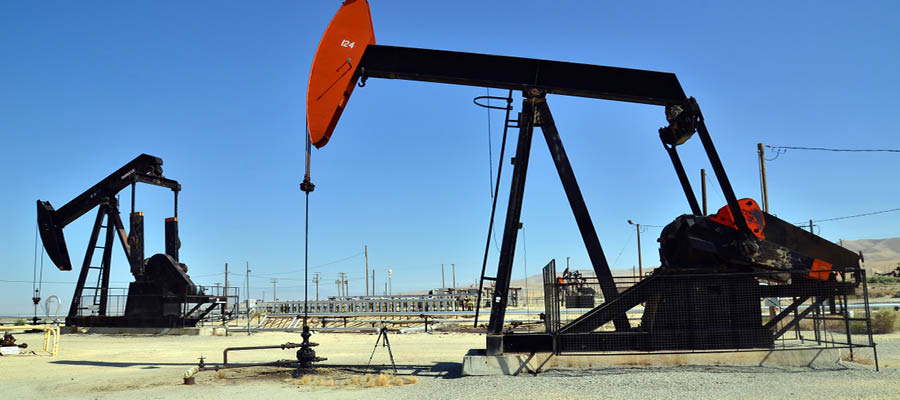
As California permit approvals for new oil & gas well drills decrease, Consumer Watchdog urges the Governor to move from fossil fuels.
![]()
216 Franklin St, Suite 400, Johnstown, PA 15901
Phone: +1 (717) 303-0403 | info@fractracker.org
FracTracker Alliance is a 501(c)3 non-profit: Tax identification number: 80-0844297