By Brook Lenker, Executive Director, FracTracker Alliance
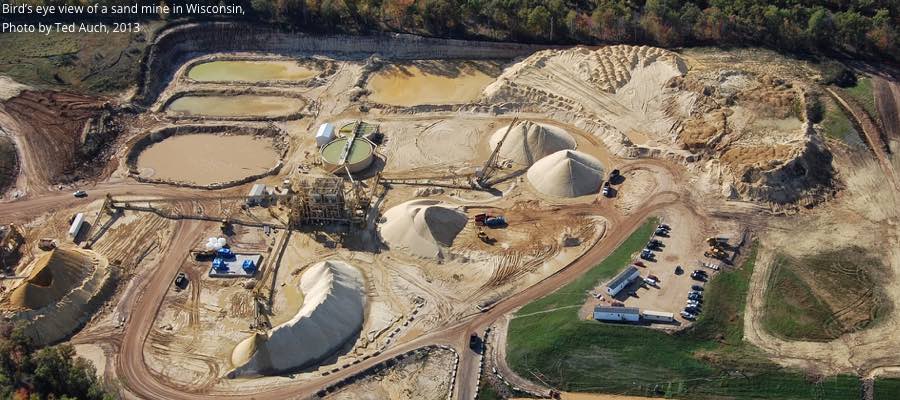
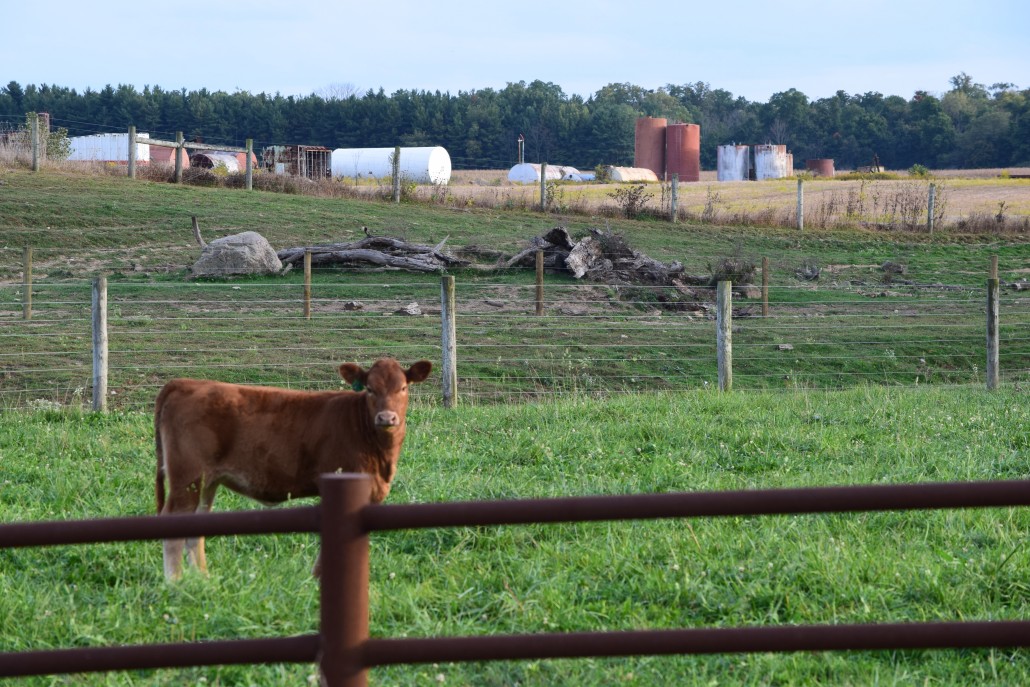
Frac sand mining is a growing threat to the agricultural landscapes of the upper Midwest and a health risk to those who live near the mines. With a general slowdown in the oil and gas industry, sand mining may seem a lessening concern in the universe of extraction impacts, but a recent visit to Wisconsin during Earth Week suggested otherwise.
Frac Sand Mining Presentations
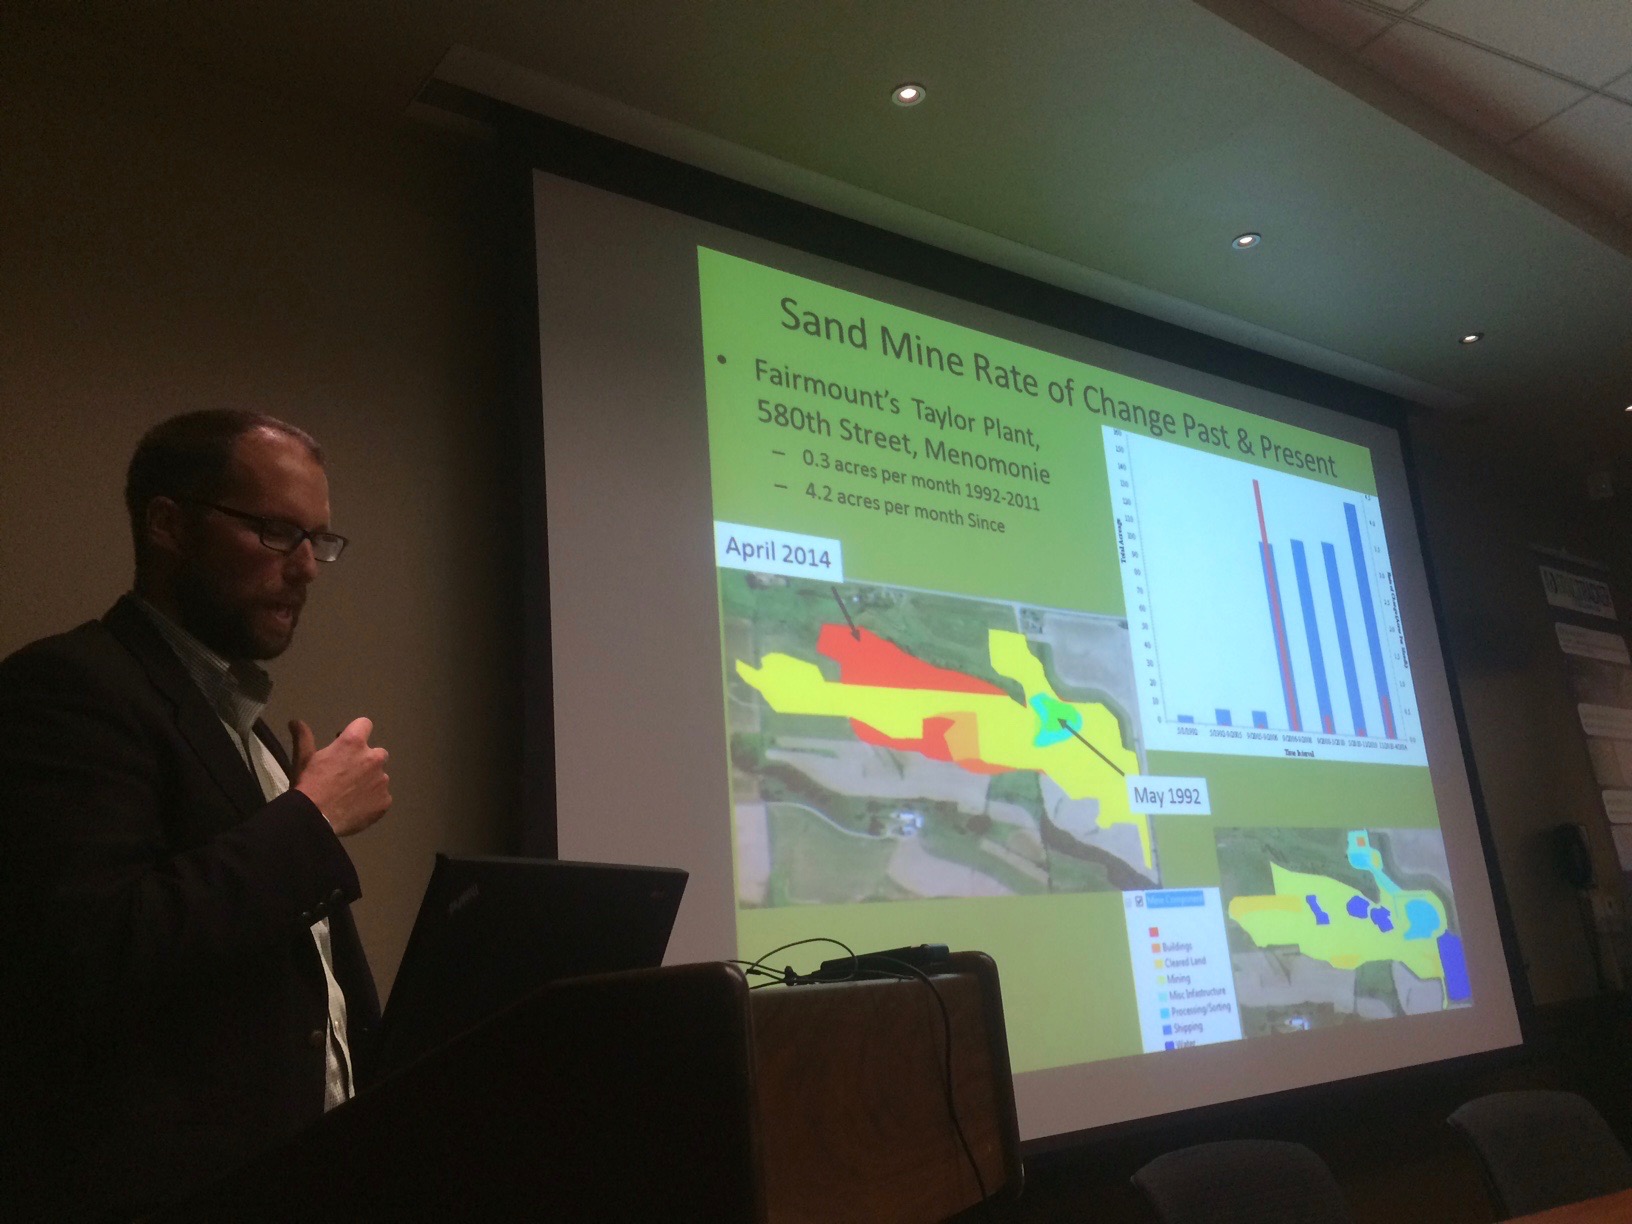
Dr. Auch presenting in Wisconsin on frac sand mining issues
I joined my colleague, Dr. Ted Auch, on an informative cross-state tour that started in Milwaukee. We were presenters at the Great Lakes Water Conservation Conference where representatives from breweries around the region and across the country came together to discuss their most precious commodity: clean and abundant water. Extraction affects both the quantity and quality of water – and our insights opened many eyes. Businesses like microbreweries with a focus on sustainability and a strong environmental ethic recognize the urgency and benefit of the renewable energy transformation.
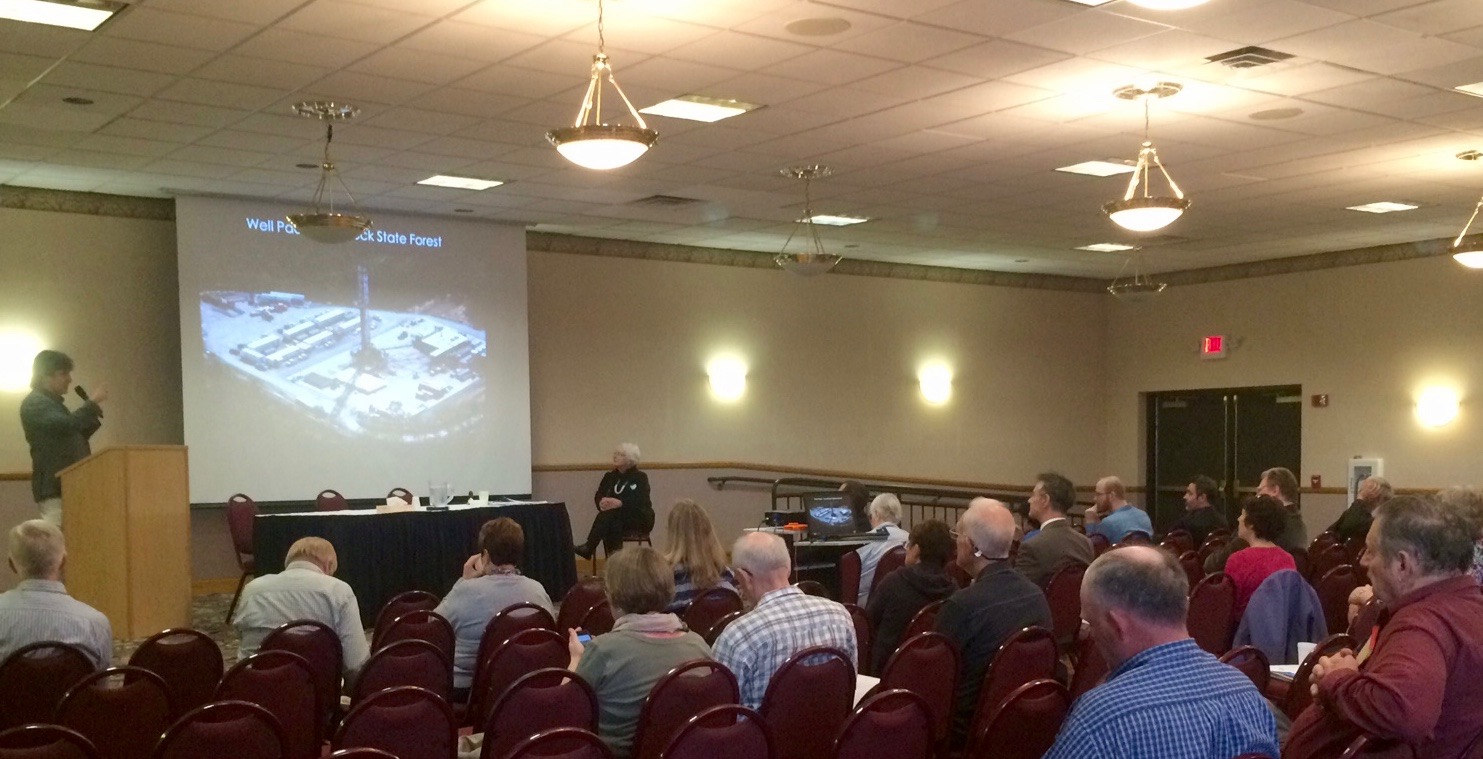
From Milwaukee, we headed west to Madison and the University of Wisconsin where Caitlin Williamson of the Wisconsin Chapter of the Society for Conservation Biology organized the first of two forums entitled “Sifting the Future: The Ecological, Agricultural, and Health Effects of Frac Sand Mining in Wisconsin.” We were joined by Kimberlee Wright of Midwest Environmental Advocates to address an engaged audience of 35 people from the campus and greater community. Thanks to Wisconsin Eye, a public affairs network, the entire program was videotaped.
Brook Lenker presenting at Sifting the Future event in Wisconsin
A long drive to Eau Claire revealed rolling farmland, wooded hills, and prodigious wetlands home to waterfowl and the largest cranberry industry in the nation. At the Plaza Hotel, we met Cheryl Miller of the Save the Hills Alliance, the grantor enabling us to study the regional footprint of sand mining, and Pat Popple, advocate extraordinaire and our host for the second “Sifting the Future” event. The good folks at Public Lab were also in town to facilitate citizen monitoring of silica dust from the mining process, including a free workshop and training that weekend.
The evening program attracted 50 people from as far away as Iowa and Minnesota. Their interest in and knowledge of sand mining issues was impressive, and many were heavily involved in fighting local mines. Dr. Crispin Pierce spoke of his research about airborne particulates around frac sand operations, complementing both FracTracker presentations – mine emphasizing the broad array of environmental and public health perils related to oil and gas extraction and Ted’s examining the scale and scope of sand mining, demand for proppant, and the toll of the industry on agricultural productivity, forests and the carbon cycle.
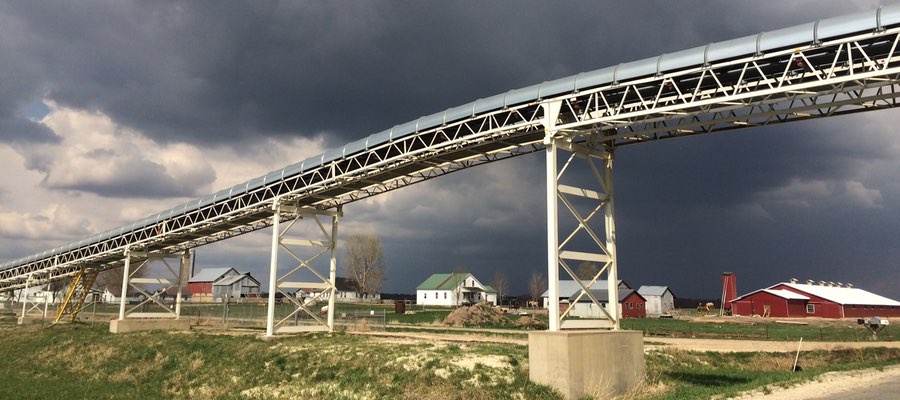
Mining Photos
During the five day trip, sand mines were visited and documented, their incongruent and expanding presence marring the countryside. Some of them can be seen in this photo gallery:
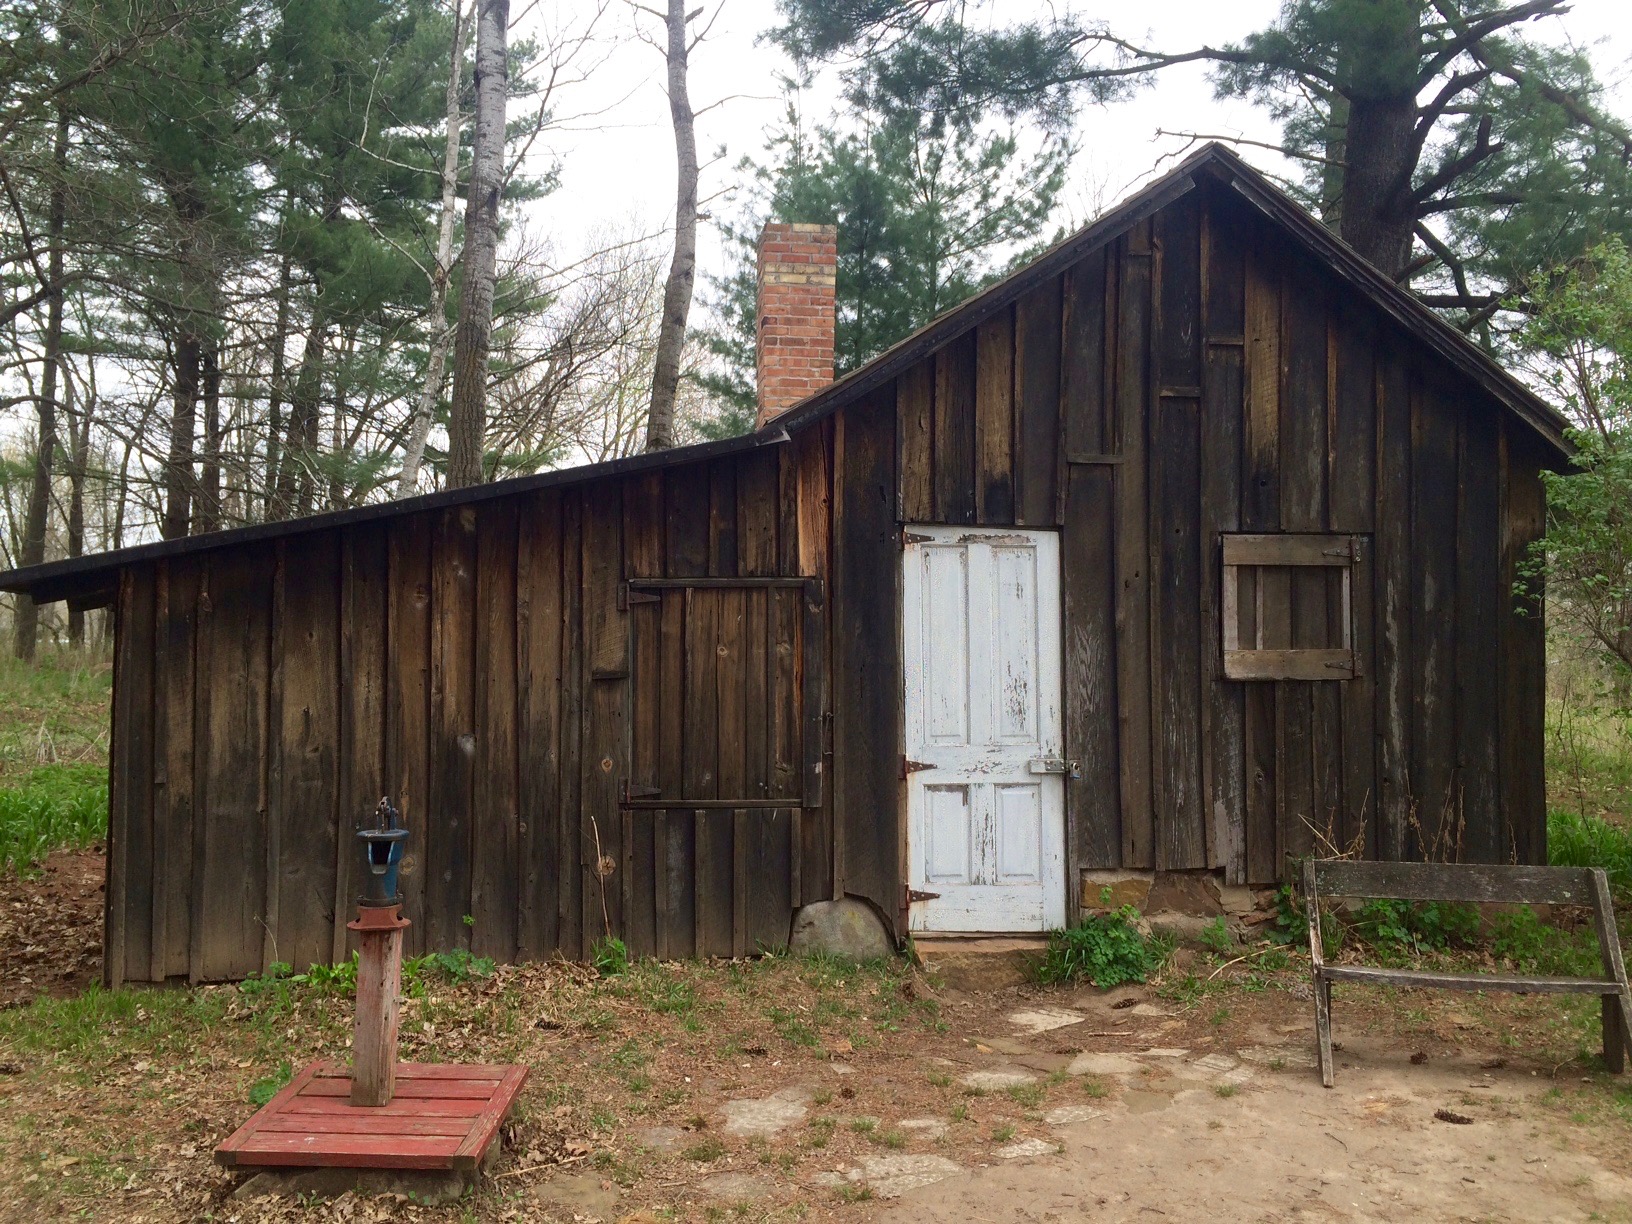
On Earth Day, while driving east to return to Milwaukee, Sandhill cranes, a timeless symbol of the Wisconsin wild, poked the rich prairie soils searching for food. Joined by Autumn Sabo, a botanist and researcher who assisted our Wisconsin work, we detoured to the nearby Aldo Leopold Center visiting the simple shack that inspired Mr. Leopold to write Sand County Almanac. Considering the reason for my travel, the irony was thick. Ecological consciousness has come a long way, but more evangelism is sorely needed.
Aldo Leopold Center, Wisconsin
https://www.fractracker.org/a5ej20sjfwe/wp-content/uploads/2016/05/WITour-Feature.jpg400900Guest Authorhttps://www.fractracker.org/a5ej20sjfwe/wp-content/uploads/2025/09/2025-Wordmark-Logo.pngGuest Author2016-05-05 15:36:252020-03-11 17:07:10Earth Week in Wisconsin
Ludington State Park, Sargent Sand’s Mine, and US Silica and Sylvania Minerals By Ted Auch, Great Lakes Program Coordinator
When it comes to high-volume hydraulic fracturing (HVHF), frac sand mining may be the most neglected aspect of the industry’s footprint. (HVHF demand on a per-well basis is increasing by 8% per year.)
To help fill this gap I decided to head out on the road to visit, photograph, and listen to the residents of this country’s primary frac sand communities. This multimedia perspective is part of our ongoing effort to map and quantify the effects of silica sand mining on communities, agriculture, wildlife, ecosystem services, and watersheds more broadly. Below is my follow up attempt to give The FracTracker Alliance community a sense of what residents are hearing, seeing, and saying about the silica sand mining industry writ large, through a tour of 7 sand mining communities – part 2. Read part 1.
Monroe County, MI
Monroe County, Michigan is approximately 22 miles south on I-75 from downtown Detroit with similar demographic differences to the Chicago-LaSalle County, IL comparison we made during the first part of this series. South Rockwood lies along the Northeastern edge of Monroe County and the Monroe-Wayne County border, and is consequently at the intersection of Detroit’s sprawl and rural Michigan.
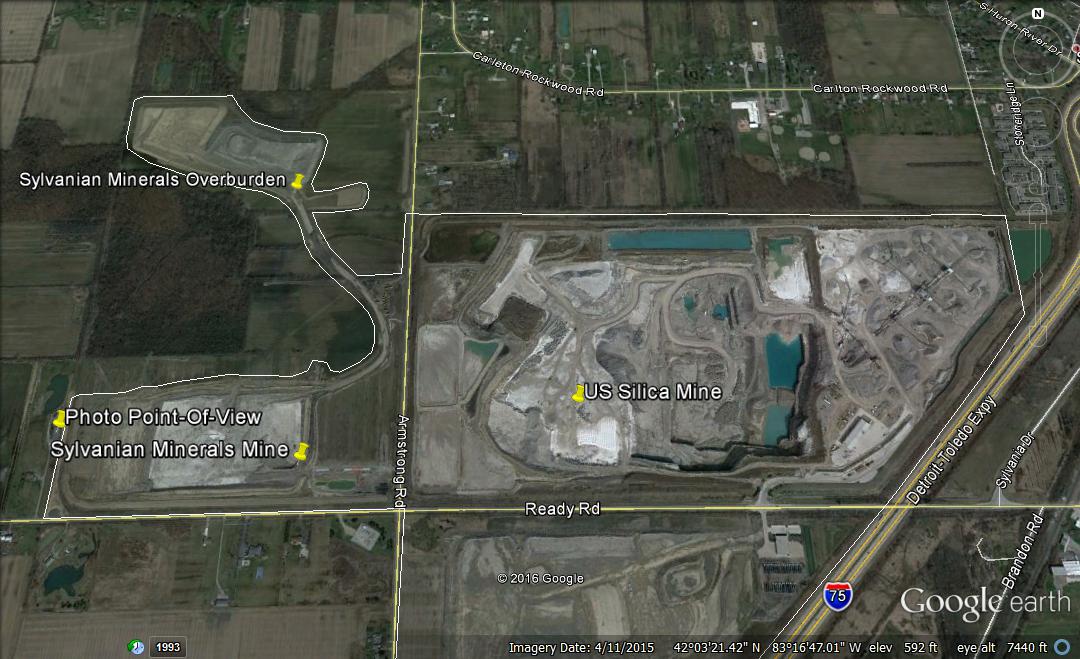
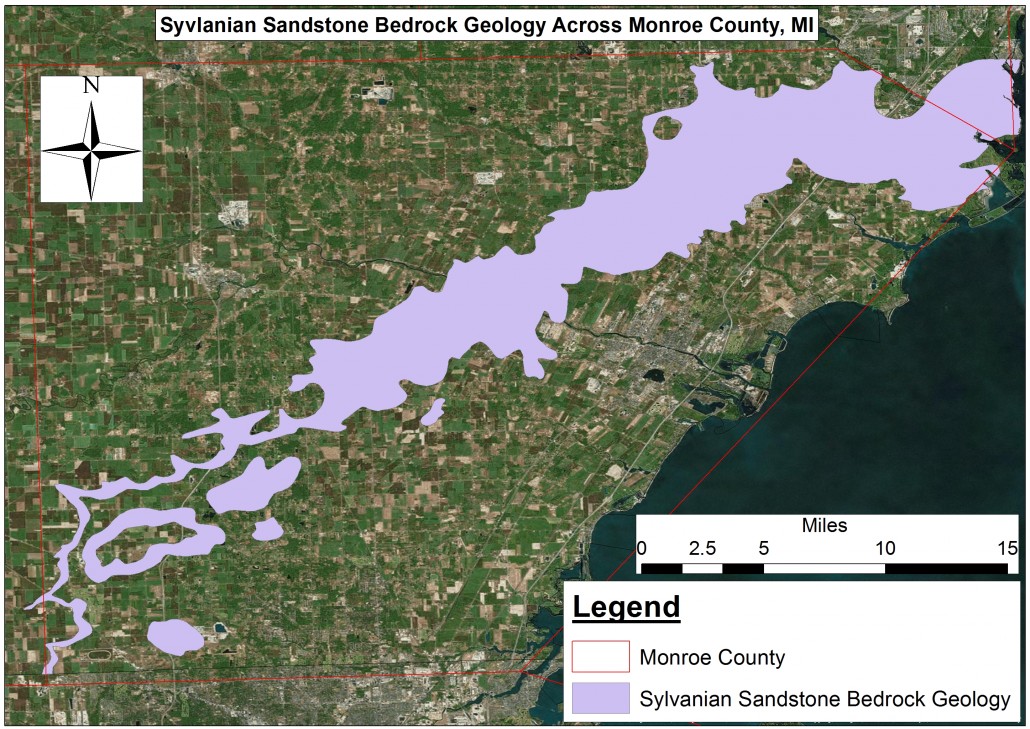
Monroe County and nearly all of South Rockwood is underlain by one of the purest sandstone formations in North America. The Sylvanian Sandstone formation lies beneath 20% of Monroe County stretching from the aforementioned Wayne County border south-southwest to Lucas County, OH (Fig. 1). It is this formation that mining stalwarts such as US Silica and the appropriately named Sylvanian Minerals are mining for frac sands. Not only is the silica pure, but it is also extremely close to the surface. The region, conveniently, is situated at the crossroads of numerous rail lines capable of transporting the sand to shale plays in the east and North Dakota alike.
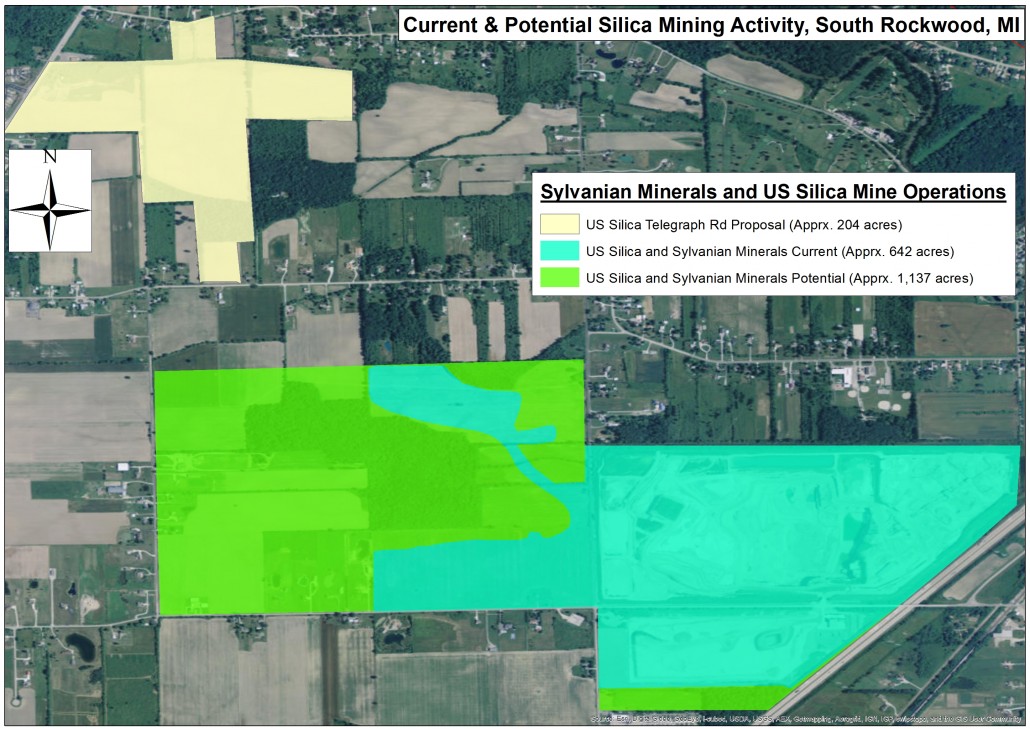
US Silica and Sylvanian Minerals are neighbors at the corner of Ready and Armstrong Roads in South Rockwood, with the former adjacent to I-75’s southbound lanes (Fig. 2). As of fall 2011, Sylvanian Minerals hadn’t even broken ground on its initial stab at mining frac sands. Presently the two firms have altered nearly 650 acres, or 40% of the community, with the potential to mine an additional 494 acres. These plans suggest that these two companies could collectively alter 72% of the community’s topography.
This domination of the landscape and commerce concerns many South Rockwood citizens including Sylvanian’s immediate neighbor Doug Wood, who has been the industry’s primary citizen watchdog over the last couple years (photo below).
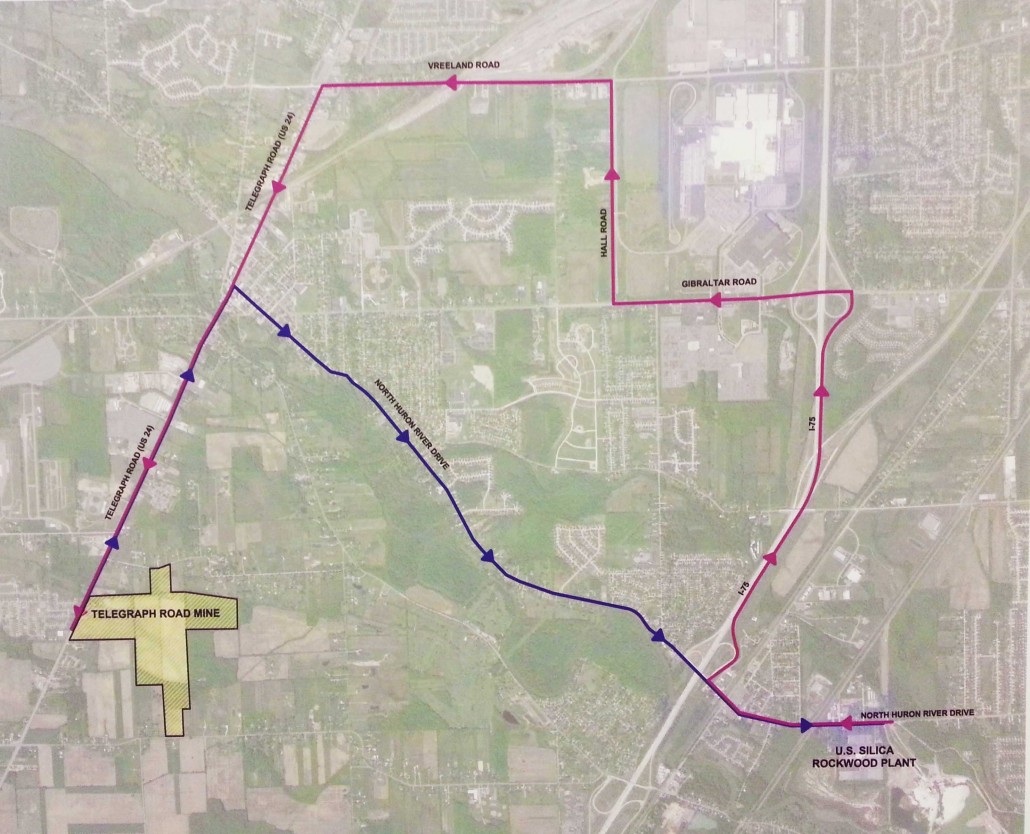
Mr. Wood was generous enough to let us climb to the top of his barn to snap some photos of the mine. Mr. Wood witnessed the foundation of his home become compromised by the numerous blasting events down in Sylvanian’s mine, and only recently found out that the collective activity at the mines is going to force exit 26 off I-75 to be rerouted to Ready Road, converting this sleepy road into the primary entrance/exit for mine-related traffic. In addition, with the approval of Michigan’s Governor Rick Snyder, US Silica’s Telegraph Road Mine proposal has Mr. Wood and his neighbors worried about the safety of their families, the air pollution they inhale from the dust and potentially airborne silica, and the truck traffic related noise, which will all undoubtedly influence their health and quality of life.
The primary take-home message from this stop on my tour was that we have only seen the tip of the iceberg with respect to the potential of frac sand mining to literally and figuratively alter communities. Other affected areas such as South Rockwood could learn quite a bit from the likes of LaSalle County, IL residents Anna Mattes, Tom Skomski, and Ashley Williams.
On to the dunes of Western Michigan and Ludington State Park!
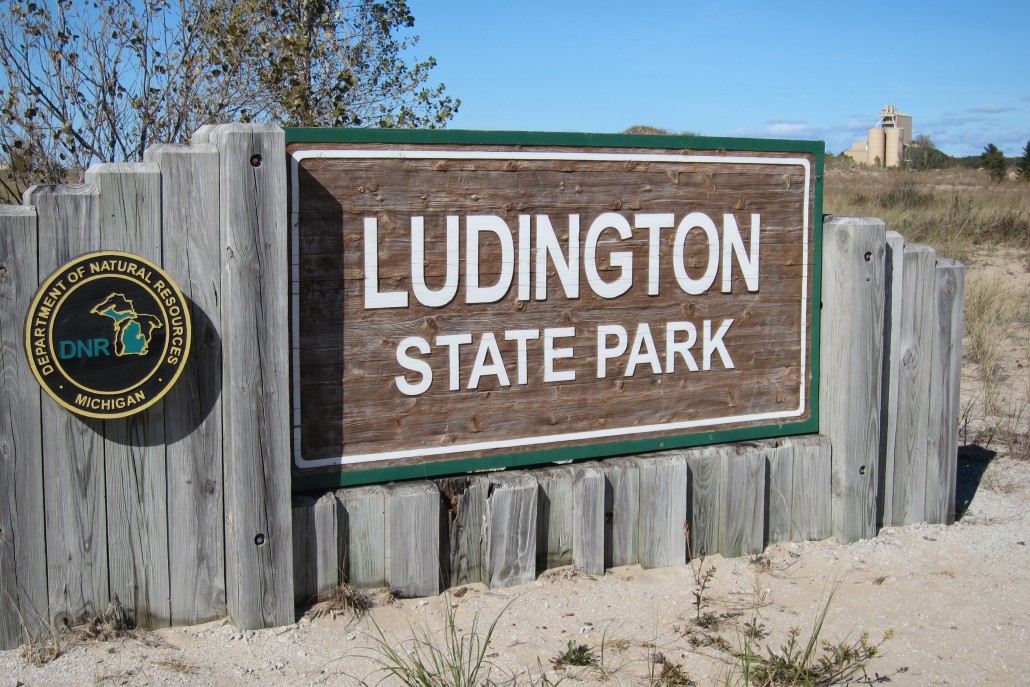
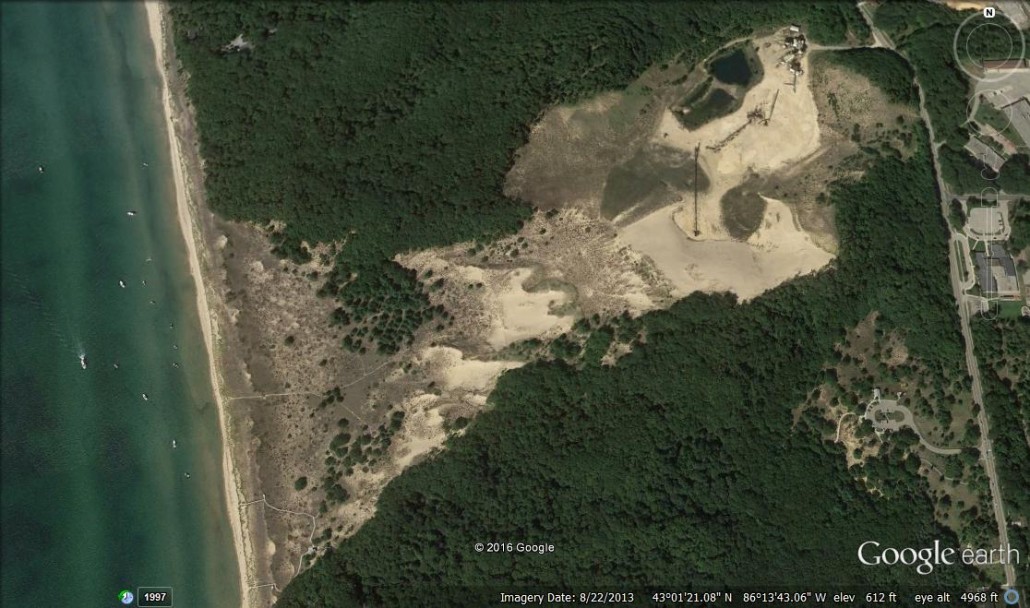
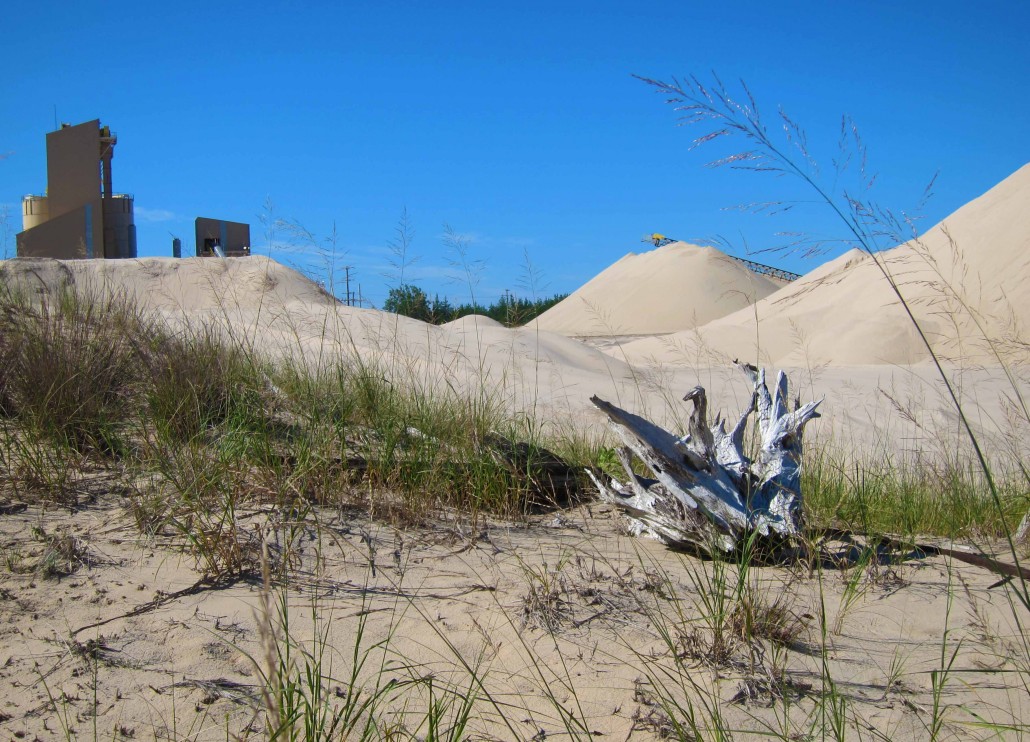
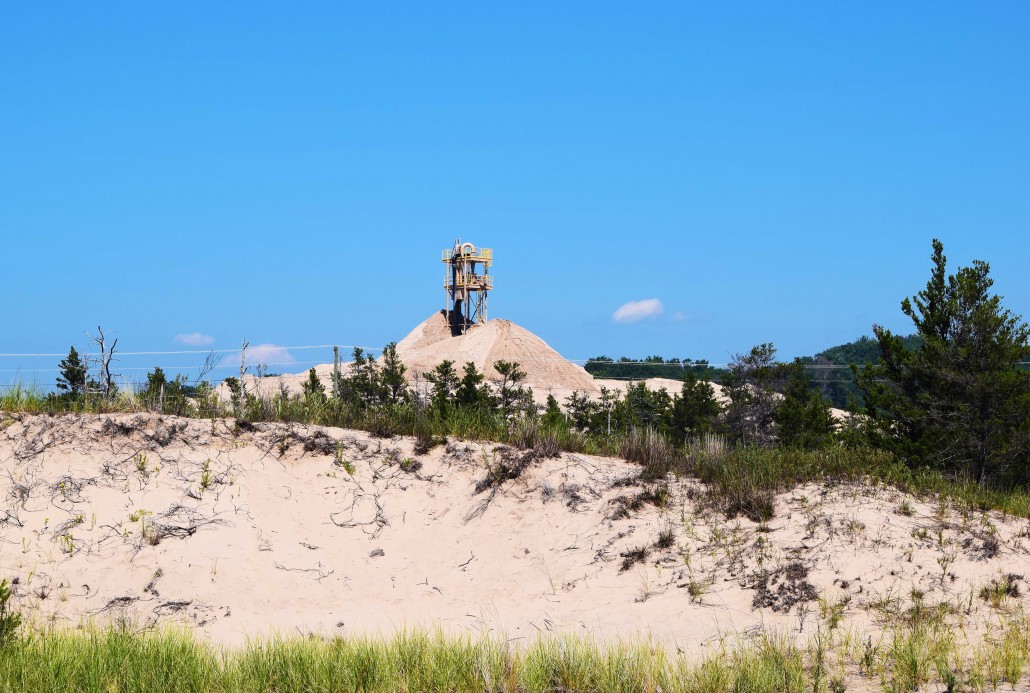
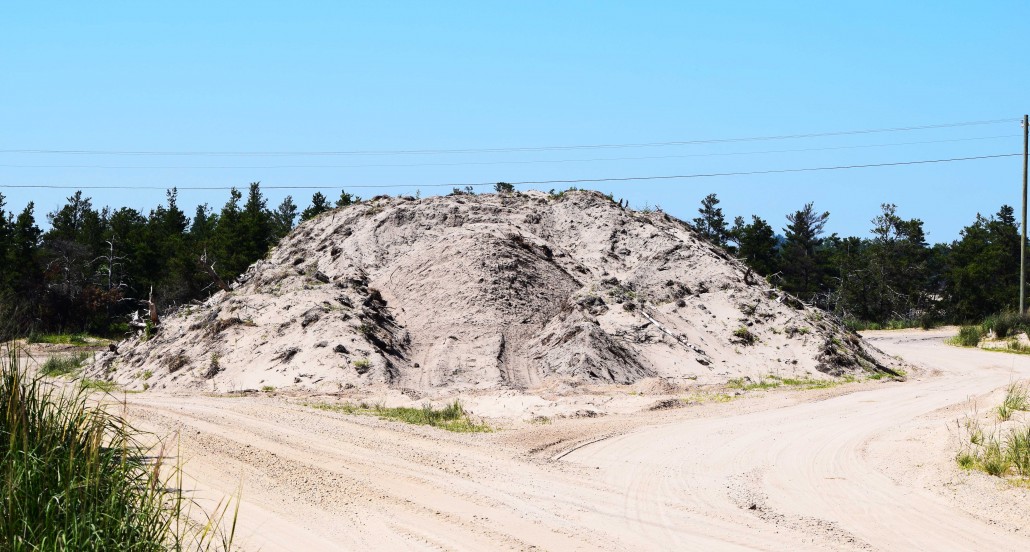
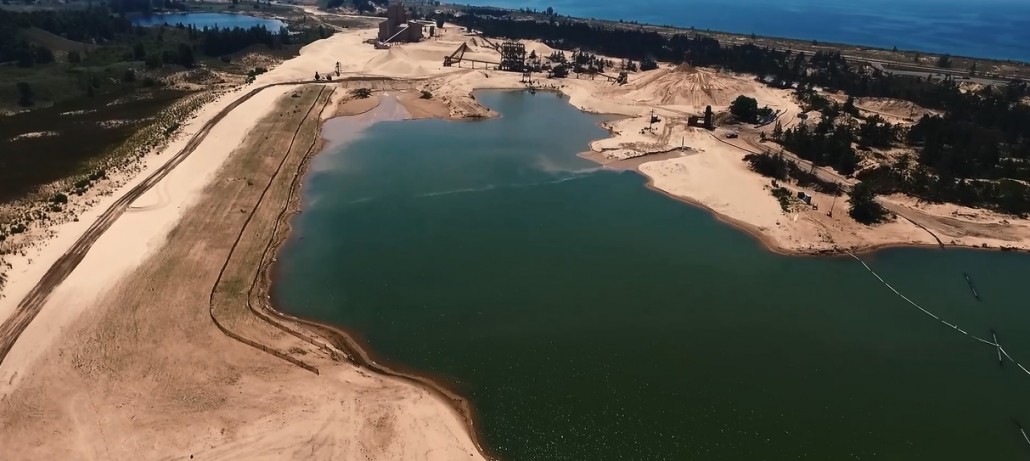
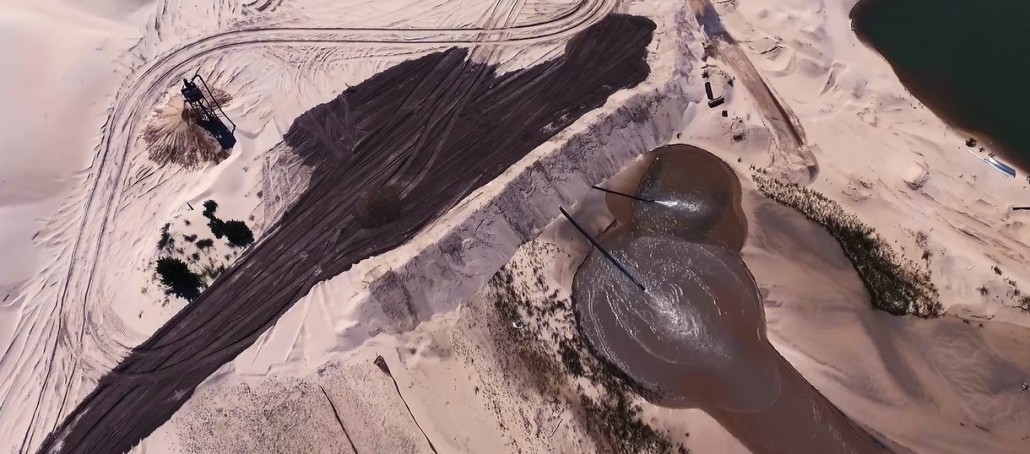
Ludington State Park and Sargent Sand’s Mine
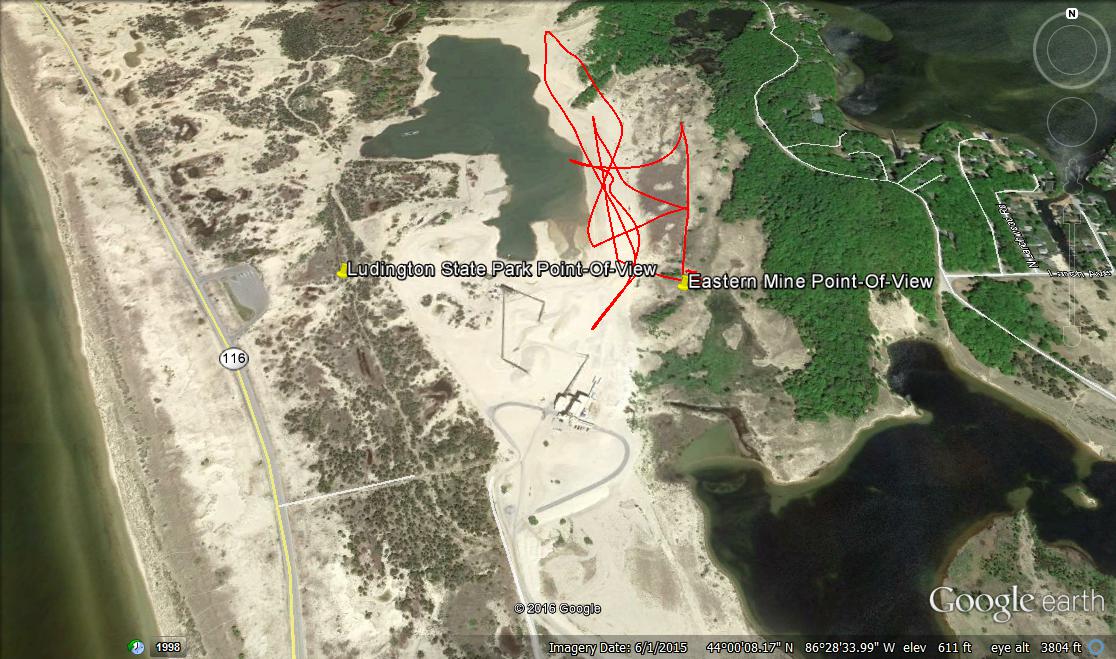
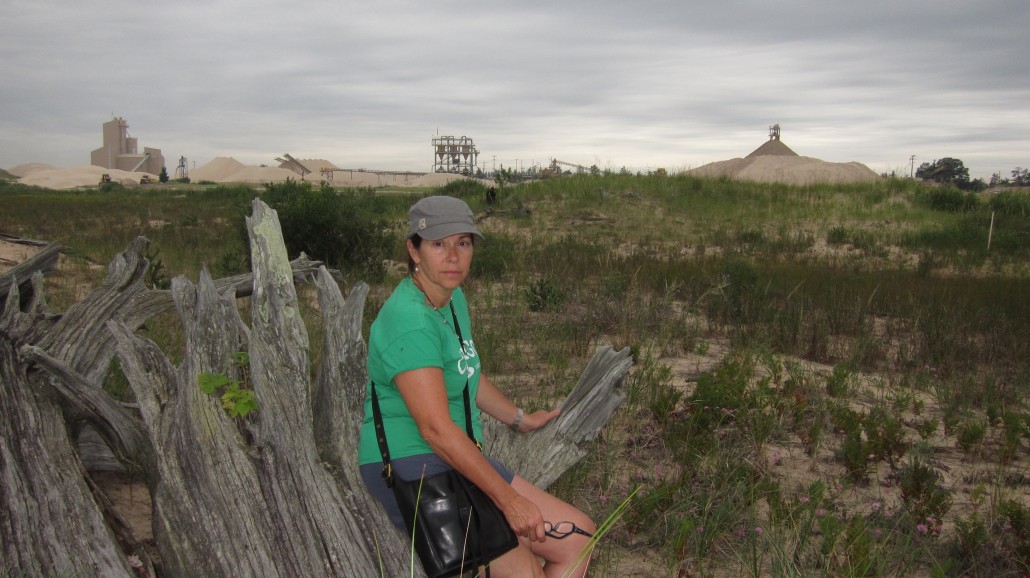
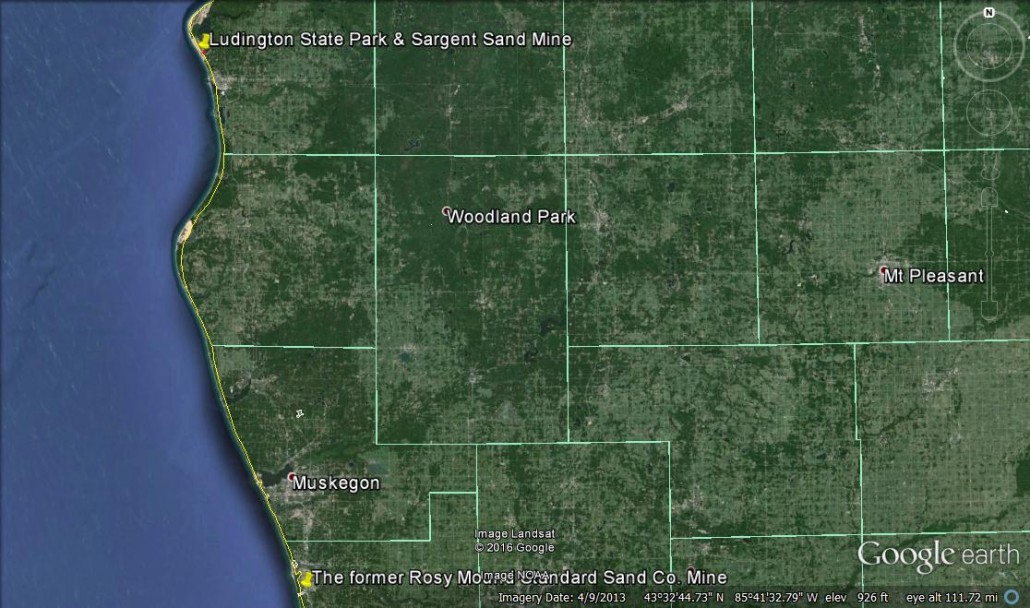
After several days in Grand Rapids, I traveled to Ludington State Park in Michigan (see Fig 4 below), along with documentarian/drone pilot Tom Gunnels and Kent County Water Conservation’s Stephanie Mabie. Our destination was the camp of Linda and Ron Daul, the residents spearheading an effort to make Sargent Sand more accountable and transparent in its mining operations. There camp is also located within and adjacent to one of the most sensitive ecosystems in North America.
This is a documentary produced by Tom Gunnels and his Hive•Mind team that incorporated interviews and drone footage from our Ludington/Sargent Sand mine tour August, 2015.
Ms. Daul was kind enough to organize a tour of the mine, Ludington State Park, and northern hardwood forest for us, as well as journalist Aaron Selbig, who produced a piece on the tour for Interlochen Public Radio. The scenery sans the sand mining infrastructure, noise, and related truck traffic was beautiful in this little corner of Michigan roughly half way between Grand Rapids and Traverse City.
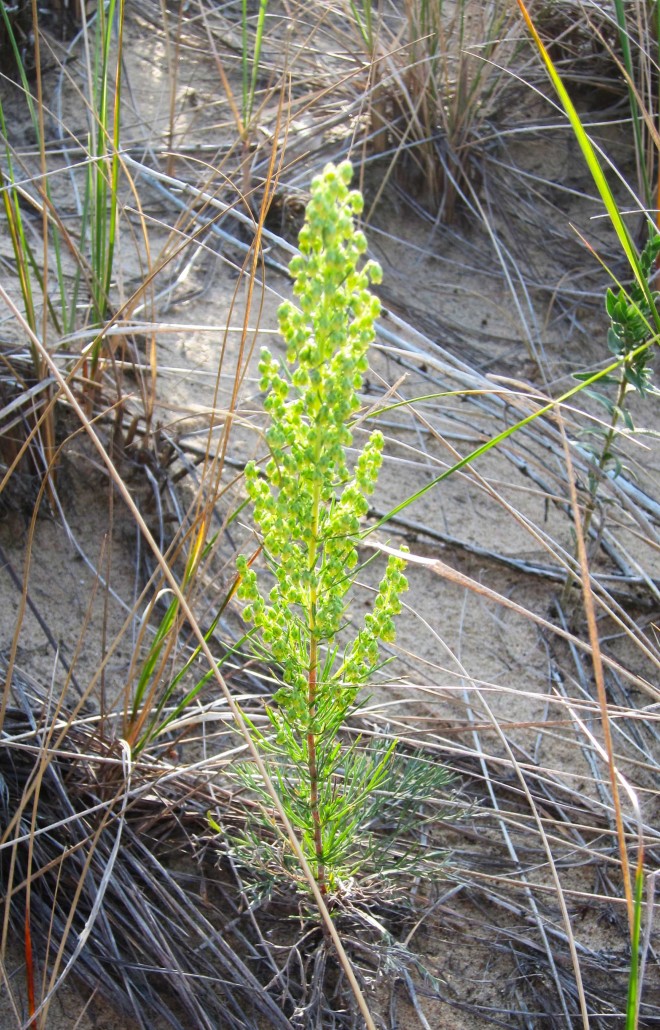
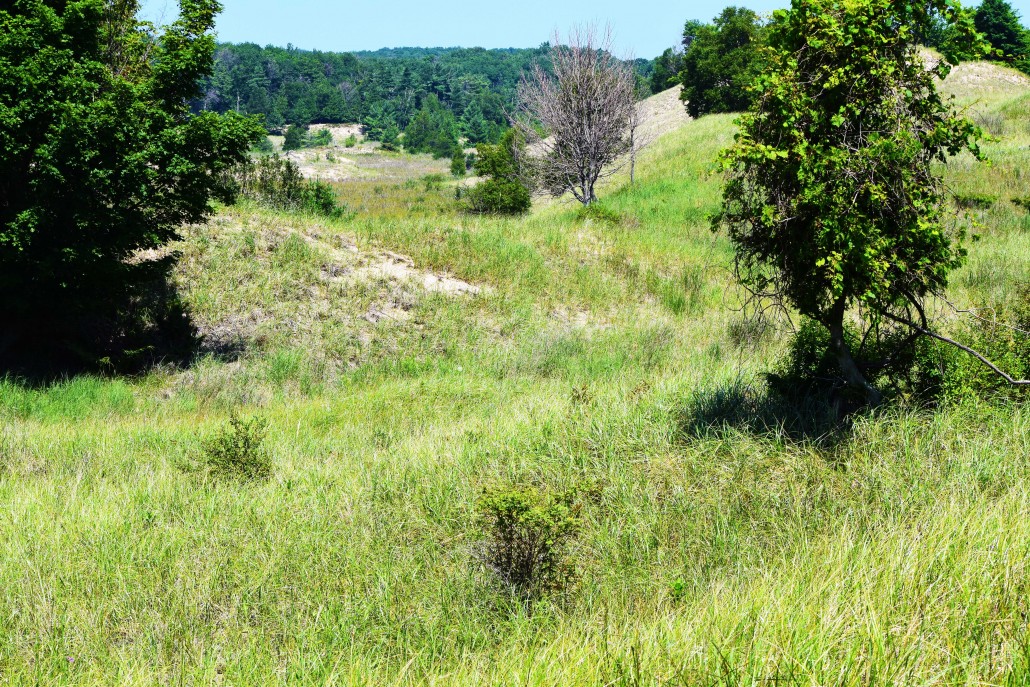
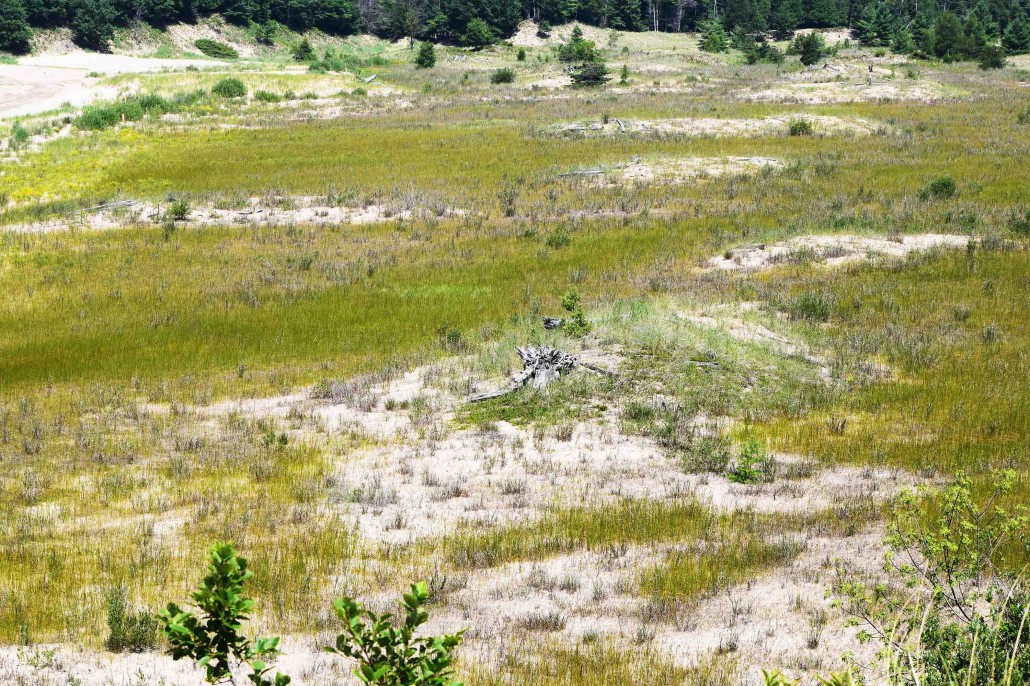
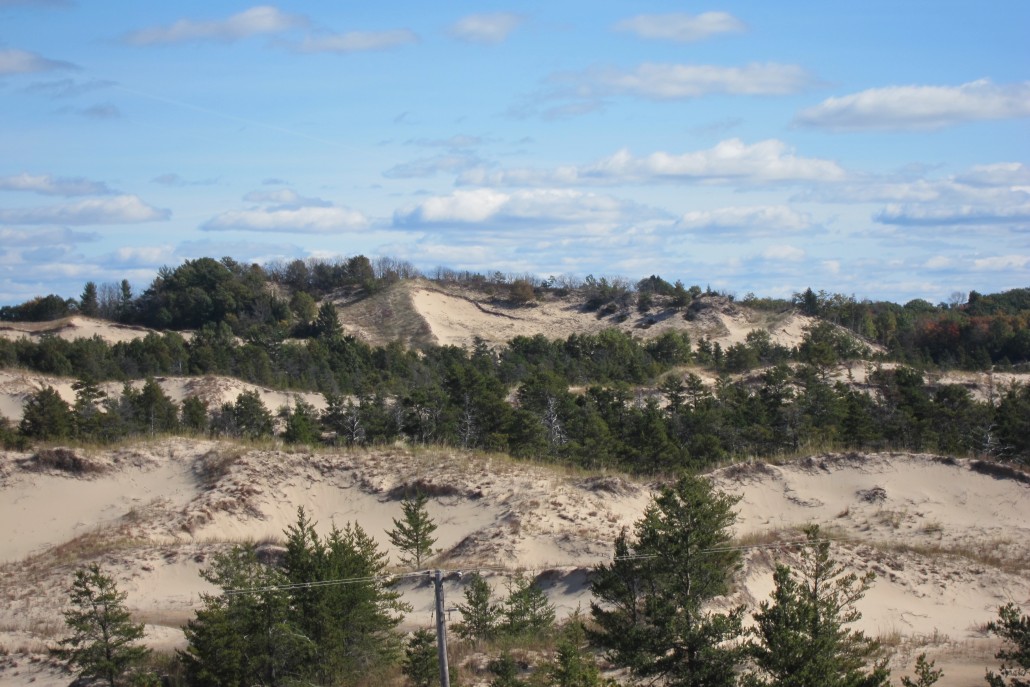
Michigan’s unique and threatened dune ecosystems – and associated Jack Pine (Pinus banksiana) “plains” or “barrens” ecosystem1 – comprise of 116 square miles of coastline along Lake Michigan. Unfortunately, they are simultaneously deprived of the fire regimes they require to regenerate, and are targets for the production of frac sands with Ludington State Park being the primary example. This makes the feasibility of reclaiming original plant communities dubious at best. (There have been mixed results associated with reclamation efforts, for example, at the former Rosy Mound Standard Sand Corporation’s mine 80 miles due south in Grand Haven, see Fig. 5.)
The largest obstacle to reclamation of sand mines along Lake Michigan is the inability of practitioners to document and replicate the many “microenvironments,” which as Peterson and Dersch pointed out:
…are the small environments created by differences in temperature, moisture, and light intensity within the sand dune ecosystem. Examination of these small environments is essential to a clear understanding of the ‘whole’ ecosystem. The diversity of organisms in sand dune areas is made possible by the variety of habitats found in relatively small areas. Any alteration of the dune which homogenizes the ecosystem will allow less diversity of plants and animals.
The Great Lakes dune complex requires perennial vegetation, wind, and sand for continued formation and stabilization with a complex – and specifically adapted – mosaic of lichens, fungi, mosses, grasses, wildflowers, shrubs, and trees arranged in a complicated and multi-layered manner across much of Western Michigan’s lakeshore. As Michigan’s DNR put it:
Without sand dune plants, the integrity and preservation of a stable dune complex cannot exist.
In combination with the Michigan Supreme Court’s constant fiddling of the intent and letter of mineral extraction law, namely the “very serious consequences” clause in House Bill 4746 (2011), you have the makings of a scenario that could eliminate upwards of 16 square miles of Michigan’s critical dunes in the coming years or 9-14% of the entire complex.2
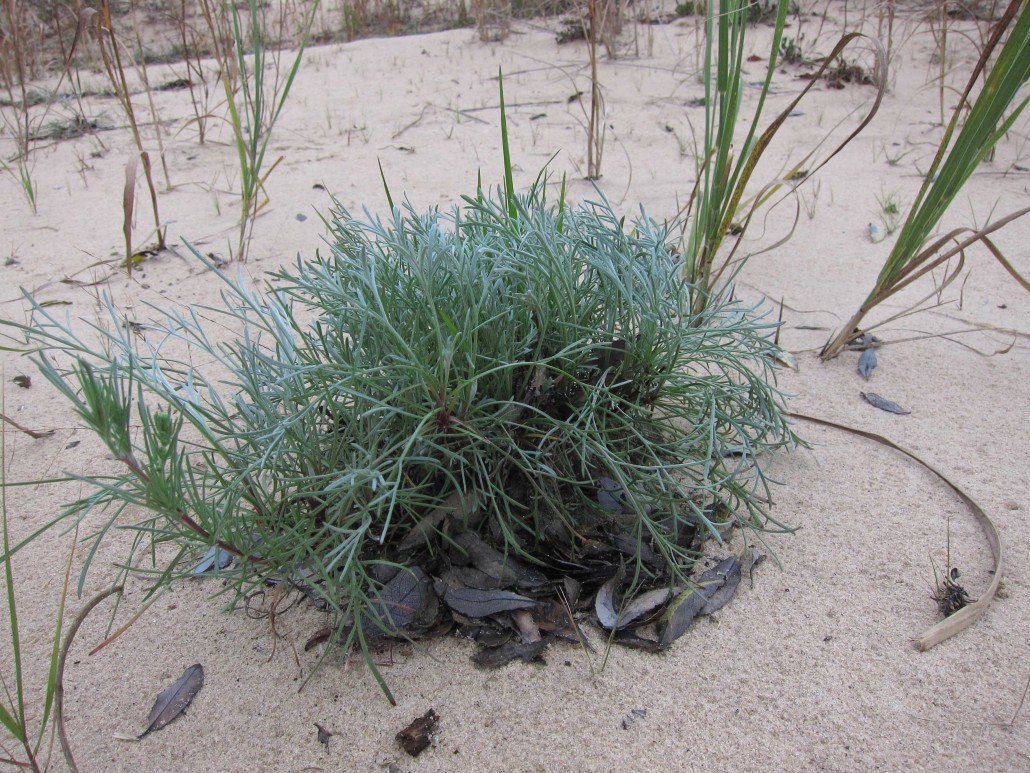
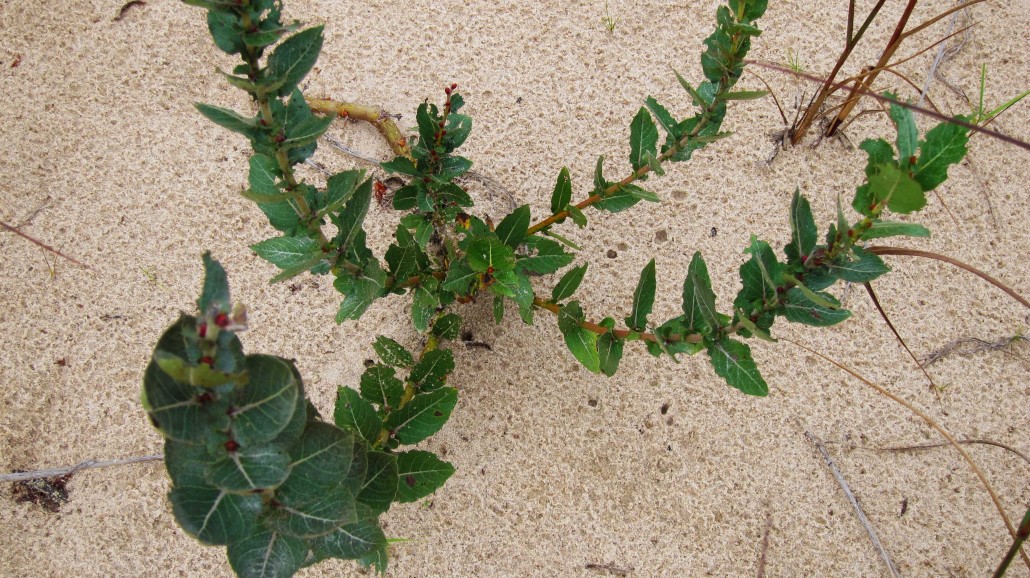
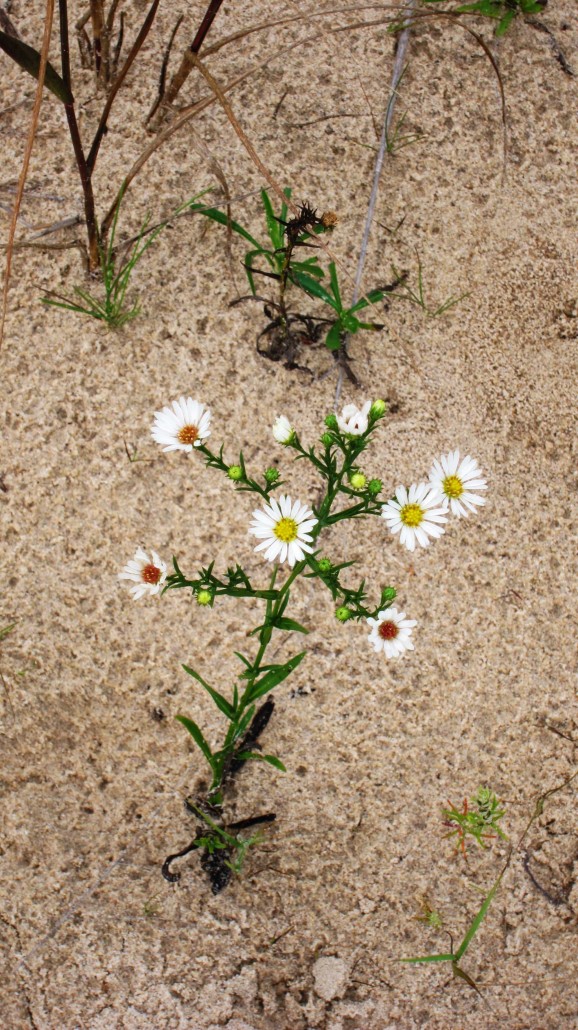
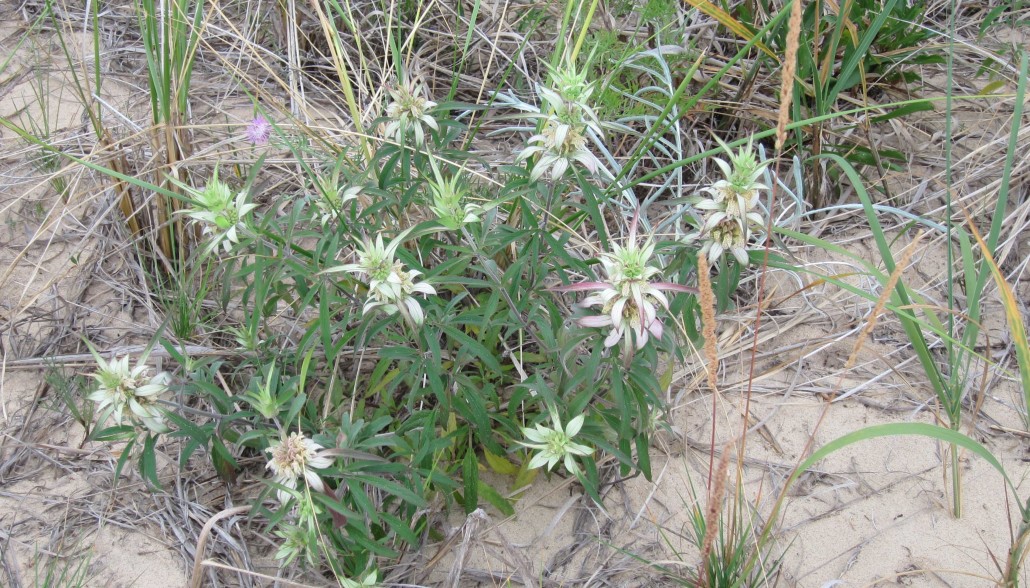
In addition to Pitcher’s Thistle, systems – like those found along the western edge of Michigan – are home to more than 15 endemic, or nearly so, plant species such as:
Wormwood (Artemisia campestris, aka the source of Absinthe),
The early colonizer sea-rocket (Cakile edentula),
Clustered Broom-Rape (Orobanche fasciculata),
Harebell (Cakile edentula, at the edge of Sargent Sand’s Ludington mine), and
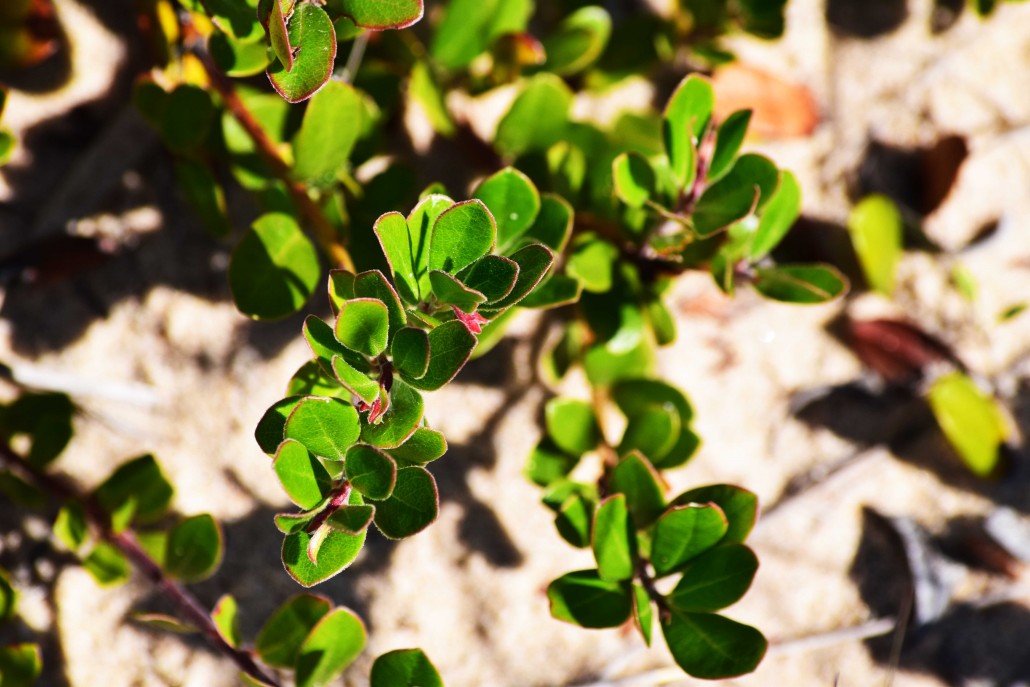
Hoary Puccoon (Lithospermum canescens), and the species most responsible for dune stabilization Marram Grass (Ammophila sp.).
Additionally, these dunes are critical to the life-cycles of more than 10 different species of birds, reptiles, and herbivores including the Eastern Hog-nosed Snake, Eastern Box Turtle, American Goldfinch, and everybody’s favorite, the White-Tailed Deer.
Table 1. Number of Threatened, Endangered, and Rare Plant Species within Western Michigan’s Dune Complex
Criteria
# of Species within Michigan’s Dune Complex
Michigan Threatened Species List
72
Michigan Endangered Species List
7
Michigan Rare Species List
3
Extinct
4
US Endangered Species List
1
US Threatened Species List
11
Modified from State of Michigan Department of Natural Resources, Geological Survey Division, 1979.
Finally, it is of importance to mention the final stage of dune succession are the beech-maple forests, which take an estimated 1,000 years to be achieved according to Jerry Olson (1958). With that said let’s take a look at some of the pictures and testimonial I gathered during my trip to The Great Lake(s) State…
The Photos
A. Sylvanian Minerals and US Silica, South Rockwood, Monroe County, MI from Doug Wood’s barn
Location where below photos were taken, showing the Sylvanian Minerals and US Silica Mine Complex, South Rockwood, Monroe County, MI
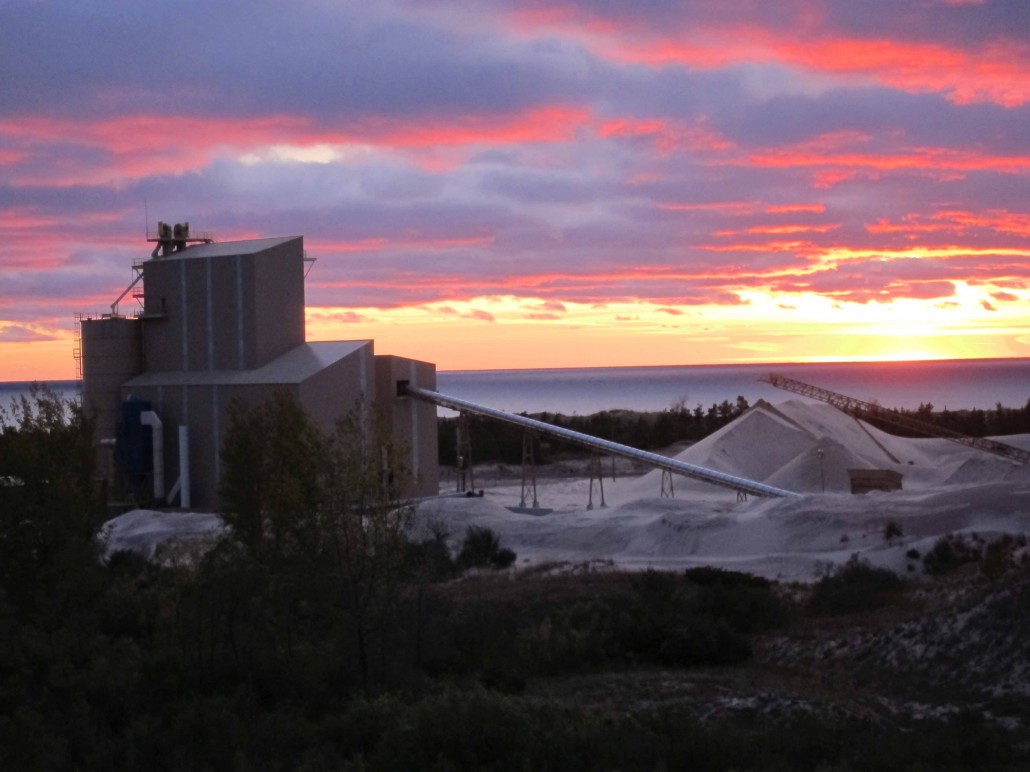
B. Ludington State Park and Sargent Sand’s Silica Sand Mine, Ludington, Mason County, MI
Ecosystems and Native Plants of Ludington State Park, Mason County, MI (16 images, 11 species)
Sargent Sand and Ludington State Park photography point-of-view and Tom Gunnel’s drone flight path
The cards are definitely stacked against you when there is a silica quarry right next door to your dream home/property. We toiled for years to green it up with trees and grass, a labor of love for our “place in the country”. I mean, what’s not to love about semi-truck traffic, air pollution, house tremors not to mention plummeting property values! Since South Rockwood village annexed the quarry in 2010, placing a quarry wall literally 300 feet from my home, we deal with noise of crushers, loaders, drilling for blasting, and blasting. All the while we are left to wonder what kind of garbage we are inhaling since there seems to be NO REGULATIONS, AIR MONITORING OR DUST CONTROL MEASURES AT ANY TIME!! And if that isn’t enough, the village wants to relocate the freeway ramps to our road for the quarry’s trucking convenience.
Al (Chip) Henning, Ludington, MI
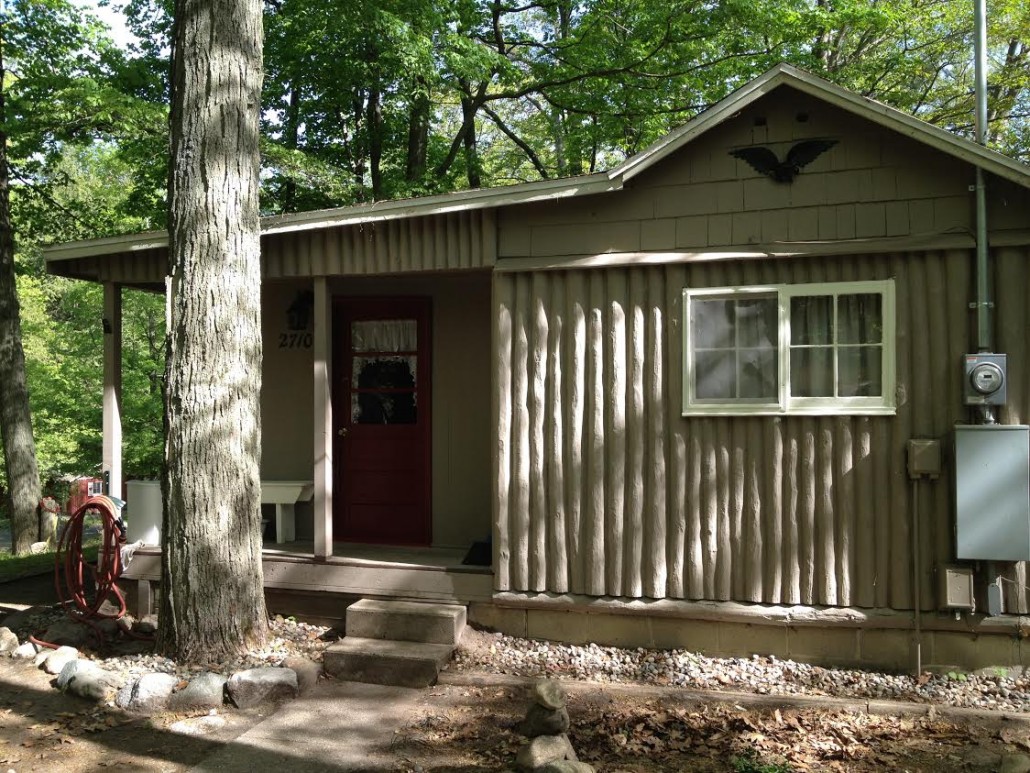
Sargent Sand Company has owned this site since the 1920s. The Big Sable Dune Complex is roughly twice the size of Sleeping Bear Dunes National Lakeshore, and includes the Nordhouse Federal Wilderness. If Sargent completes their mining as projected over the next 30-40 years, the Ludington Dunes (about 40% of the Complex) will be 60-70% destroyed/mined/removed, sent primarily to Pennsylvania for hydraulic fracturing in the Marcellus Shale formation. Sargent has removed 10-15% of the Ludington Dunes, to date, and faces permit renewal in January 2016. My family owns several properties which abut Ludington State Park, whose lands surround the Sargent property narrowly on three sides. Our property lies 1200 feet from the Sargent operations at closest approach; aside from the unsustainable removal of the sands, the noise from Sargent’s 24-7-365 operations is frequently intolerable.
Linda Bergles Daul, Ludington, MI
Fracking sand is mined from ancient geological sand deposits, extremely rare across the globe. In Michigan, the Sargent Sand – Ludington (State Park) Site, on the west coastline of Lake Michigan, enjoys a controversial, grandfathered permit to mine irreplaceable sand in critical dunes for horizontal fracking application. When the Sargent Sand mine is operating, the peaceful retreat of Hamlin Lake might as well be a downtown Chicago construction site, sharing heavy truck traffic, air pollution and mine numbing noise with our Pure Michigan visitors. The beauty and majesty of Ludington State Park has enriched my life. The critical dunes are one of Michigan and LSP’s most spectacular natural features – they also are one of our most fragile! The dunes are a phenomenon unique to the State of Michigan and yet we allow permitted critical sand dune mining right next to LSP. Sargent sand expansion towards LSP resulting in the removal of 200 year-old stabilizing trees, dredging to create artificial lakes, disregard for wildlife and the critical dune ecosystem, should be addressed within LSP master plans. I would like to see a world-class, university associated educational program established at Ludington State Park, addressing dune ecosystems. The LSP master plan should deliberately study the impact of Sargent Sand Mining operation and propose a broader vision that will consolidate the park in a way that preserves its beauty for future generations. [Furthermore] The State of Michigan Sec. 35302 The legislature finds that: (a) The critical dune areas of this state are a unique, irreplaceable, economic, scientific, geological, scenic, botanical, educational, agricultural, and ecological benefits to the people of this state and to people from other states and countries who visit this resource. EXCEPT if the activity is involved in sand dune mining as defined in part 637.
Sargent Sands sand mining has been viewed as mainly negative in the Ludington-Mason County community. This company was “dormant” until hydraulic fracturing became somewhat popular. Most citizens and visitors do not like to see the dunes removed in this area so close to the Ludington State Park. Destruction of critical dune area and possible endangered plants are the main concerns. Other impacts to this community include the immense noise created by the mining for families with homes by the mine and all the trucks going through town to the freight trains. Another issue is the wear on the roads. Also mentioned to me was the time spent waiting at the train crossings because of the sand being transported to other areas via trains. I really haven’t heard any positive comments. My guess would be that the mining creates jobs for the truckers, train workers, and of course the employees of the company. As far as in the future there are rumors that Sargent Sands will continue to mine and then make the area a destination place with condos around the lake they created. This is turn will bring more traffic to the dunes, not a sustainable idea!
I really do “get it” in understanding that jobs are critically important for our State. Mouths are fed, bills are paid, colleges are attended. But the damage to Ludington left in Sargent Sands’ wake when it is done here someday will be permanent scars from the removal of Sand Dunes so rare and so beautiful, that I’m certain that we will all regret what we allowed to happen while on “our watch”. I believe that Ludington’s precious Sand Dunes are not really “ours”…to destroy or allow to be taken. They are timeless natural resources that we have simply been granted stewardship over by our own forefathers and mothers. Allow our children and great grandchildren the privilege of seeing and enjoying what we ourselves have been lucky enough to have seen and touched. “As a native Michigander and 13 year resident of Ludington, I can confidently tell anybody willing to listen that Sargent Sands is (at this very moment) irreversibly destroying one of Michigan’s last remaining precious and timeless natural resources. We… OWE IT to generations that follow us, the right to marvel at and enjoy what is one of this Country’s uniquely beautiful natural treasures… Ludington’s sand dunes. I ignorantly believed, at first, when Sargent Sands began mining sand again here that it would be something akin to raking one’s yard of leaves. When I had an opportunity to hike their mining operation’s perimeter, I witnessed what looks like strip-mining devastation. It’s saddens me that I was complicit (when I myself purchased some sand for my backyard from Sargent’s) but I am more frightened that our own DEQ (who should have known better) would have ever approved such disfiguring and permanent alteration to something so rarely seen in nature. I myself have marveled…at something that I believe only a few places on Earth possess…sand dunes so unique, so beautiful and so rarely seen (and…FREE to hike and to look at !) along a freshwater lake that happens to be what is increasingly being recognized as our Country’s lifeblood. In the Winter here when it snows, I often wonder how many people in other countries can even imagine what snow blowing in sand dunes looks like…the beautiful swirling mixture of sandy snow wrapping around dune grasses that stretch as far as the eyes can see –but now being trucked away. I ask our State, especially in light of Flint’s man made devastation, PLEASE do not allow this to continue when Sargent Sands’ permit expires in December of 2016. This sand mining destruction cannot be undone.
Additional Readings
Buckler, W.R., 1978. Dune Type Inventory and Barrier Dune Classification Study of Michigan’s Lake Michigan Shore, in: Resources, M.D.o.N. (Ed.). Michigan Department of Natural Resources, Lansing, MI.
Cowles, H.C., 1899. The Ecological Relationship of the Vegetation on the Sand Dunes of Lake Michigan. Botanical Gazette 27, 95-117, 167-202, 281-308, 361-391.
Cressey, G.B., 1928. The Indian sand Dunes and Shore Lines of the Lake Michigan Basin, The Geographic Society of Chicago Bulletin. The University of Chicago Press, Chicago, IL.
Daniel, G., 1977. Dune Country A Guide For Hikers and Naturalists. The Shallow Press Inc., Chicago, IL.
Dorr, J.A., Eschman, D.F., 1970. The Geology of Michigan. University of Michigan Press, Ann Arbor, MI.
Kelley, R.W., 1962. Sand Dunes, A Geologic Sketch, in: Conservation, M.D.o. (Ed.). Michigan Department of Natural Resources, Lansing, MI.
Koske, R.E., Sutton, J.C., Sheppard, B.R., Ecology of Endogone in Lake Huron Sand Dunes. Canadian Journal of Botany 53, 87-93.
Olson, J.S., 1958. Rates of succession and soil changes on Southern Lake Michigan sand dunes. Botanical Gazette 119, 125-170.
Peterson, J.M., Dersch, E., 1981. A Guide To Sand Dune and Coastal Ecosystem Functional Relationships, in: Service, M.C.E. (Ed.). Michigan Cooperative Extension Service, Lansing, MI.
Ranwell, D.S., 1972. Ecology of Salt Marshes and Sand Dunes. Chapman and Hall, London, UK.
Reinking, R.L., Gephart, D.G., 1978. Pattern of Revegetation of a Shoreline Dune Area, Allegan County, Michigan. The Michigan Academician 11.
Thompson, P.W., 1967. Vegetation and Common Plants of Sleeping Bear. Cranbrook Institute of Science, Bloomfield Hills, MI.
Footnotes for 7 Sand Mining Communities, 3 States, 5 Months – Part 2
Michigan’s DNR describes this ecosystem as having “always contained few large trees and little or no old growth. A forest where soils are dry and the vegetation sparse, it is called a barrens. A forest periodically swept by raging fires, only to spring back, fresh and revitalized. A forest which is amazingly productive and biologically diverse, providing homes for numerous plants and animals, many of them [endemic]. Today [we are]…seeking to extract its resources, enjoy its beauty, explore its secrets, and preserve its life. The jack pine forests can exist, only if we care.”
As Michigan State researchers pointed out the Michigan coastal dune ecosystem exists in small fragments along the Atlantic Coastal Plain but nowhere else in the world
The following guide is a simplified description of a variety of markings that are used by land surveyors. Throughout an active shale gas field, the first signs of pending expansions are the simple markings of stakes, flags, and pins. Many months or even years before the chain saw fells the first tree or the first dozer blade cuts the dirt at a well pad location, the surveyors have “marked the target” on behalf of their corporate tactical command staff.
The three most commonly used markings are the simple stakes, flags and pins. These surveyor symbols are common to any construction project and guarantee that everything gets put in the right place. In an active gas field, these marking tools are used for all aspects of exploration and production:
access roads to well pads,
widening the traveled portion of the roadway,
well locations,
ponds and impoundment locations,
temporary water pipeline paths,
surface disturbance limits,
compressor stations,
gas processing sites, and
rights-of-way for roads and pipelines.
Quite frequently these simple markings are undecipherable by themselves, especially by non-professionals. One cannot just know what is happening, what is likely to occur, or how concerned one should be. Context and additional information are usually needed. Sometimes the simple colors and combinations of colored tapes might only make sense in conjunction with similar markings nearby. Sometimes public notices in the newspaper and regulatory permits must be used to decipher what is planned.
For an example, the proposed 30″ diameter EQT pipeline called the Ohio Valley Connector seems to be regularly marked using a combination of blue and white (see figure 10 below) surveyors tape to mark the actual pipeline location, then green and white (see figure 4 below) to mark all the proposed access roads along the routes that will be used to get pipe trucks and excavation equipment into the right of way. These access roads might be public roadways or cut across private leased property.
Common surveyor symbols & signs (click on images to zoom in)
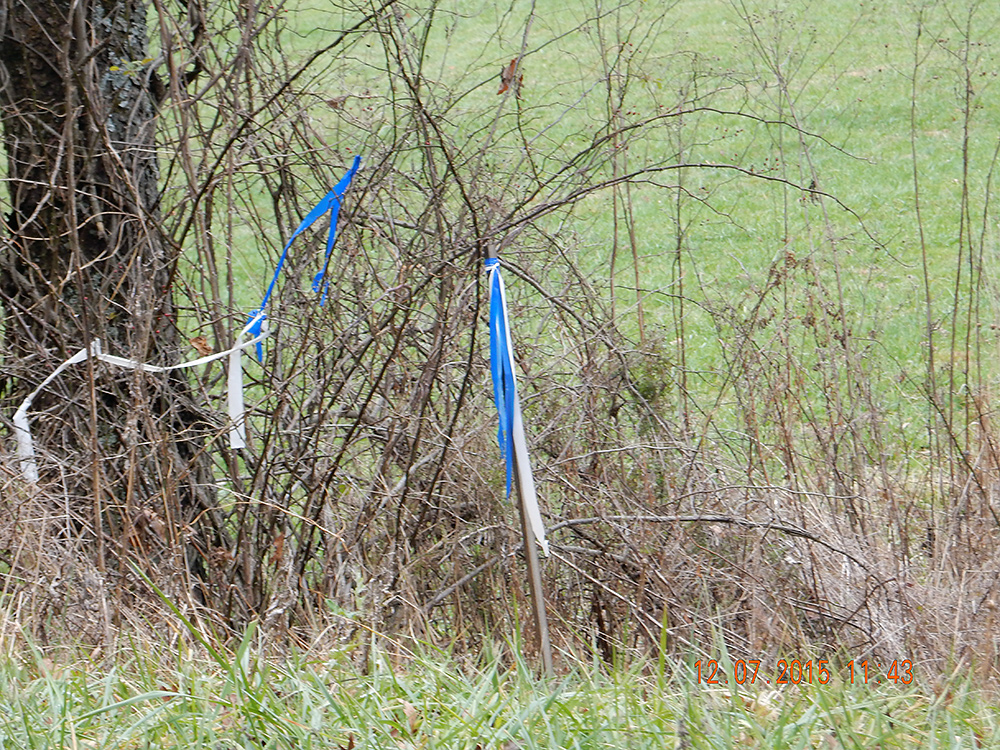
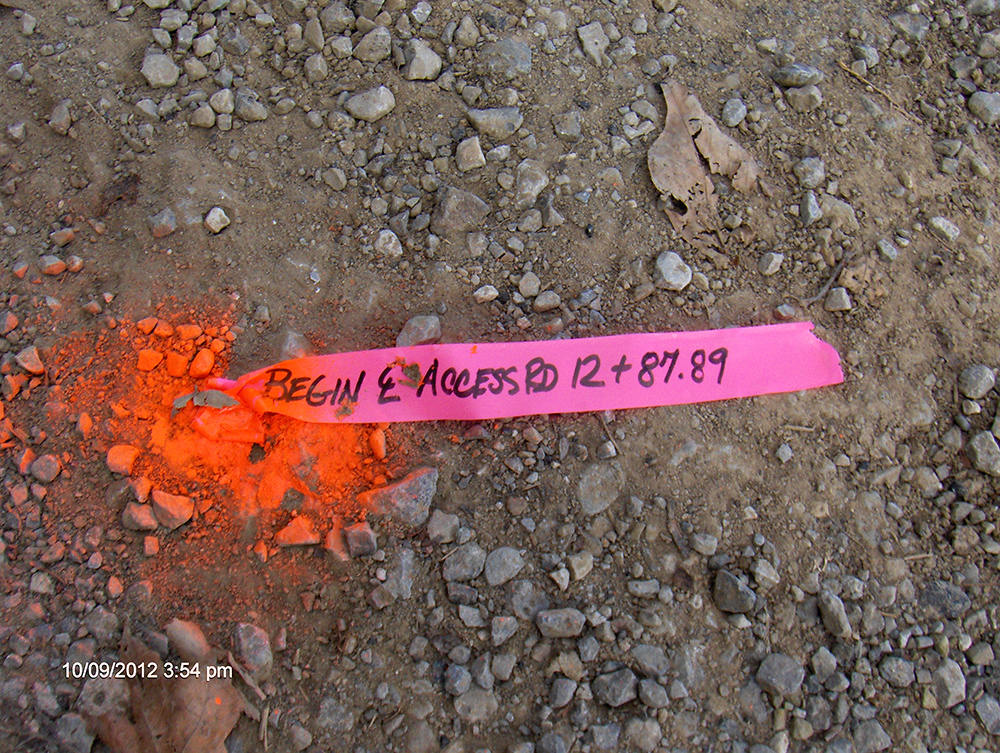
Surveyor flags and tape: Sometime the flags or streamers are just attached to trees, fence posts, or put on a stake to make them visible above the weeds. There might be no markings on the stake, or only simple generic markings. This could just mean that this is the correct road and turn here. It could also signal a proposed or approximate location for some future work.
Simple surveyor’s flags or tape
Surveyor flags and tapes: These are a selection of typical surveyor tapes, also called flags or ribbons. Many other specialty color combinations are available to the professional surveyor.
A selection of surveyor tapes
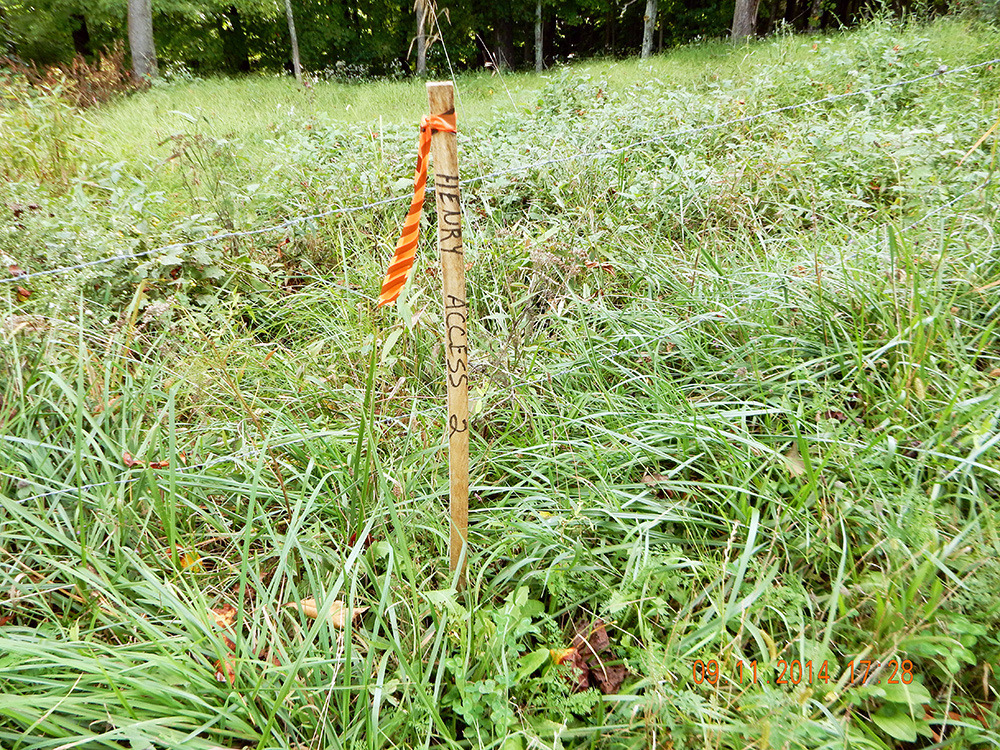
Stakes with simple markings: Flags with some type of identification (it might be names or numbers). This one was used for a proposed well pad access road location. There are no dimensions given on these.
Stake with simple markings
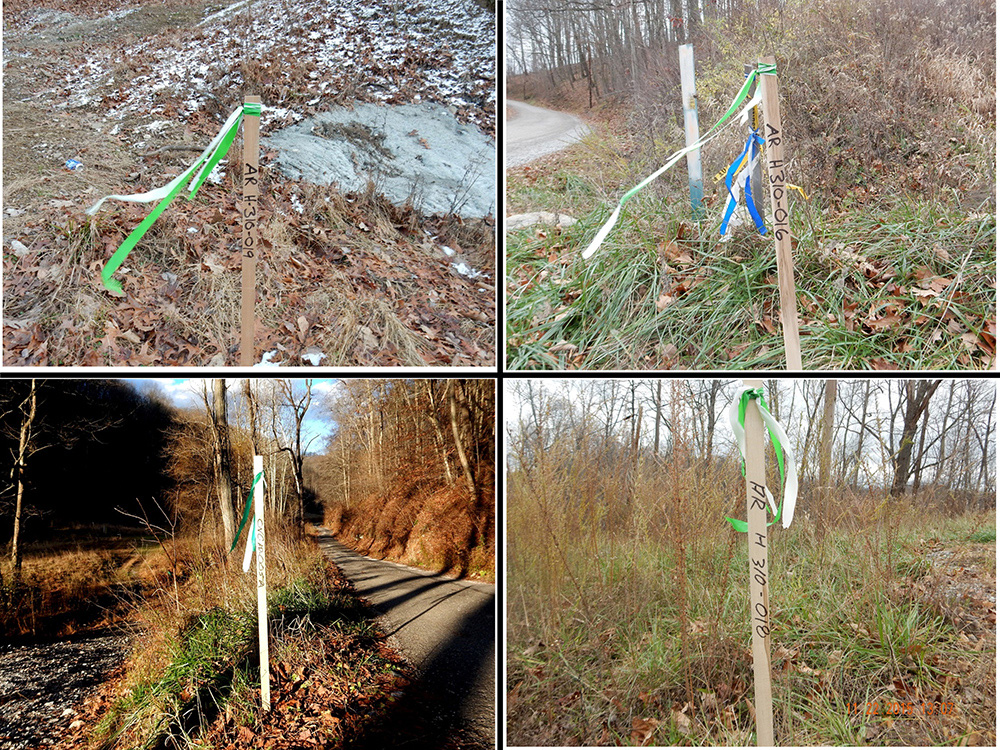
Stakes with simple flags and basic identification: The stakes shown here all indicate an access route to be used for equipment and trucks to get to a proposed pipeline right of way. The “H310″ is the EQT name for the 30” OVC pipeline.
Stakes indicating an access route
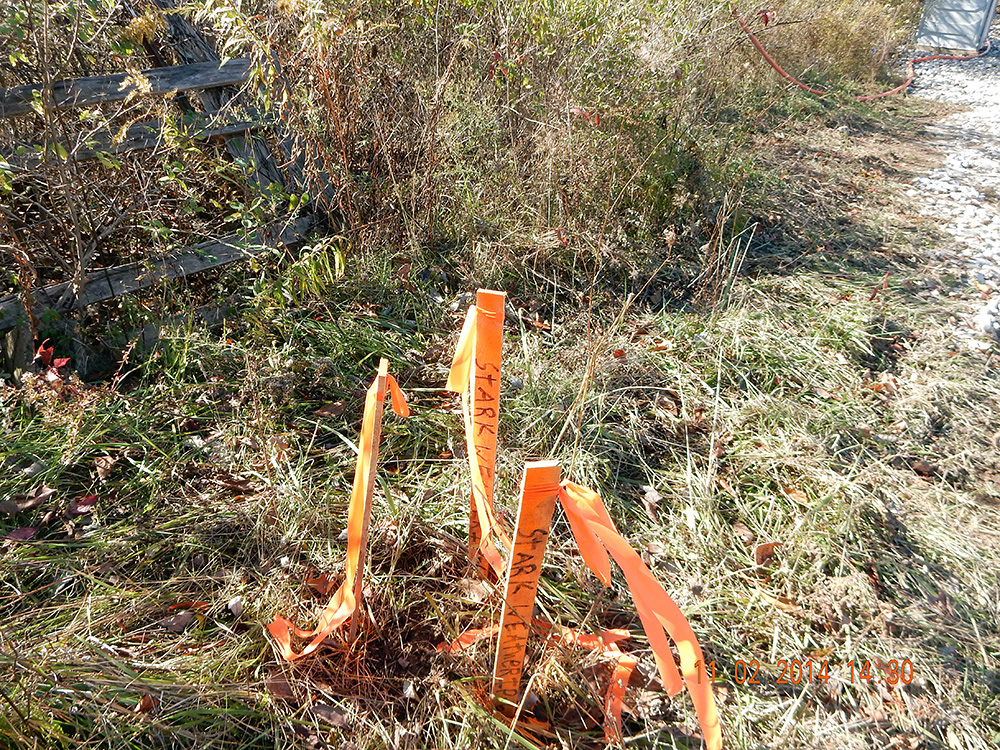
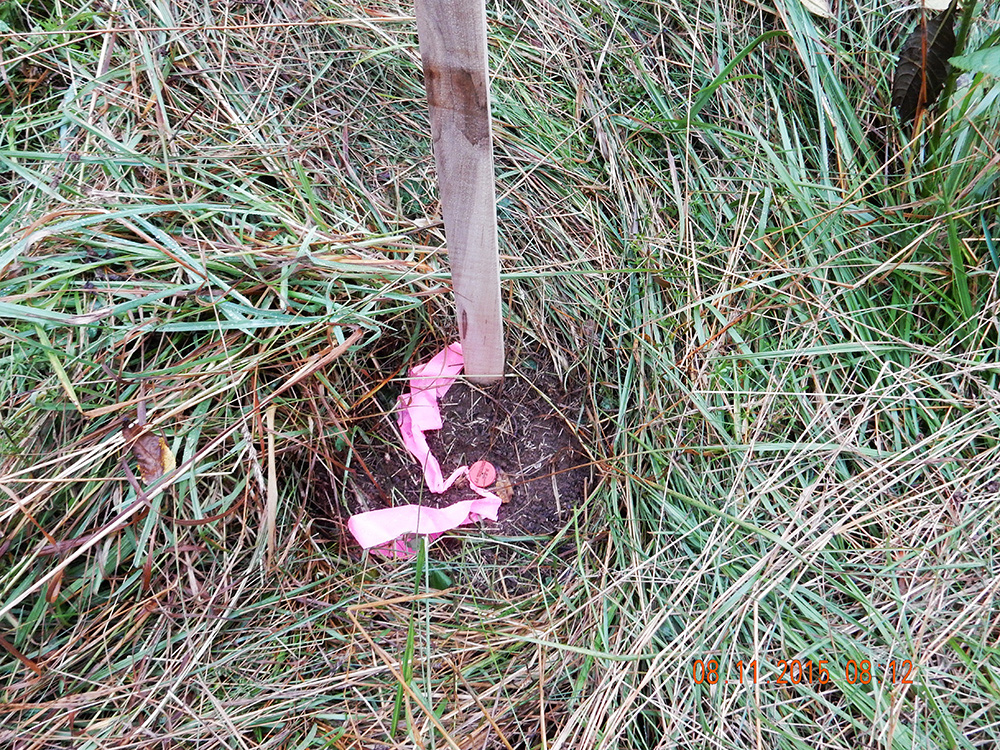
Control points: These three stakes are identifying a control point that is outside the limits of disturbance (LoD). These markings surround a pin to be used for reference.
Control point stakes
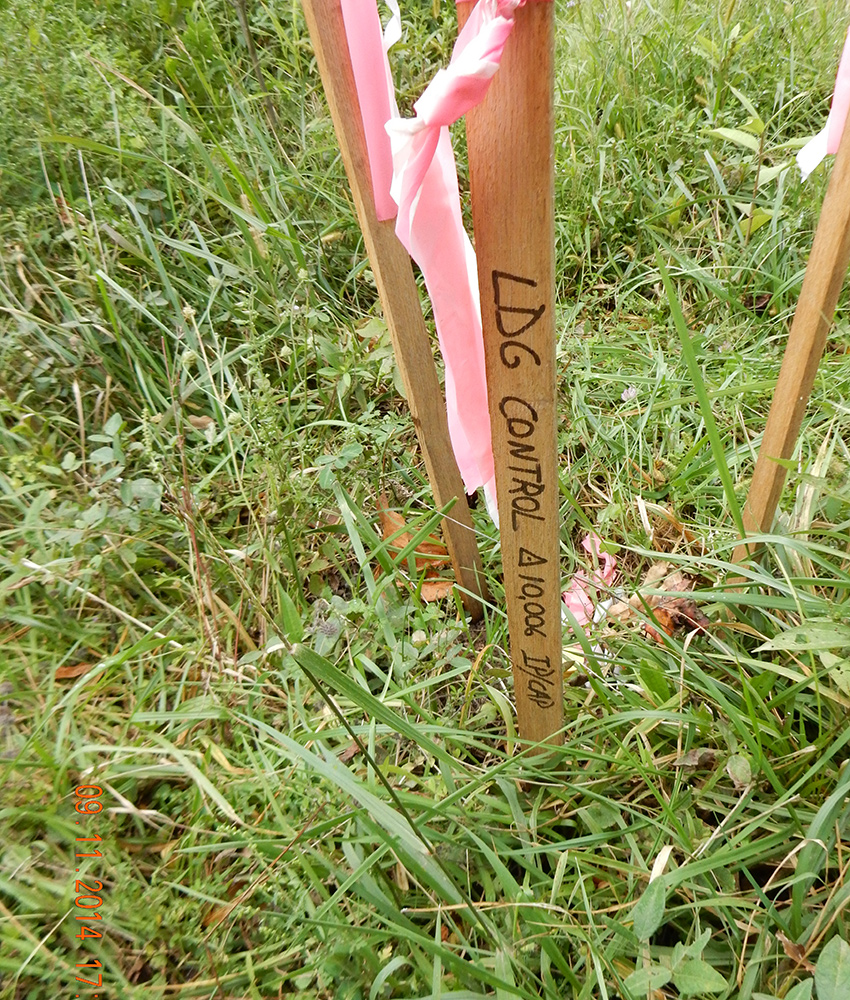
Controls points: This stake is also identifying a control point location. All control points will have some type of driven metal rod, usually with a plastic cap identifying the surveyor. Frequently there are three stakes with extra flags or tape. They are always set off to the side of the intended work area. They are not to be disturbed.
Control point stake and pin
Control points: Another set of three stakes marking a Control Point location. It is common to see triple stakes with elaborate, multiple flags. Even if only two stakes are present, there always will be a driven steel pin and identifying cap.
Control point stakes and pin
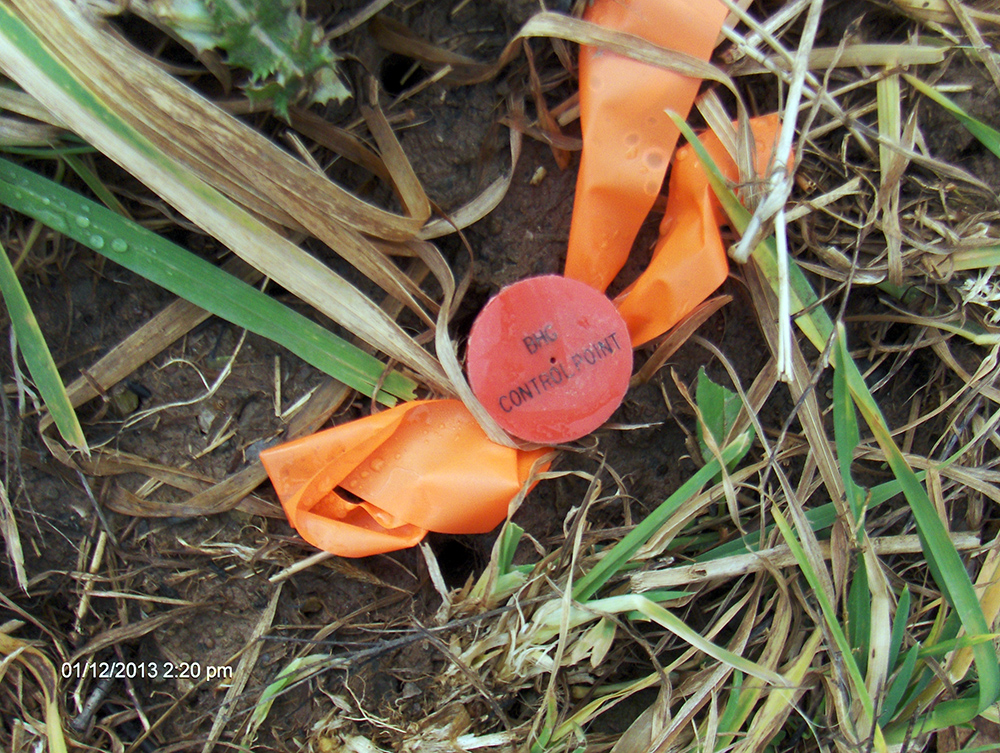
Control points: This shows a close-up of the identifying cap on a metal driven steel pin. Control point locations are not meant to be disturbed as they are for future and repeated reference. They might give the latitude and longitude on the stake plus the altitude above sea level.
Control point pin and cap
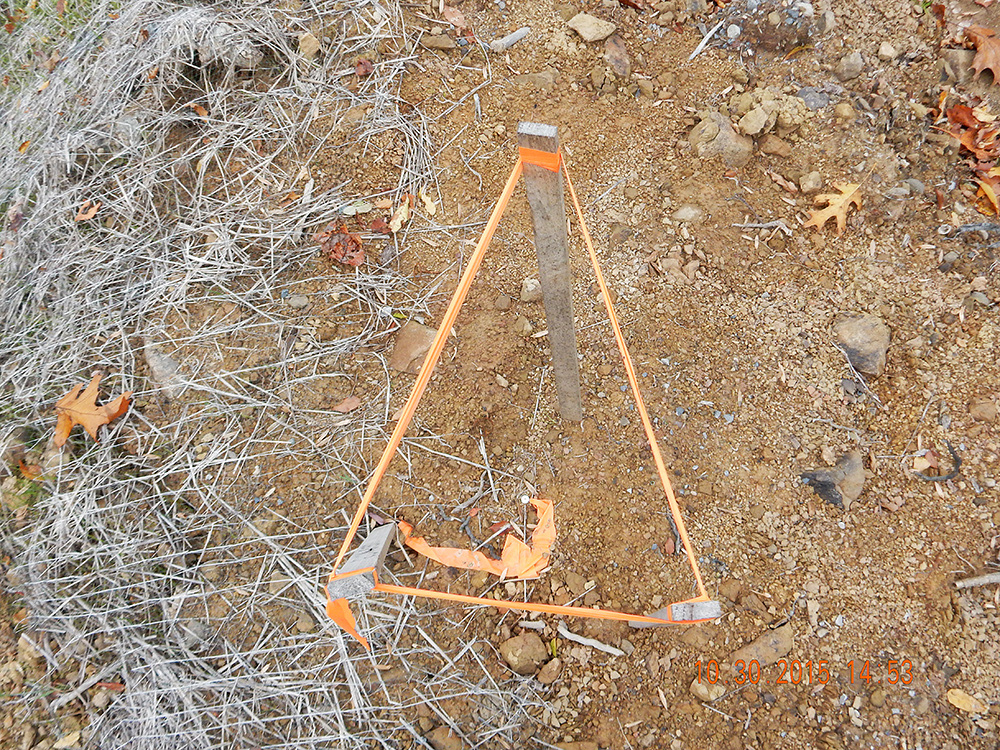
Control points: This is another, older control point location. This represents a typical arrangement where the stakes somewhat try to protect the metal pin from a bulldozer blade by warning its operator.
Control point pin protection
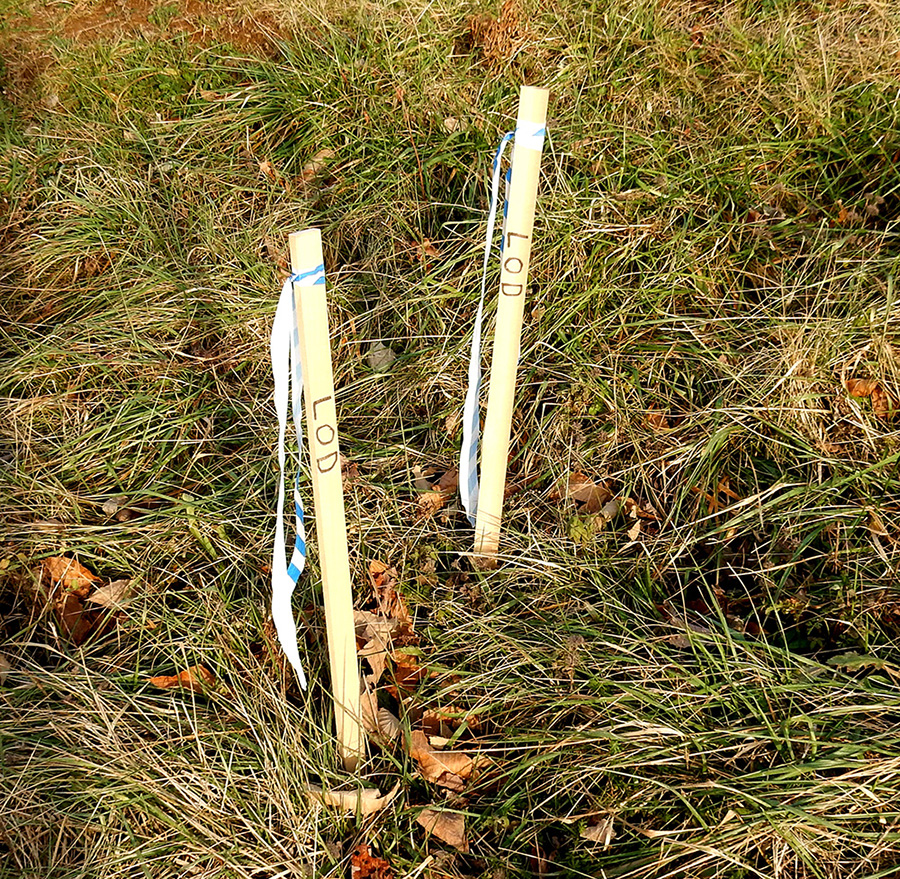
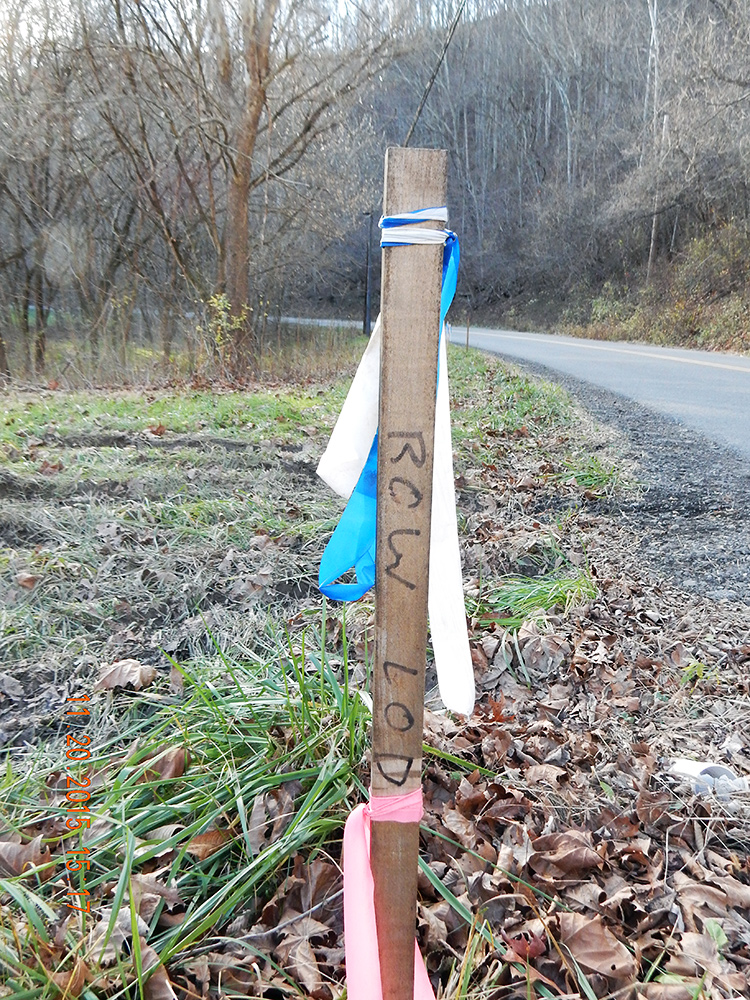
Limit of disturbance: The “L O D” here means the limits of disturbance. Beyond this point there should not be any trees cut or dirt moved. The stakes shown here indicates that this is the outside limit of where the contractor will be disturbing the original contour of the surface soil.
Limit of disturbance stakes
Limit of disturbance: The “L O D” means the limits of disturbance of the proposed pipeline right of way. Beyond this point there should not be any trees cut or dirt moved. This could also be used for the outside edge of well pads or access roads or pond locations.
Limit of disturbance ROW stakes
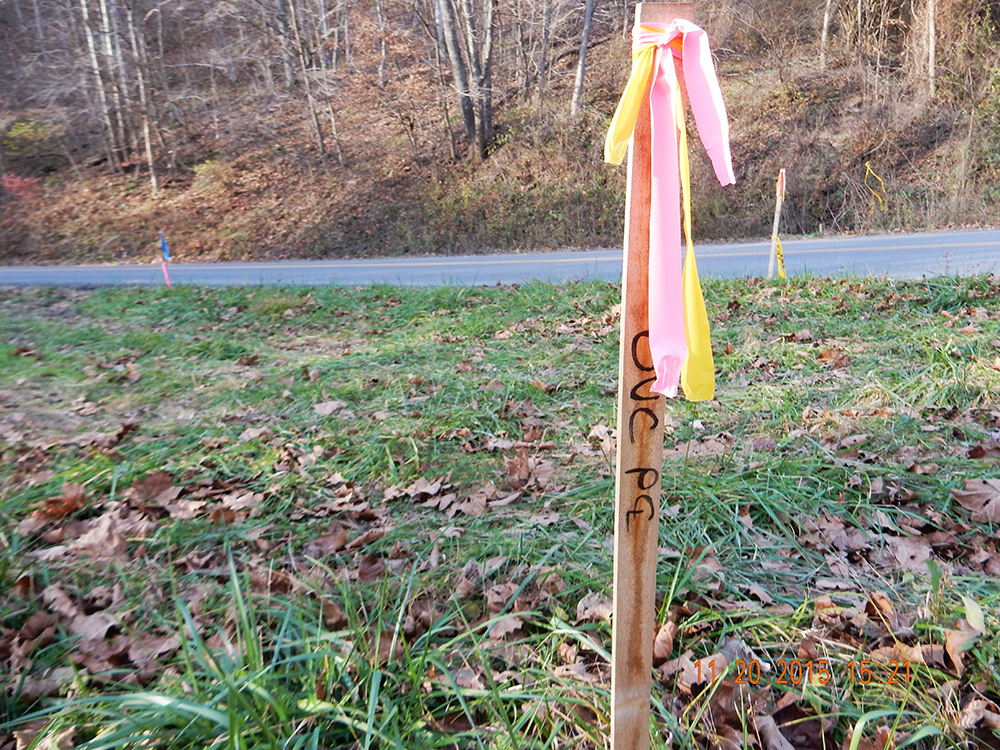
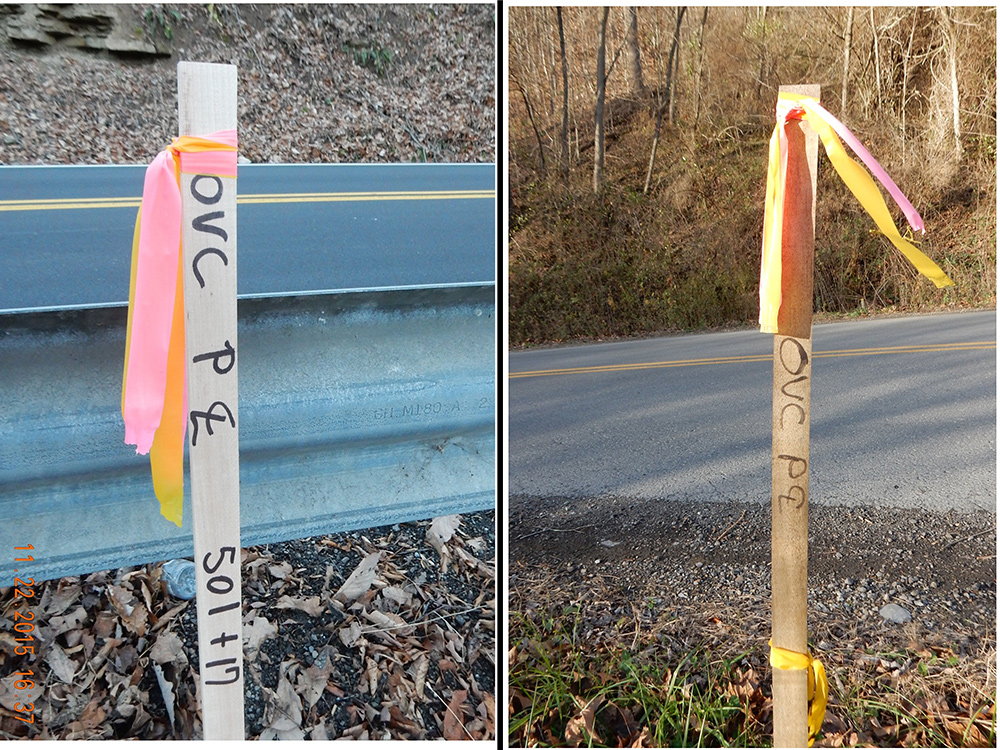
Pipelines: Stakes with flags and “center line” markings are usually for pipelines. Here you see the symbol for center line: a capital letter “C” imposed on the letter “L”.
Pipelines center line
Pipelines: Again you see the capital letter “C” super imposed on top of the letter “L” used frequently for pipe line center lines, but can also be used for proposed access roads.
Pipelines center line
Pipelines: As shown here, “C” and “L” center line flags can also be used for future well pad access roads.
Road access center line
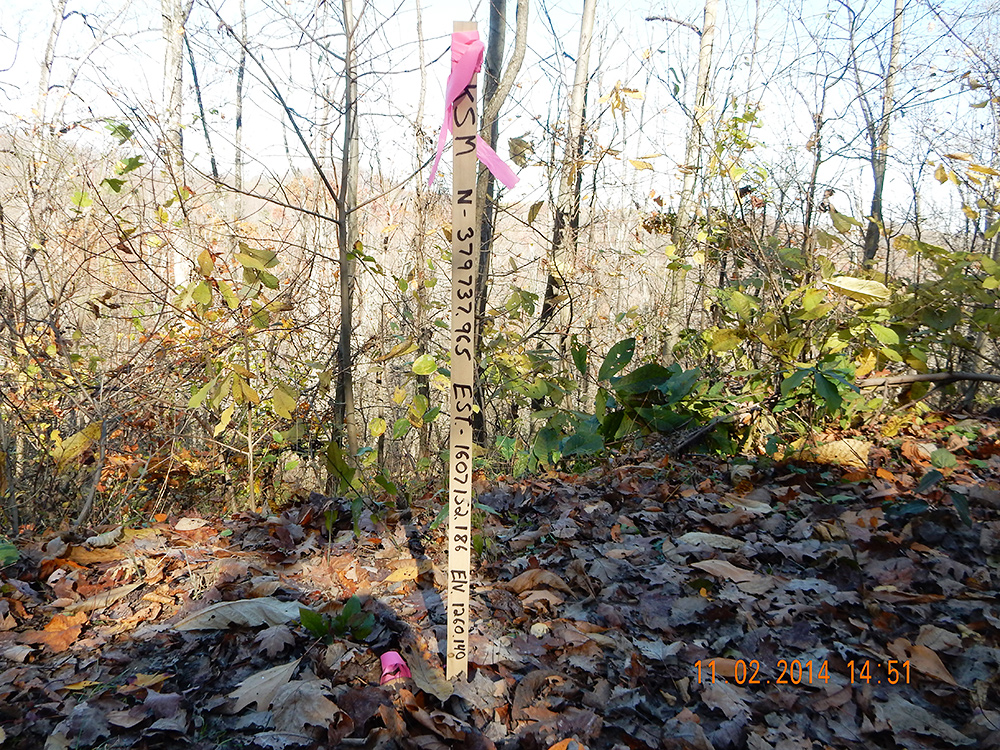
Precise location markings: Stakes like this will usually have a steel pin also associated with it. This stake gives the latitude, longitude, and elevation of the site.
Precise location stake
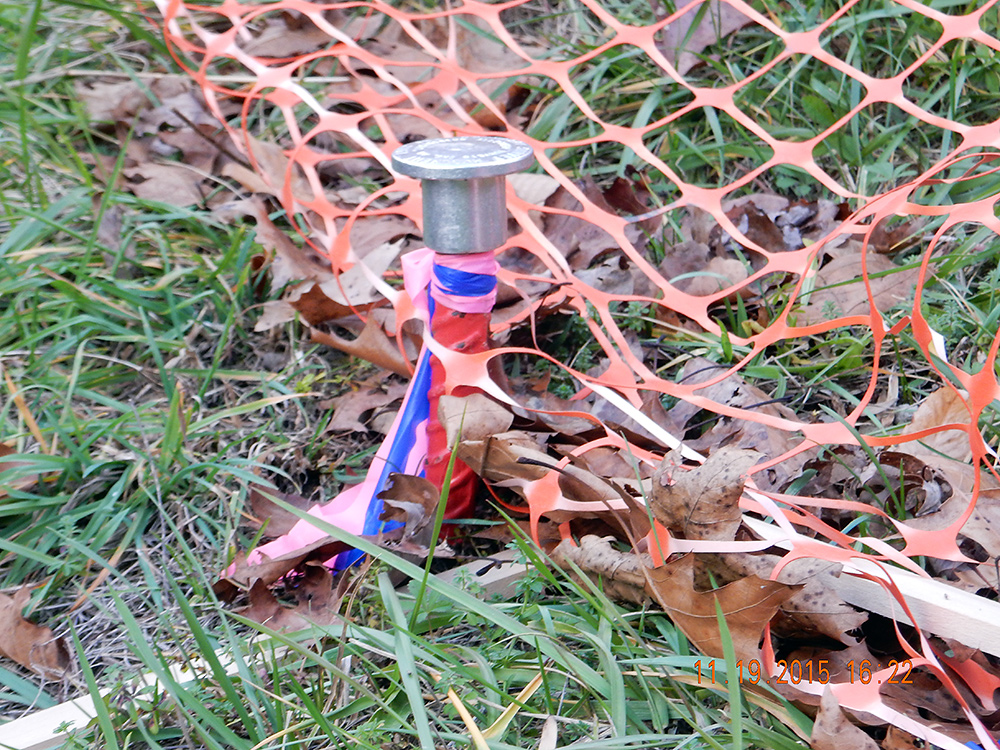
Permanent property lines: You may also find markings, like this one inch steel rod with an alum cap, that denote permanent property lines and corners of property.
Permanent property rod
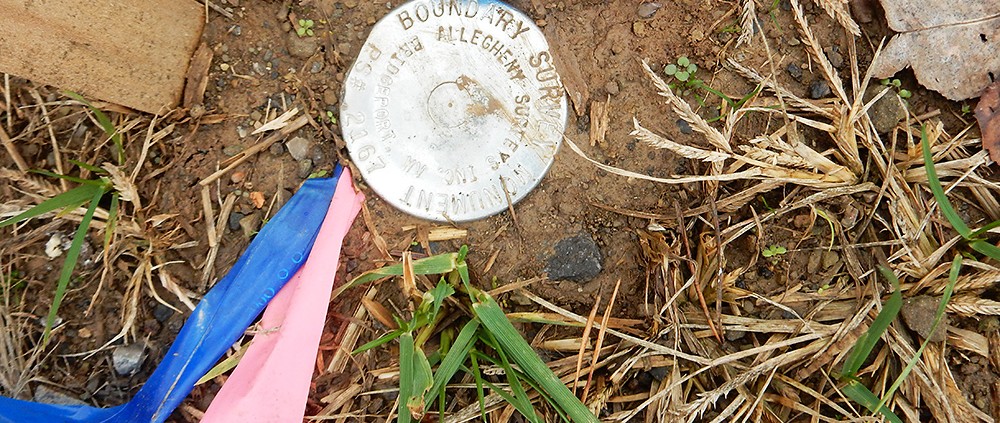
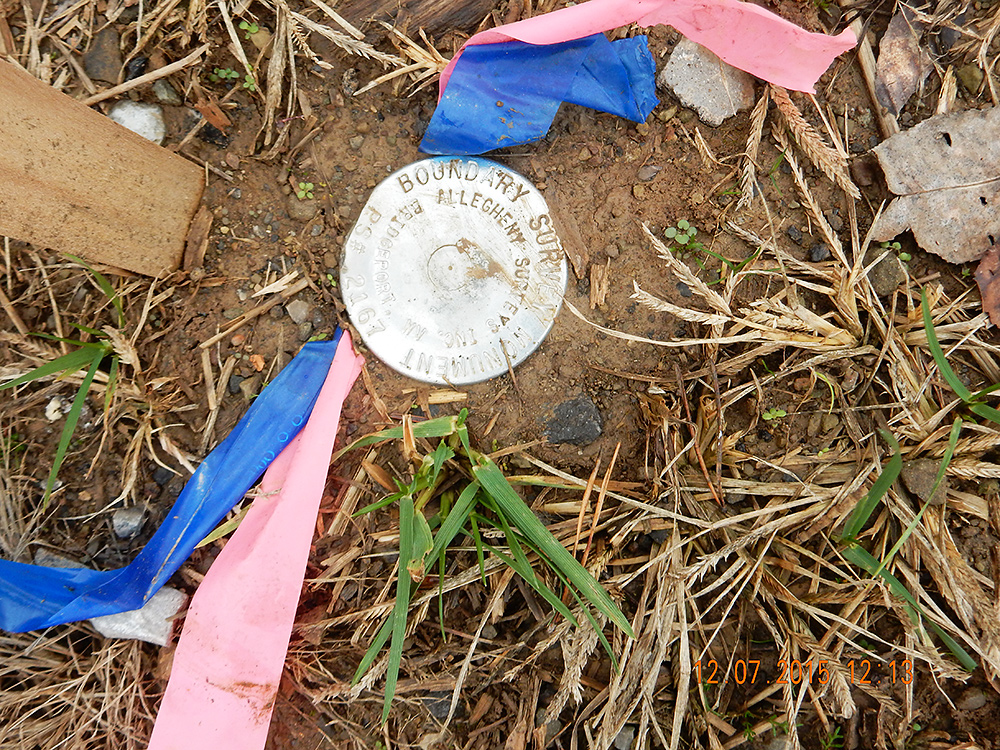
Permanent property lines: Another kind of permanent property line or corner marker is the “boundary survey monument.” This is likely an aluminum cap on top of a one inch diameter steel bar.
An Exploration of Sand Mining Impacts: Lasalle County, IL by way of Chicago’s South Side By Ted Auch, Great Lakes Program Coordinator
When it comes to high-volume hydraulic fracturing (HVHF), frac sand mining may be the most neglected aspect of the industry’s footprint. (HVHF demand on a per-well basis is increasing by 8% per year.)
To capture how this industry is changing several sand mining communities, I recently took a road trip to visit, photograph, and listen to the residents of this country’s primary frac sand areas. In total, I visited 7 sand mining communities in Illinois, Indiana, and Michigan.
This multimedia perspective is part of our ongoing effort to map and quantify the effects of silica sand mining on people, agriculture, wildlife, ecosystem services, and watersheds more broadly. Below is my attempt to give the FracTracker community a sense of what residents are hearing, seeing, and saying about the silica sand mining industry writ large.
Chicago’s South Side
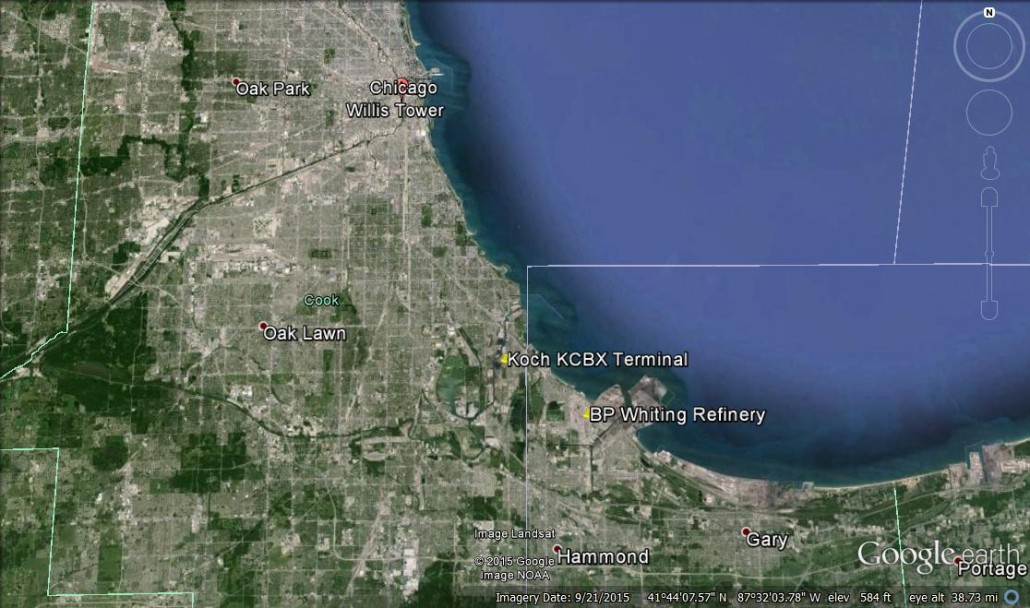
Before heading to Illinois’ frac sand epicenter of Lasalle County, I couldn’t help but catch the South Shore Line out of Millennium Station. This station can be seen as you head south to the Hegewisch neighborhood on Chicago’s impoverished South Side, an area of greater Chicago-Gary, Indiana that has largely been forgotten by politicians in both states.
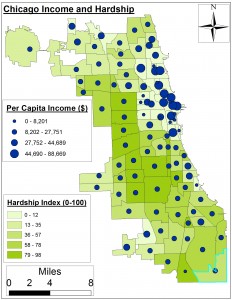
Figure 1. Average income per capita and Hardship Index (0-100 with 100 being the worst) for Chicago’s neighborhoods with Hegewisch highlighted in the city’s southeast corner.
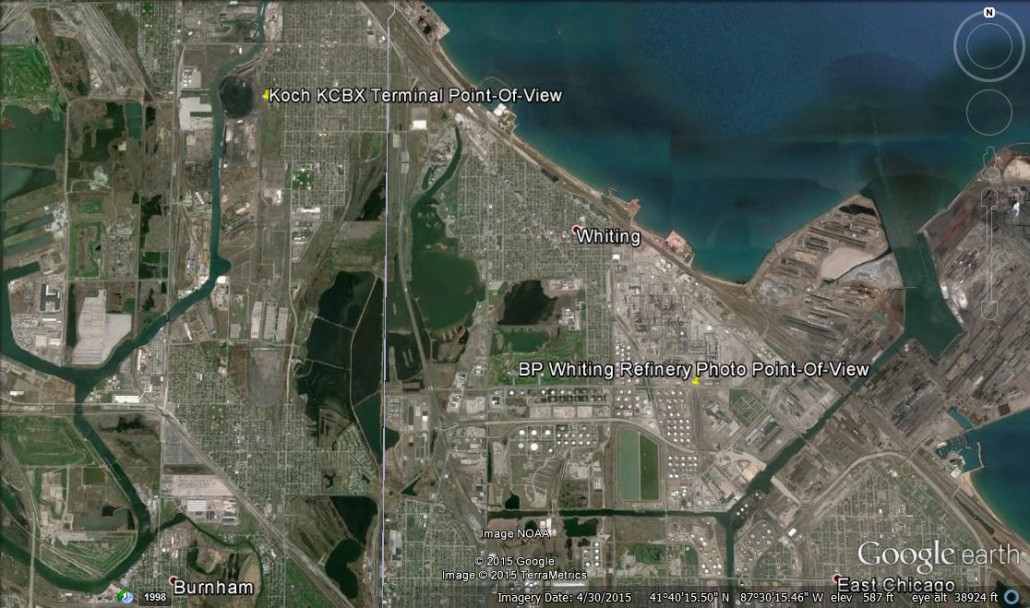
This situation is a shame because collectively Hegewisch and the city of Whiting, IN are home to one of the largest – and getting larger – collections of oil refineries and oil sands infrastructure in the United States.
For an estimation of how difficult it is to live in various Chicago neighborhoods, see Figure 1, left.
This proliferation has not been without its dangers, including a compressor station explosion at BP PLC’s massive1 Whiting Refinery in August 2014. Unfortunately, that incident was just the latest in a long line of mishaps at this facility. The “operational incident,” as BP called it, rocked already stressed neighborhoods like MarkTown, IN – the aborted company town planned for steel maker Clayton Mark. MarkTown is on the National Register of Historic Places and is an example of a community that is being erased from the face of the earth in the name of Hydrocarbon Industrial Complex expansion. For those interested in architecture preservation, MarkTown’s rapid erasure is being conducted by BP itself and in the process we are losing an example of Conservatively Radical architect Howard Van Doren Shaw’s distinct English-style Tudor homes and urban planning. Residents speculate BP “may be buying up the properties because of concerns about liability.” The company counters they are just trying to create additional green space for residents.
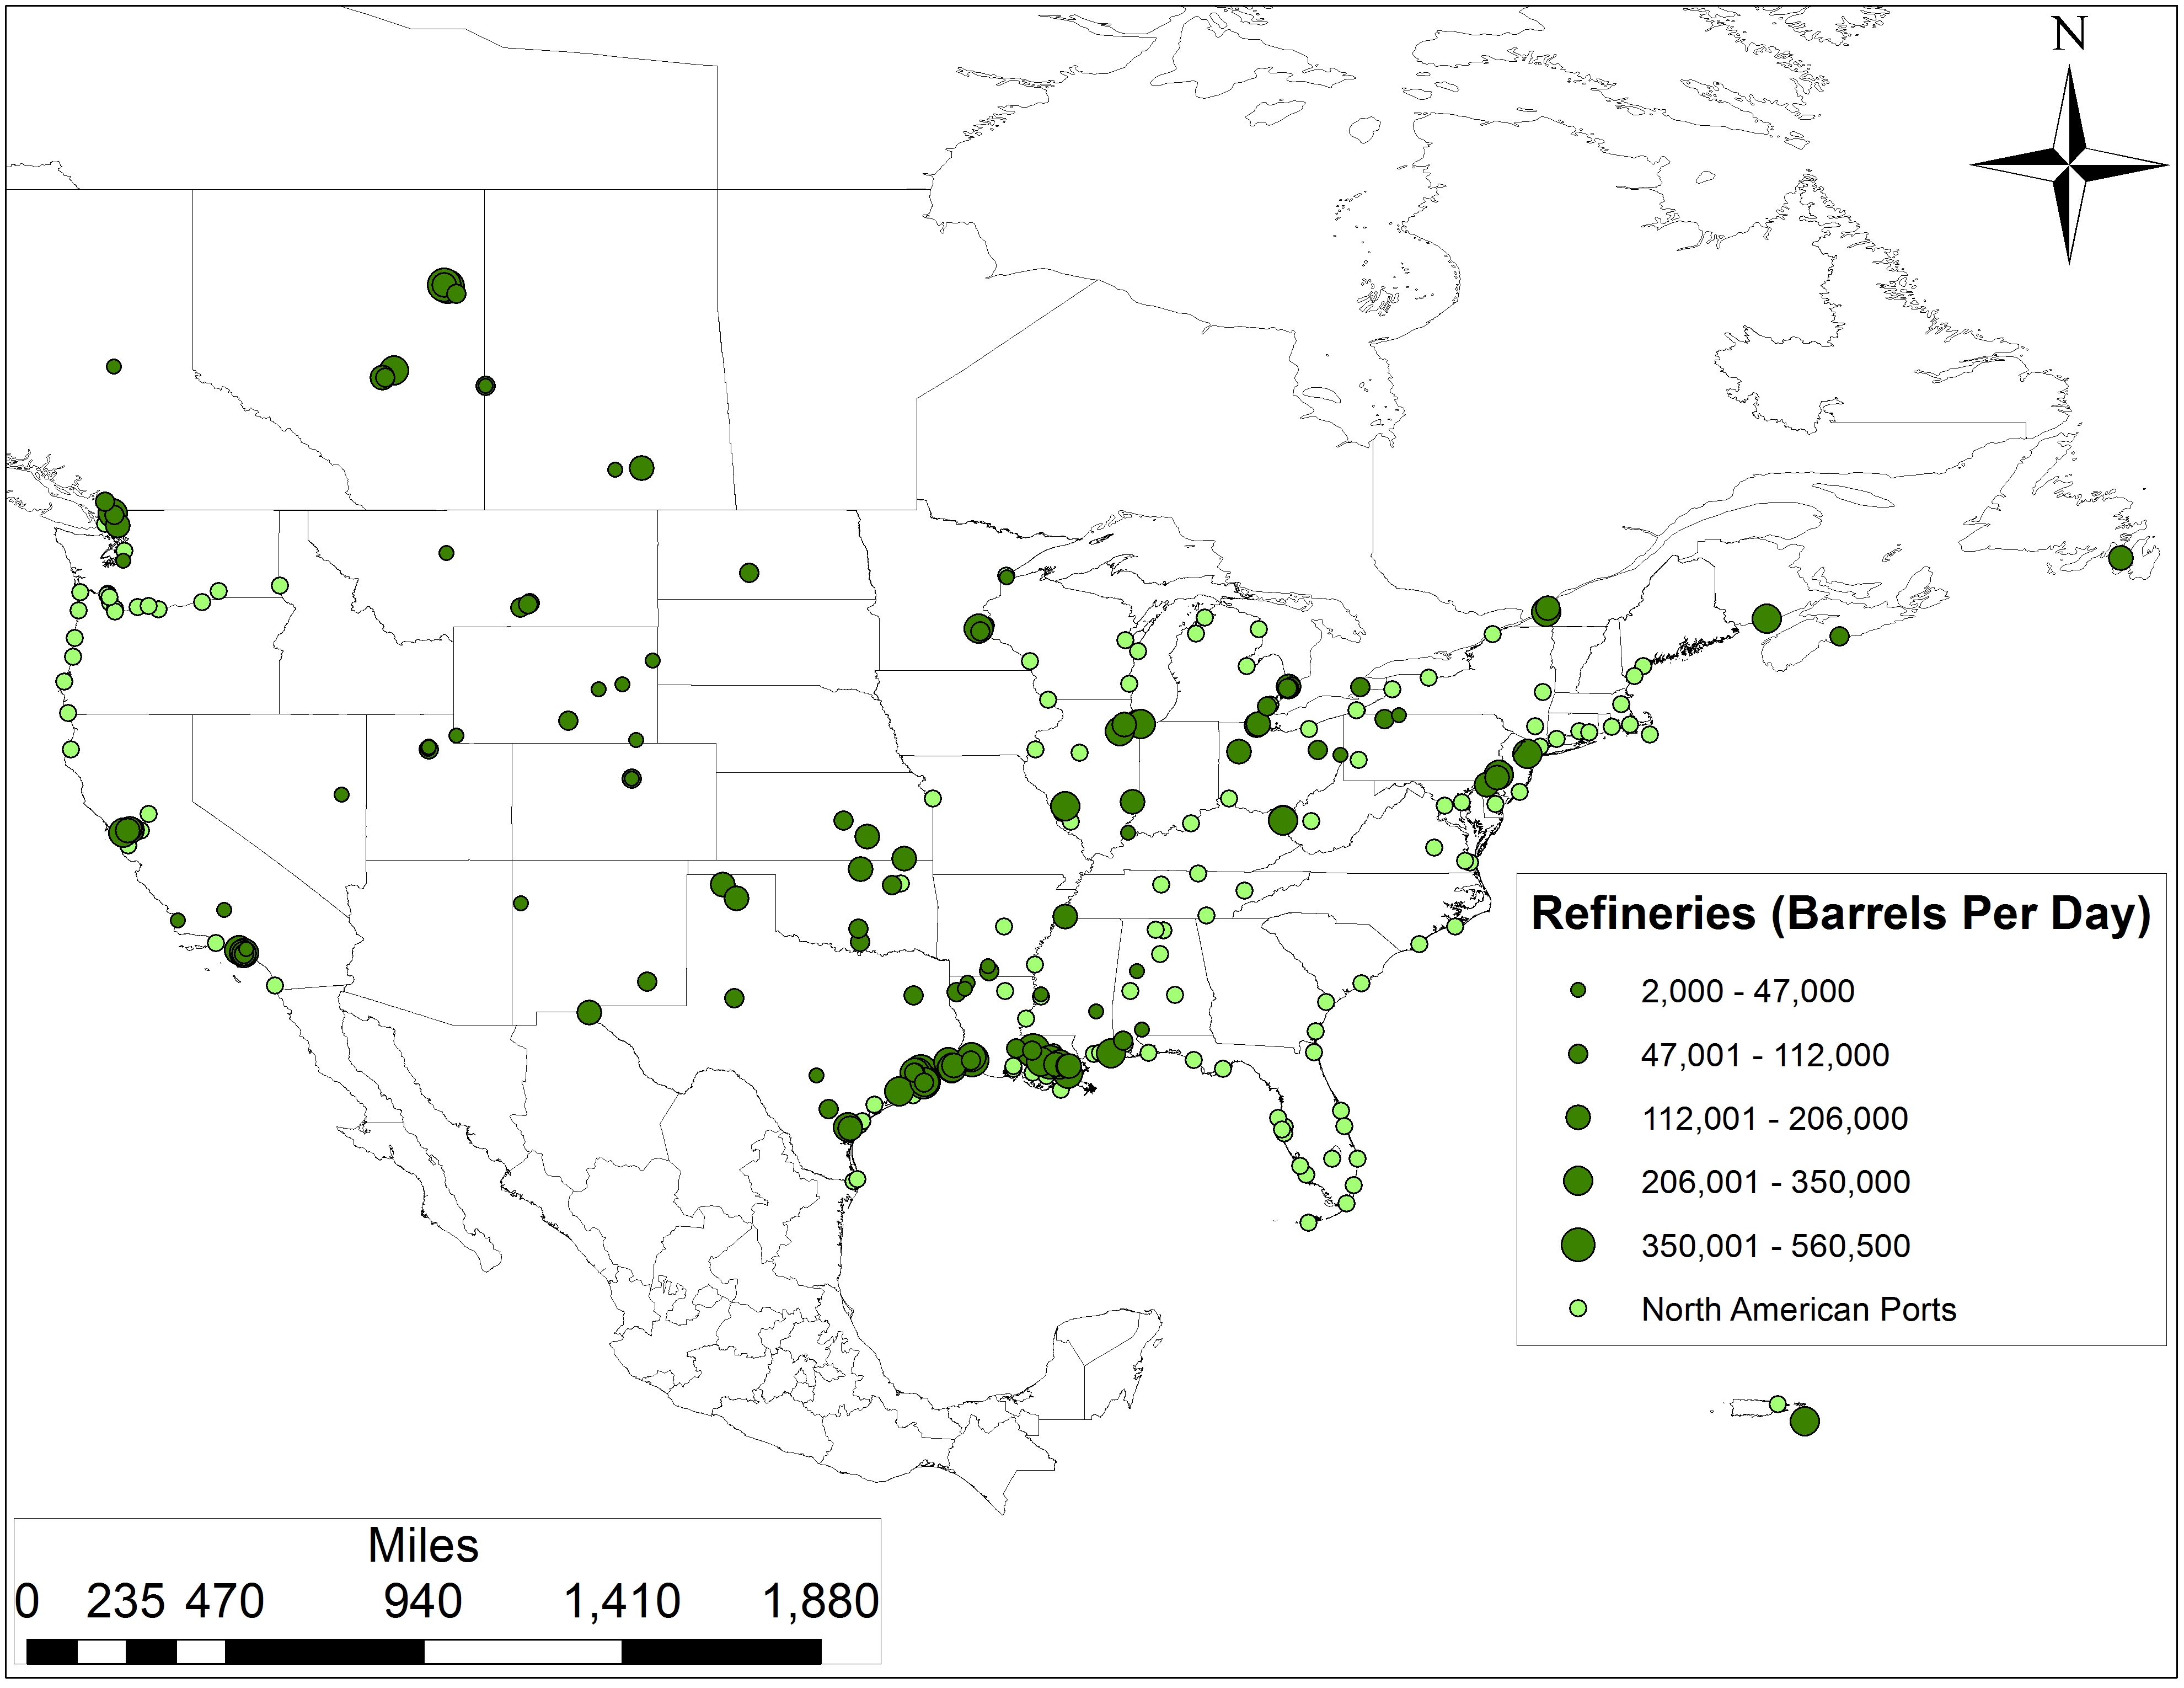
Figure 2. Average daily oil refinery production per day across North America’s 152 Oil Refineries along with North American ports.
Luckily for everyone, operations following the aforementioned recent explosion were only “minimally impacted as a result of the incident and the refinery continue[d] to produce products for customers.” However, the more chronic concern is the tight supply-demand relationship between BP’s refinery and their Koch KCBX neighbor. Koch has made repeated headlines – and many neighbors turned enemies including the Southeast Environmental Task Force and its fearless leader Peggy Salazar – with its handling of the refinery’s annual production of 600,000 tons of petcoke a development Chicago Magazine called Mountains of Trouble. Petcoke is a byproduct of the refinery’s increased acceptance and processing of tar sands from Alberta Canada. Levels of production are likely to increase given BP’s completion in November 2014 of a “$4-billion revamp…to boost its intake of Canadian crude oil from 85,000 bpd to 350,000 bpd.”
Given how interconnected the hydrocarbon industry is, I thought it would be worth collecting some photos of the aforementioned infrastructure. When I saw that Koch KCBX’s terminal was also storing large amounts of silica sand, however, the connection between my next target(s) in LaSalle County was made even more obvious.
Lasalle County, Illinois is situated approximately 50-60 miles south-southwest of Chicago. When you try to compare demographics and commerce, however, it is worlds away.
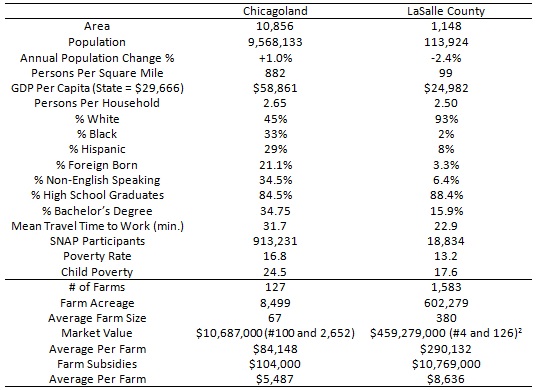
Chicagoland encompasses nearly 10,900 square miles – 9.5 times the area of Lasalle County. While Chicago’s population is expanding by 95,681 people per year, LaSalle’s is shrinking by 2,734 per year (Table 1). Chicagoans, though not South Siders, are making more than two times that of LaSalle County residents (with the latter actually falling nearly $4,700 below the state average). Predictably the demographics of Chicago reflect more and more those of the US, while LaSalle is typical of rural America with a population that is 93% white and only 3.3% foreign born. Thirty-five percent of Chicagoans are likely to achieve a bachelor’s degree, while only 16% of LaSalle County residents are likely to do so. Rates of poverty and more specifically child poverty, on the other hand, are significantly higher in Chicago. Finally, LaSalle is one of the country’s preeminent farming counties; it ranks #4 in the state and #126 nationally thanks to the value of agricultural commodities produced amounting to $448.5 million net of farm subsidies. See Table 1.
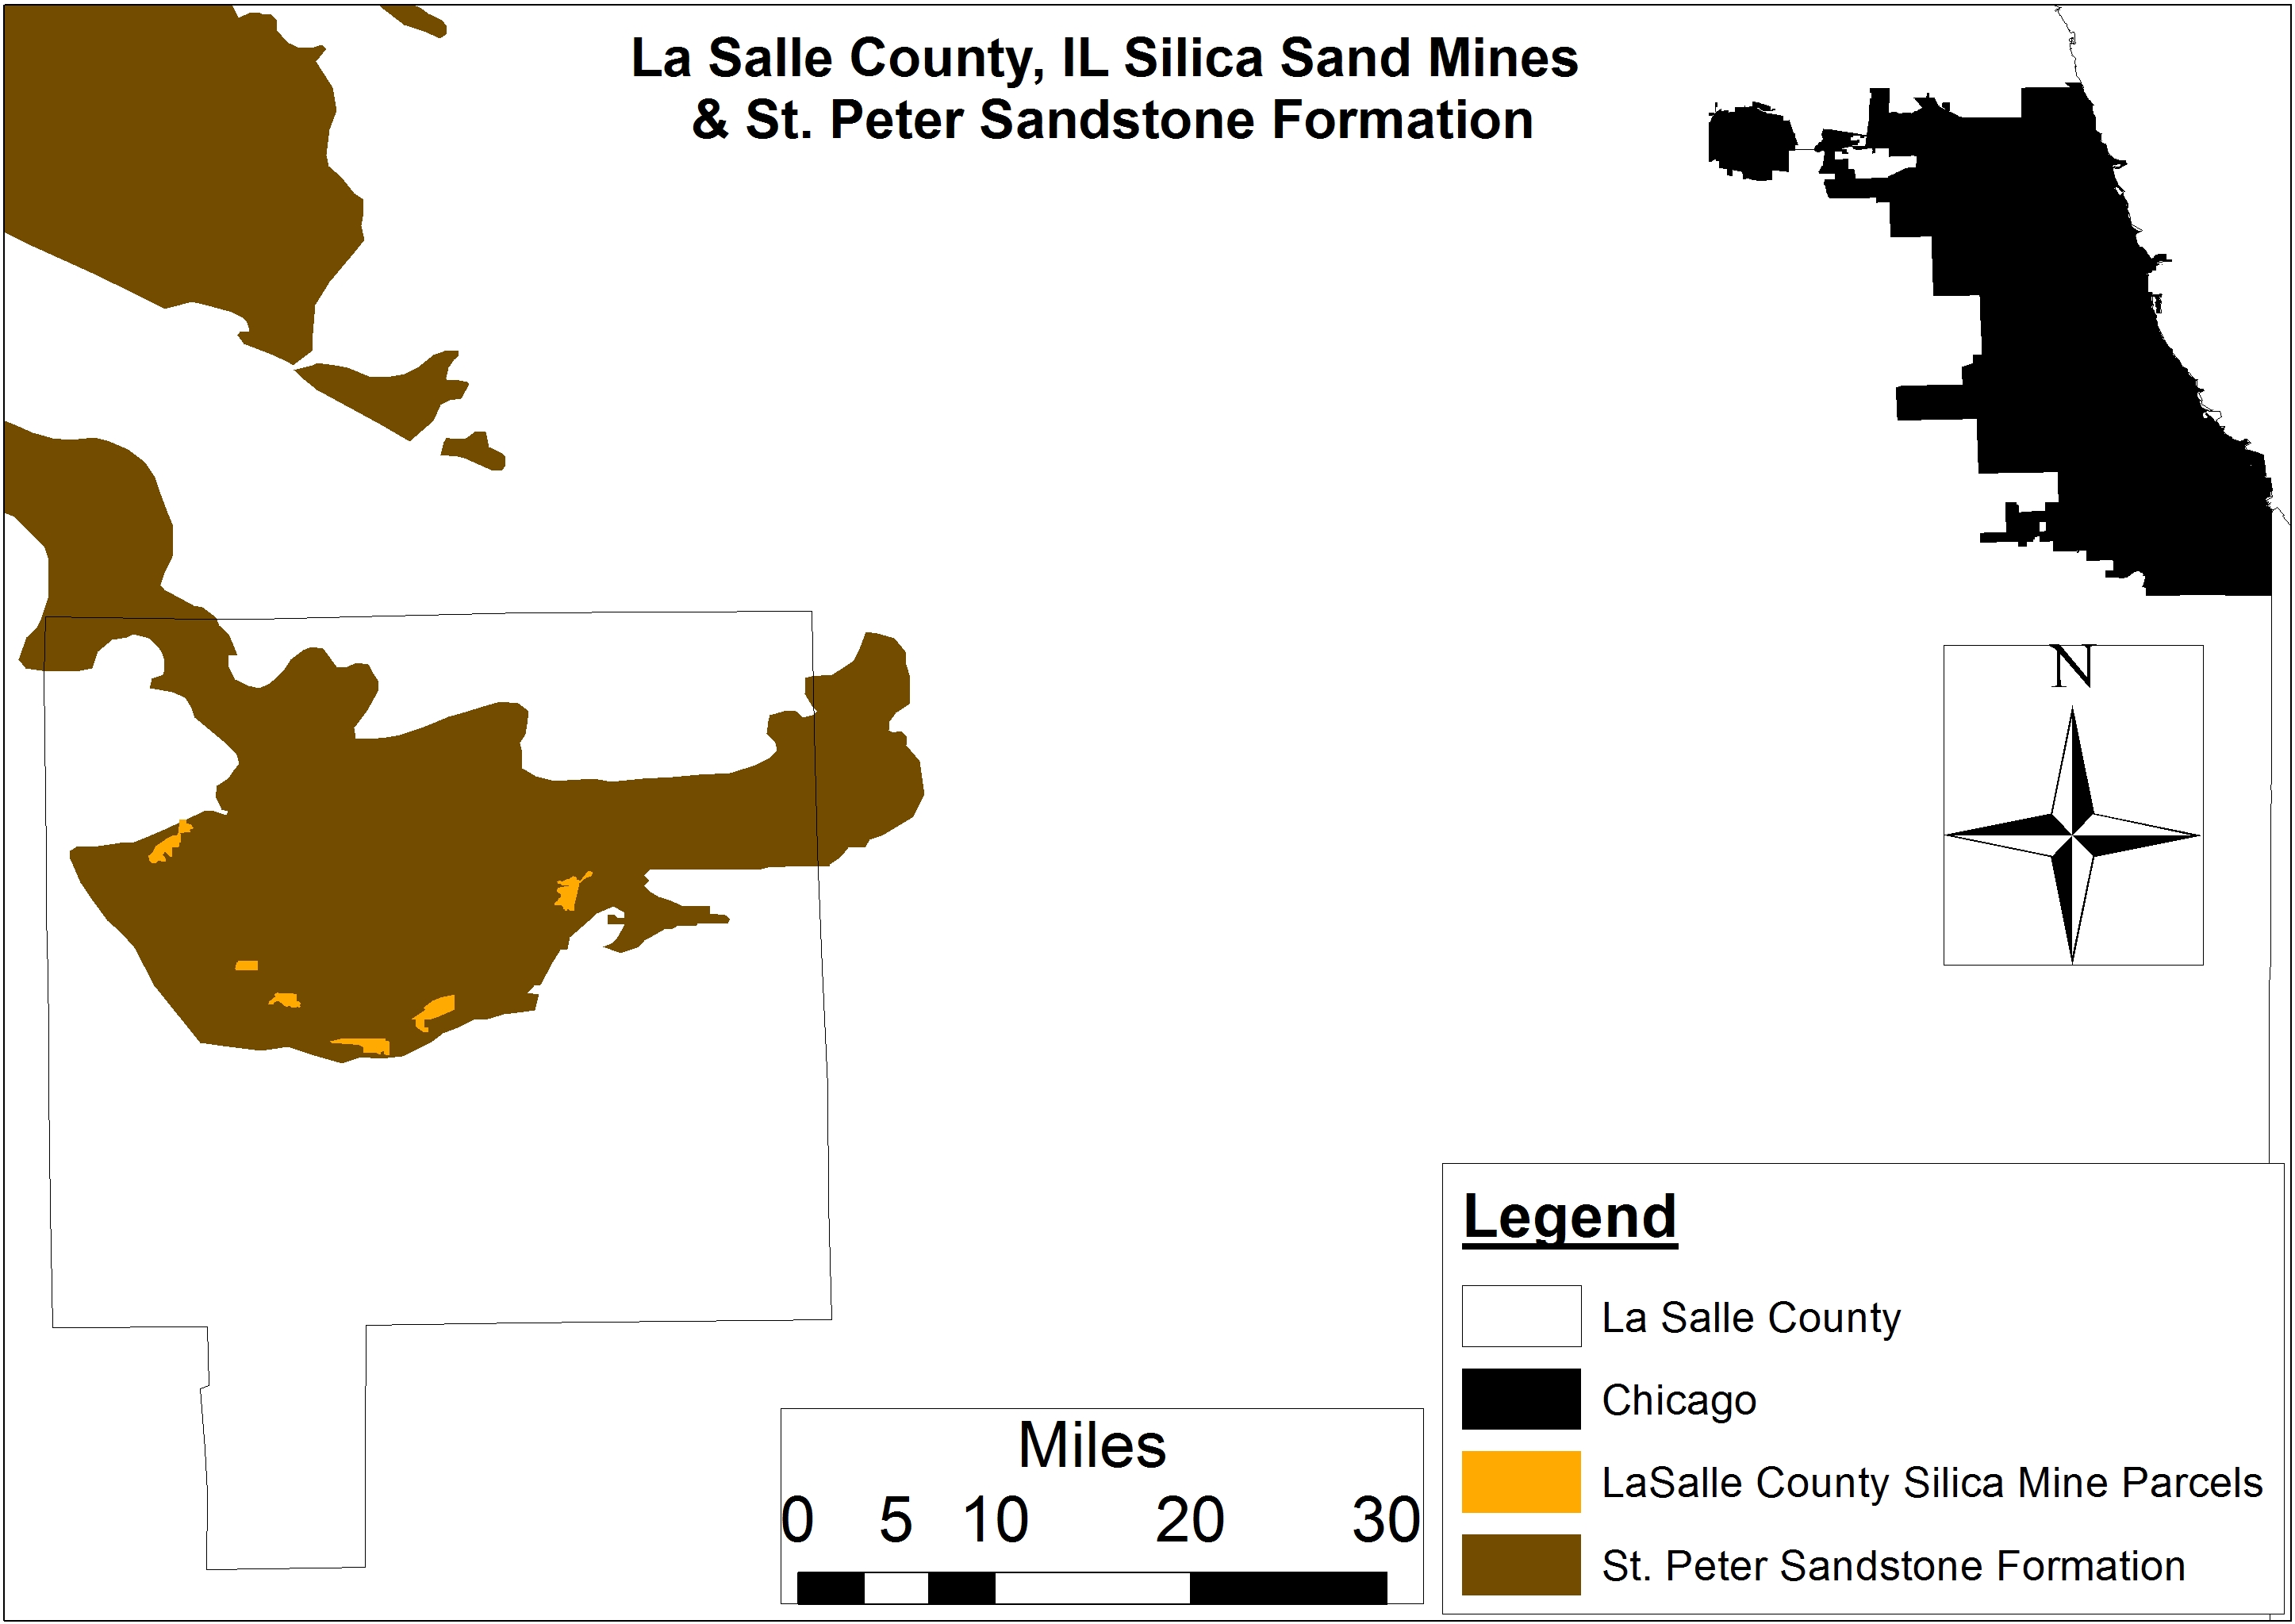
Figure 3. La Salle County, IL Silica Sand Mines & St. Peter Sandstone Geology
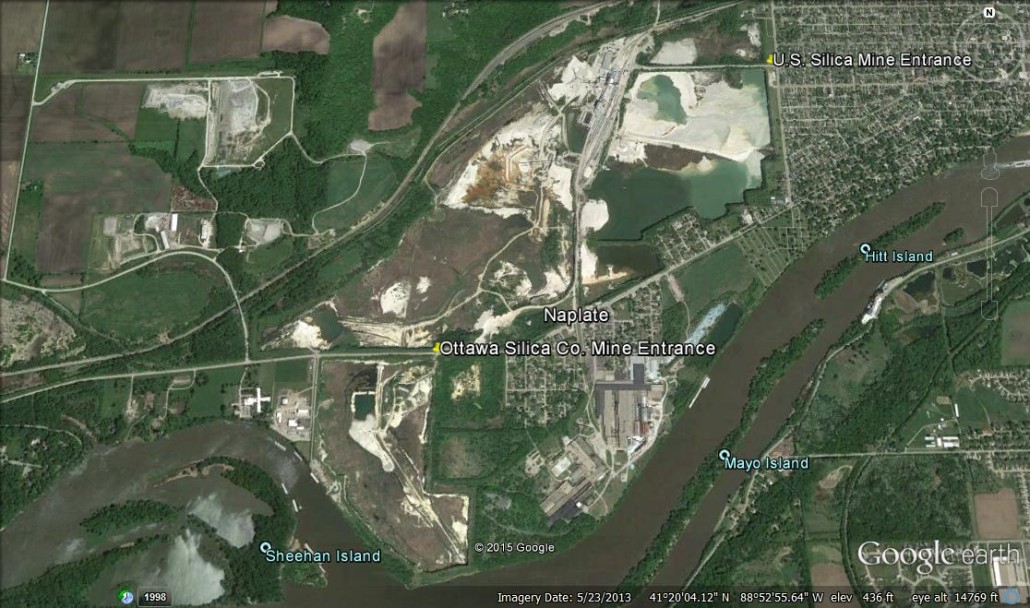
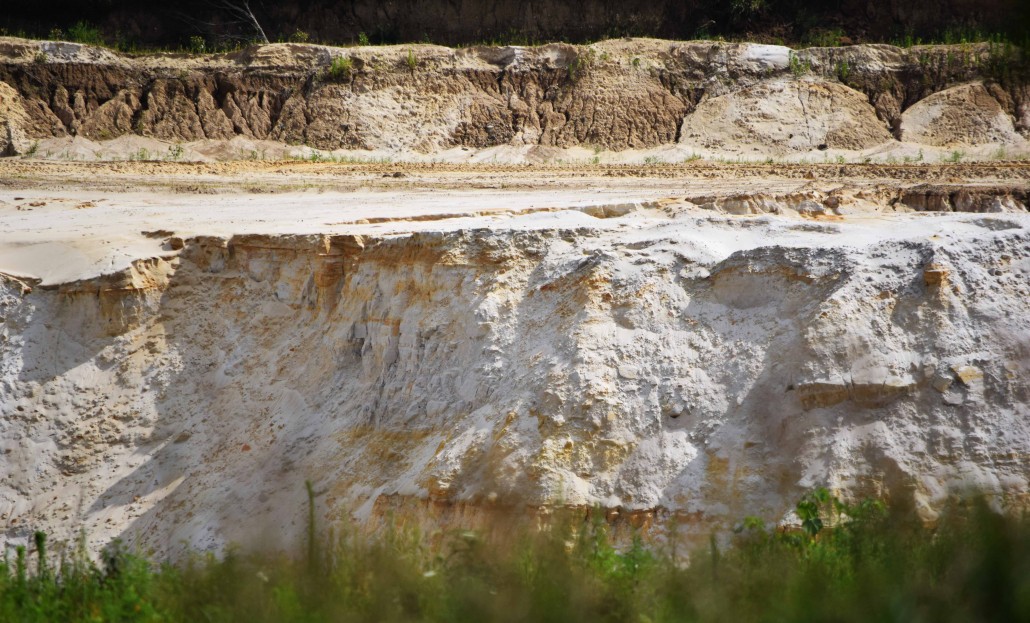
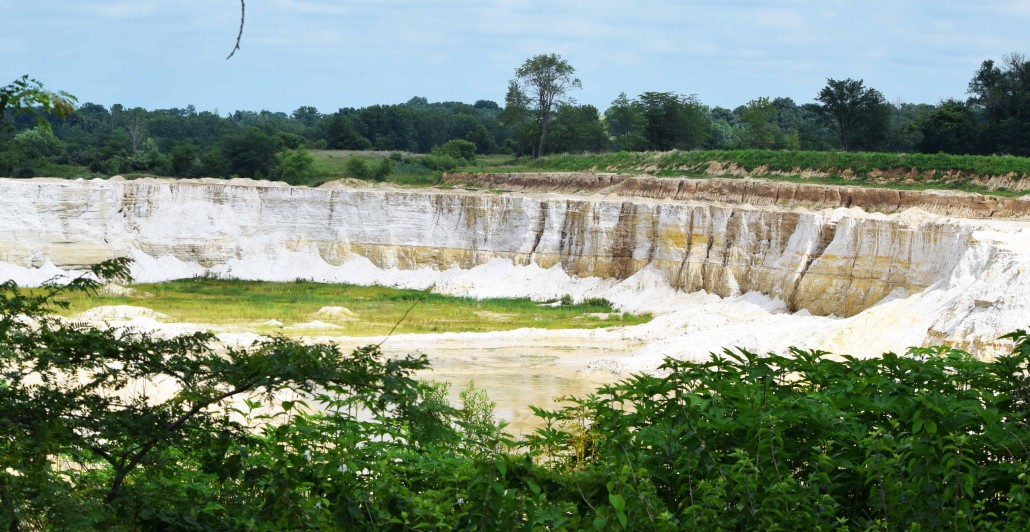
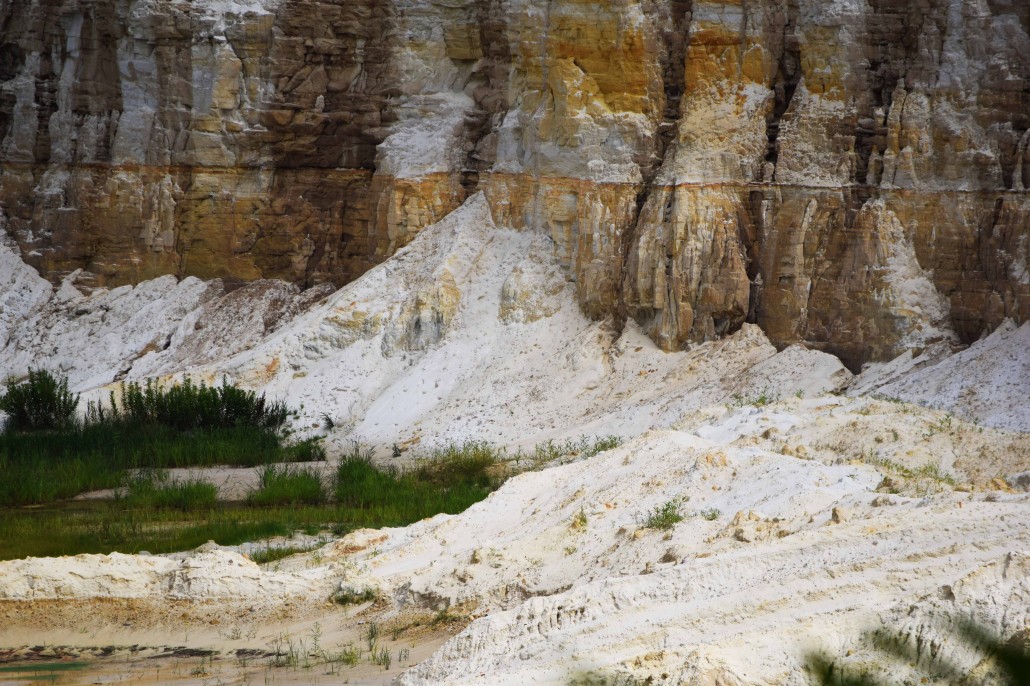
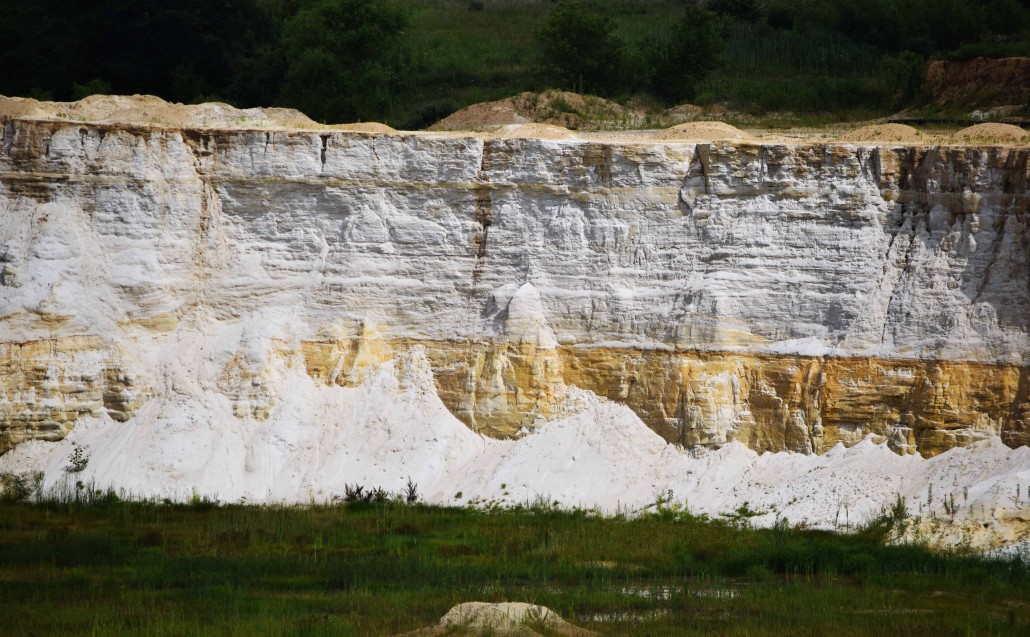
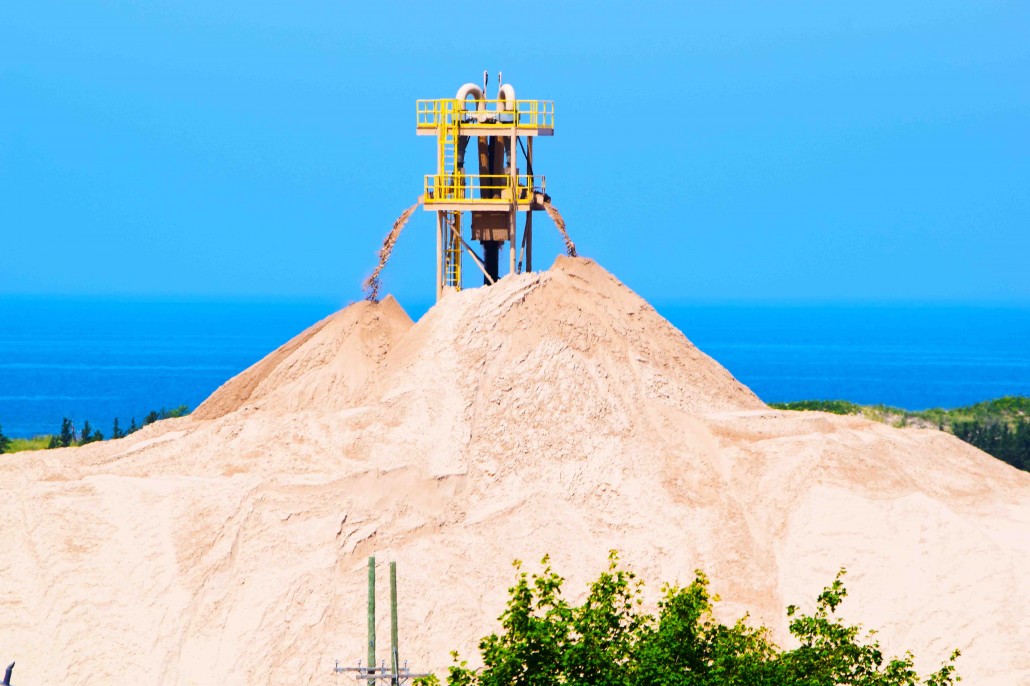
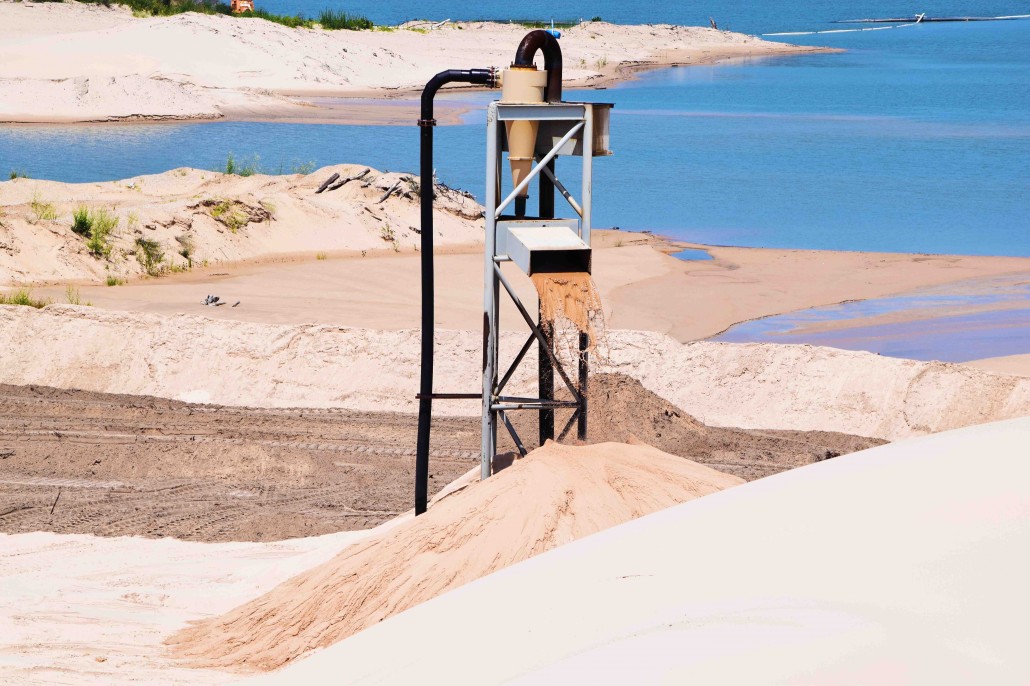
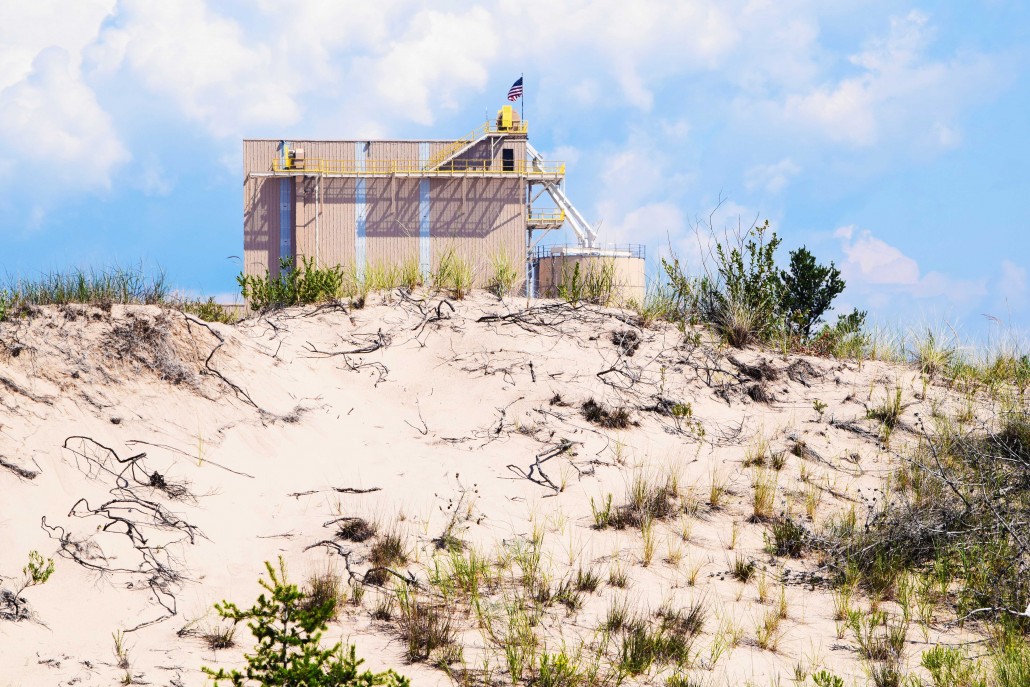
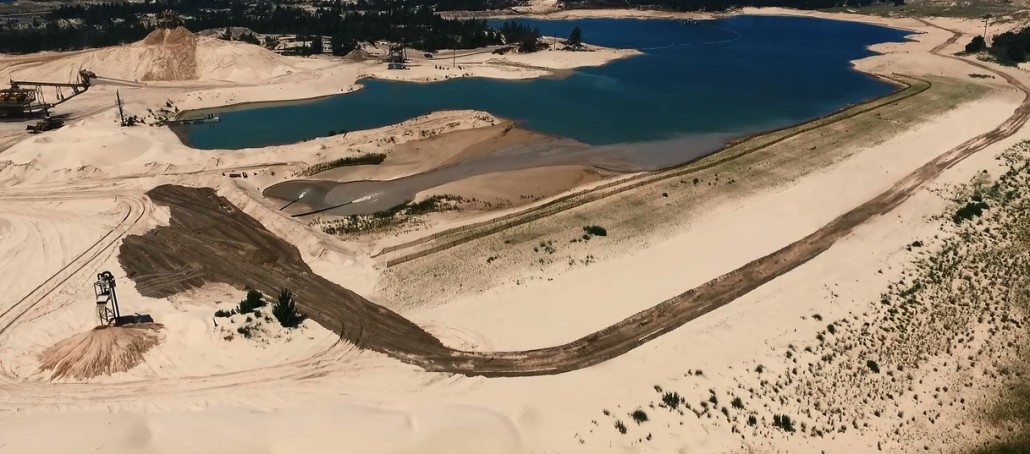
The above contrast was made crystal clear as I traveled down Interstate 80 westbound towards exit 90 and LaSalle’s County seat Ottawa (pop. 18,562). Upon arriving in Ottawa I drove west on Madison Street to the first target of our expedition: U.S. Silica Company’s mine and processing facility at the corner of Madison Boyce Memorial Drive. Upon arriving, however, it became clear that I would not find a suitable location to photograph the company’s mine; the perimeter had been fenced off and mounded up to the tune of 10-15 feet. So I got back in our rental car and drove to the mine’s southern perimeter adjacent to the Bear Den Bar and Grill and the Vine St.-Fern St.-15th Ave. neighborhood where there was clear line of site. It was here that I got some of the best photos of the mine’s scale and scope with respect to land-use, reclamation, and hydrology.
Below is a sample of some of those images as well as several I took further down Route 34 between U.S. Silica’s active mine and a “reclaimed” Ottawa Silica Co. mine on the banks of the Illinois River.
After snapping several hundred shots of these two mines I headed to the I & M Canal State Trail between Utica and Ottawa emanating out of Buffalo Rock State Park and hiked east towards the Northern edge of U.S. Silica’s mine alongside a CSX railroad and recently constructed spur feeding into the mine’s loading terminal. The hope was that I would get a closer look at the mine but it turned out the angle was different but not better.
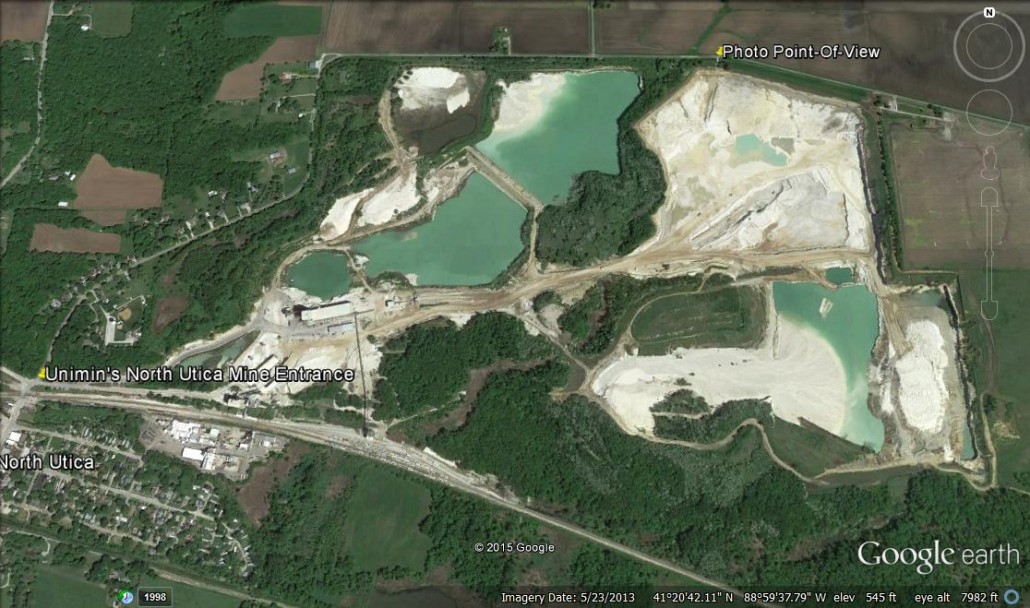
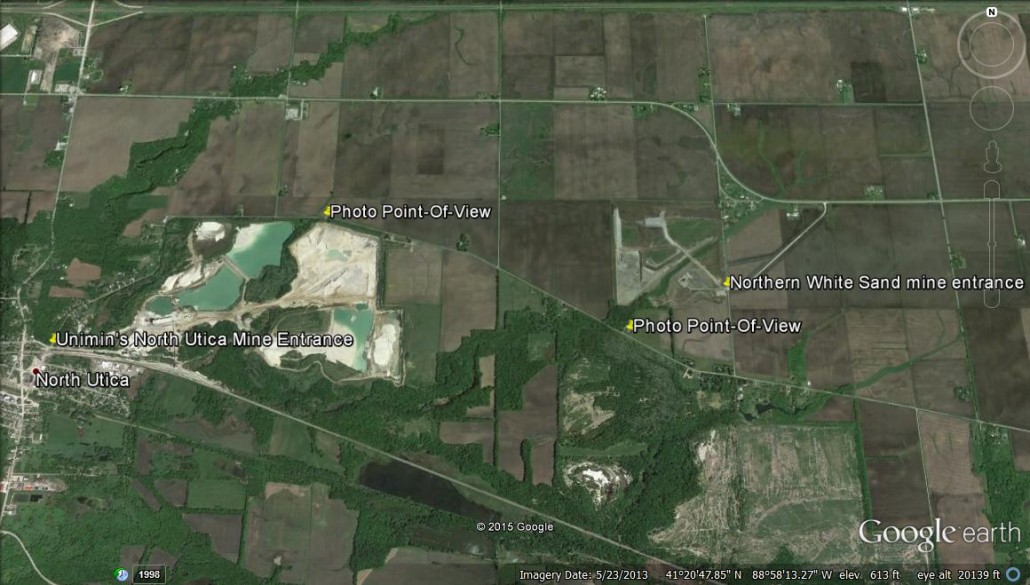
From the back of U.S. Silica’s Ottawa mine I traveled approximately 7 miles west to Unimin’s North Utica mine and a short dirt road off of 2803rd Road on the northern edge of the mine.
It was here that I photographed the mine’s reclamation plots, active mine pits, and developing water transport mechanisms. However, more importantly it was from here that I noticed off in the distance a bright red silica sand grain-size separator.
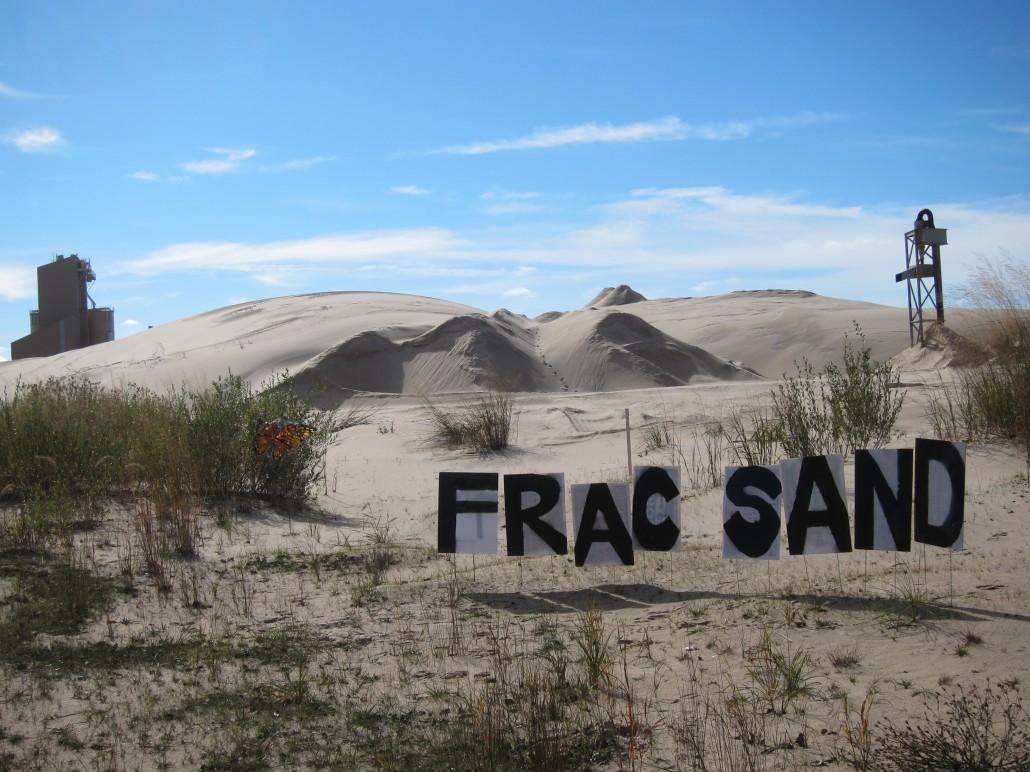
Curiously I did not – but do now – have this nascent and relatively small mine posted on our Frac Sands Mines and Related Facilities map at the time. Upon arriving at this site I found that the mine was owned and operated by a company called Northern White Sand a small mom & pop operation out of Utica, IL.
The photos I took of this mine were primarily from atop a vegetated berm to the southwest of the mine’s primary footprint. This vantage point allowed us to get some great shots of the types of infrastructure/equipment typical of this sized mine including the aforementioned modular grain-size separator, conveyor belts, retention ponds, and the pyramid-like piles of powdery white silica sand so desired by the HVHF industry.
Our final stop on the LaSalle County silica sand mine tour landed us in Troy Grove 13 miles north of North Utica by way of Interstate 39. It was here that I visited several vantage points around Technisand’s MBI Manley Bros. silica mine. The expanse included the site’s mixture of old and new processing infrastructure, what appeared to be an alluvial fan derived from sand waste and associated wetland, and the mine’s far reaches alongside a Chicago and North Western Transportation Company (CNW) railroad.
So now that I have outlined my tour of La Salle County I thought it would be helpful to share some of the stories residents told me during my travels and later by way of email.
Anna Mattes – La Salle County, IL
I live in LaSalle County, Illinois where I have prime farmland and Starved Rock State Park… the crown jewel of Illinois. I already have a fine farming industry and plenty of tourism as Starved Rock is visited by two million people annually. LaSalle County already has forty two quarries, gravel pits and sand mines. If I allow anymore the county will look as though it has been bombed. Empty sand pits will never produce food ever again. No amount of reclamation will restore this land to be productive…Each mine uses one million gallons of water daily. The LaSalle County Board has enlisted the USGS to do a hydrology study to determine how much water I have in our aquifer for municipalities and farming. Presently I have a moratorium in place on sand mines thru July 2016 and I hope forever. As a woman, wife and mother I am charged with the continuity of life. It is my job, profession, to raise healthy children, make a healthy breakfast and pack a nutritious lunch for my husband so he can do his job, and it generally falls to women to care for the elderly in families. With out clean air, pure water, healthy food what is the quality of life? Fracking is a dangerous business and I need to take better care of Planet Earth. Please do your part, I’m a Master Gardener and I’m doing my part.
Thomas Skomski – Wedron, IL
I am a resident of Wedron who has been severely impacted by Wedron Silica; and I want to report that there are many more problems associated with the influx of sand mines in LaSalle Co. than named in your recent article. In order to be fair to other residents who will be negatively affected by proximity to any sand mine I believe it is important to inform them and all concerned on the unmentioned problems associated with living near a sand mine. For example: the mountains of sand that are produced migrate everywhere the wind takes the particles. As I all know the winds are frequently fierce in this part of the country. One neighbor describes how in the morning when he sets his coffee cup down on his front porch and goes into his house to get the newspaper that he returns to find a layer of white sand covering his coffee. Another neighbor vacuums the sand off her living room rugs weekly while her husband regularly has to clean out sand-filled gutters. I do know that enabling pollutants on private property is technically criminal trespass. At the last EPA hearing in Wedron a retired mine employee admitted that Wedron Silica uses 100 million gallons of water per hour in sand processing. Some of this water is recycled. Since I have not confirmed those statistics, I prefer sticking to the fact that the mine has reversed the flow of the ground water. Who knows what the unseen consequences of that reversal might be? The toxic plume that Wedron Silica is in part responsible for creating migrates wherever the ground water moves. As a result of the threat of my well being poisoned my land, 23 acres has been devalued by the county to $1.00. All my five buildings are worth 40% of what they were before nine wells were poisoned in Wedron. Those wells were so toxic with benzene that water came out of the faucet orange and you could not breath it let alone use it to wash anything. Wedron Silica has begun buying homes in Wedron which will allow them to pursue their wealth with no concerns- BUT what about the water which I all know is in limited supply and susceptible to being polluted? So in summary, please include the human costs involved in a mine opening near you. My wife and I moved to the country to enjoy the solitude and quiet of living on a farm in our retirement years. The quality of our lives has been diminished, in addition the noise is disturbing; trains come in at all hours incessantly blowing their horns and the semi traffic is constant. Finally, I have heard a lot of what I consider negative criticism about the EPA. Having experienced this monumental problem directly it is perfectly clear to me that without the resources of a pro-environment organization I would be hard pressed to stand up to a corporation with multi billions in assets.
Ashley Williams – LaSalle County, IL
The nickname the “Silica Sand Capital of the World” has quickly transformed into a curse rather than a blessing for the citizens of LaSalle County, IL. Here, the frac sand industry continues to proliferate, endangering the health and safety of the people and local environment. Our precious life vessels: our air, water, and soil are under siege by a nexus of power that seeks to intimidate us into quiet submission, but I’ll be damned if I’m going to sit by and let that happen.
Stay Tuned
In Part 2 of this series, I will cover our frac sand tour in Michigan’s Monroe and Mason counties, where the aforementioned U.S. Silica along with Sargent Sand and Sylvania Minerals are making their presence felt in more ways than one.
Footnote
This facility alone processes nearly 2% of all oil in North America on a daily basis. This facility is the seventh-largest refinery in the United States and the largest outside of the Gulf Coast.
By Sam Rubright, MPH, CPH – with contributions from Ana Wieman and editing by Cecilia G. Flocco, PhD
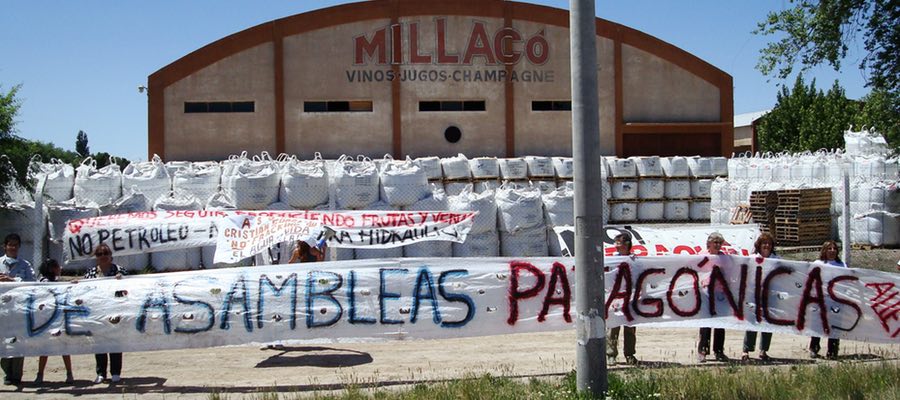
While the transition from fossil fuels to renewable energy sources is a globally critical issue (link updated in 2018) with significant implications for the oil and gas industry, the same industry encounters on-the-ground challenges in many places where extraction occurs. Argentina is now experiencing those challenges firsthand.
Argentina, South America’s 3rd largest economy, could have 801.5 trillion cubic feet of wet shale gas (more than unproven US reserves), and 27 billion barrels of tight oil.1 Oil and gas companies are excited about the prospects. Argentina has even started to produce its own sand for the hydraulic fracturing process in an attempt to reduce the cost of drilling and attract investors. Already, however, community concerns about environmental health and safety are rising to the surface.
Allen, Argentina
Allen is a city in the Río Negro (“Black River”) province of Argentina, located at the northern edge of the Patagonia region. It is known for its rich fruit production and hosts approximately 27,000 inhabitants as of the most recent census.2,3 Allen is also home to shale oil and gas drilling currently being conducted by Yacimientos Petrolíferos Fiscales (YPF), Argentina’s renationalized energy company.
On July 21, 2015, two separate incidents occurred near Allen. In the first case, a violent decompression at the well4 triggered what was likely a blowout. The spray that resulted caused hydrocarbons to be deposited into a lagoon that flows into the Black River, the province’s namesake and one of the main water sources for the arid Patagonian plateau. Clean up efforts took place immediately, although there was a lack of awareness that a rural community, Calle Ciega #10, lives very close to the drilling activity.5 Less than 24 hours later, Ysur, a YPF contractor, damaged an aqueduct near the town, leaving coastal area residents without drinking water.6
Mirroring community concerns near drilling operations in the US, residents of Calle Ciega #10 have felt the effects ever since the industry came to town; living near such intense industrial activity, they say, has put them all on edge. They worry about everything from cracking foundations, fire and explosions, potential gas leaks, to the heavy truck traffic. Organic farmers are even having trouble selling their produce due to the proximity of oil and gas operations to their fields. The uncertainty of it all is the biggest problem; residents have gone so far as to protest the recent incidents by blocking access to one of wells in the area (EFO 250).7 The neighbors’ concerns were brought to a civil court by Rio Negro province’s Ombudsman, action resulting in ordering environmental impact investigations and in ceasing activities at the well (EFO 280).8
Below you will find some photos from Allen, showing the trucks that transport water for the drilling, a warehouse for sand and ceramics, the well where there were two explosions in recent history, and piping that goes into a neighbor’s yard – Submitted by Ana Wieman:
Trust vs Uncertainty
Argentine communities are fighting a battle between trusting that the industry and government will properly manage oil and gas operations and being left in the dark about public health and safety risks. In addition to the incidents in Allen, a major cyanide spill from a gold mine9 in San Juan province in September (exploited by Canadian Barrick Gold Corp.) has added fuel to public concerns about how Argentine natural resources, as well as the response to incidents and information, are being handled. Inconsistent messages elevate community tensions, leaving a trail of doubt and uncertainty in their wake.
“Vos y yo, bebemos la misma agua.” = “You and I, we drink the same water.”
– Facebook sentiment by Elvio Mendioroz, Argentina
Derrame de Cianuro en San Juan (Cyanide spill in San Juan). (2015). About the cyanide spill in the Veladero mine, San Juan – TV news show
Jáchal, cuando ya nadie te nombre (Jáchal, when no one will say your name – anymore). (2015). De Tierras y de Utopias Viaje Documental – From Lands and Utopies, documentary of the spill in Jáchal that resulted in years of existing water problems
Please note: Many of the resources we accessed to write this story, as well as most correspondence, were in Spanish. Please alert Sam to any translation errors: malone@fractracker.org.
https://www.fractracker.org/a5ej20sjfwe/wp-content/uploads/2015/12/Argentina-Feature.jpg400900FracTracker Alliancehttps://www.fractracker.org/a5ej20sjfwe/wp-content/uploads/2025/09/2025-Wordmark-Logo.pngFracTracker Alliance2015-12-28 13:46:372020-03-12 13:39:33Trust vs Uncertainty in Argentine Communities
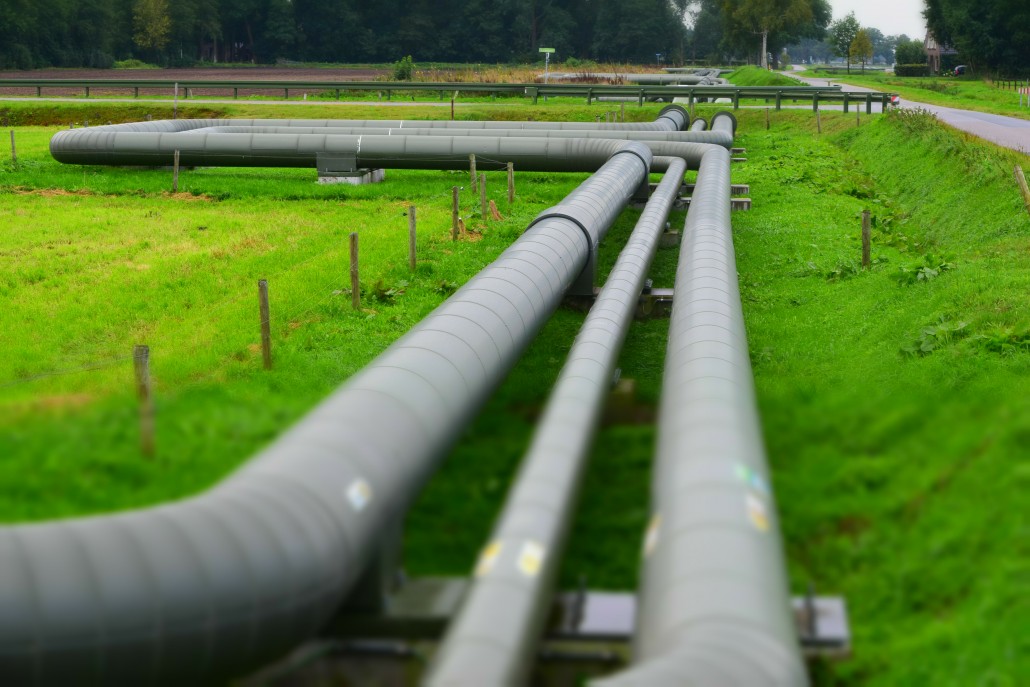
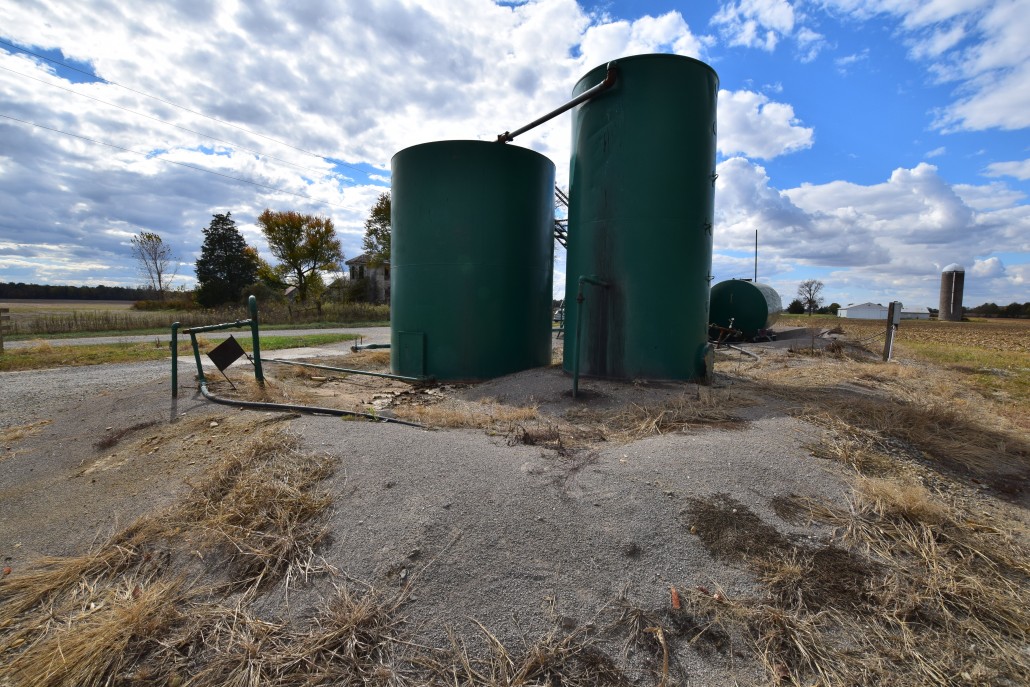
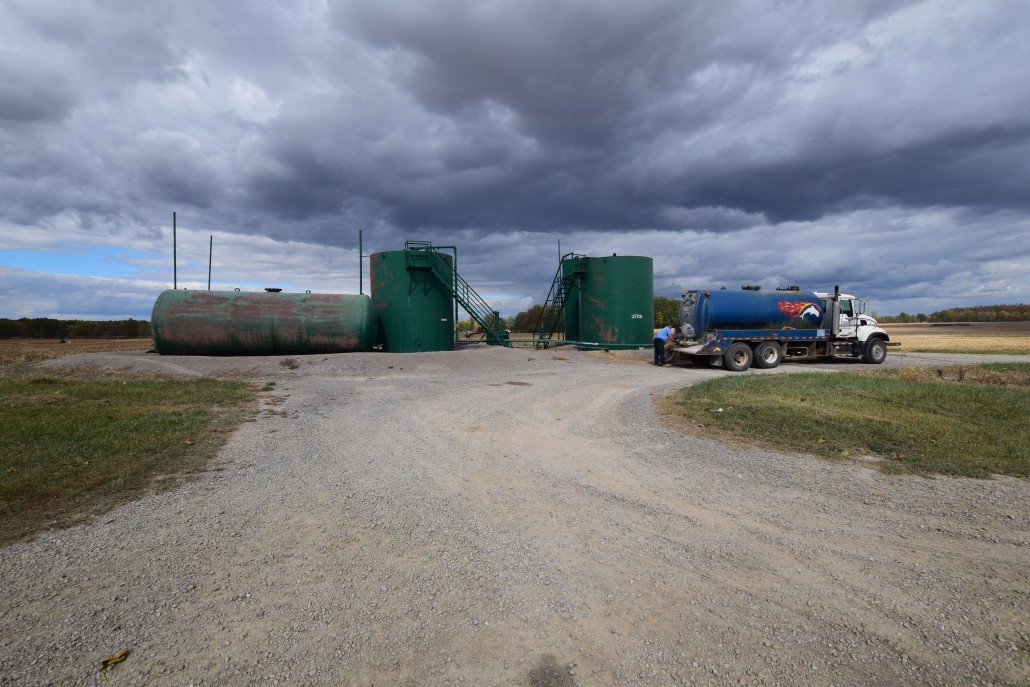
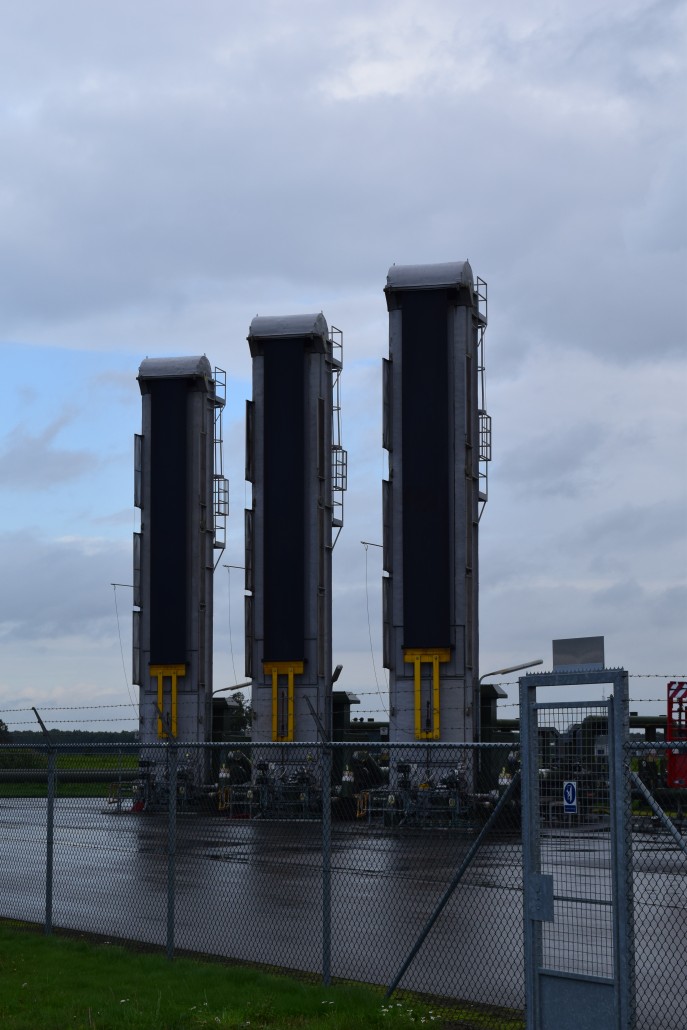
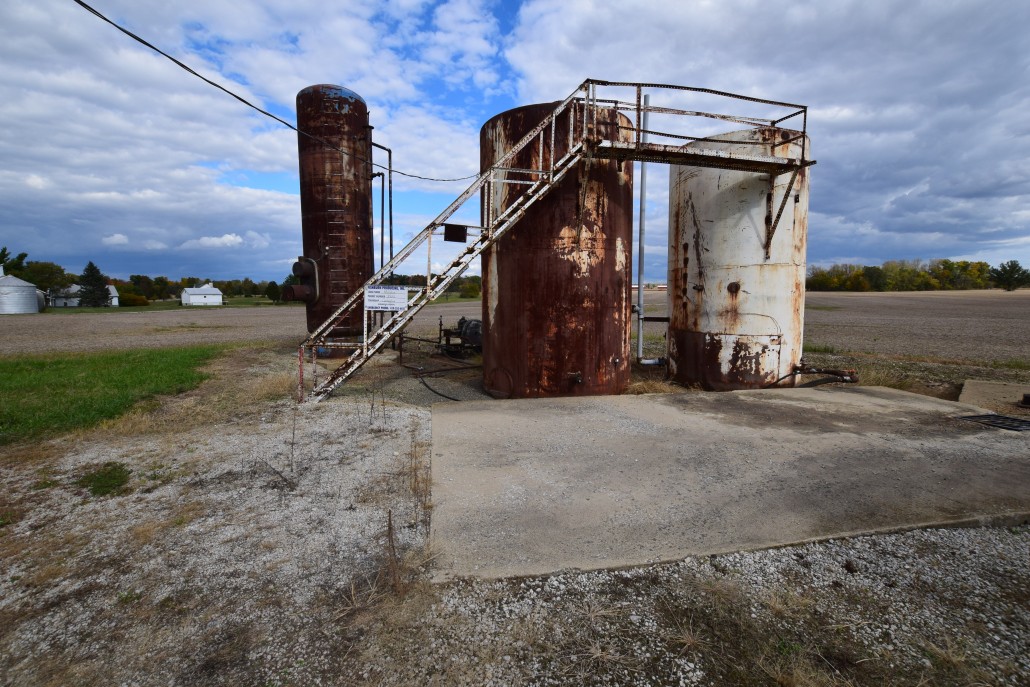
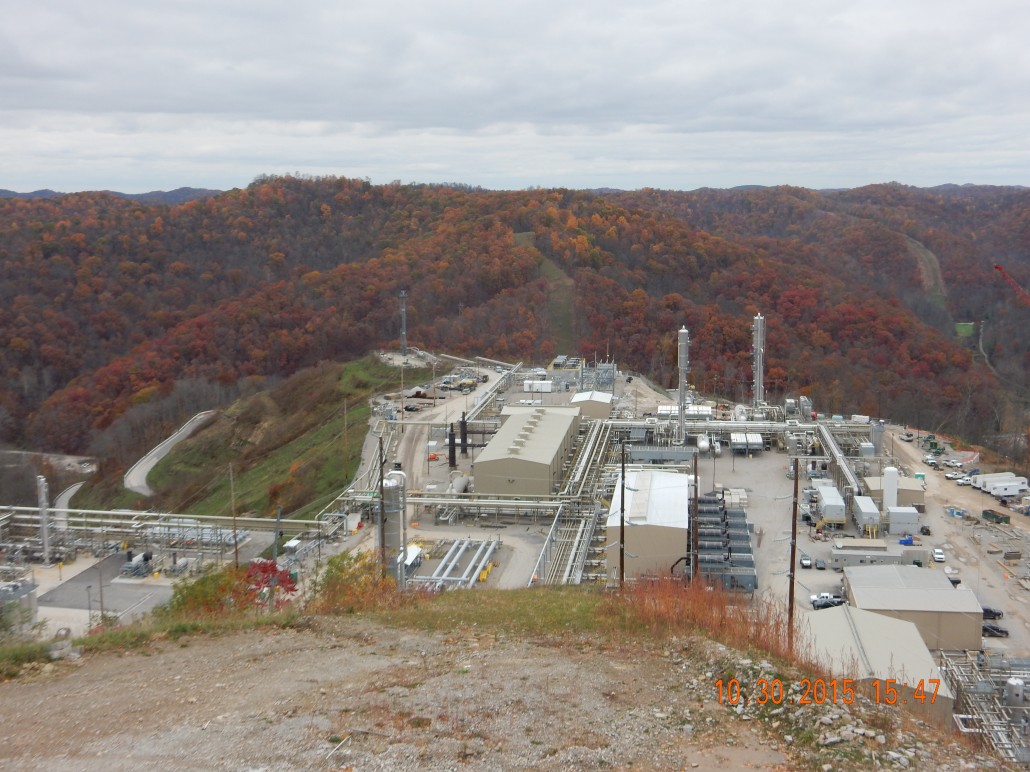
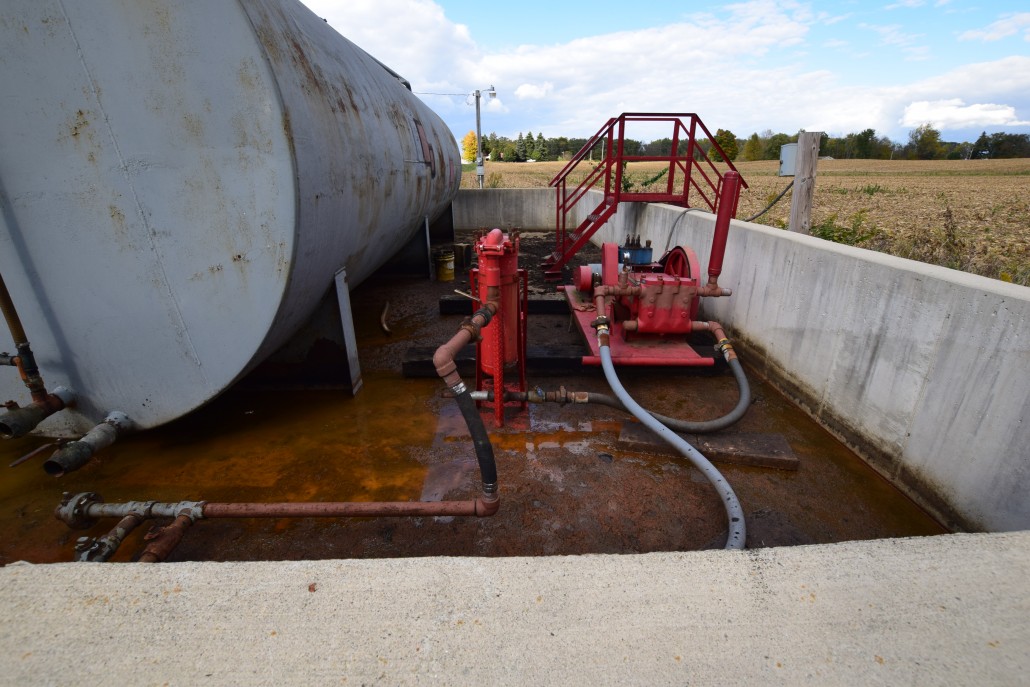
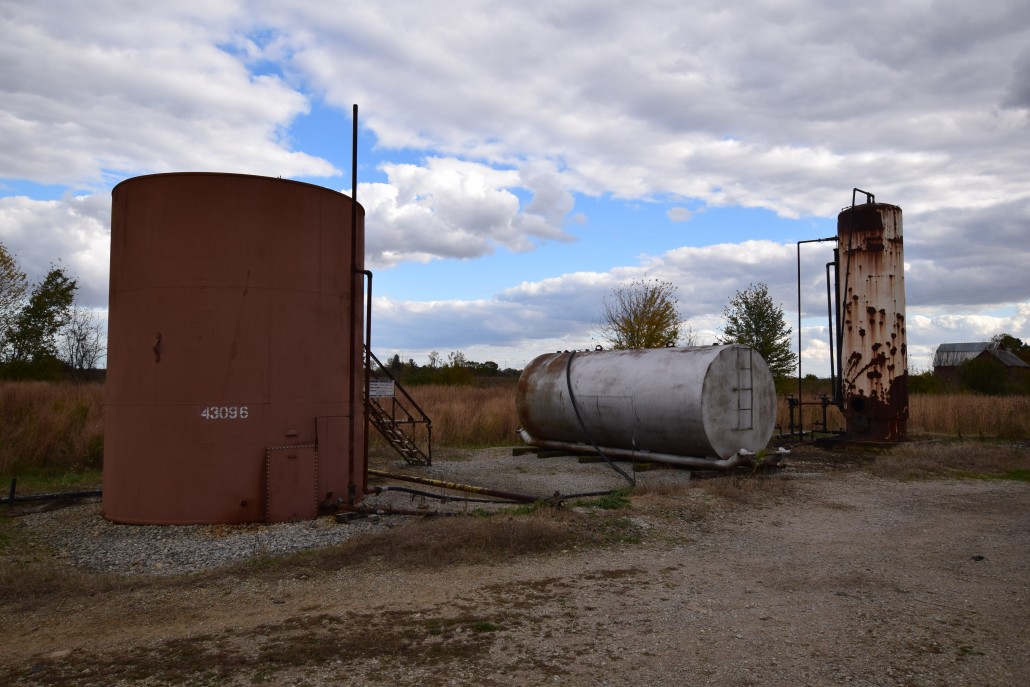
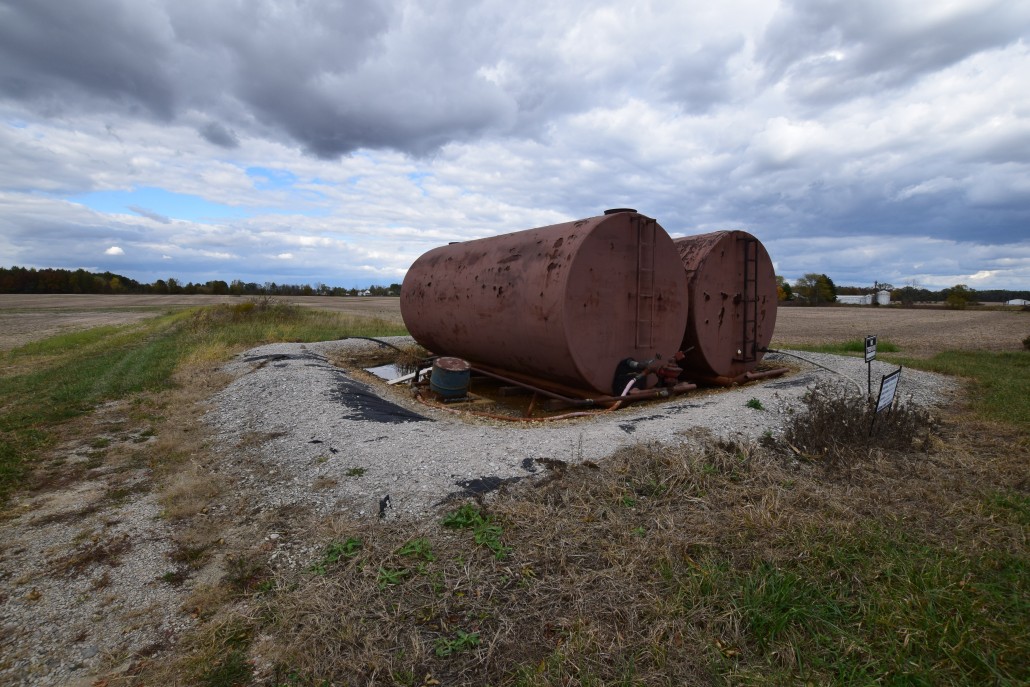
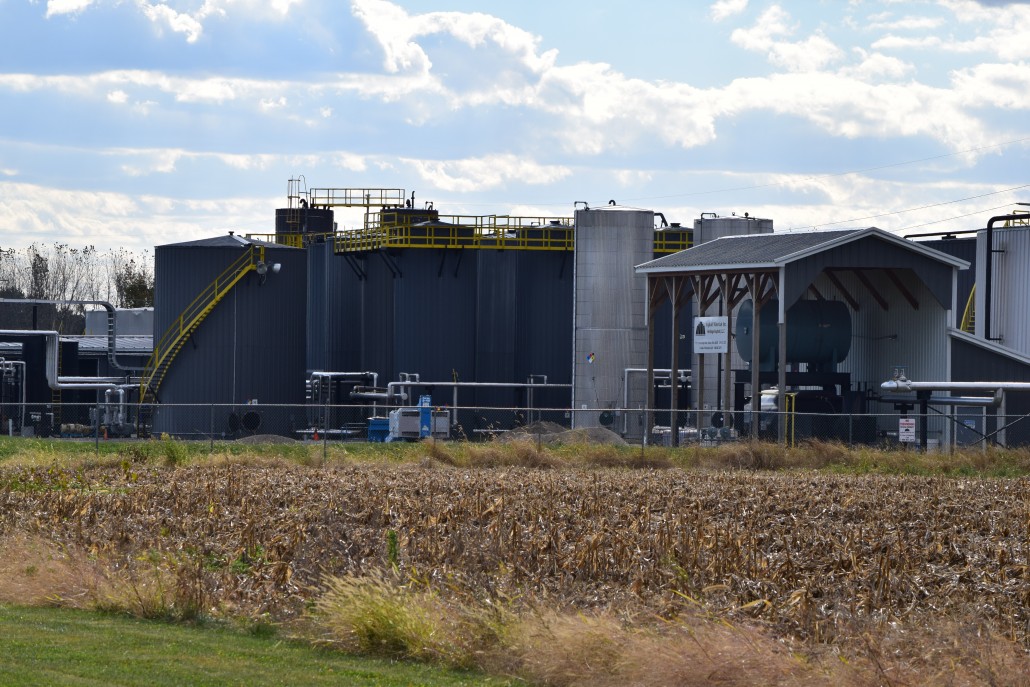
One of the many services that FracTracker offers is access to oil and gas photos. These have been contributed to our website by partners & FracTracker staff and can be used free of charge for non-commercial purposes. Please site the photographer if one is listed, however.
Over the last few months we have added additional oil and gas photos to the following location-based albums – and more photos and videos are coming soon! Click on the links below to explore:
If you would like to contribute photos or videos to this collection, please email us the files along with information on how to credit the photographer to: info@fractracker.org.
By Samantha Malone, Manager of Education, Communications & Partnerships, FracTracker Alliance
North Dakota sure is popular recently. You might wonder why ND’s oil and gas development has been such a hot topic when the average monthly temperature there in November is only 27° F. Below we summarize the recent ND coverage and why the state has been the focus of several conversations lately.
The Intensity of Drilling
On November 22nd The New York Times launched a two-part series starting with The Downside of the Boom. Herein, the NY Times highlights how North Dakota’s regulatory system is insufficient to manage a hefty oil and gas industry. Part two in the series looks into Where Oil and Politics Mix in ND. This investigative journalism series questioned how well the state is managing oil and gas development, which was followed quickly by criticism of the series by state officials. If you haven’t checked out this series and its incredible visuals yet, I would highly recommend it.
FracTracker maintains a shale viewer map of North Dakota and its horizontal oil wells if you would like to explore where the industry is operating. Interestingly, ND is one of the few states where the horizontally drilled well data is available to the public. (Horizontal wells jut out from the vertical wells below ground.) Our interactive map of ND includes zooming features, well API information, and a measurement tool to examine horizontal well lengths. The screenshot below shows that one of the laterals on this map extends out two miles underground. Click the map to explore more:
Interactive Map of ND Wells on FracTracker, with Measurement Tool
Alternatively, here the New York Times shows what ND would look like if all of the state’s oil wells were aboveground:
NYTimes Graphic: What North Dakota Would Look Like if Its Oil Drilling Lines Were Aboveground
NPCA
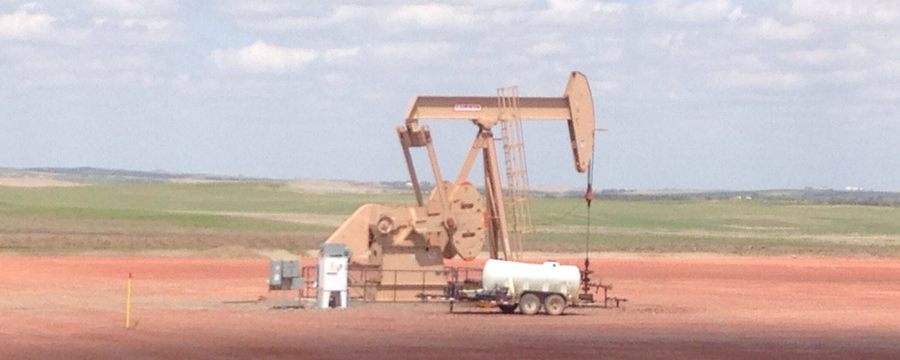
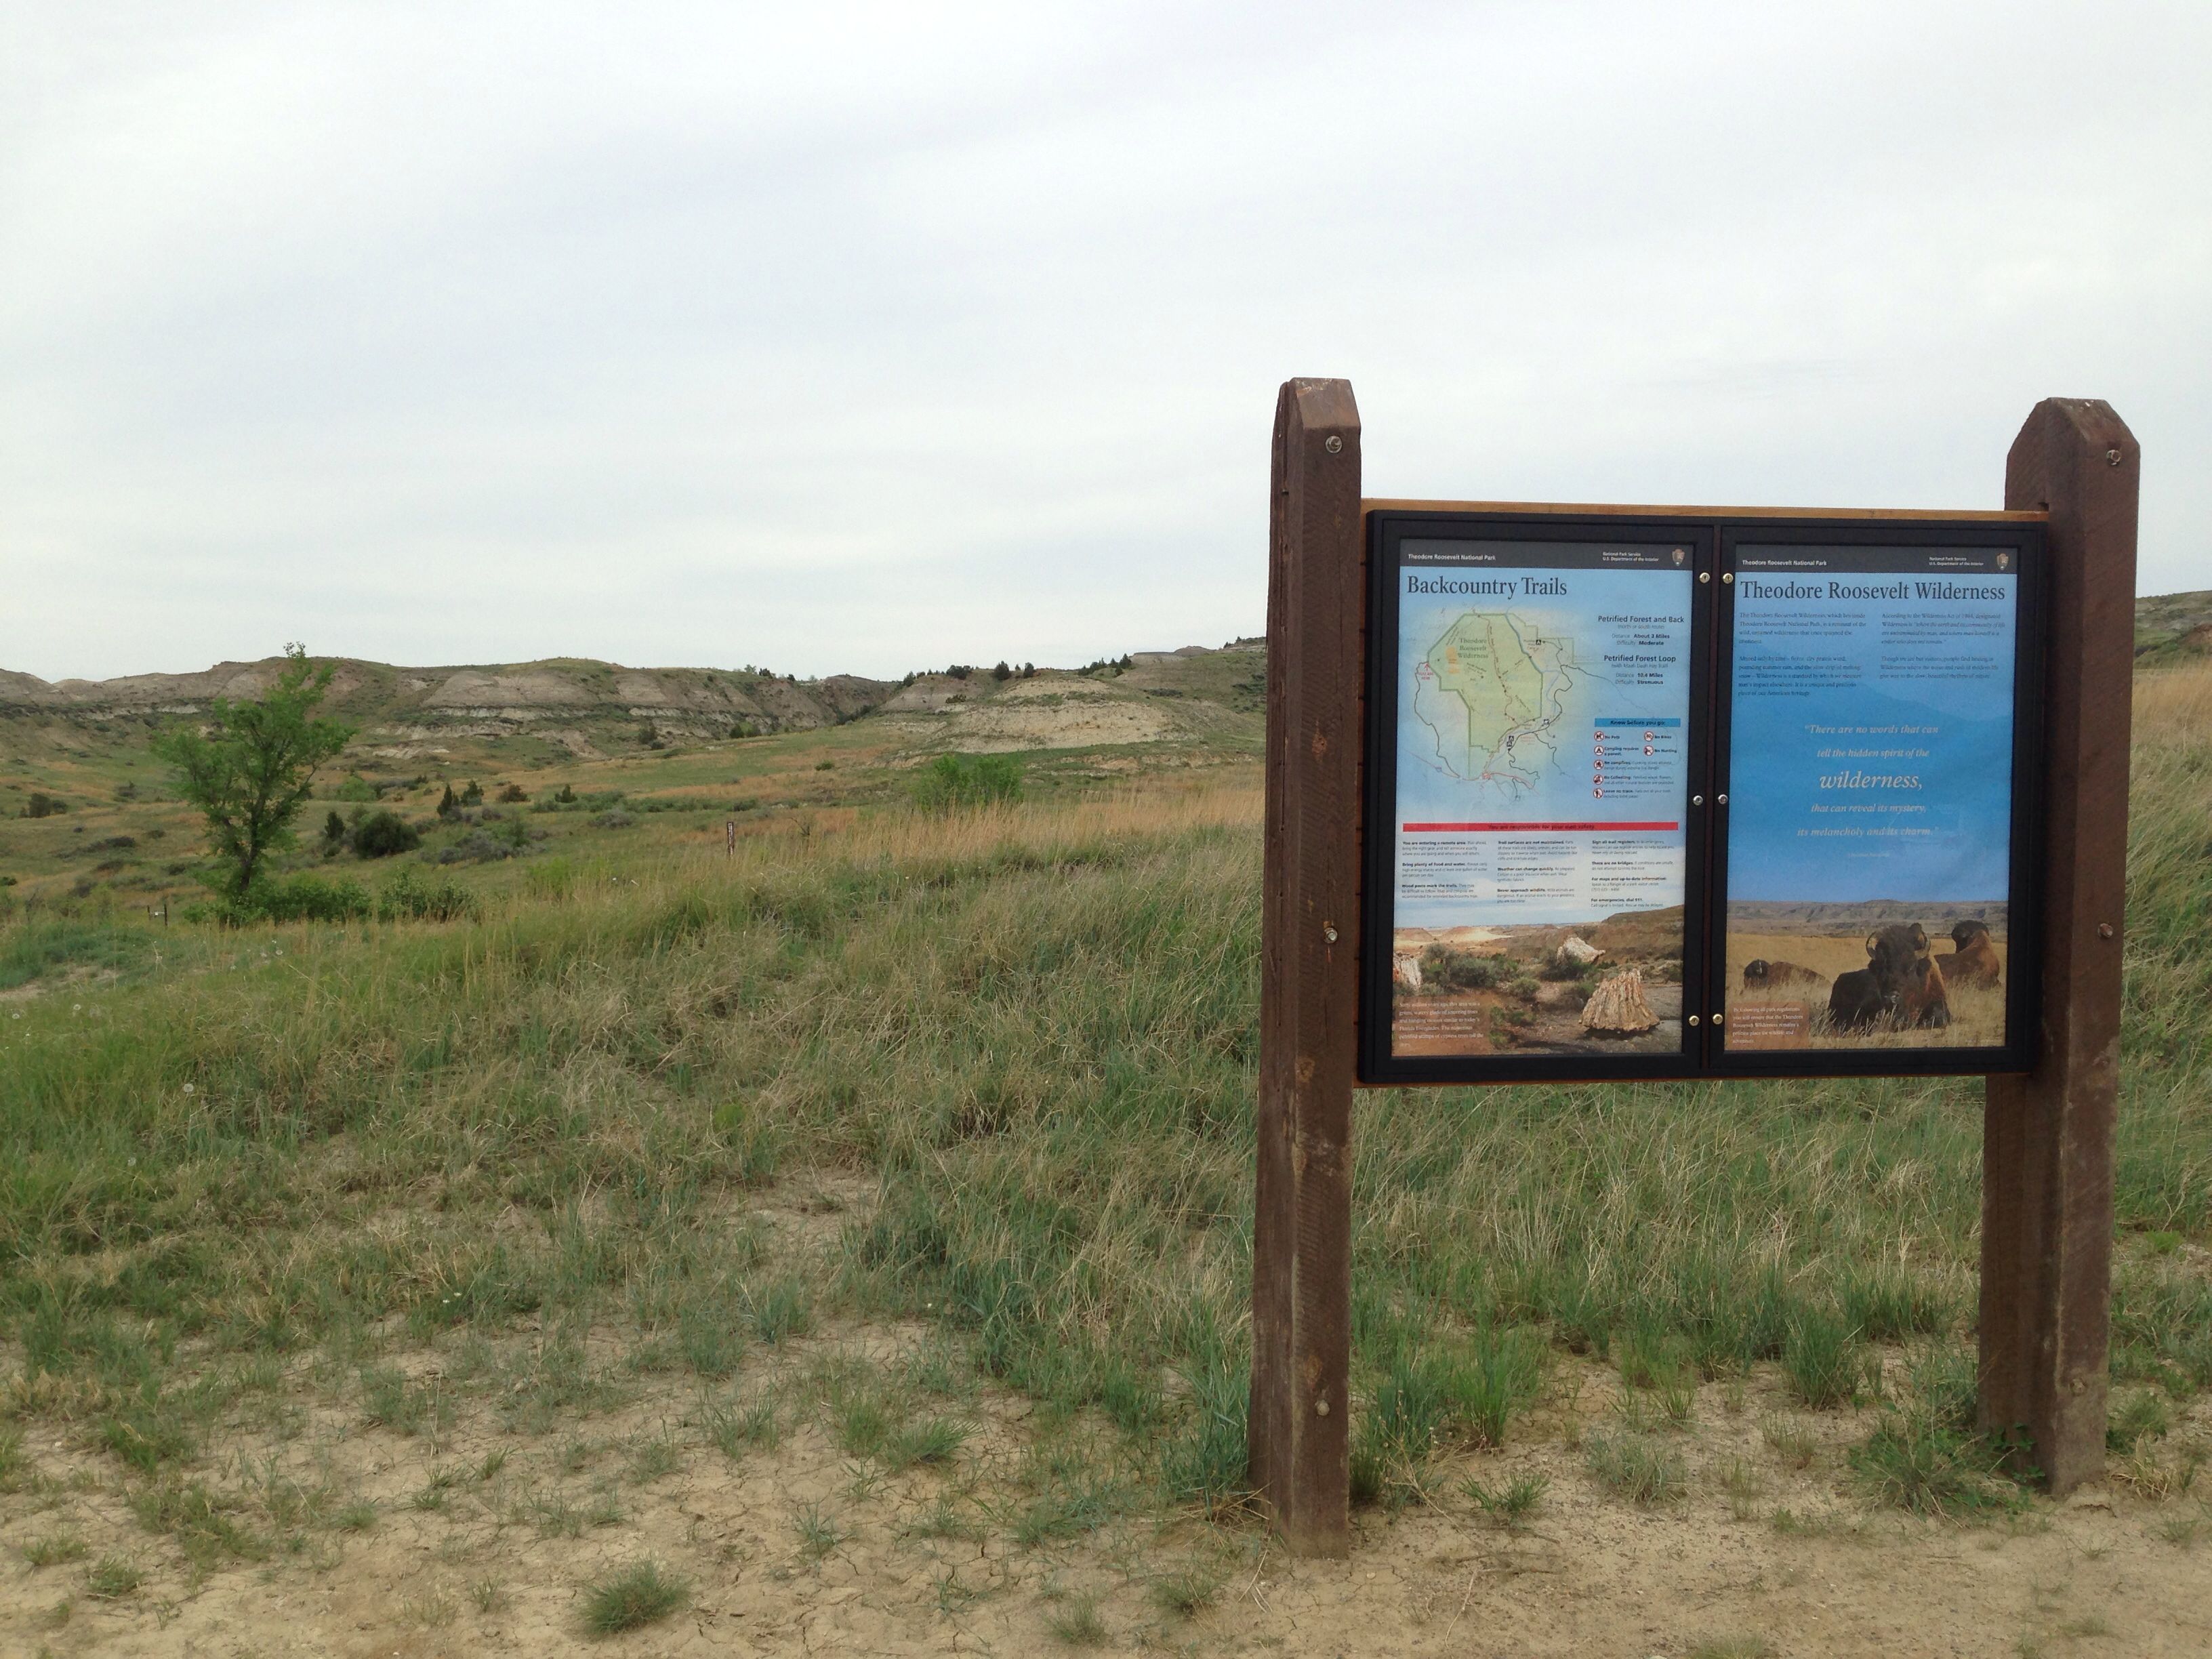
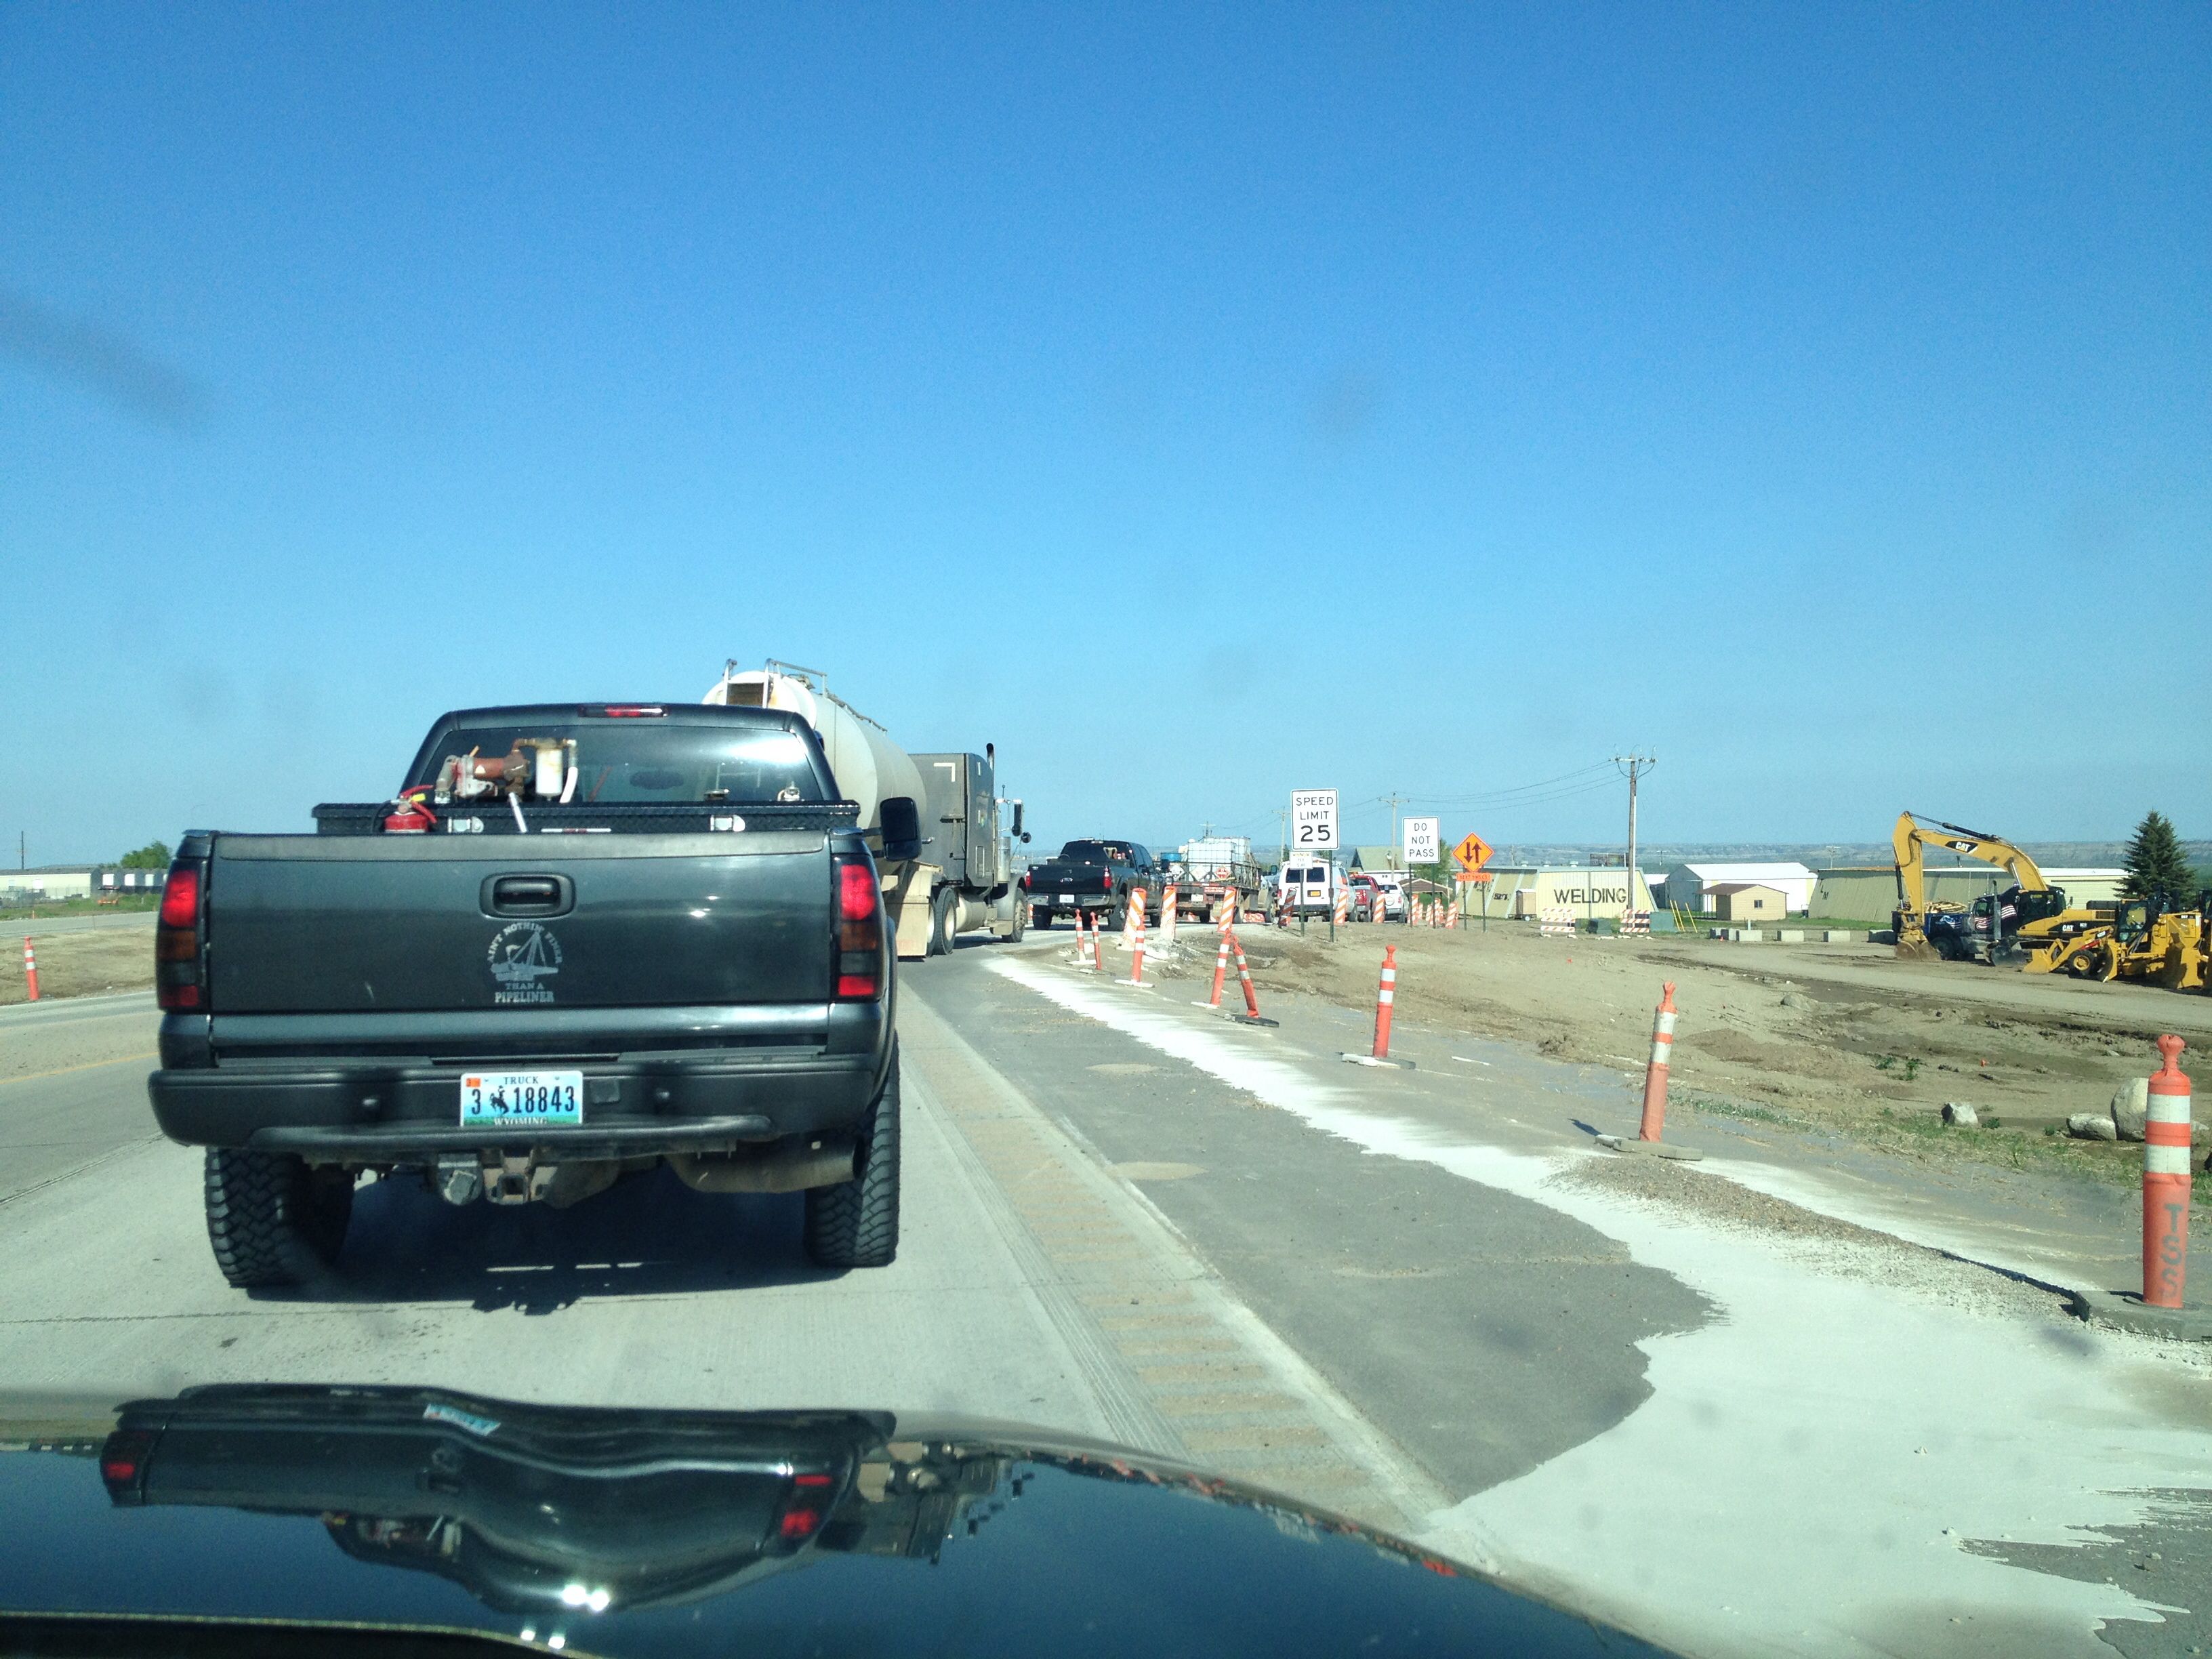
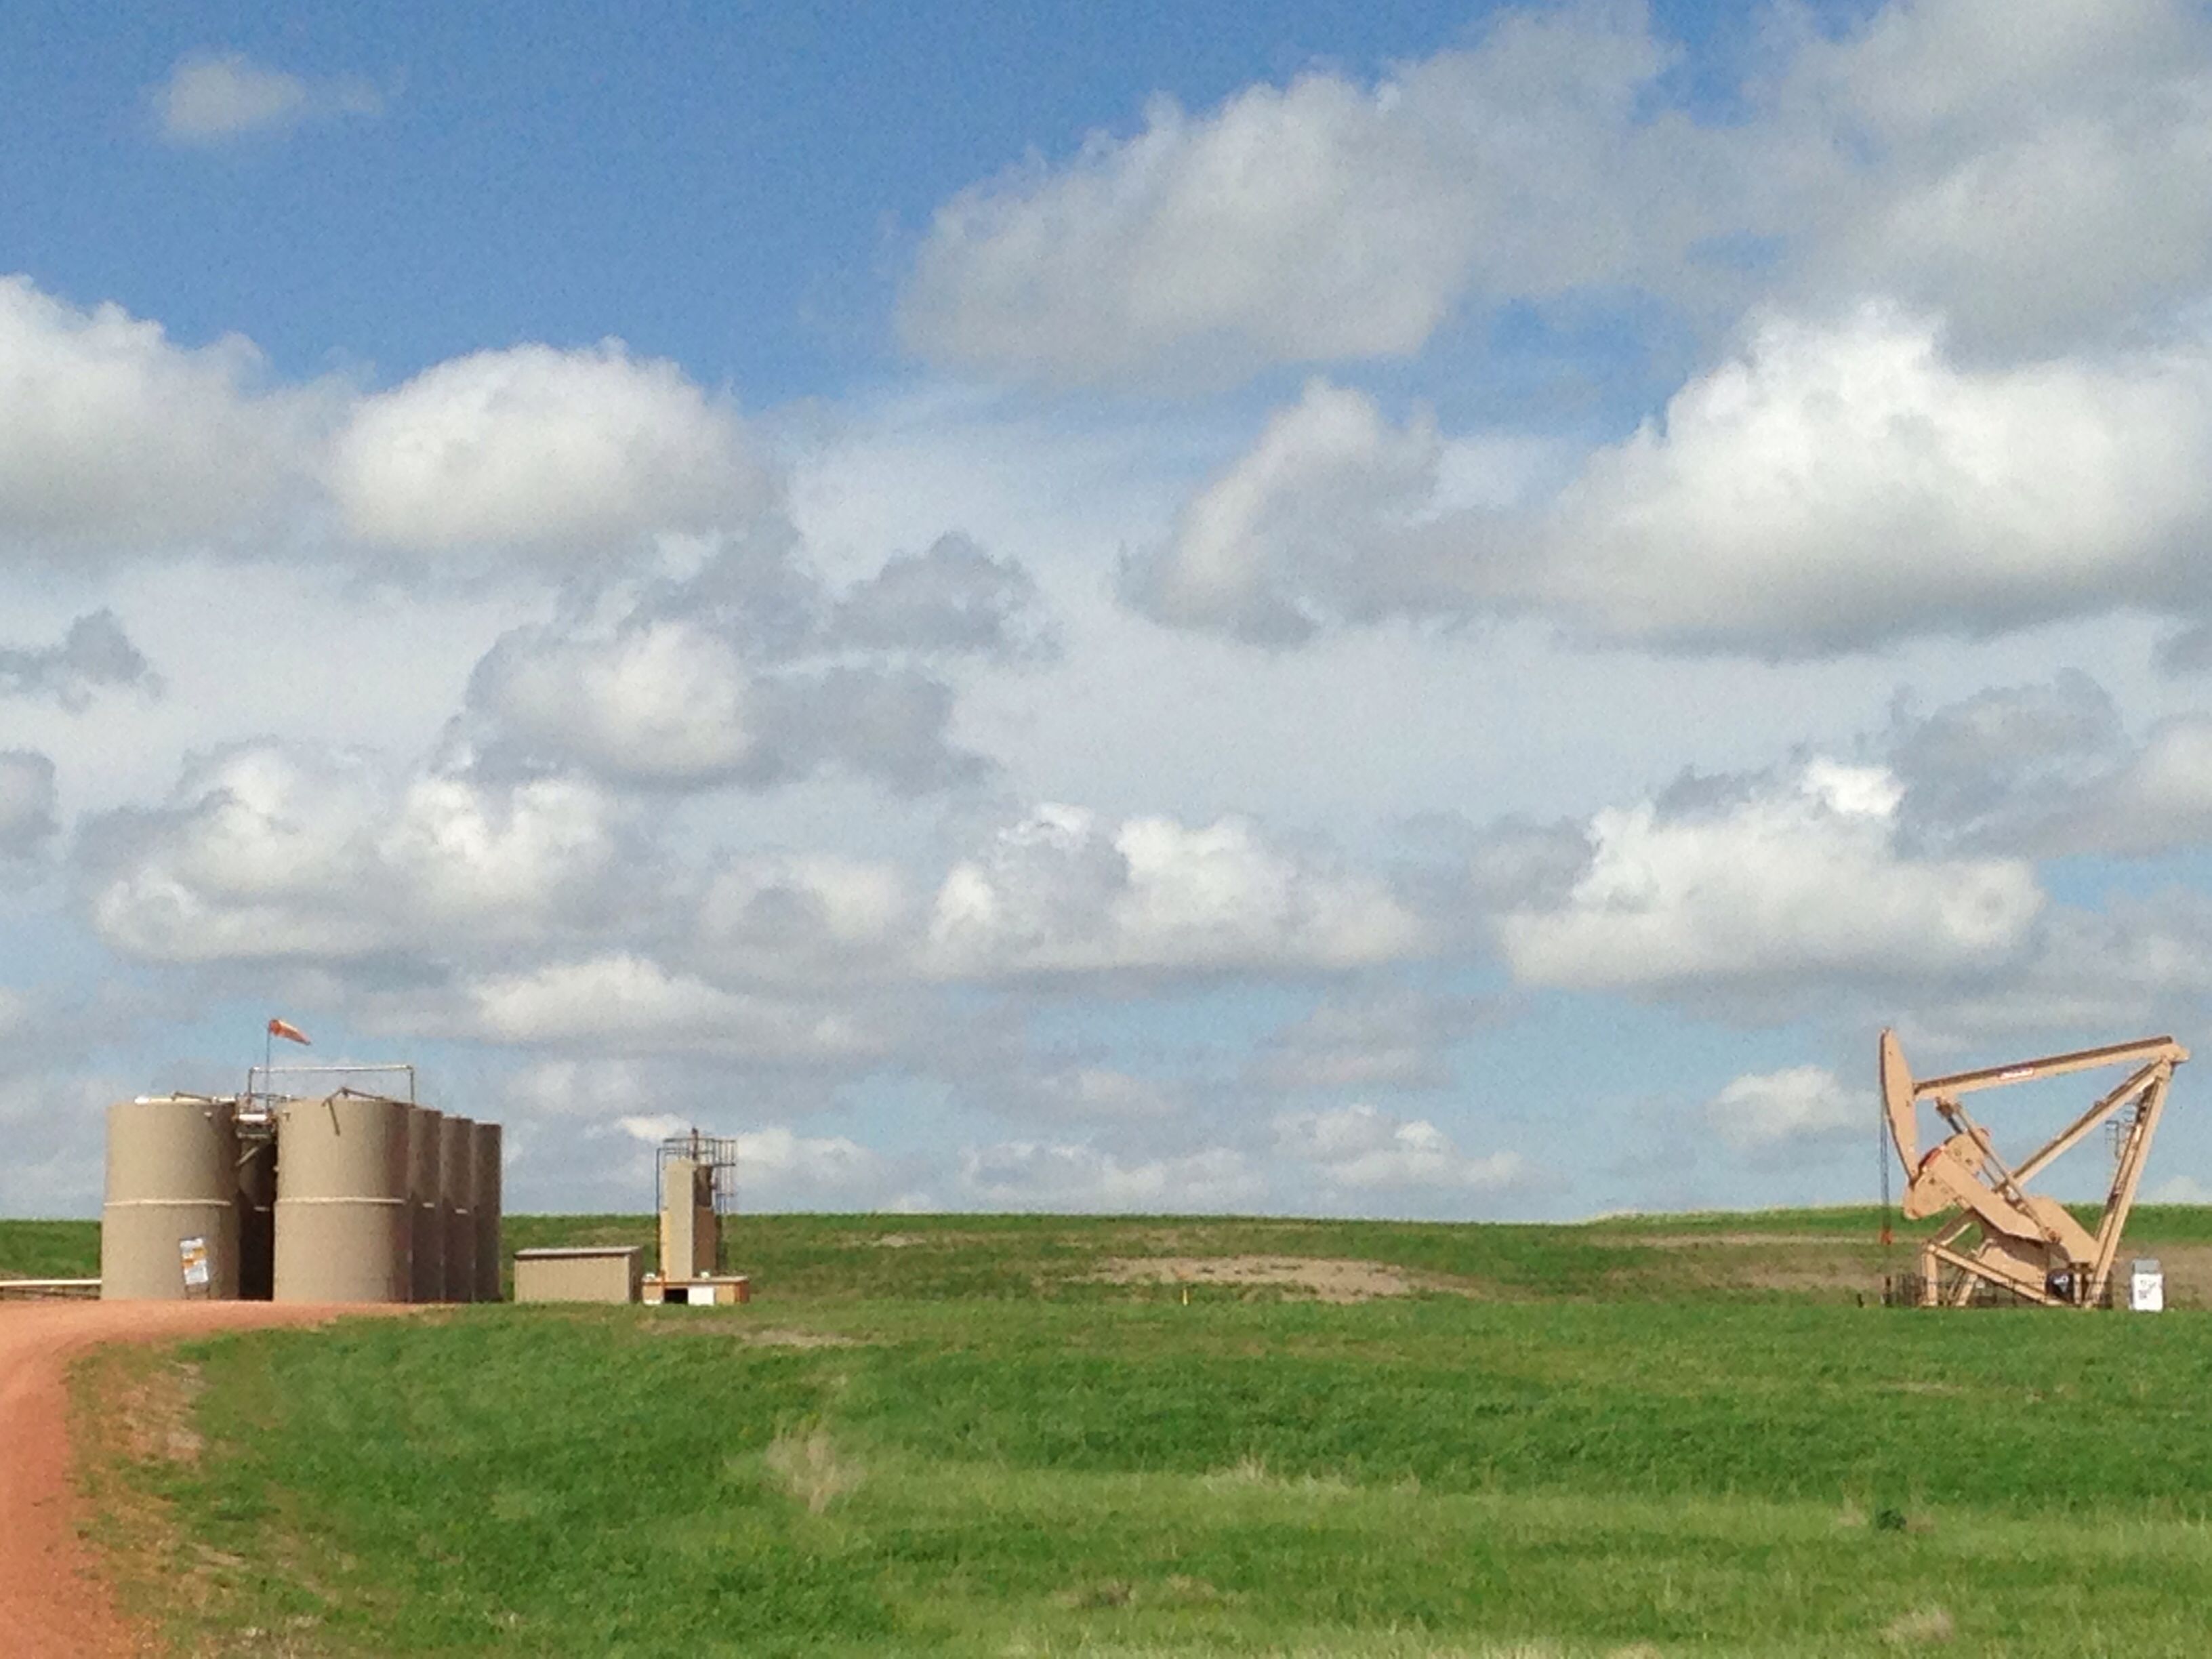
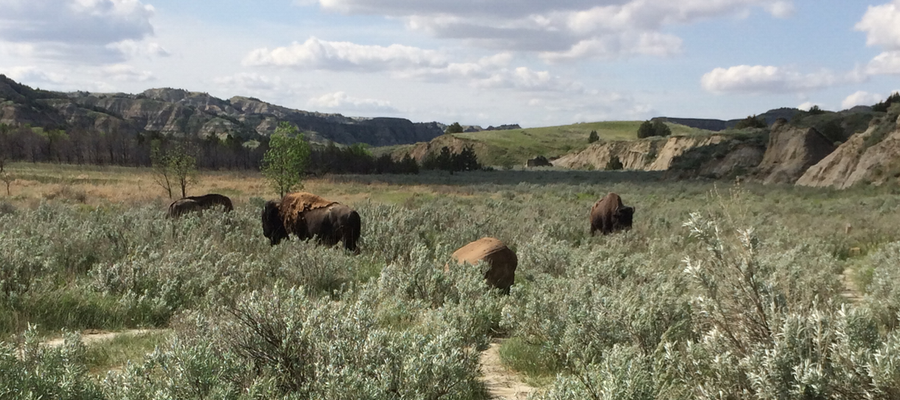
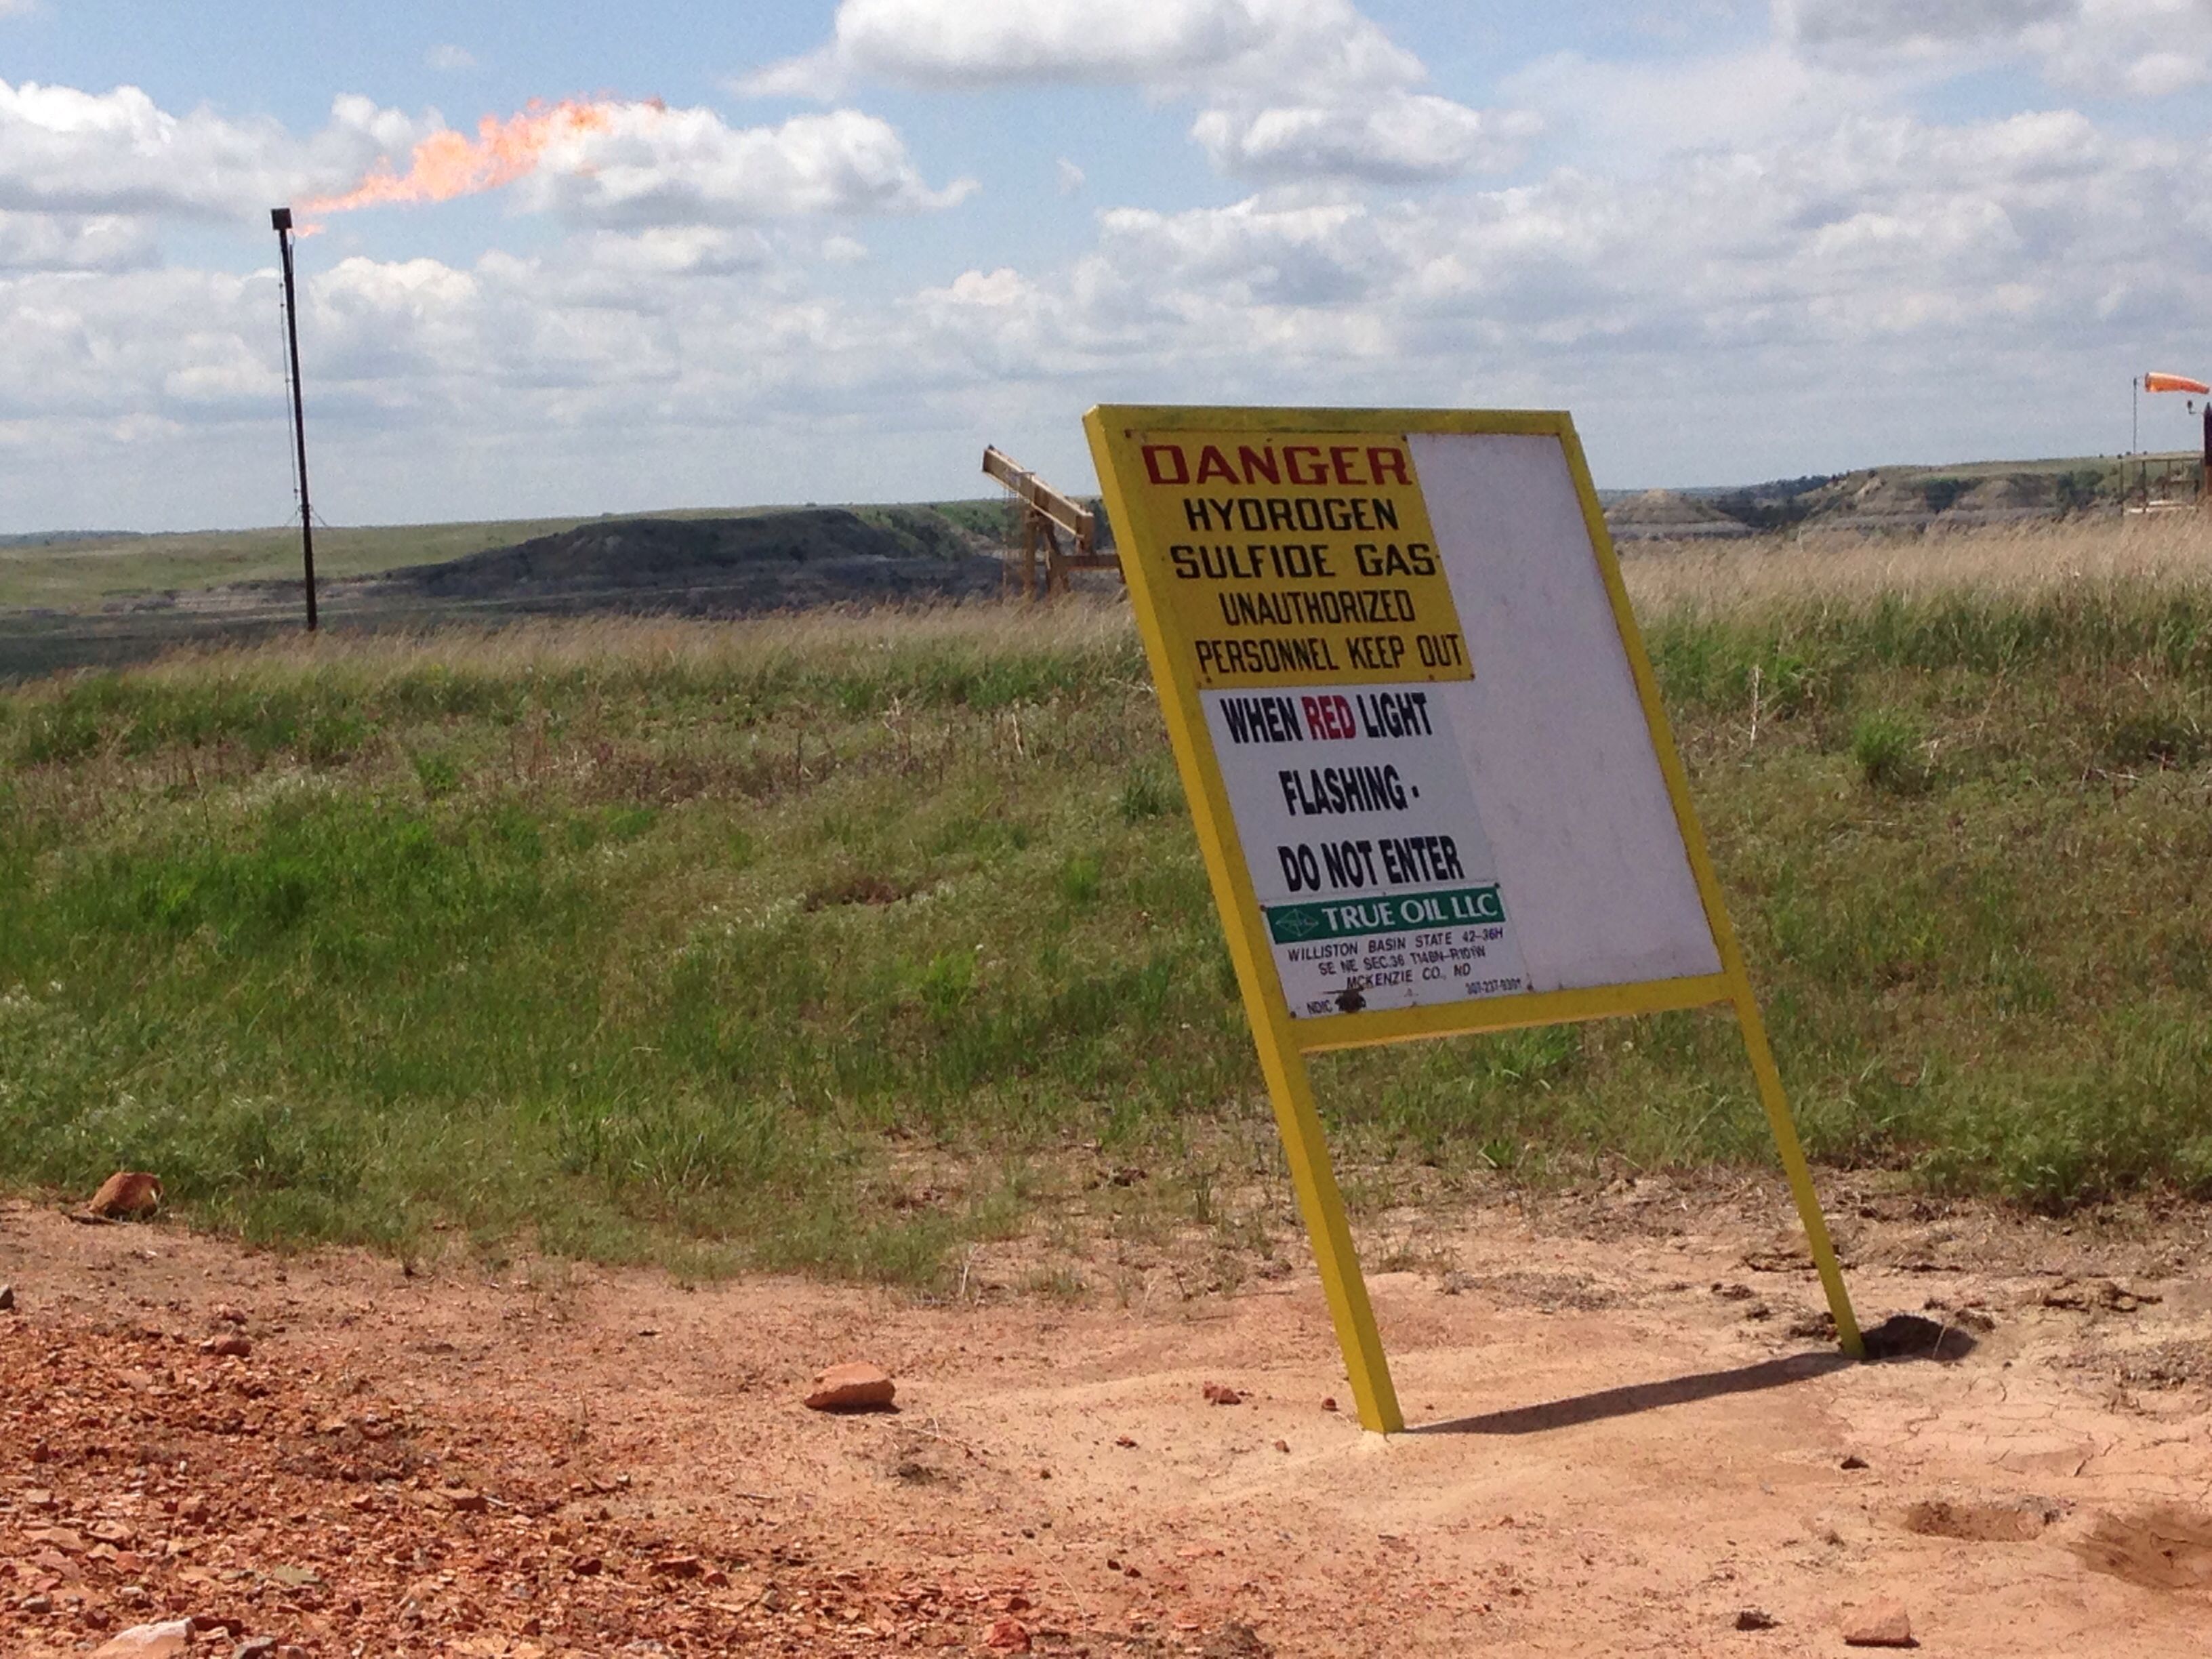
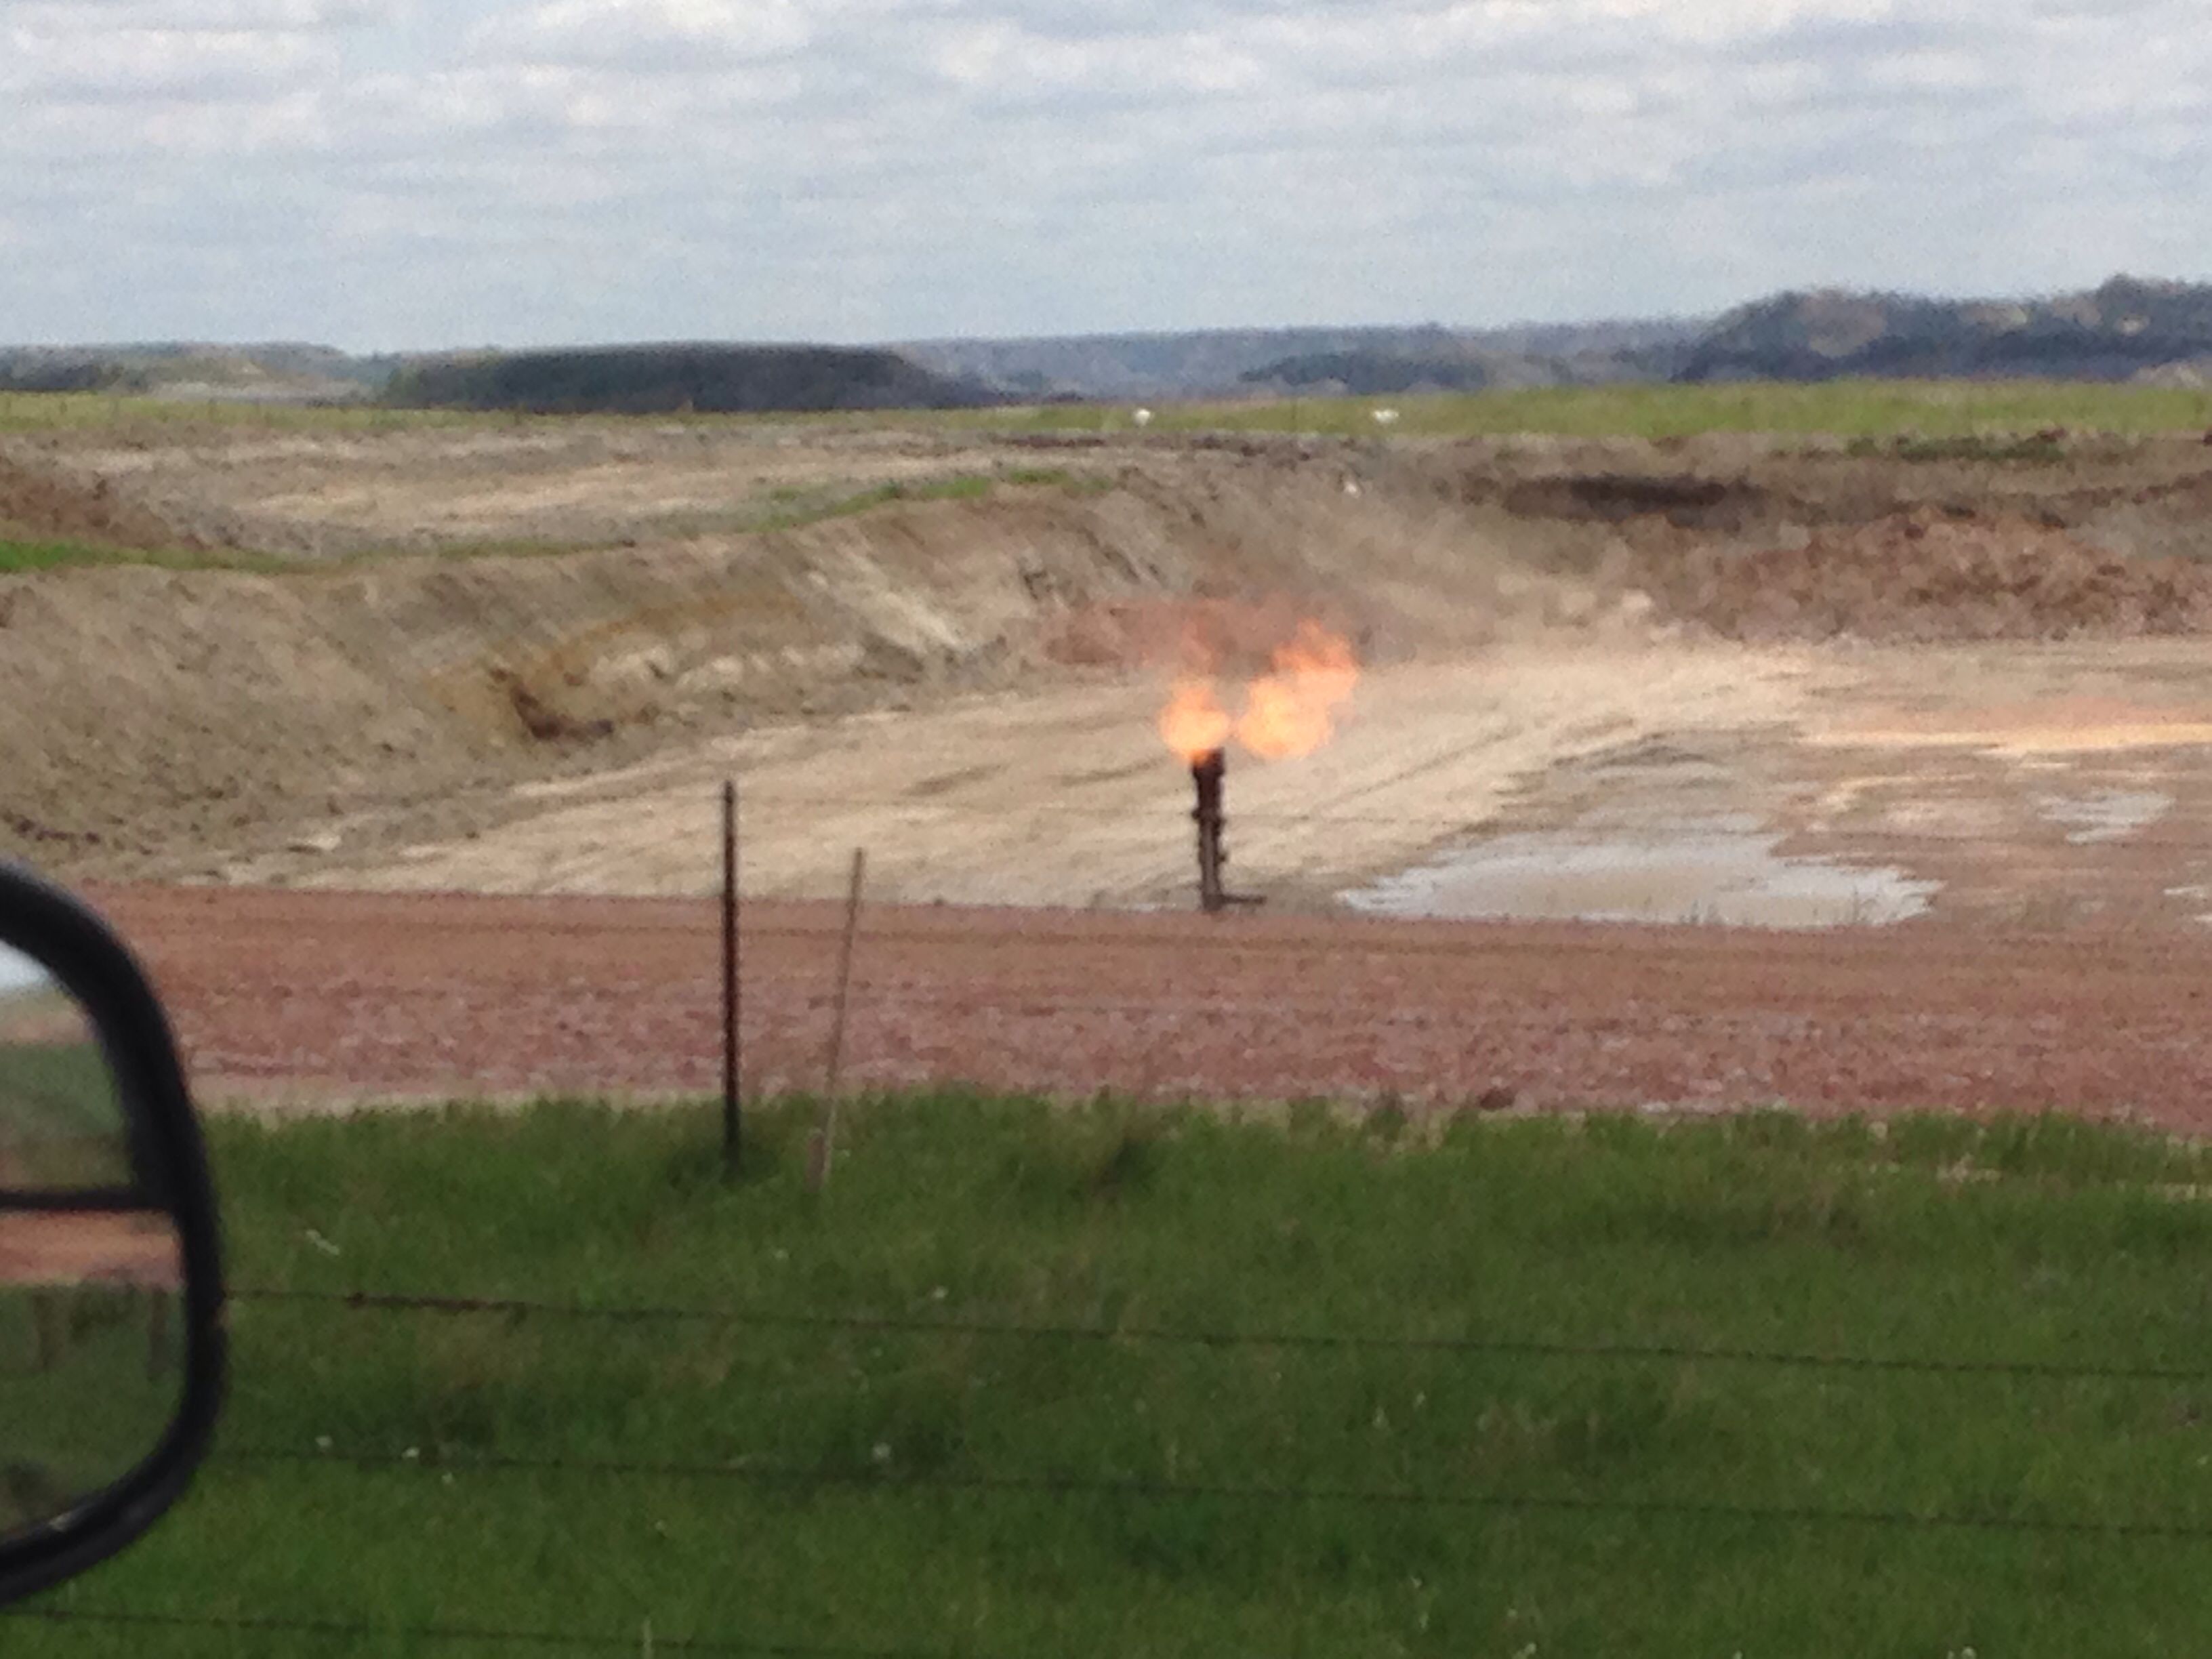
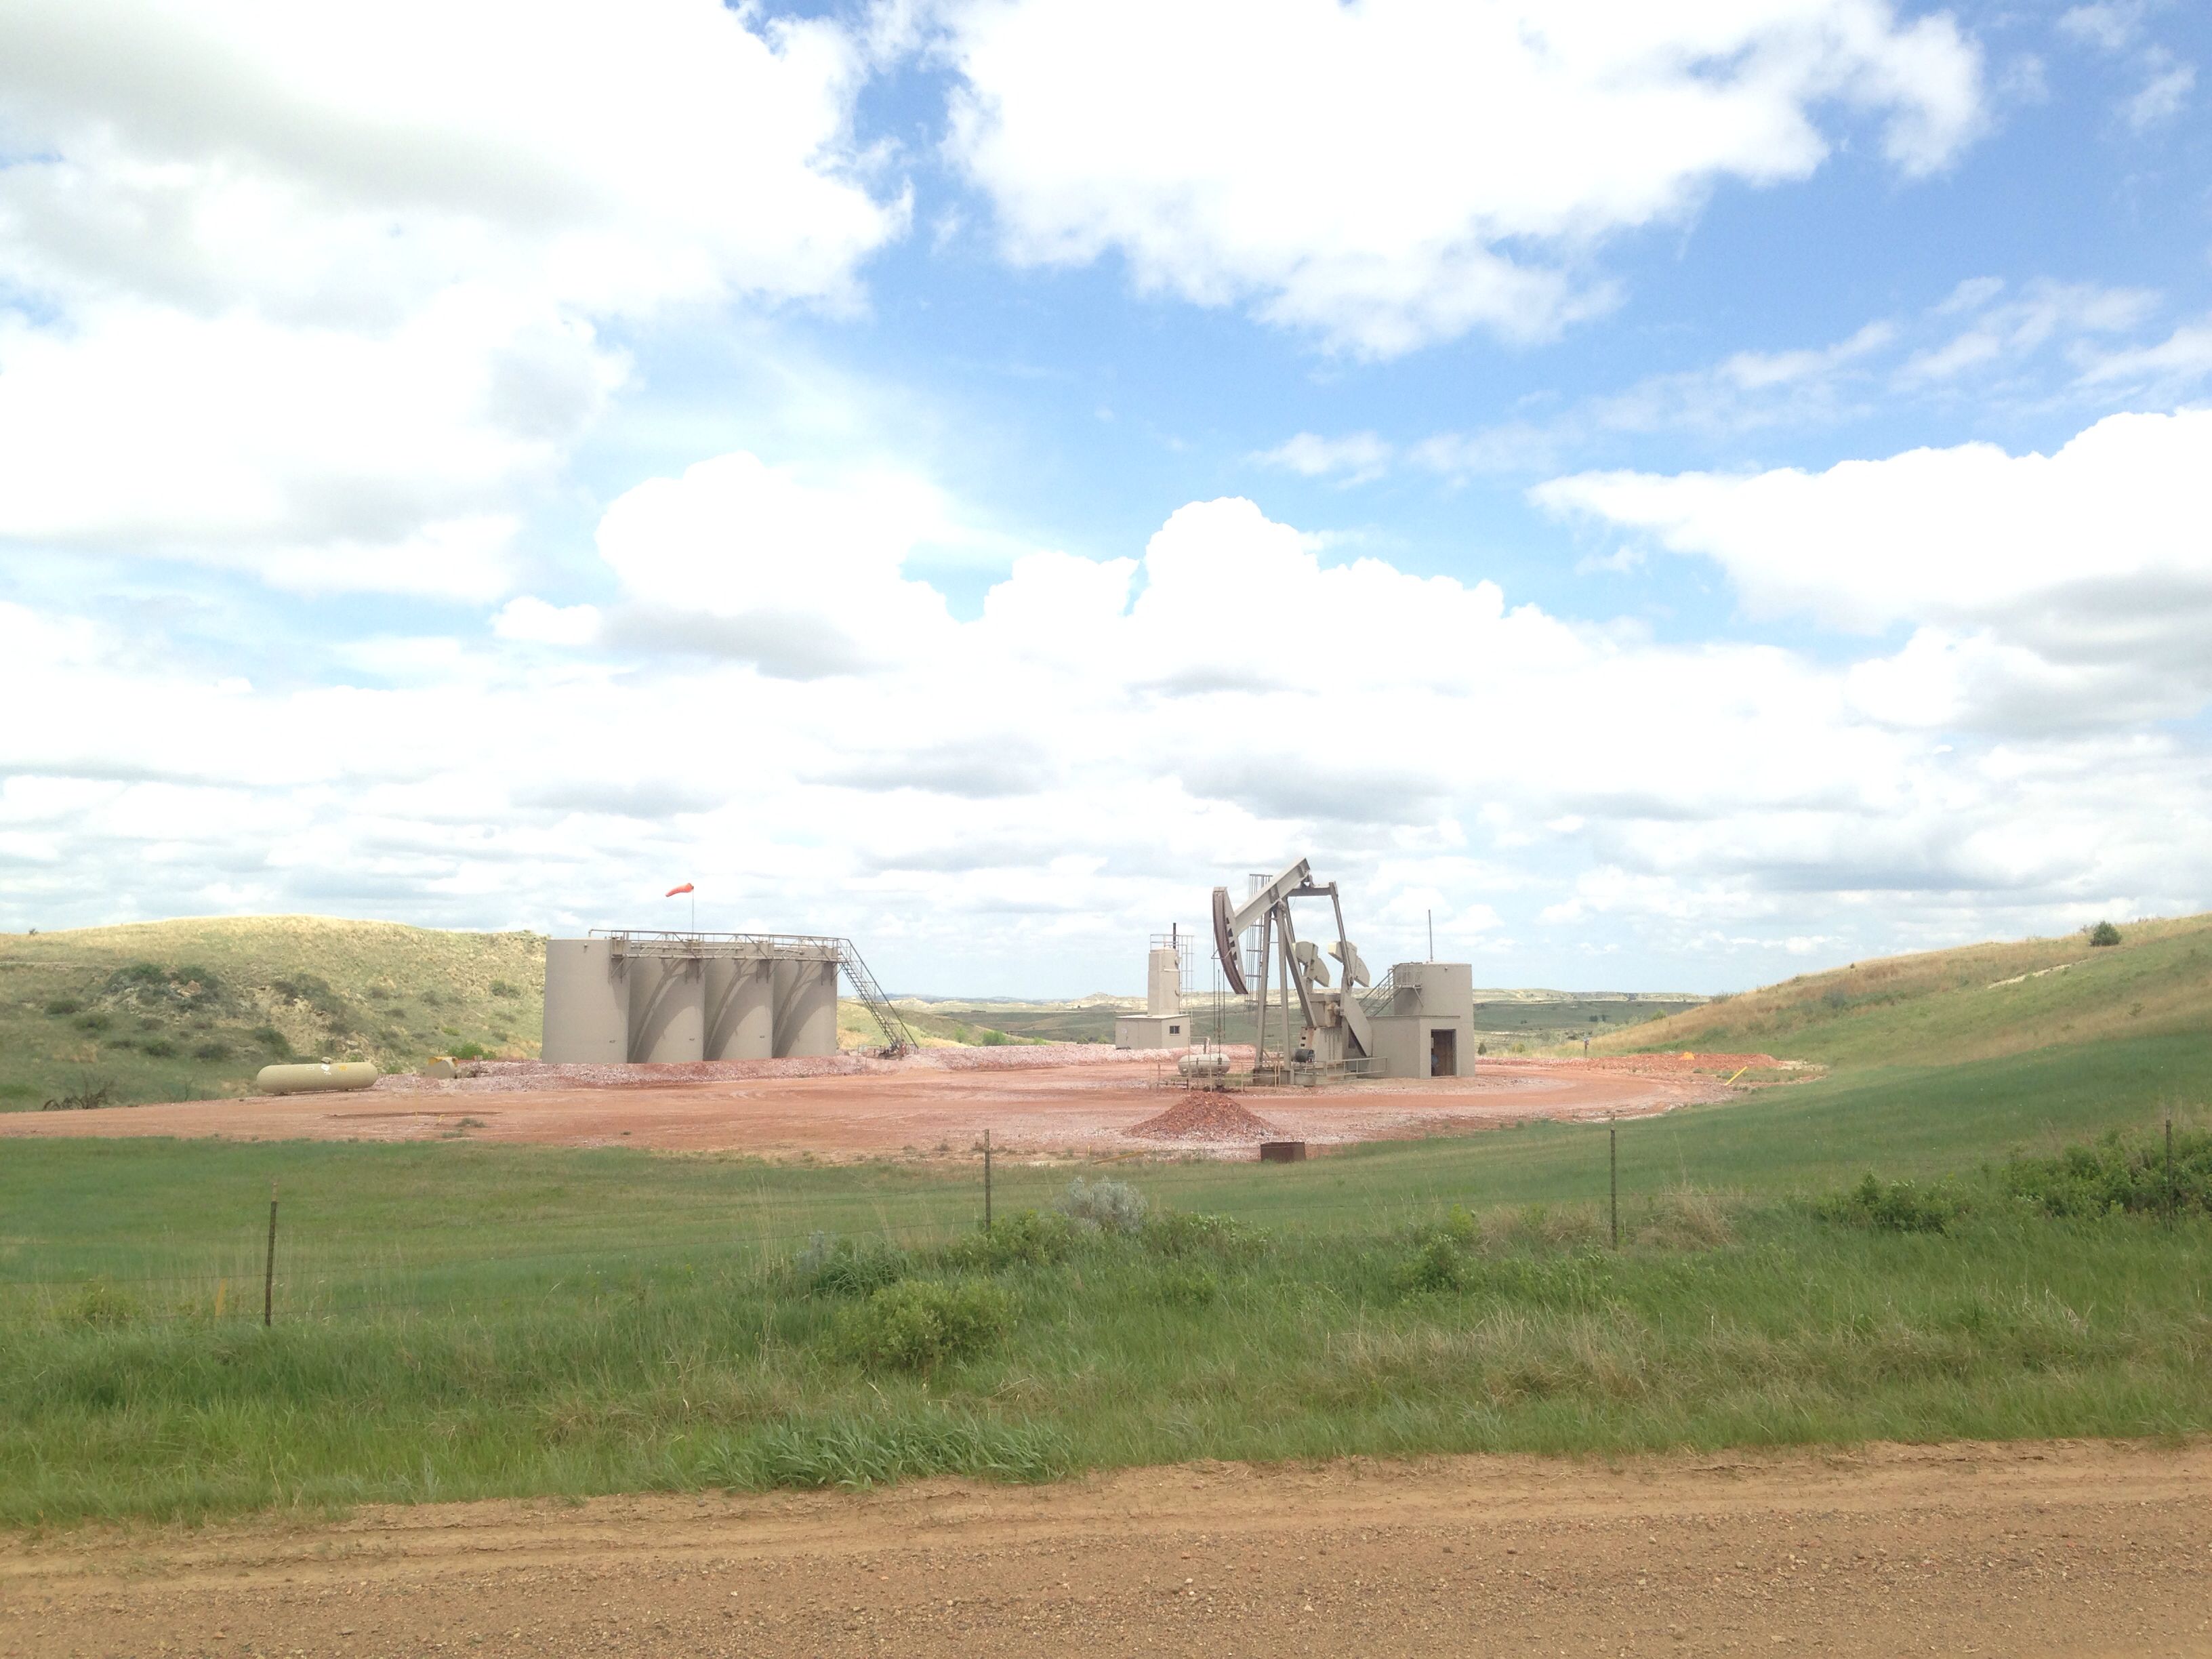
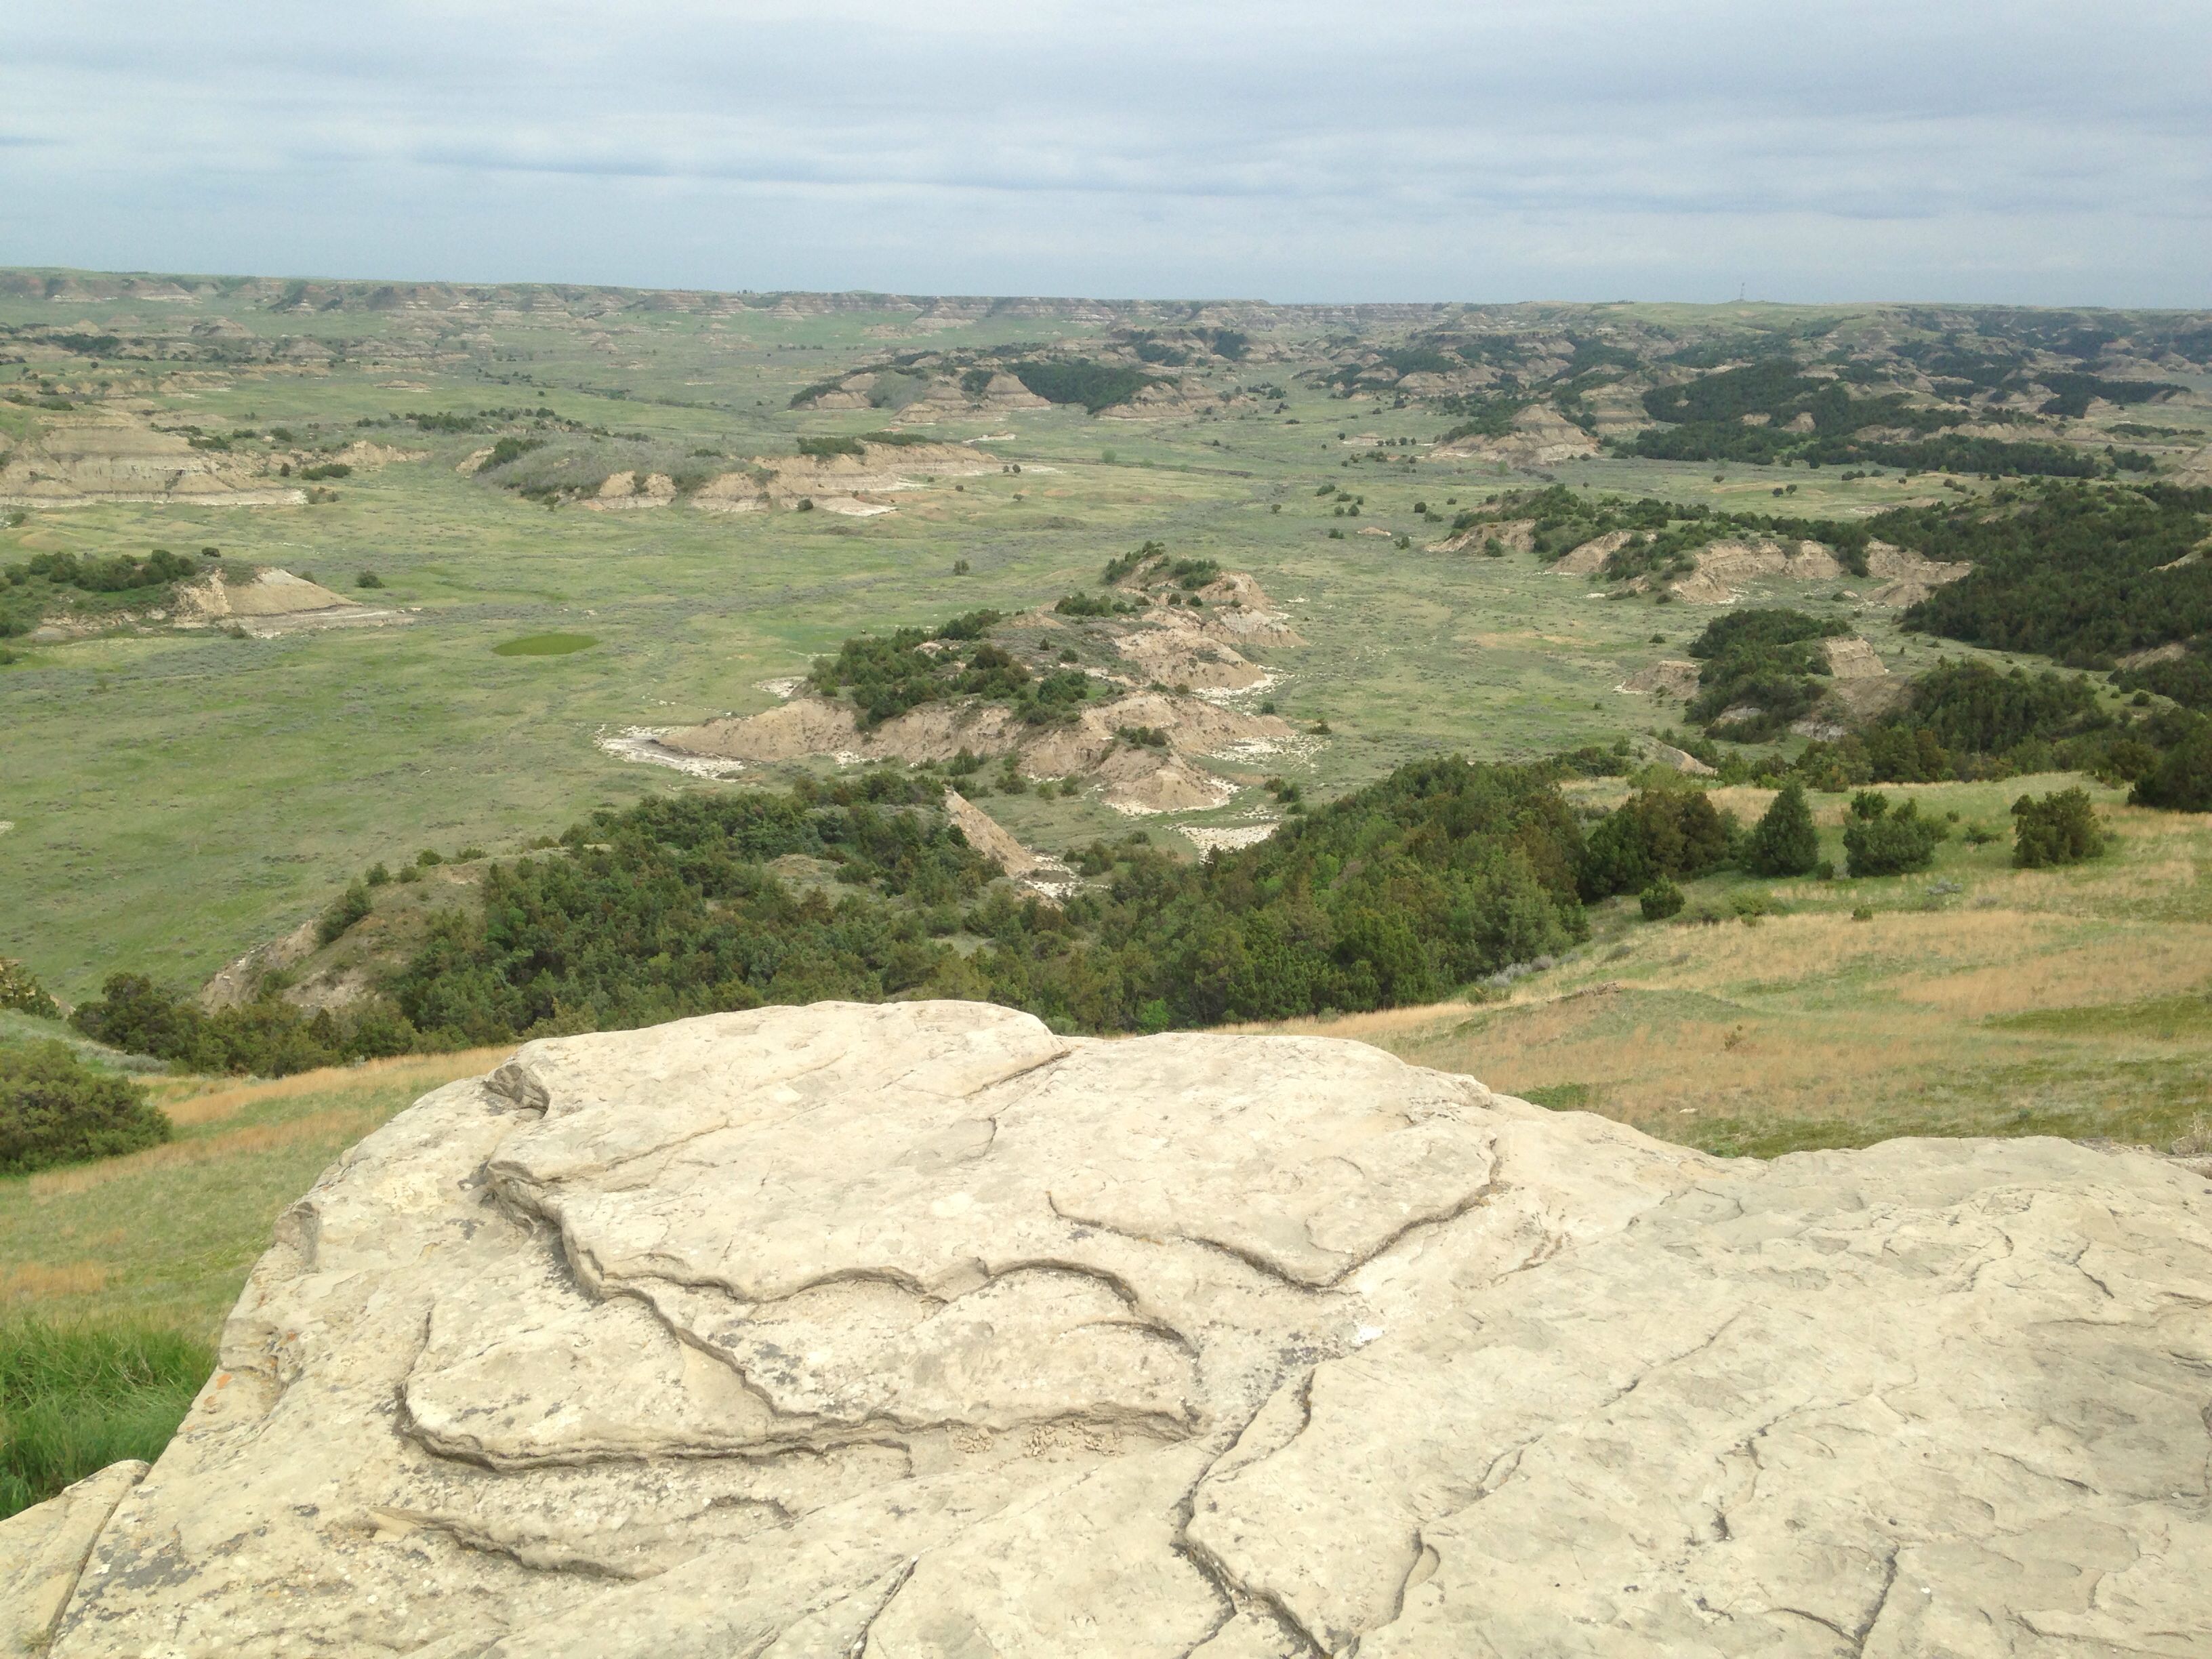
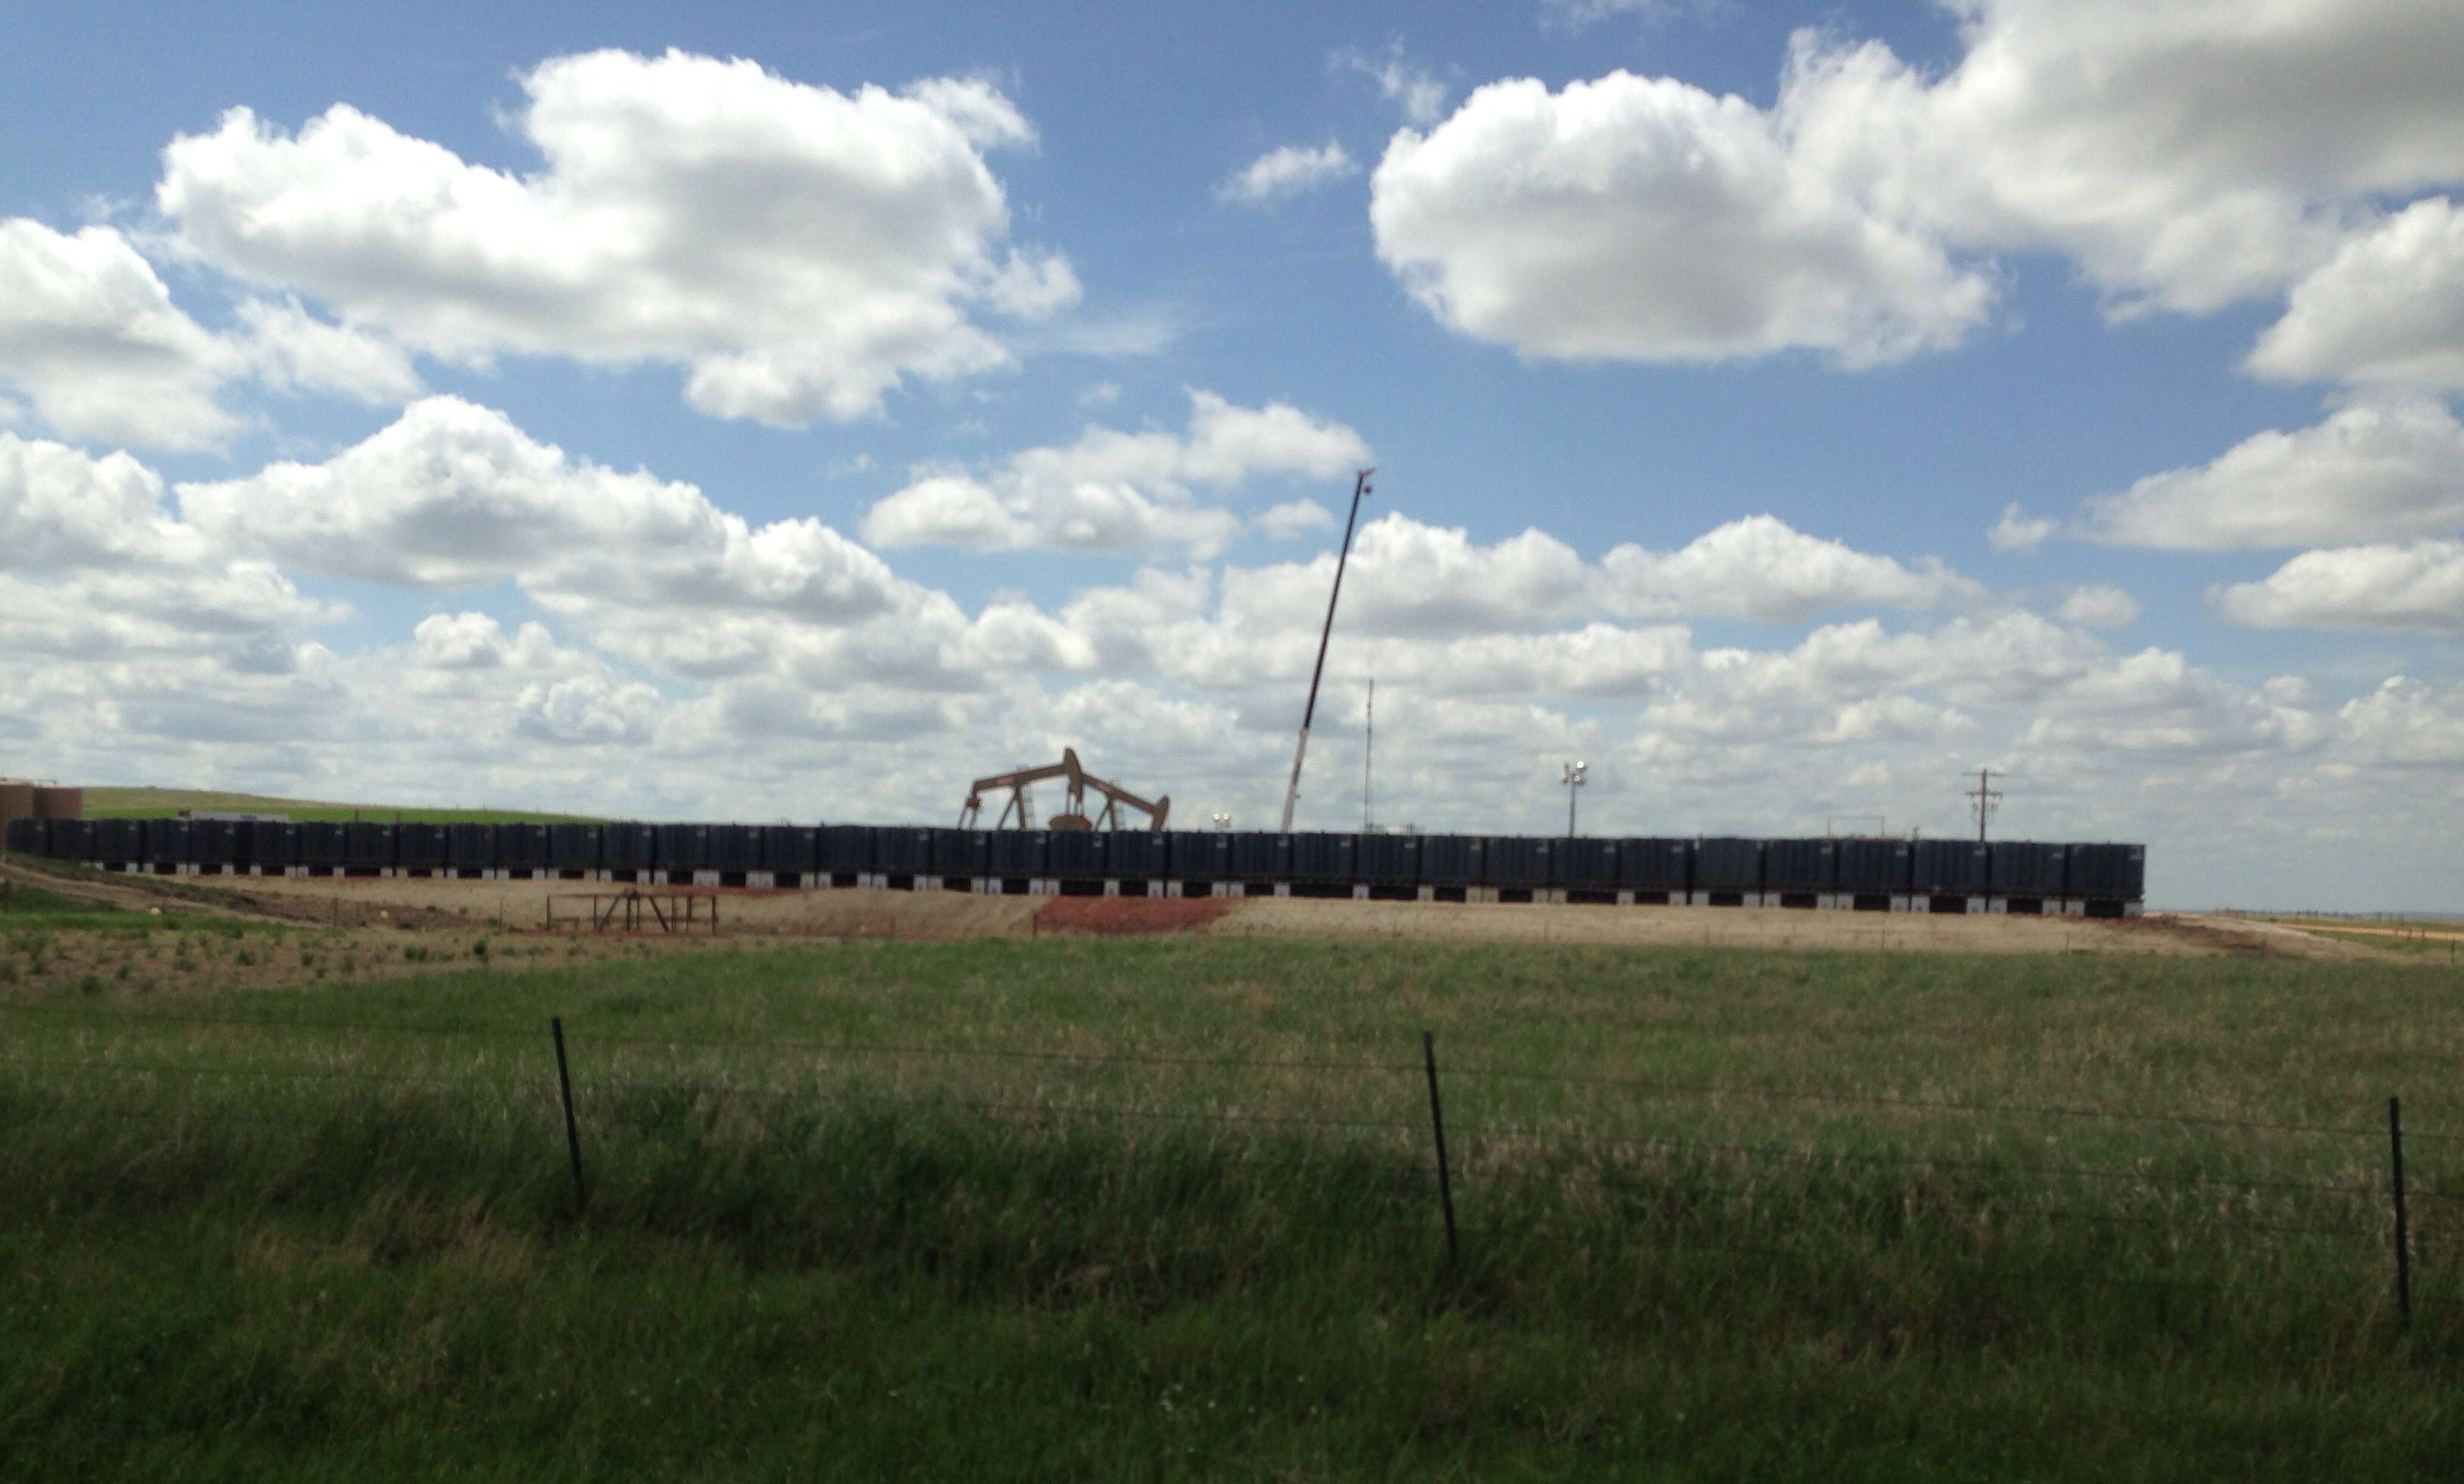
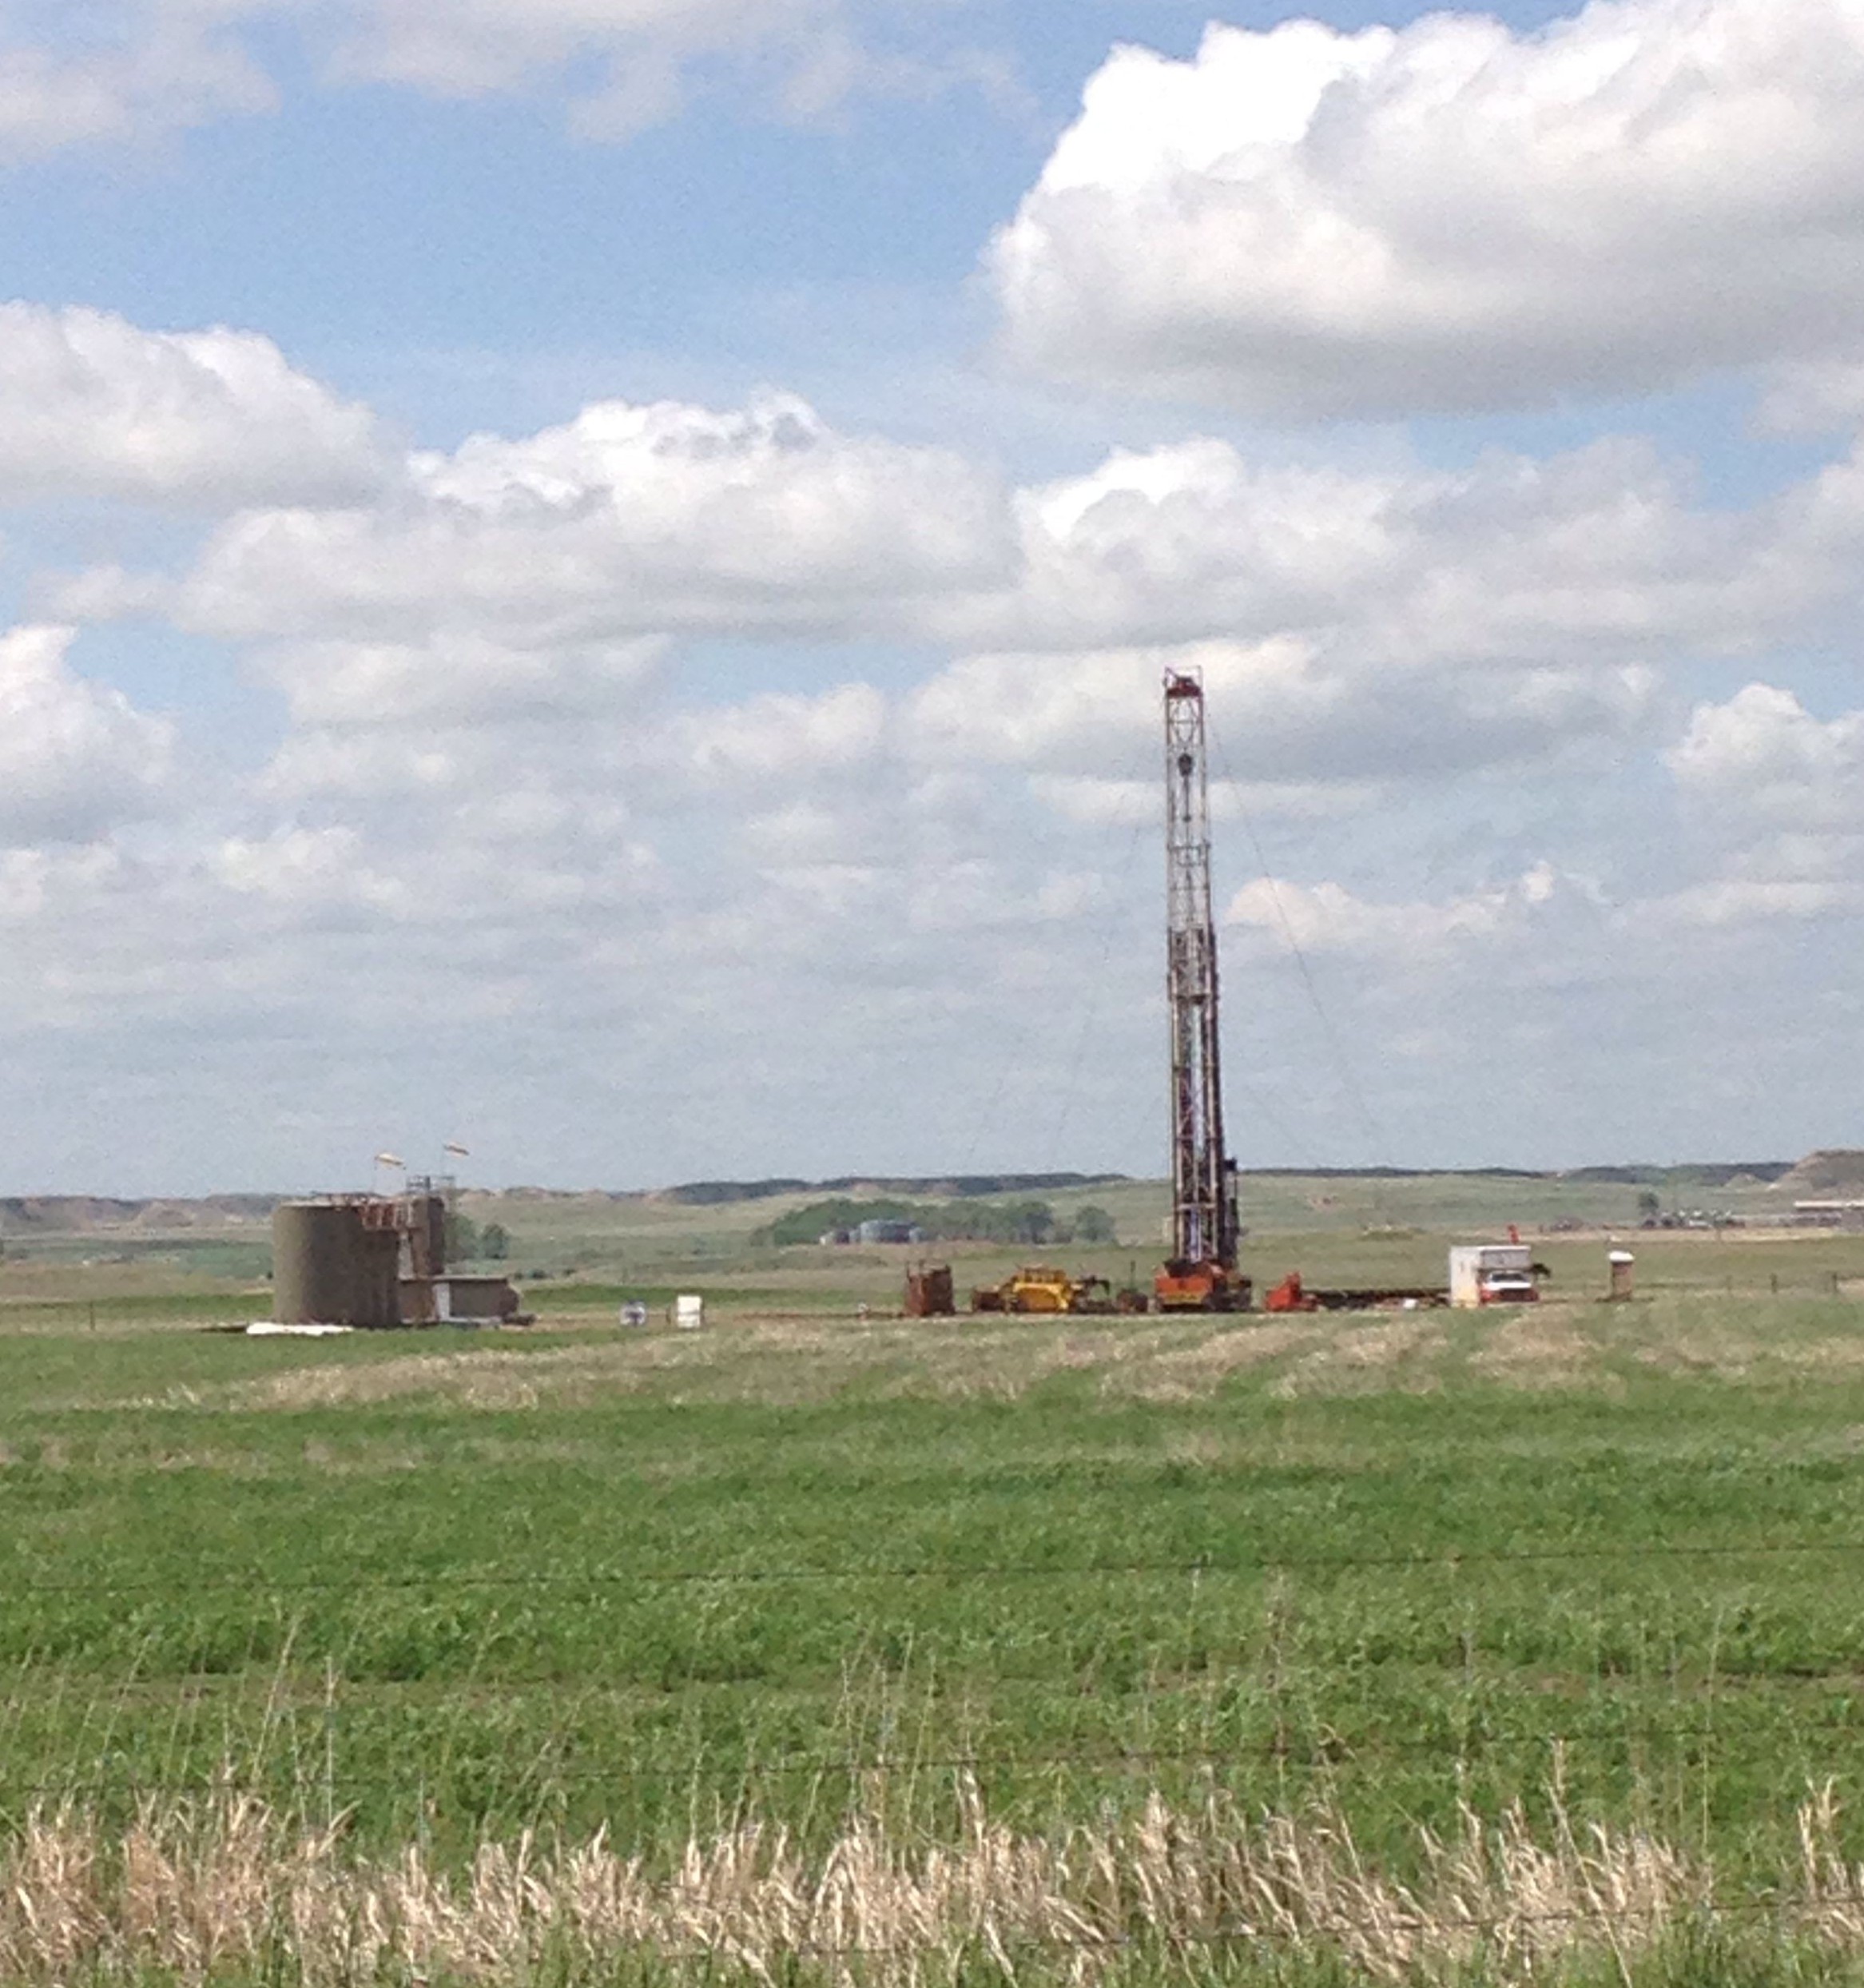
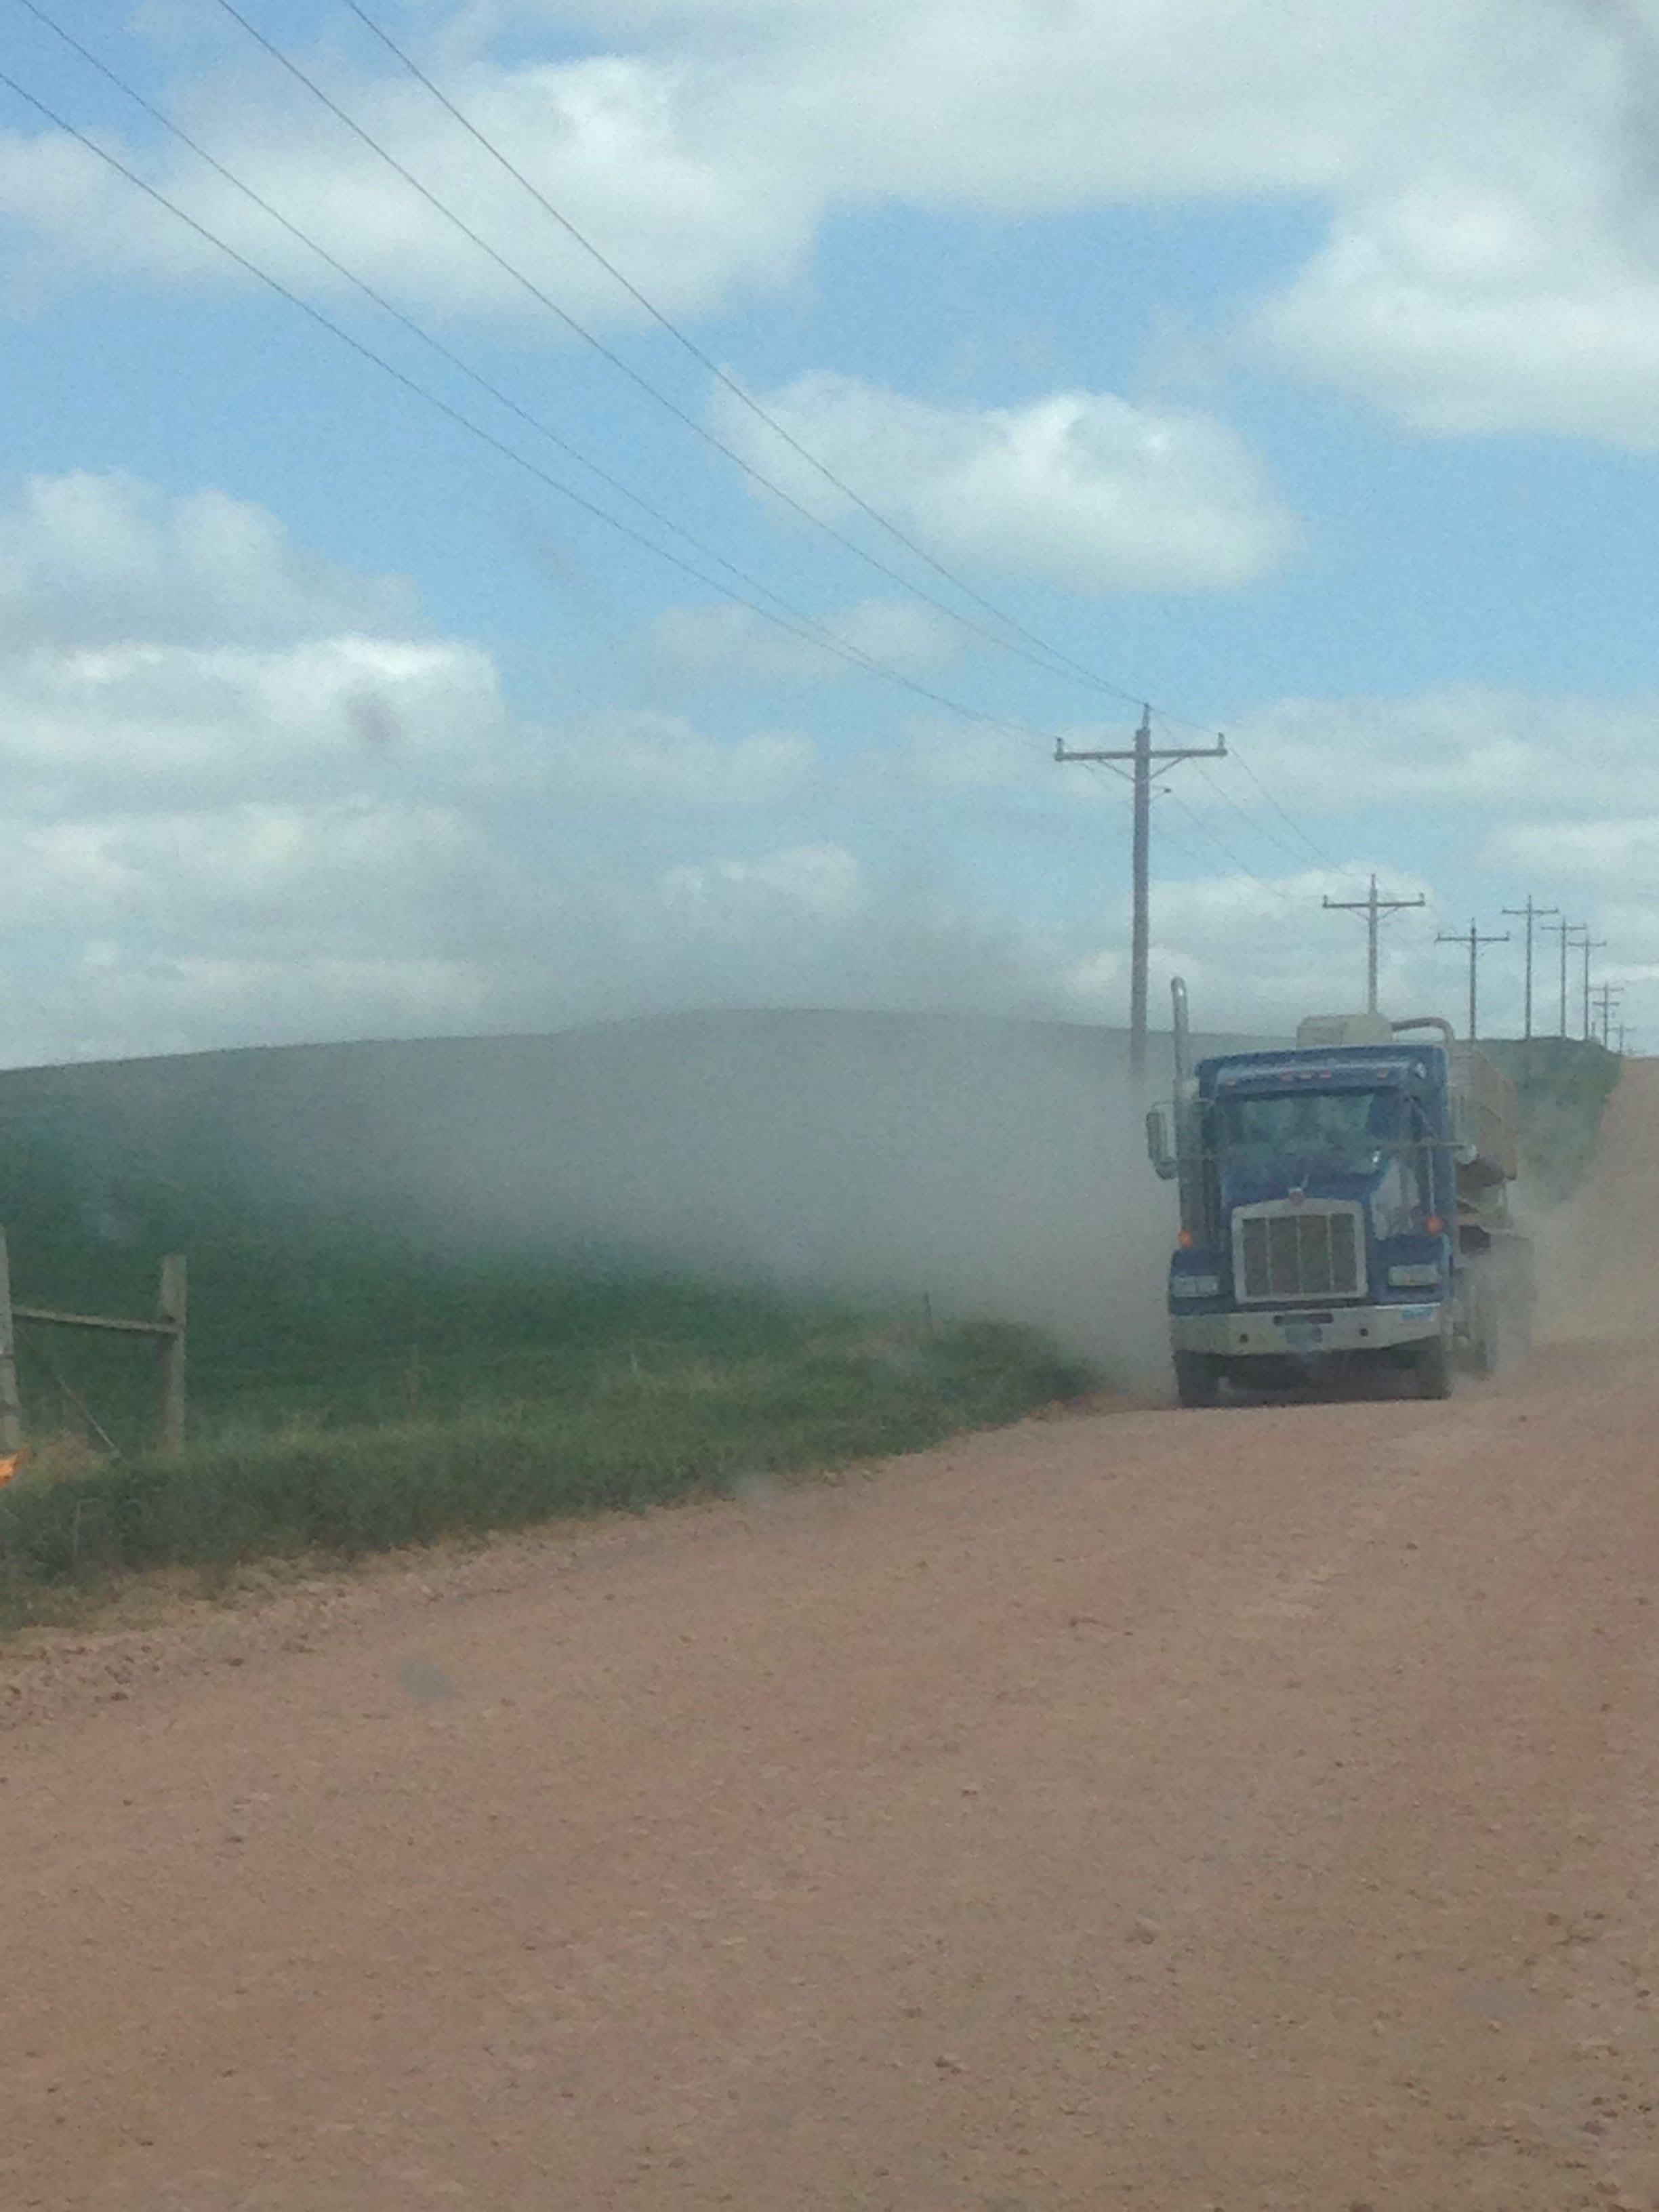
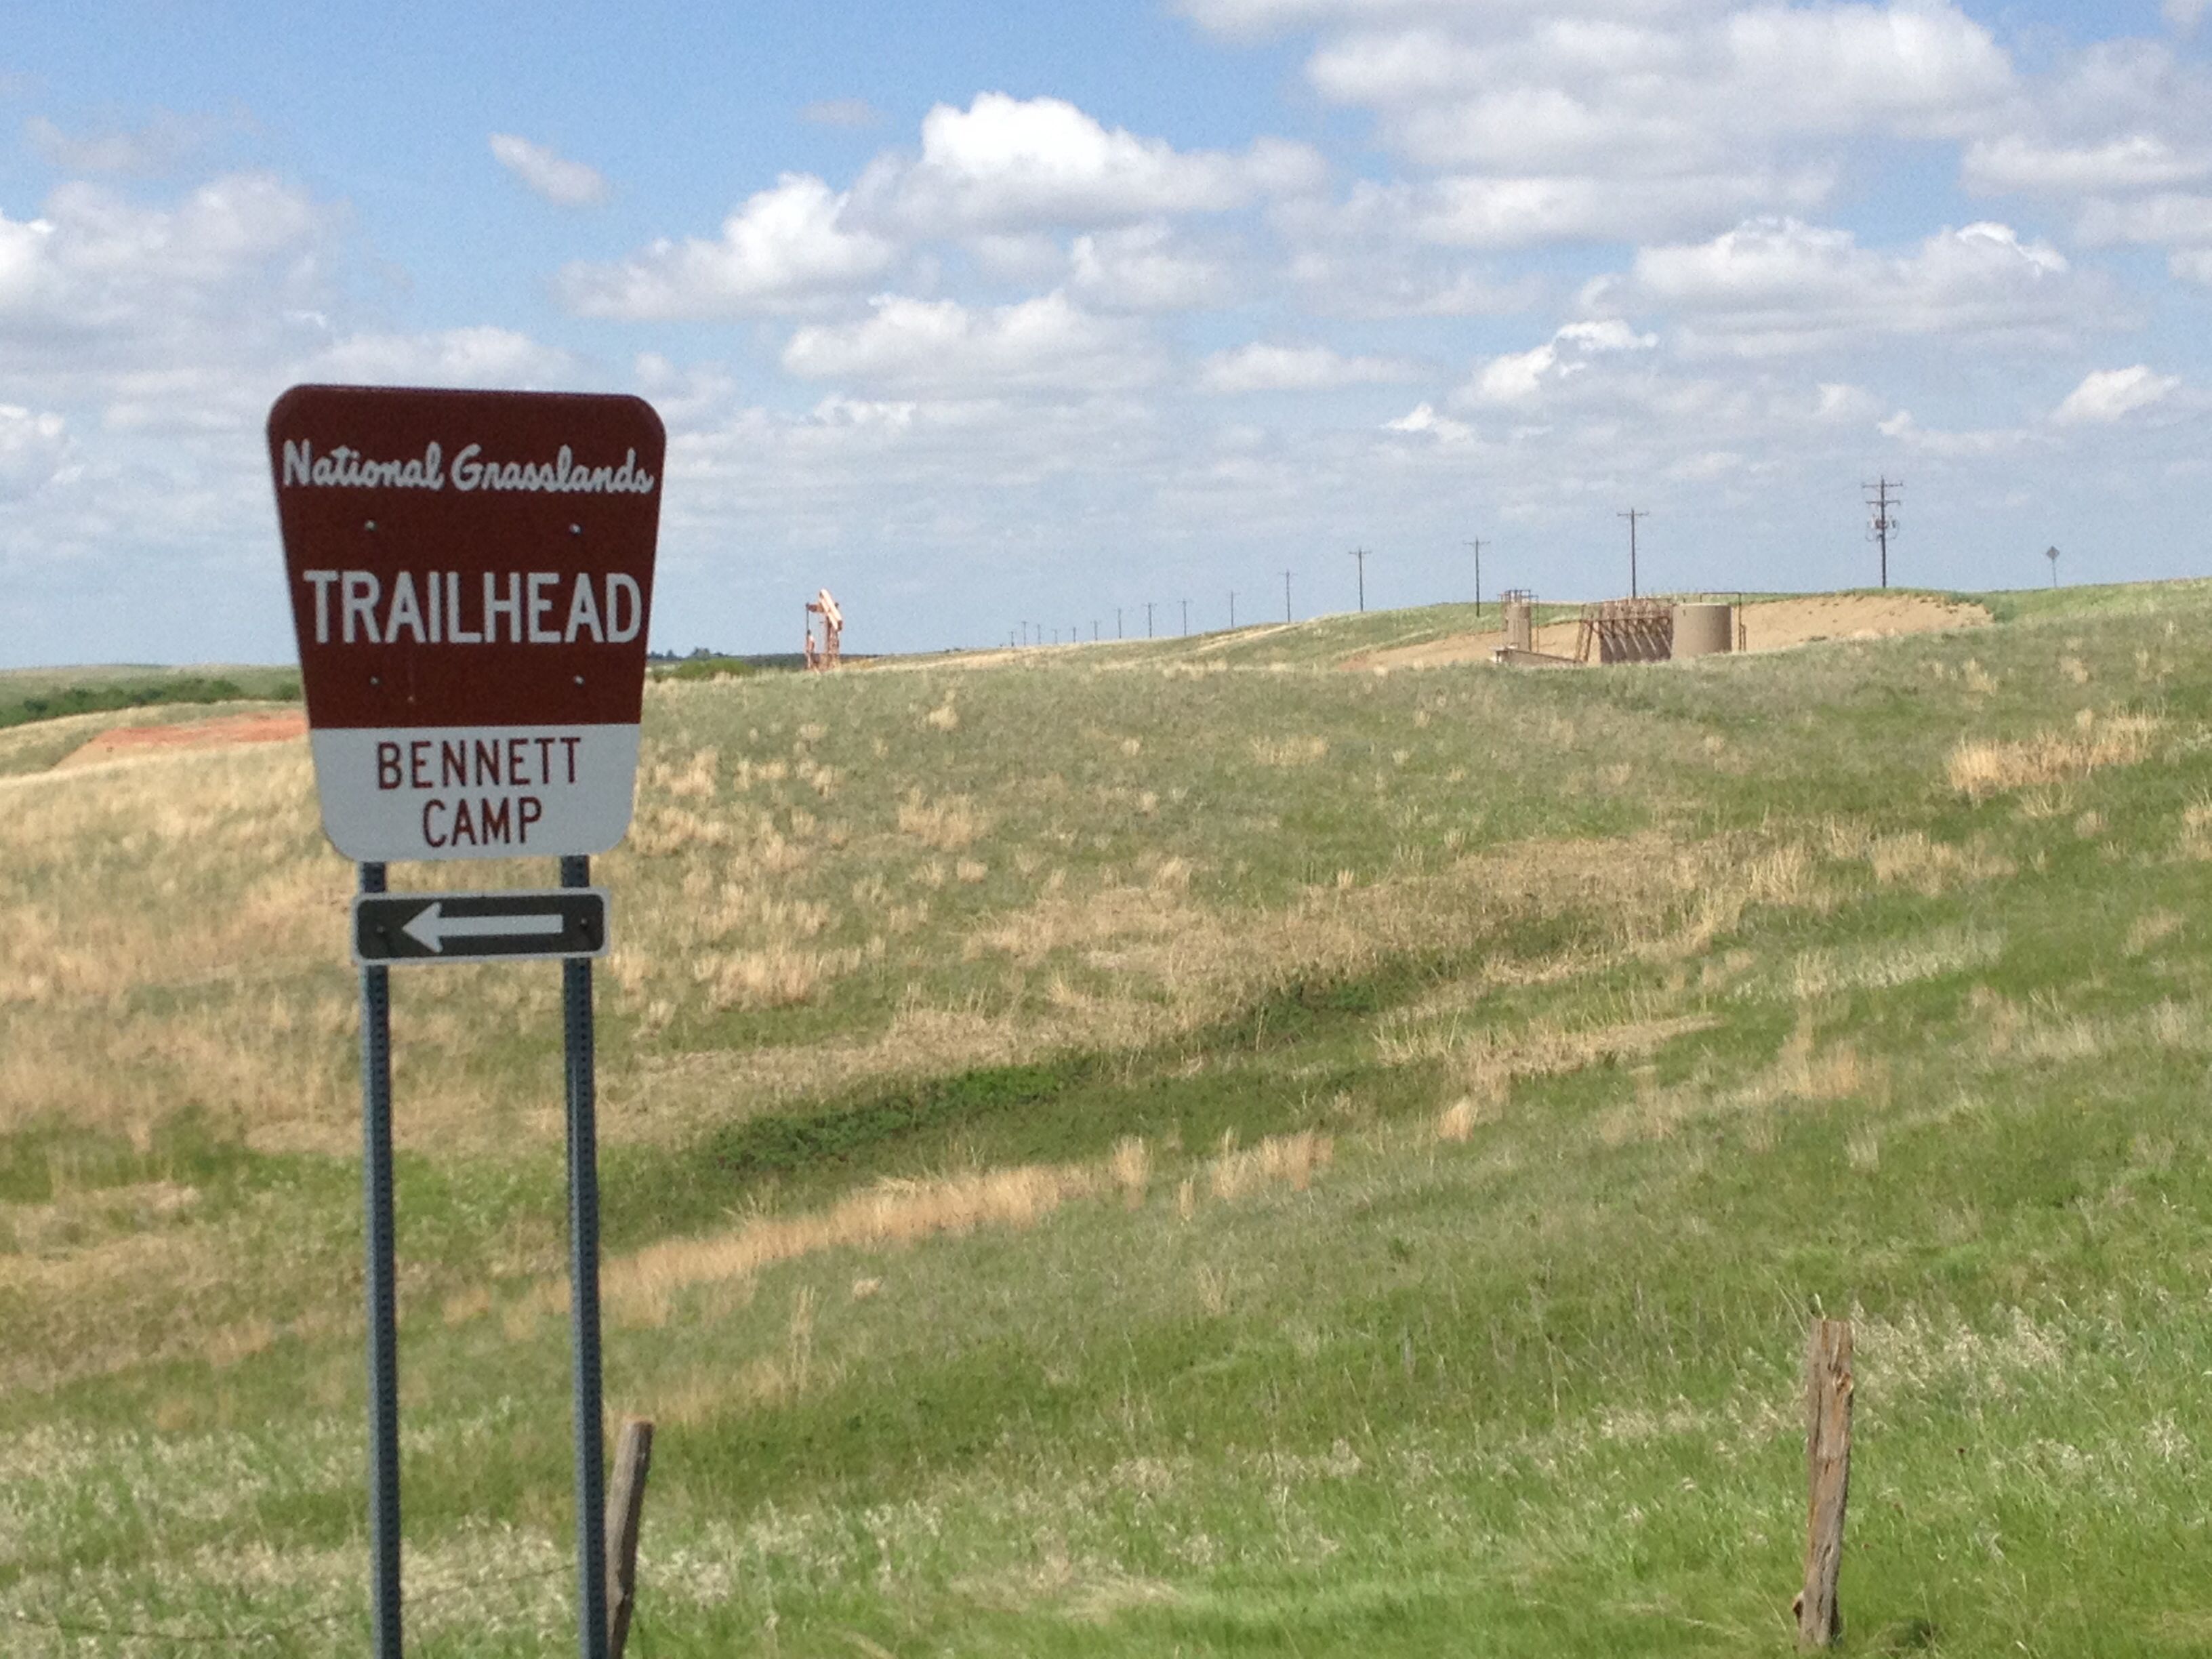
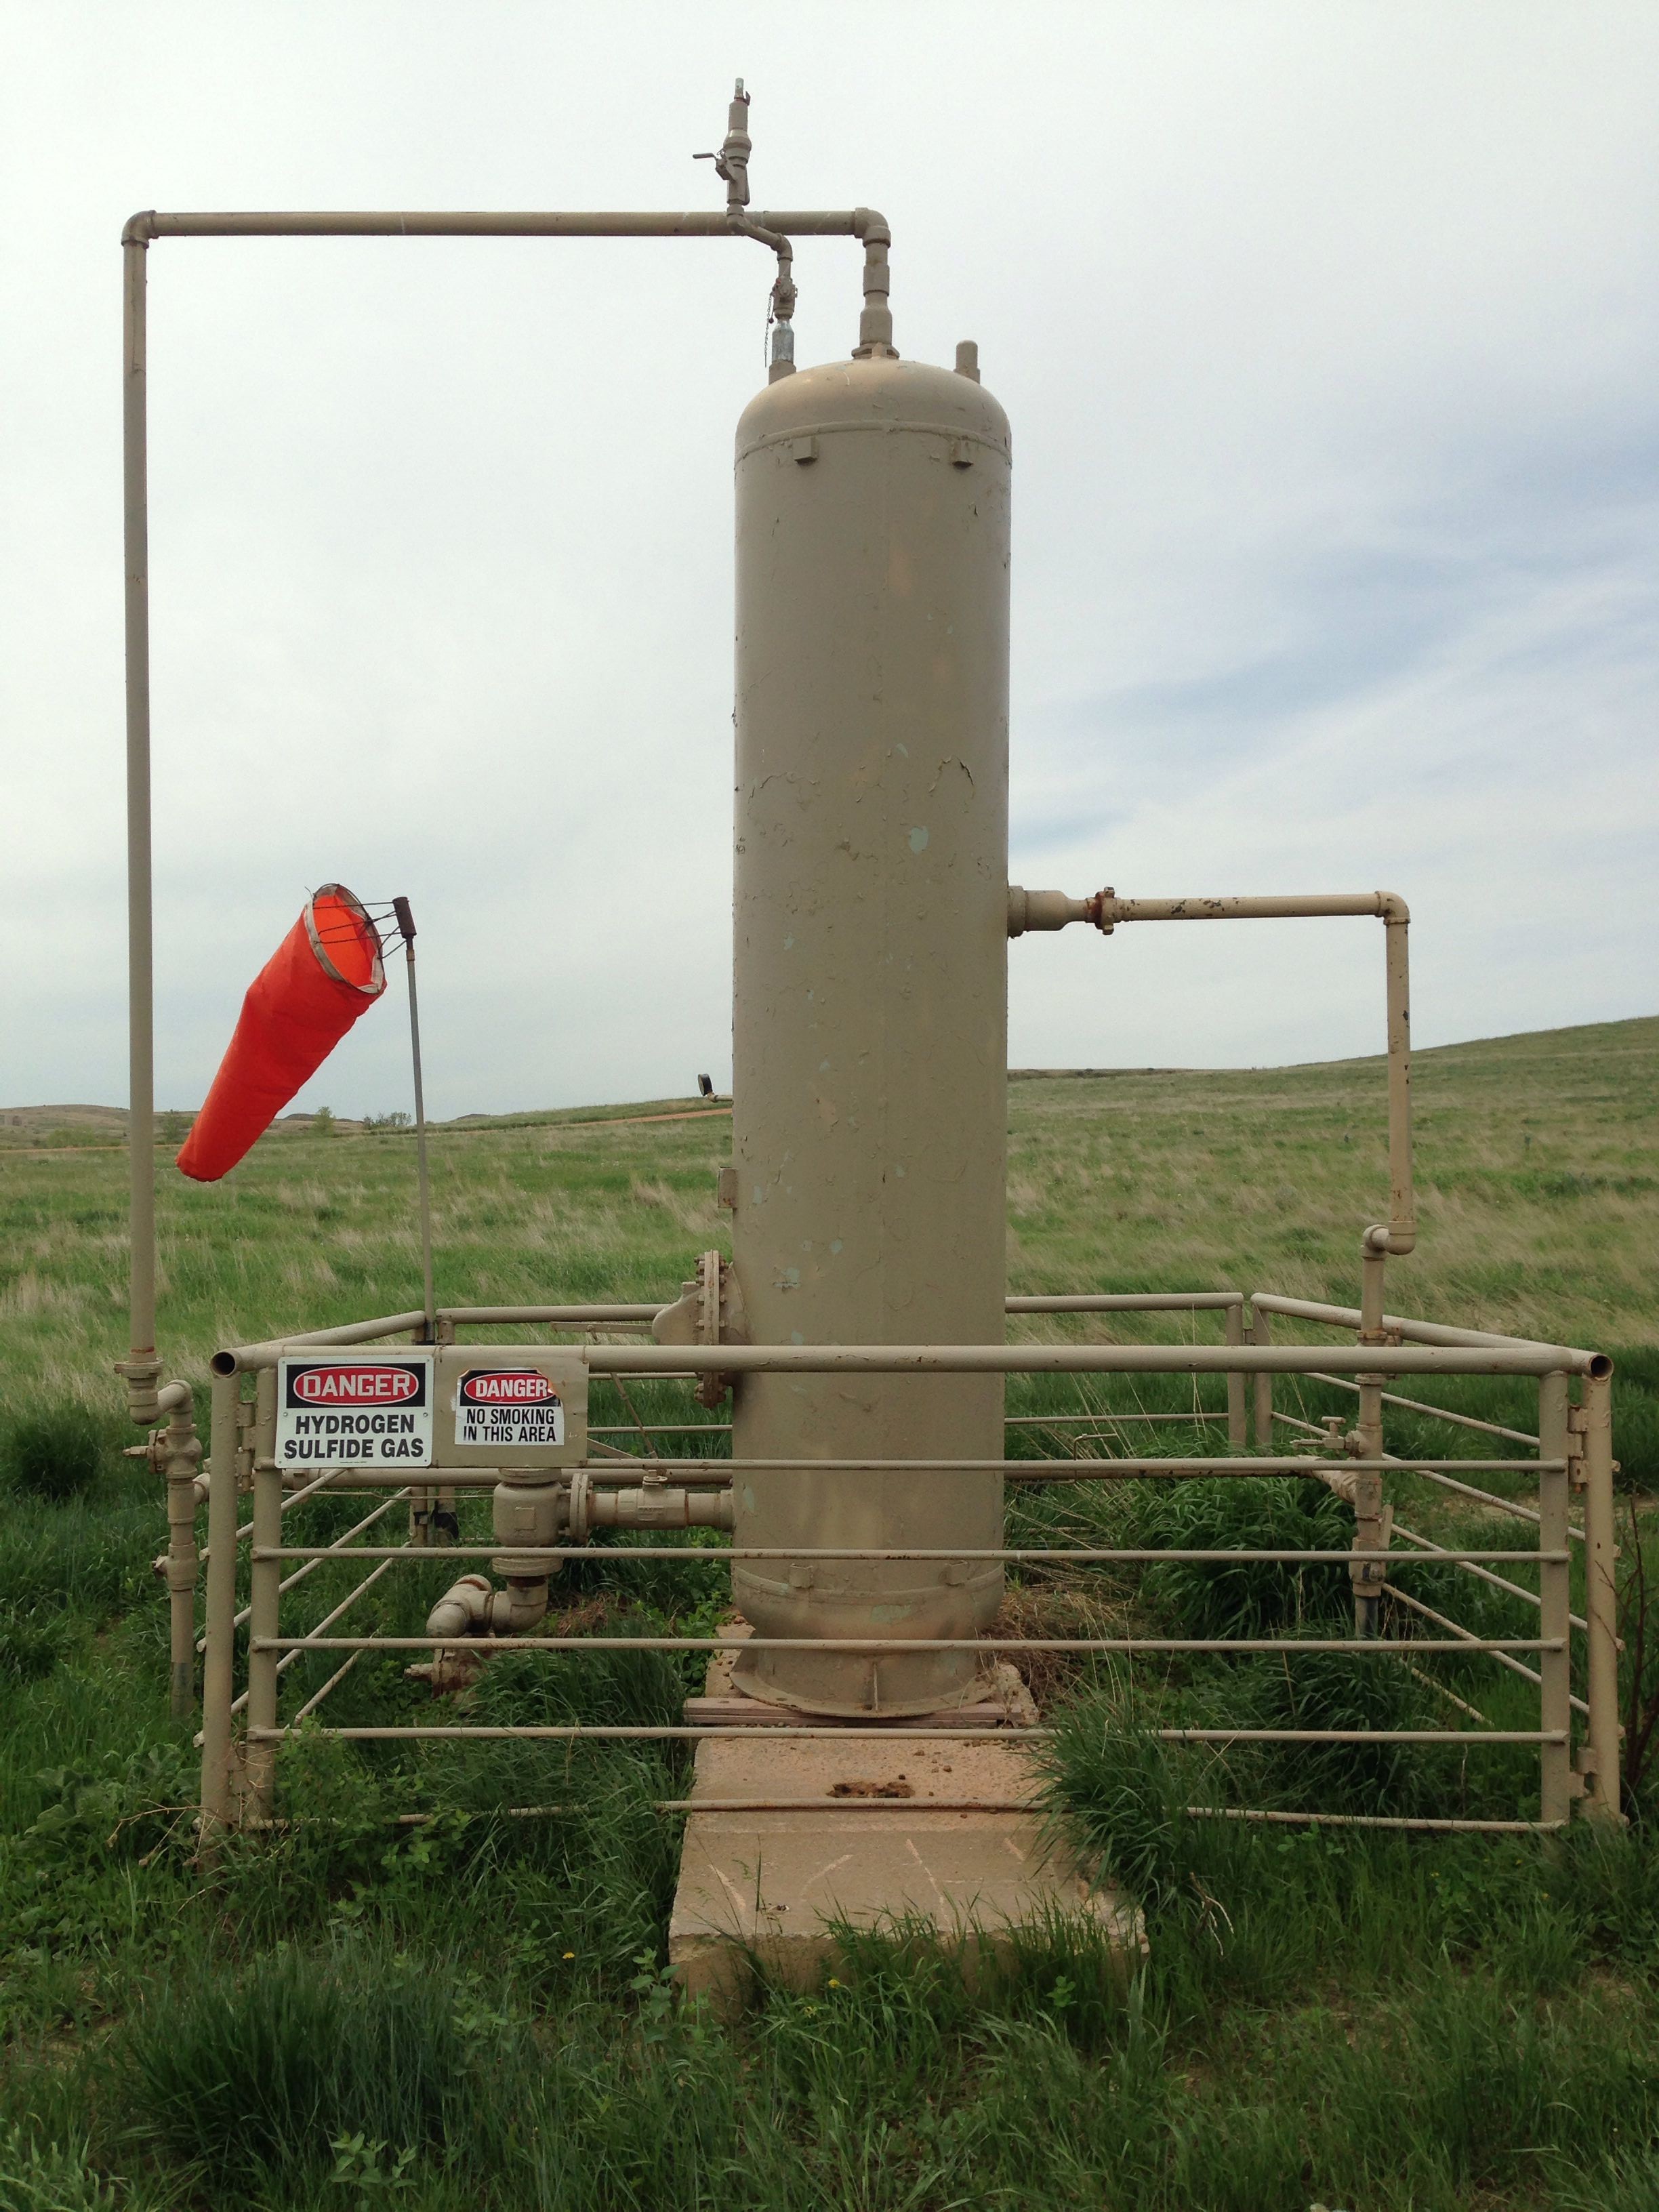
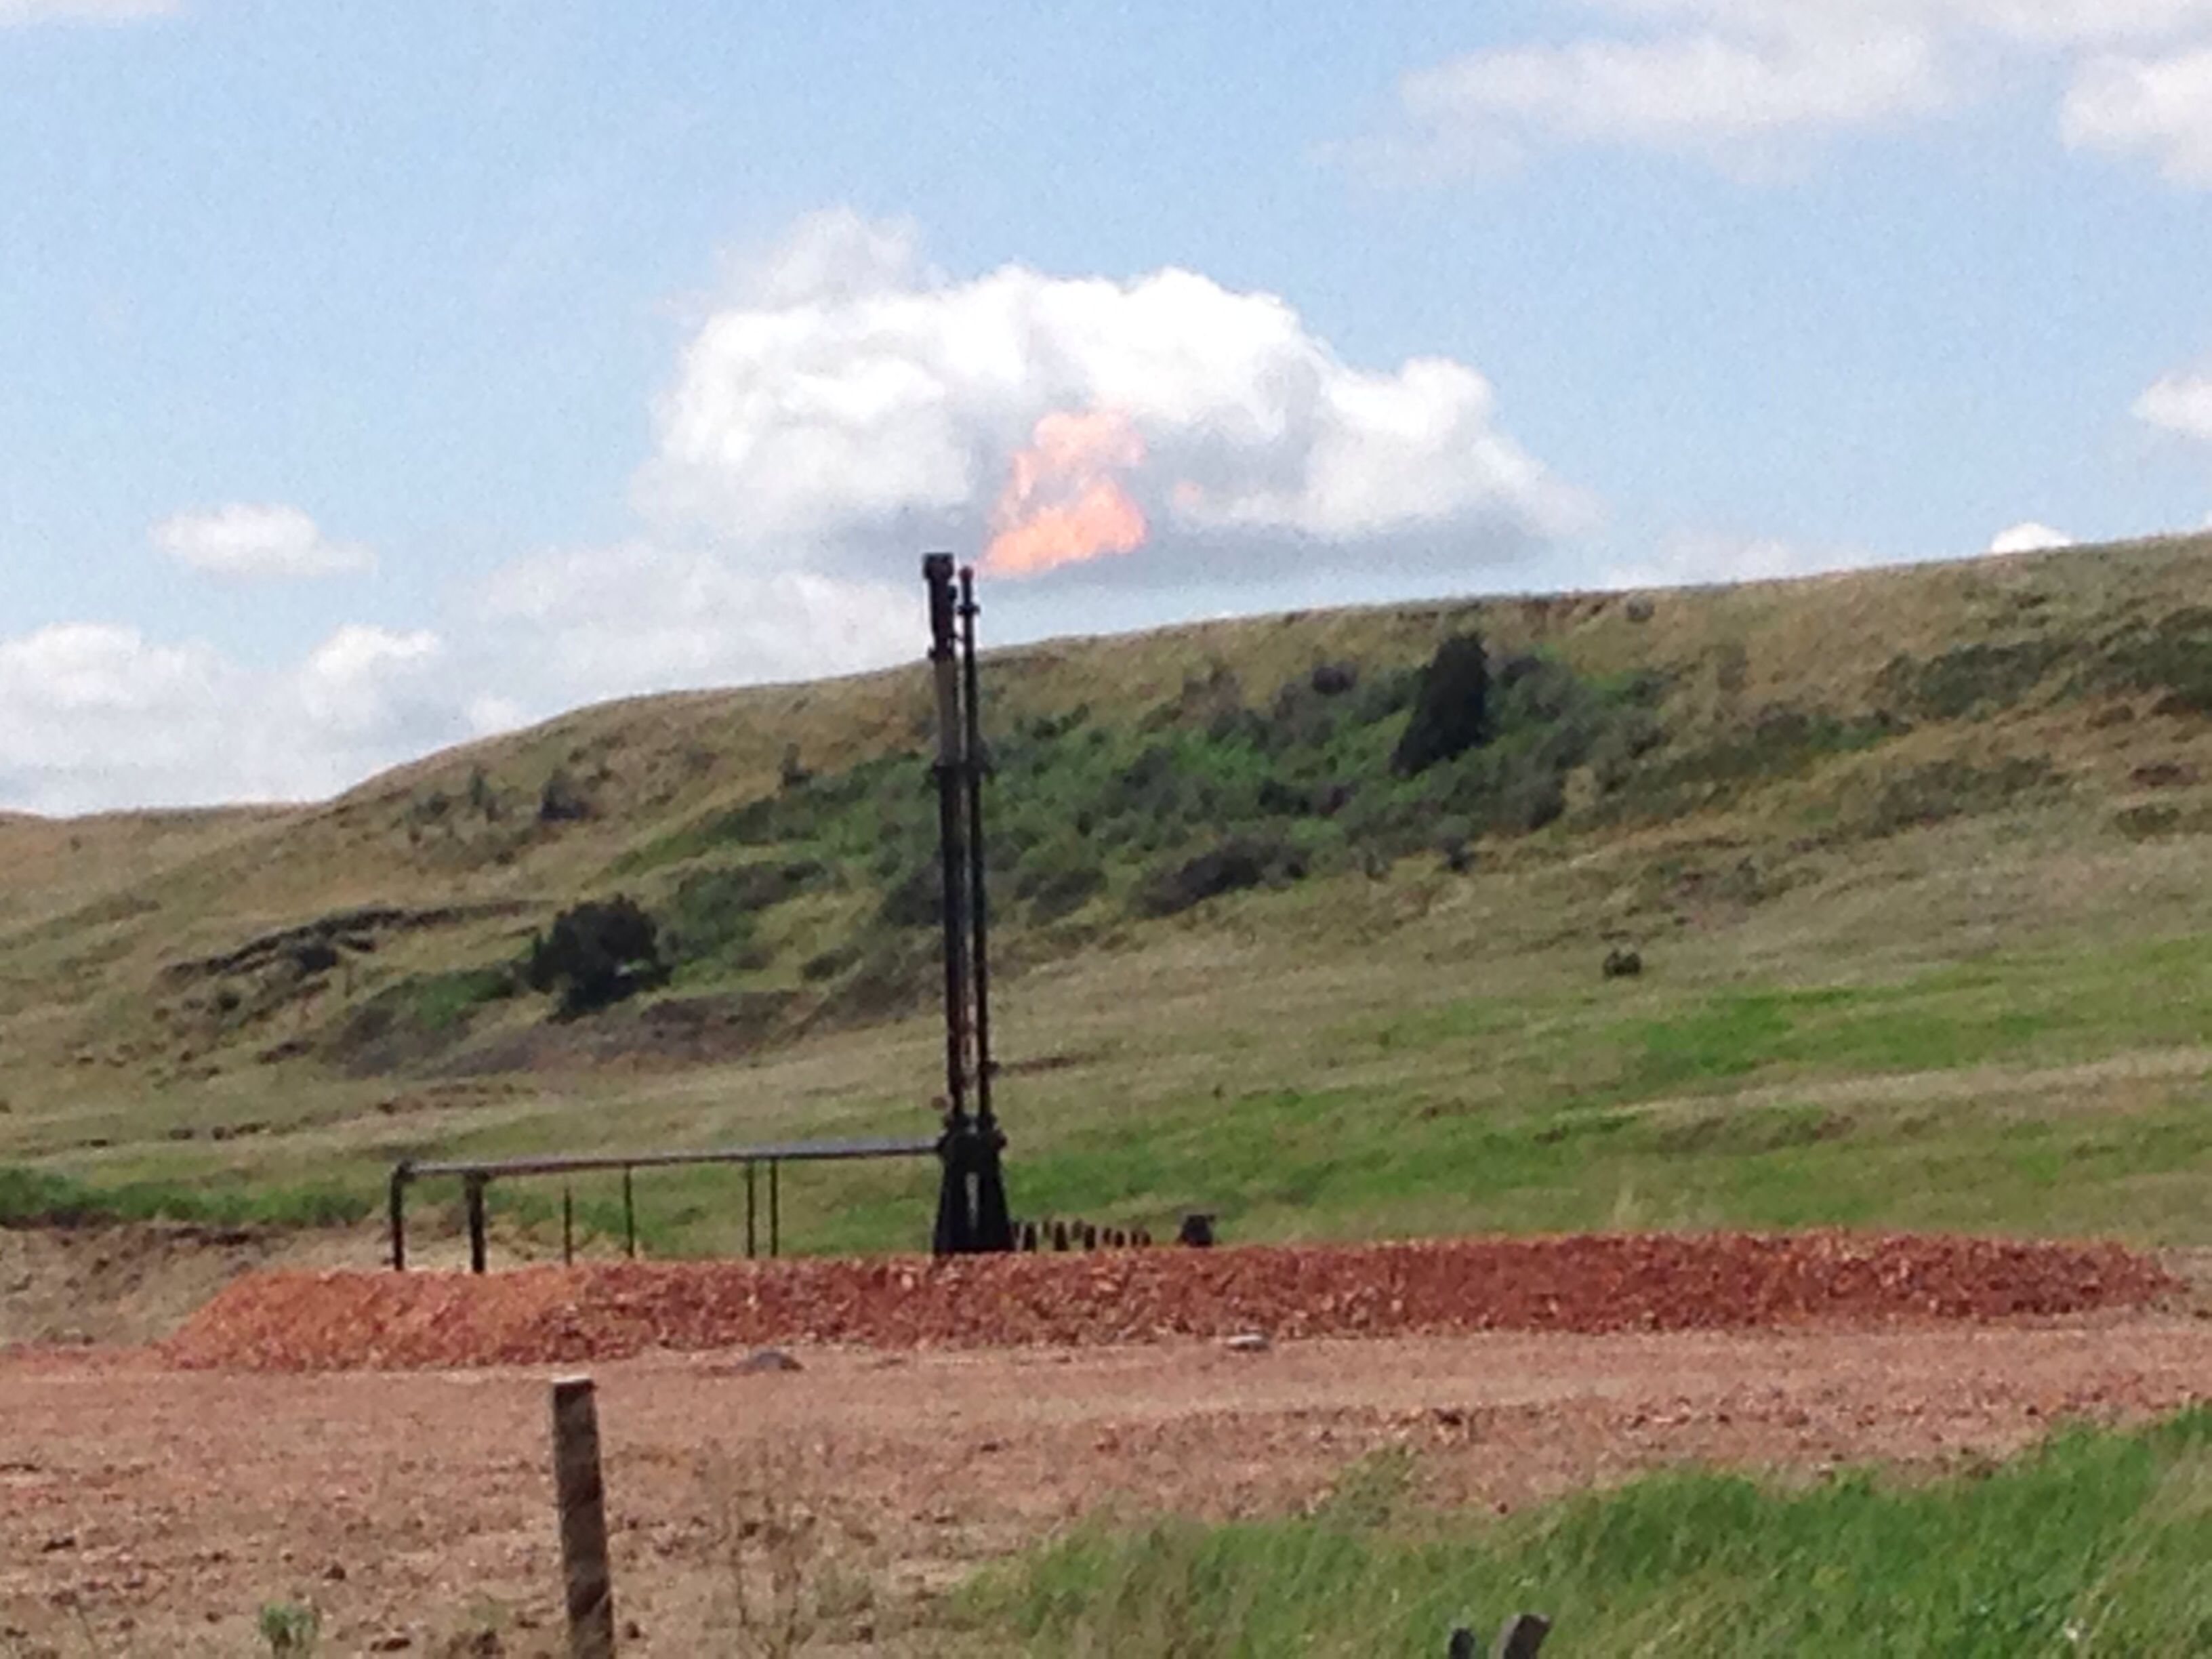
On November 12 and 13, 2014, the National Parks Conservation Association launched their campaign to educate citizens about how oil and gas development may affect America’s national parks. NPCA kicked off their campaign with two events in Pittsburgh and Philadelphia, PA to showcase a crowd-sourced digital map we helped them create with our new mobile app. The map’s photos detail the scale of oil and gas development near North Dakota’s Theodore Roosevelt National Park and is shown below:
And finally… We spent some time with NPCA collecting photos for that map with our app in ND this spring. Below are just a few, the rest of which can be found in our new ND photo album:
https://www.fractracker.org/a5ej20sjfwe/wp-content/uploads/2014/11/ND-Feature1.png400900FracTracker Alliancehttps://www.fractracker.org/a5ej20sjfwe/wp-content/uploads/2025/09/2025-Wordmark-Logo.pngFracTracker Alliance2014-12-01 16:49:212020-07-21 10:34:08Is it getting hot in North Dakota?


