Largest Coastal Spill in 25 years [in California]
By Kyle Ferrar, Western Program Coordinator
The Santa Barbara Pipeline Spill
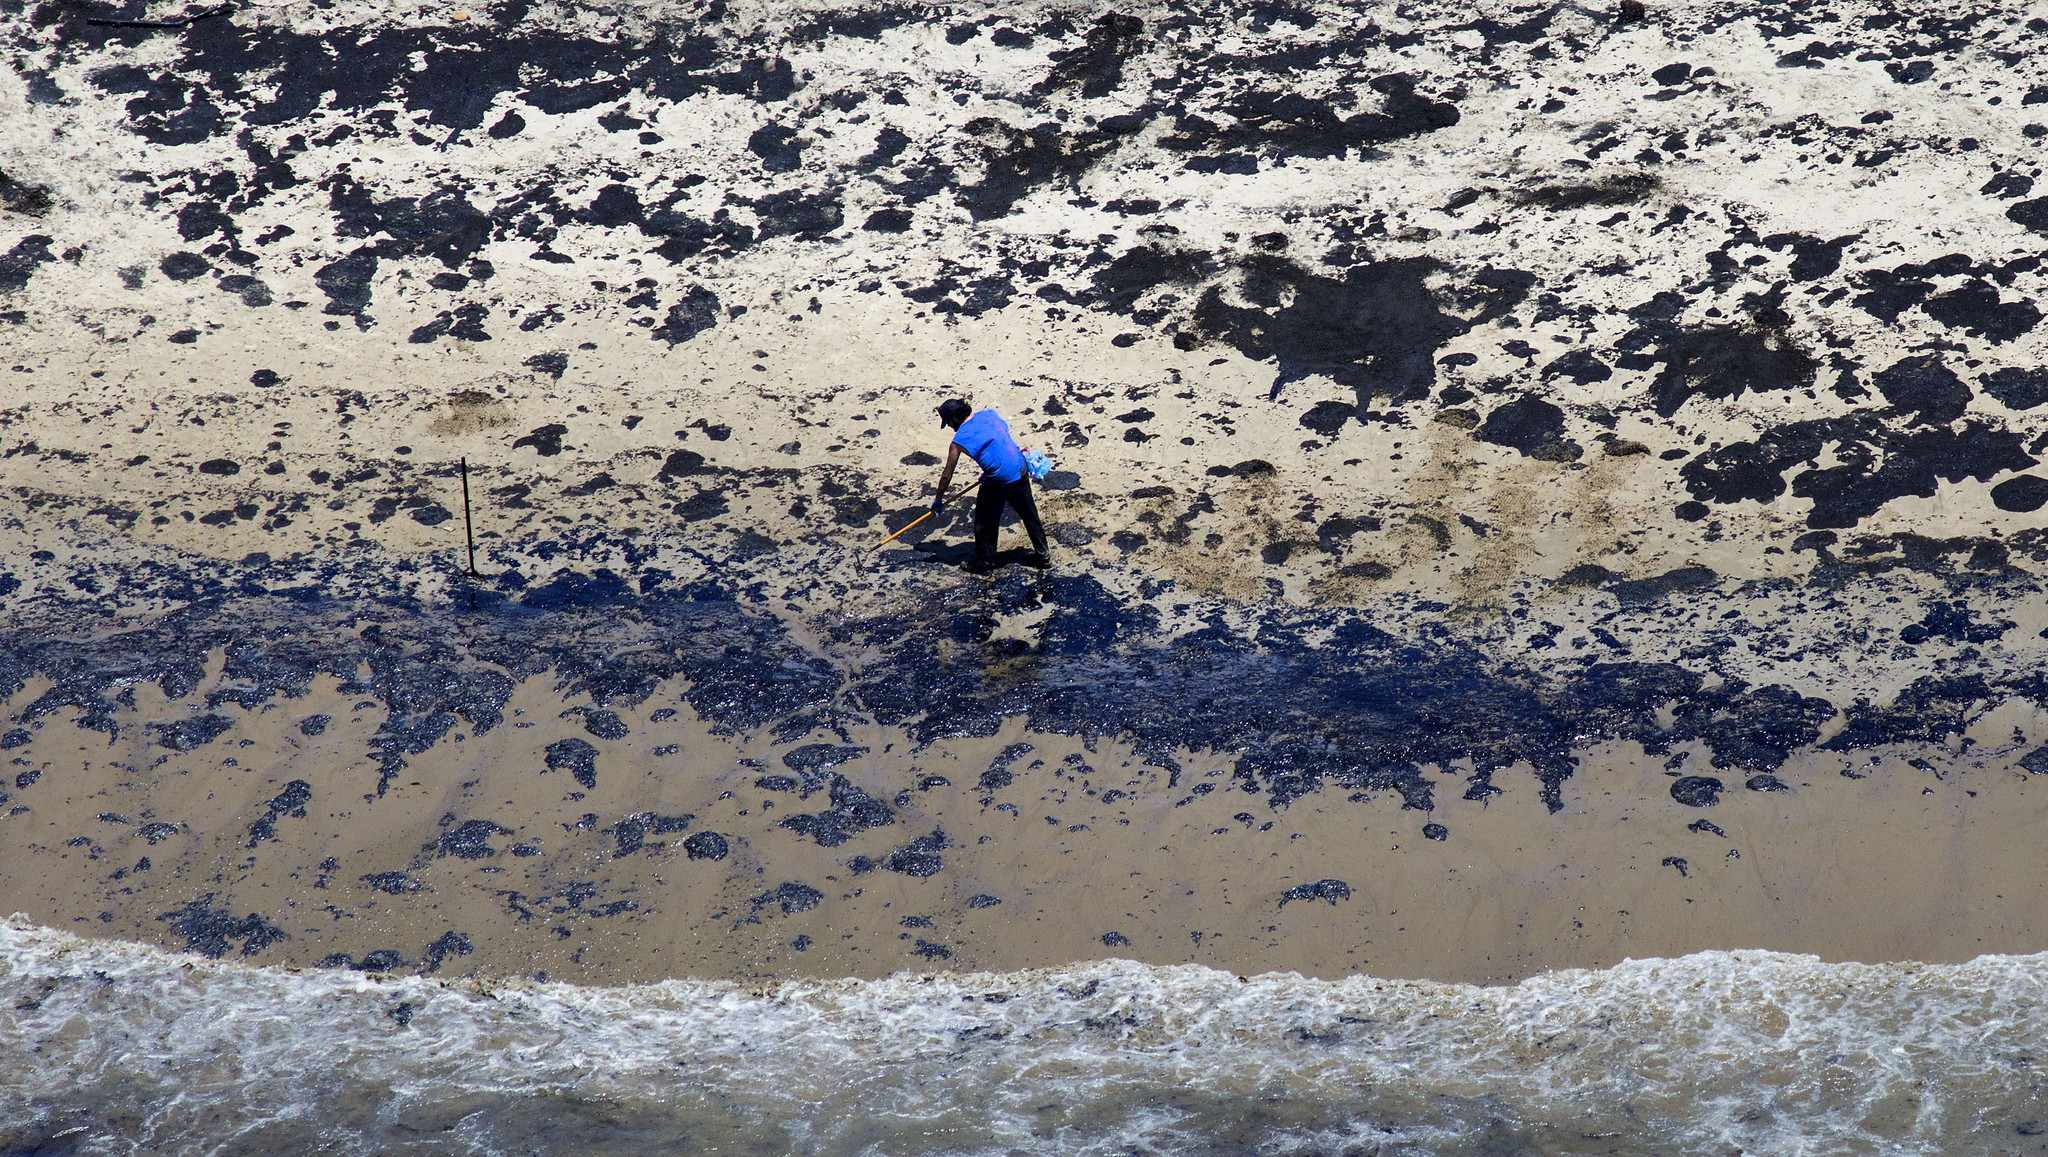
On May 19, 2015, just 20 miles north of Santa Barbara, a heavily corroded section of pipeline ruptured spilling upwards of 101,000 gallons. The pipeline was operated by Plains All American LLC, based out of Houston Texas, and was used to move crude oil from offshore rigs to inland refineries. The spill occurred on a section of pipe running parallel to the coastline at a distance of only a tenth of a mile to the ocean. As a result, the ruptured oil traveled through a drainage culvert and onto the beach where 21,000 gallons spilled into the ocean. The oil spread into a slick that covered 4 miles of coastline, and has since spread to southern California beaches more than 100 miles to the south. Santa Barbara county officials immediately closed two beaches, Refugio and El Capitan, and southern California beaches were also closed June 3rd through June 5th. Commercial fishing has been prohibited near the spill, and nearly 300 dead marine mammals and birds have been found, as well as dead cephalopods (octopi).1
Mapping the Impacts
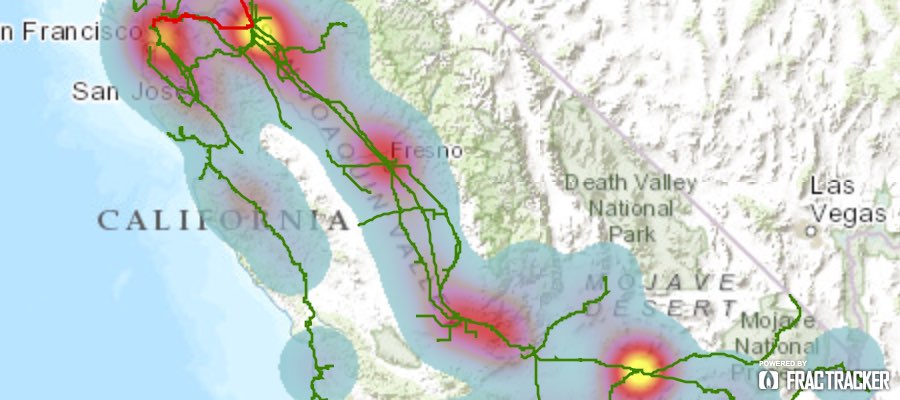
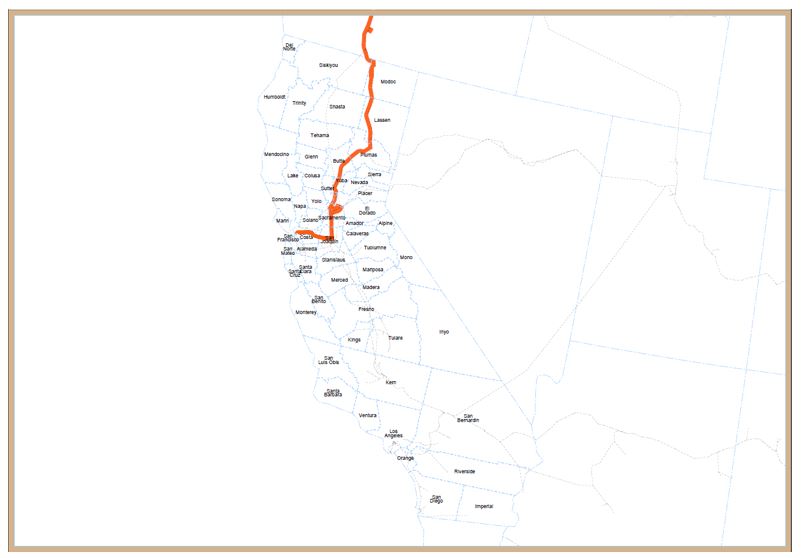
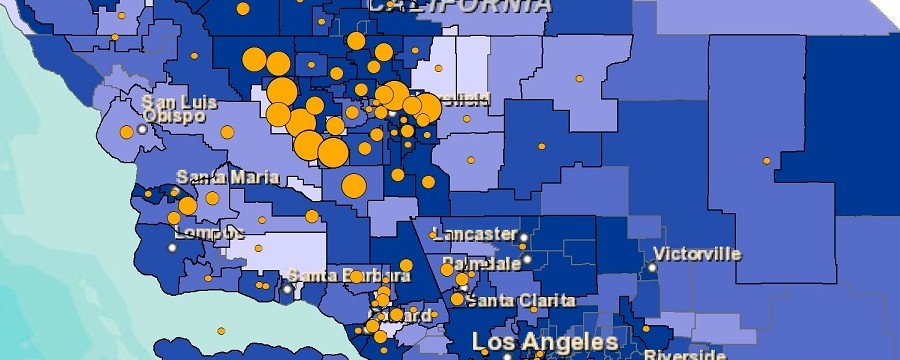
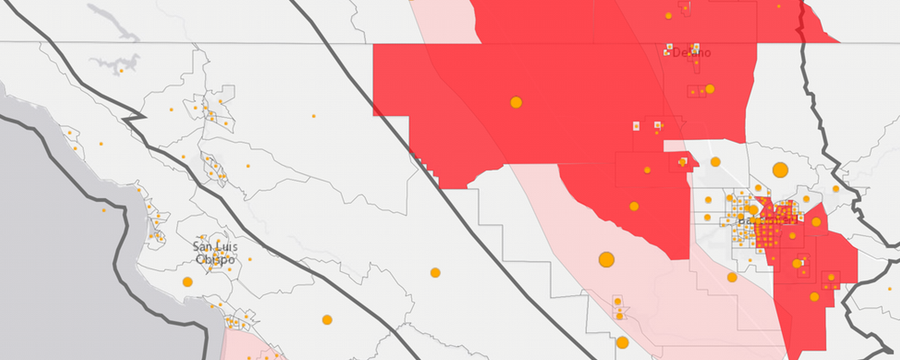
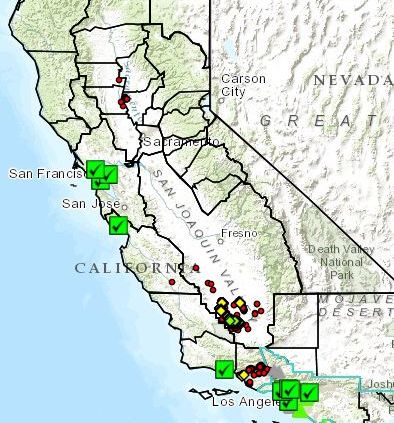
Santa Barbara 2015 Oil Spill at Refugio Beach. To view the legend and map full screen, click here.
The map above shows details of the oil spill, including the location on the coastline, the extent that the spill traveled south, and the Exxon offshore platforms forced to suspend operations due to their inability to transport crude to onshore refineries.
The dynamic map also shows the wildlife habitats that are impacted by this oil spill, putting these species at risk. This area of Central California coastline is incredibly unique. The Santa Barbara Channel Islands are formed and molded as colder northern swells meet warmer southern swells, generating many temperature gradients and microhabitats able to support an incredible amount of biodiversity. Many species are endemic to only this region of the California coastline, and therefore are very sensitive to the impacts of pollution. In addition to the many bird species, including the endangered Western Snow Plover and Golden Eagle, this area of coastline is home to a number of whale and porpoise species, and, as seen in the map, the Leatherback Sea Turtle and the Black Abolone Sea Snail, both threatened.
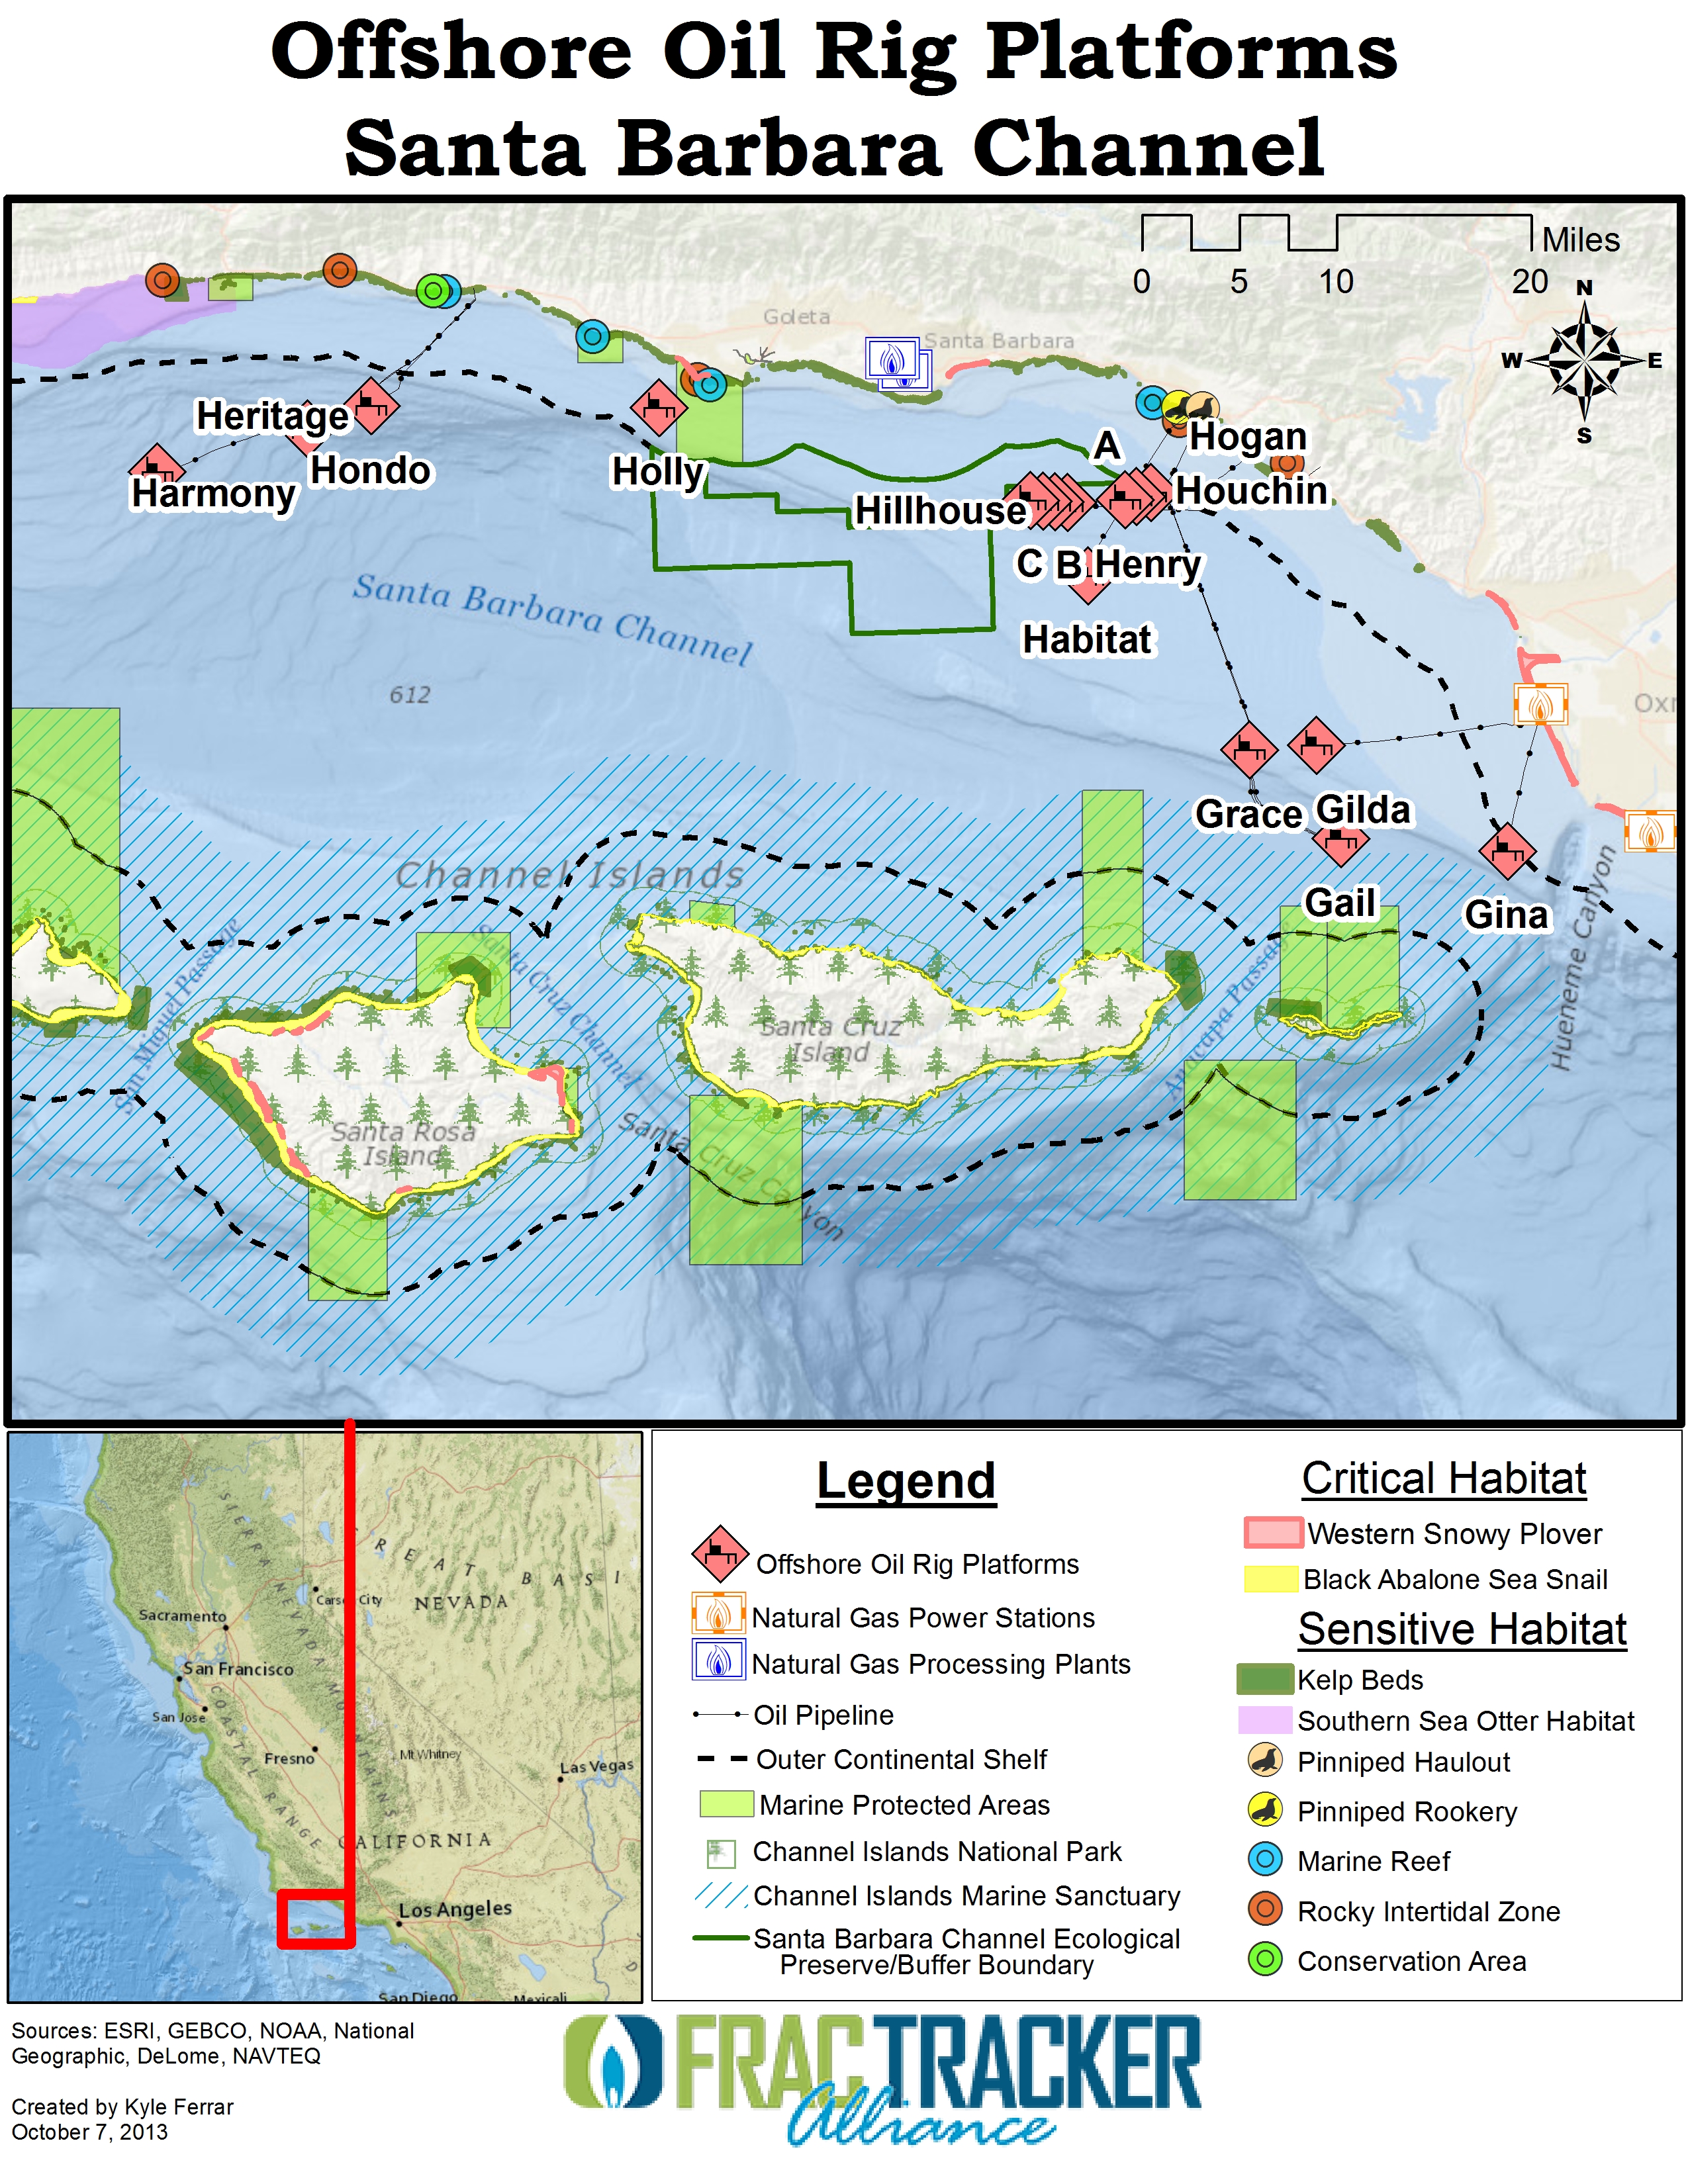
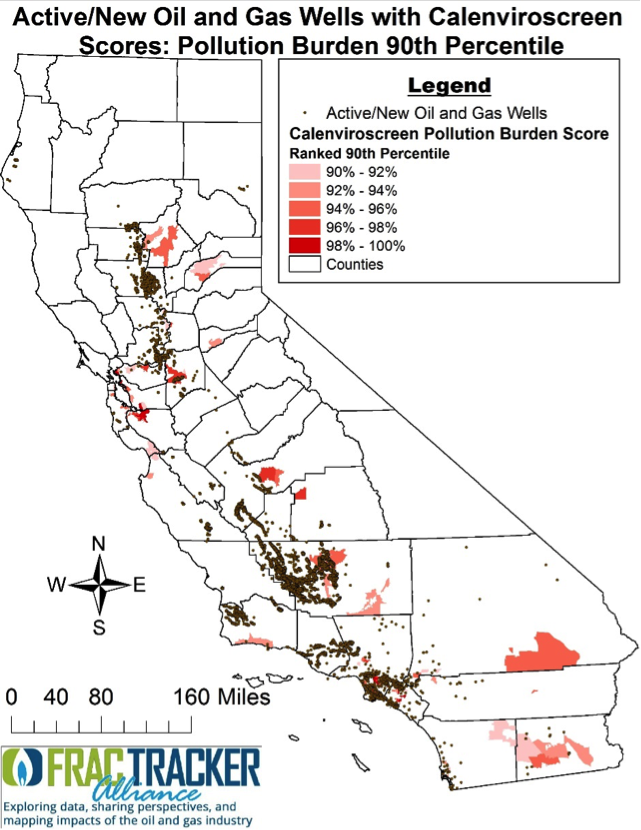
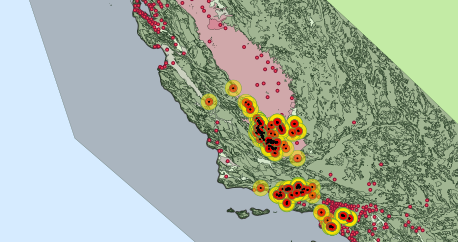
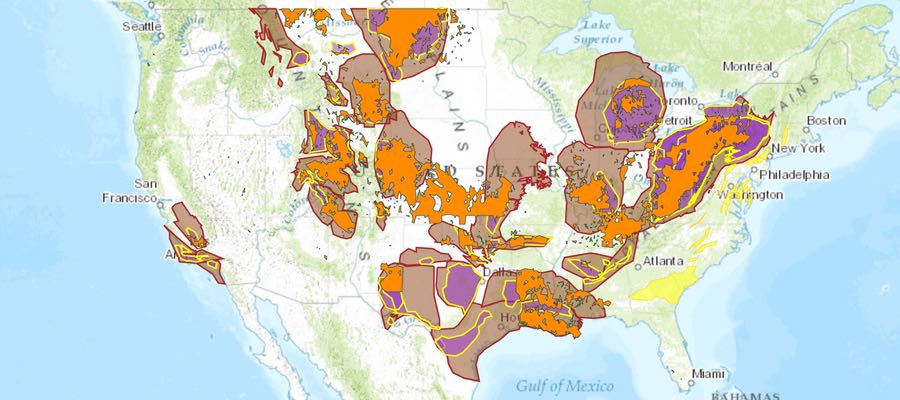
Figure 1. Offshore Drilling Near Santa Barbara from 2013
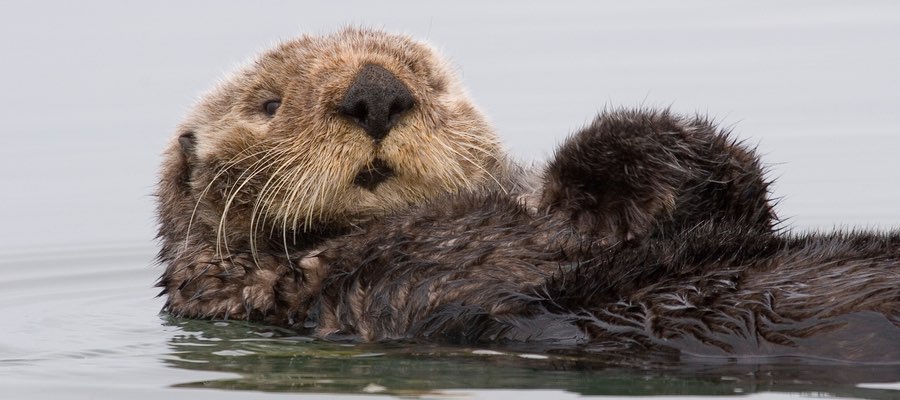
For California’s harbor seal populations, this kill event reinforces existing environmental pressures that have been shrinking the seal and sea lion (pinniped) communities, increasing the threat of shark attacks on humans. For the potential impact that this could have on California’s sensitive sea otter population, see FracTracker’s recent story on the West Coast Sea Otter.
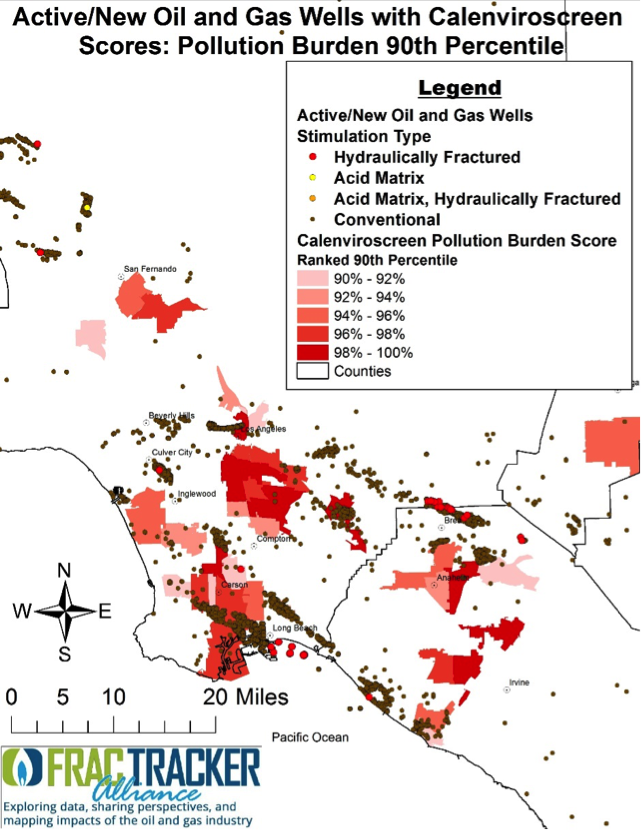
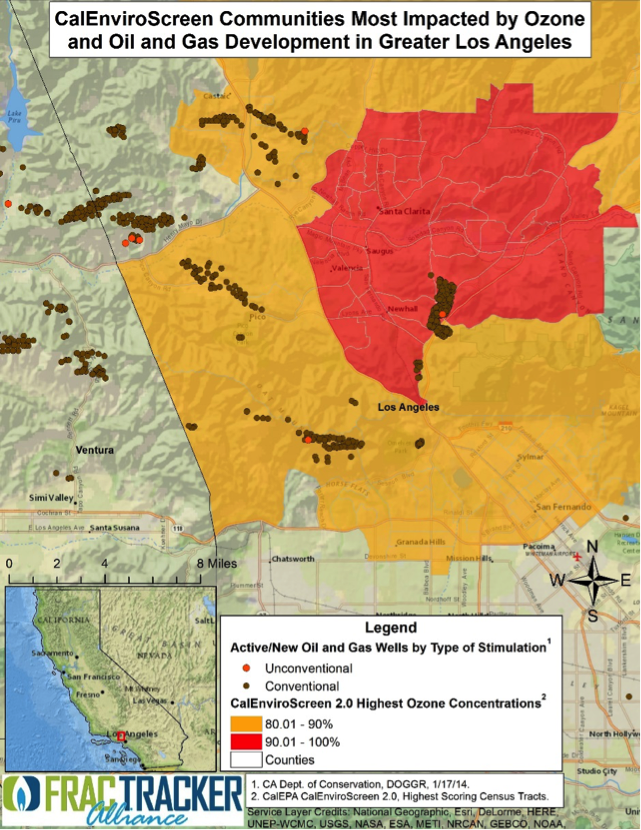
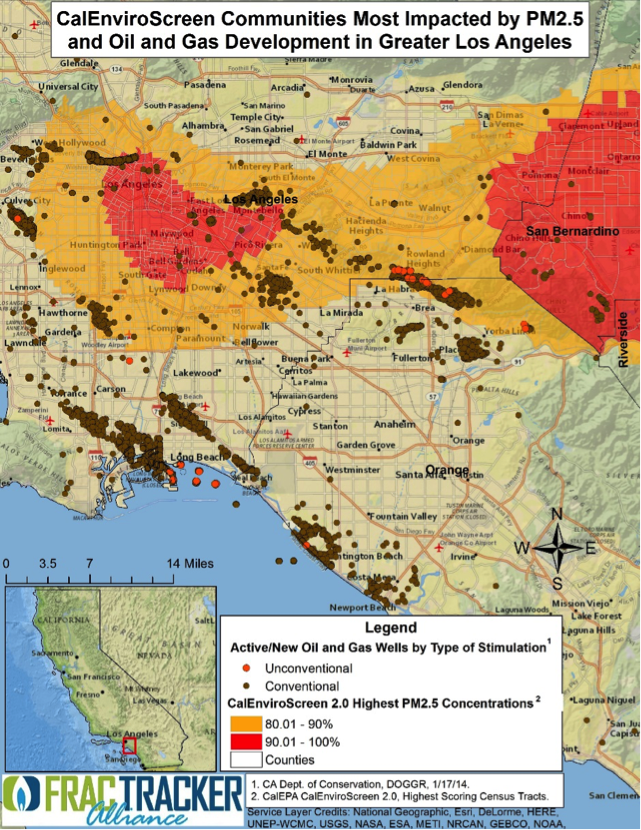
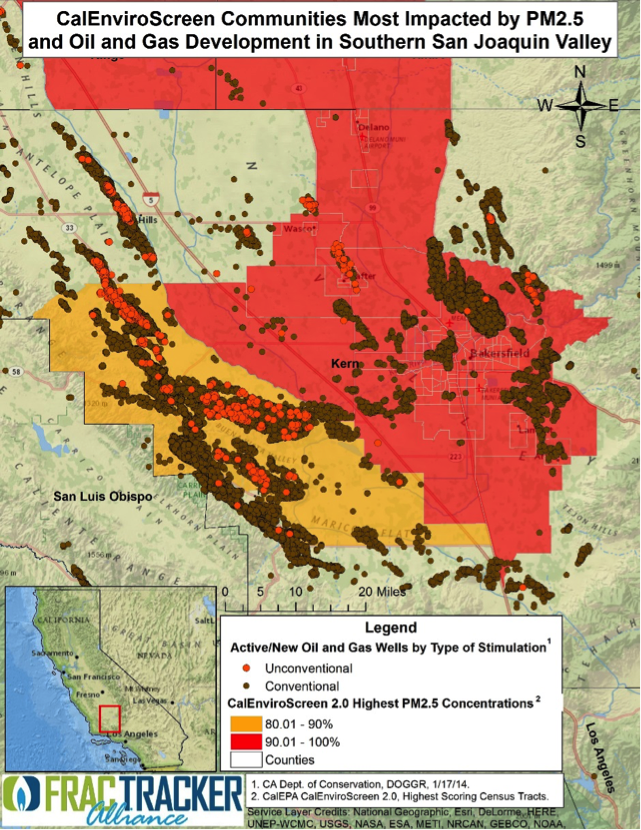
In 2013, The FracTracker Alliance collaborated with the Environmental Defense Center on the report Dirty Water: Fracking Offshore California. The report showed that much of the offshore oil is extracted by hydraulic fracturing (Fig 1.), and outlined the environmental impacts that would result from a spill of this magnitude.
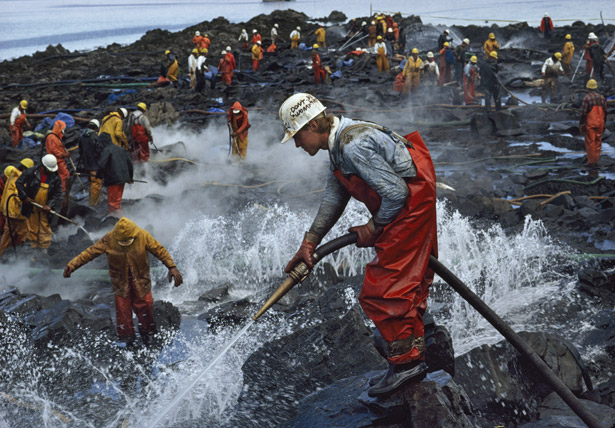
Clean Up Efforts
Workers are currently cleaning the spill by hand using buckets and shovels. These old fashioned techniques may be painstaking, but they are the least invasive and they are necessary to ensure that there is not additional damage to the sensitive ecosystems. Even scraping the coastline with wire brushes and putty knives cannot remove the stain of oil that has been absorbed by porous rocks. The oil will only wear away with time as it is diluted back into the ocean. Costs of the clean-up response alone have already reached $92 million, which is being paid by Texas-based Plains All American Pipeline. There have not been any reports yet on the financial impacts to the recreational and fishing industries.2
Prevention Opportunities
By comparison, the Santa Barbara oil spill in 1969 was estimated at 200 million gallons. After over 45 years, nearly a half decade, one would think that advancements in pipeline engineering and technology would prevent these types of accidents. Plains All American, the pipeline operator states that their pressure monitors can detect leaks the size of pinholes. Why, then, did the ruptured pipe continue to spill crude for three hours after the public was notified of the incident?
This section of pipeline (falsely reported by the media to be abandoned) was built in 1987. At capacity the pipeline could transport 50,400 gallons of oil per hour, but during the time of the spill the pipeline was running under capacity. Pipeline inspections had occurred in 2012 and in April of 2014, just weeks prior. The Pipeline and Hazardous Material Safety Administration said testing conducted in May had identified extensive corrosion of the pipeline that required maintenance. It is possible that this incident is an isolated case of mismanagement, but the data tell a different story as this is not an isolated event.
Plains released a statement that a spill of this magnitude was “highly unlikely,” although this section of the pipeline has experienced multiple other spills, the largest of which being 1,200 gallons. Just a year prior, May 2014, the same company, Plains, was responsible for a 19,000 gallon spill of crude in Atwater Village in Los Angeles County. According to a joint hearing of two legislative committees, the operators, Plains did not meet state guidelines for reporting the spill. According to the county, the operator should have been able to shut down the pipeline much faster.3 It is not clear how long the pipeline was actually leaking.
NASA Spill Visualizations
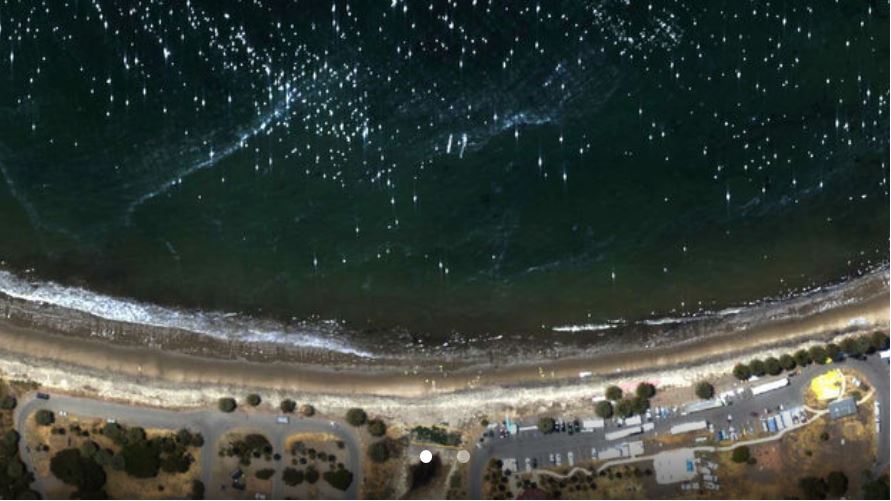
As a result of the spill and to assist with the clean-up and recovery, NASA’s Jet Propulsion Laboratory (JPL) in Pasadena, CA has developed new technology to track the oil slick and locate contamination of beaches along the coastline. The JPL deployed a De Havilland Twin Otter aircraft carrying a unique airborne instrument developed to study the spill and test the ability of imaging spectroscopy to map tar on area beaches. What this means is that from aircraft special cameras can take pictures of the beach. Based on the nature of the light waves reflecting off the beach in the pictures, tar balls and oil contamination can be identified. Clean-up crews can then be dispatched to these areas. On their website, NASA states “The work is advancing our nation’s ability to respond to future oil spills.”4 A picture generated using this technology, and showing oil contamination in water and on the beach, is shown below.
References
- Maza, C. 2015. California oil spill: Regulators, lawmakers scrutinize company response. Christian Science Monitor. Accessed 7/1/15.
- Chang, A. 2015. Workers clean up oil spill on California beaches by hand. The Washington Times. Accessed 7/5/15.
- Panzar, J. 2015. Official says pipeline firm violated state guidelines for reporting Santa Barbara spill. Los Angeles Times. Accessed 7/6/15.
- NASA. 2015. NASA Maps Beach Tar from California Oil Pipeline Spill. NASA Jet Propulsion Laboratory California Institute of Technology. Accessed 7/7/17.