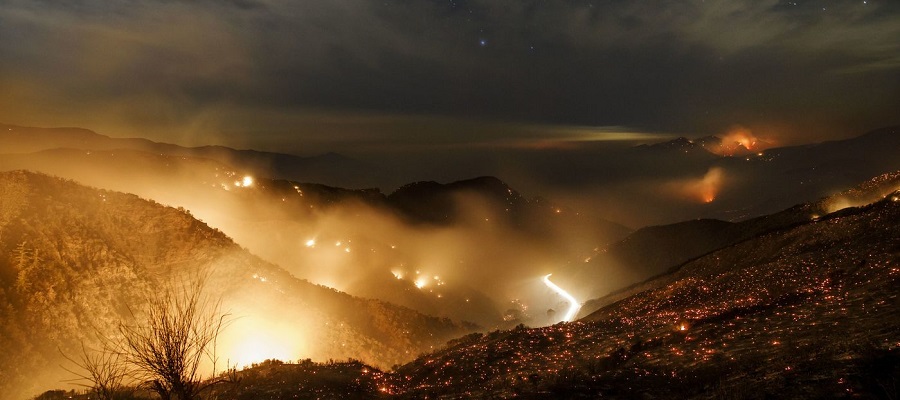
Never has the saying “adding fuel to the fire” been so literal.
California wildfires have been growing at unheard of rates over the last five years, causing record breaking destruction and loss of life. Now that we’ve had a little rain and perhaps a reprieve from this nightmare wildfire season, it is important to consider the factors influencing the risk and severity of fires across the state.
Oil and gas extraction and consumption are major contributors to climate change, the underlying factor in the recent frequent and intense wildfires. A lesser-known fact, however, is that many wildfires have actually burned in oil fields in California – a dangerous circumstance that also accelerates greenhouse gas emissions. Our analysis shows where this situation has occurred, as well as the oil fields most likely to be burned in the future.
First, we looked at where wildfires are currently burning across the state, shown below in Map 1. This map is from CAL FIRE and is continuously updated.
Map 1. The CAL FIRE 2018 Statewide Incidents Map
CAL FIRE map showing the locations and perimeters of California wildfires
California’s recent fire seasons
The two largest wildfires in California recorded history occurred last year. The Mendocino Complex Fire burned almost a half million acres (1,857 square kilometers) in Mendocino National Forest. The Thomas Fire in the southern California counties of Ventura and Santa Barbara burned nearly 282,000 acres (1,140 square kilometers). A brutal 2017 fire season, however is now overshadowed by the ravages of 2018’s fires.
With the effects of climate change increasing the severity of California’s multi-year drought, each fire season seems to get worse. The Woolsey Fire in Southern California caused a record amount of property damage in the hills of Santa Monica and Ventura County. The Camp Fire in the historical mining town of Paradise resulted in a death toll that, as of early December, has more than tripled any other wildfire. And many people are still missing.
The Thomas Fire
A most precarious situation erupts when a wildfire spreads to an oil field. Besides having a surplus of their super flammable namesake liquid, oil fields are also storage sites for various other hazardous and volatile chemicals. The Thomas Fire was such a scenario.
The Thomas fire burned through the steep foothills of the coastal Los Padres mountains into the oil fields. When in the oil fields, the oil pumped to the surface for production and the stores of flammable chemicals provided explosive fuel to the wildfire. While firefighters were able to get the majority of the fire “contained,” the oil fields were too dangerous to access. According to the community, oil fires remained burning for weeks before they were able to be extinguished.
The Ventura office of the Division of Oil Gas and Geothermal Resources (DOGGR) reported that the Thomas Fire burned through the Taylor Ranch oil fields and a half dozen other oil fields including the Ventura, San Miguelito, Rincon, Ojai, Timbe Canyon, Newhall-Portrero, Honor Rancho and Wayside Canyon. DOGGR Ventura officials said Newhall-Potrero was “half burned over.” Thomas also burned within a 1/3 mile of the Sespe oil field. Schools and other institutions closed down throughout the Los Angeles Basin, but DOGGR said there was no impact on oil and gas operations that far south. The fire spurred an evacuation of the Las Flores Canyon Exxon oil storage facility but thankfully was contained before reaching the facility.
The Thomas Fire was not the first time or the last time an oil field burned in a California wildfire. Map 2 above shows state wildfires from the last 20 years overlaid with maps of California oil fields, oil wells, and high threat wildfire zones. The map shows just the oil fields and oil and gas wells in California that have been burned by a wildfire.
We found that 160 of California’s 517 oil fields (31%) have been burned by encroaching wildfires, affecting more than 10,000 oil and gas well heads.
An ominous finding: the state’s highest threat zones for wildfires are located close to and within oil and gas fields.
The map shows that wildfire risk is greatest in Southern California in Ventura and Los Angeles counties due to the arid environment and high population density. Over half the oil fields that have burned in California are in this small region.
Who is at fault?
Reports show that climate change has become the greatest factor in creating the types of conditions conducive to uncontrollable wildfires in California. Climate scientists explain that climate change has altered the natural path of the Pacific jet stream, the high-altitude winds that bring precipitation from the South Pacific to North America.
In a recent study, researchers from the University of Idaho and Columbia University found that the impact of global warming is growing exponentially. Their analysis shows that since 2000, human-caused climate change prompted 75% more aridity — causing peak fire season to expand every year by an average of nine days. The Fourth National Climate Assessment details the relationship between climate change and wildfire prevalence, and comes to the same conclusion: impacts are increasing.
On the cause of wildfires, the report explains:
Compound extremes can include simultaneous heat and drought such as during the 2011–2017 California drought, when 2014, 2015, and 2016 were also the warmest years on record for the state; conditions conducive to the very large wildfires, that have already increased in frequency across the western United States and Alaska since the 1980s.
Both 2017 and 2018 have continued the trend of warmest years on record, and so California’s drought has only gotten worse. The report goes on to discuss the threat climate change poses to the degradation of utilities’ infrastructure. Stress from climate change-induced heat and drought will require more resources dedicated to maintaining utility infrastructure.
The role of public utilities
The timing of this report could not be more ironic considering the role that utilities have played in starting wildfires in California. Incidents such as transformer explosions and the degradation of power line infrastructure have been implicated as the causes of multiple recent wildfires, including the Thomas Fire and the most recent Woolsey and Camp wildfires – three of the most devastating wildfires in state history. As public traded corporations, these utilities have investors that profit from their contribution to climate change which, in turn, has created the current conditions that allow these massive wildfires to spread. On the other hand, utilities in California may be the least reliant on fossil fuels. Southern California Edison allows customers to pay a surcharge for 100% renewable service, and Pacific Gas and Electric sources just 20% of their electricity from natural gas.
The CPUC is one of the government agencies tasked with ensuring that investor-owned utilities operate a safe and reliable grid… An essential component of providing safe electrical service is the financial wherewithal to carry out safety measures.
Along with regulation and oversight, part of the agency’s work involves ensuring utilities are financially solvent enough to carry out safety measures.
Conclusion
January 1, 2019 will mark the seventh year of drought in California. Each fall brings anxiety and dread for state residents, particularly those that live in the driest, most arid forests and chaparral zones. Data show that the wildfires continue to increase in terms of intensity and frequency as the state goes deeper into drought induced by climate change.
While California firefighters have been incredibly resourceful, over 70% of California forest land is managed by the federal government whose 2019 USDA Forest Service budget reduces overall funding for the National Forest System by more than $170 million. Moving forward, more resources must be invested in supporting the health of forests to prevent fires with an ecological approach, rather than the current strategy which has focused predominantly on the unsustainable practice of fuel reduction and the risky tactics of “fire borrowing”. And of course, the most important piece of the puzzle will be addressing climate change.
By Kyle Ferrar, Western Program Coordinator, FracTracker Alliance
Feature image by Marcus Yam, LA Times
https://www.fractracker.org/a5ej20sjfwe/wp-content/uploads/2018/11/ThomasFire_MarcusYam_LATimes_re.jpg400900Kyle Ferrar, MPHhttps://www.fractracker.org/a5ej20sjfwe/wp-content/uploads/2025/09/2025-Wordmark-Logo.pngKyle Ferrar, MPH2018-12-04 13:32:592021-04-15 14:57:06California’s Oil Fields Add Fuel to the Fire
Offshore drilling in the United States federal waters has caused the most environmentally destructive disasters in North America. Yet, new policy is pushing for the expansion of offshore drilling, particularly off the coast of California.
Offshore Drilling History
In 1969, Union Oil’s offshore rig Platform A had a blowout that leaked 100,000 barrels into the Santa Barbara Channel, one of the most biologically diverse marine environments in the world. The spill lasted ten days and killed an estimated 3,500 sea birds, as well as an untold number of marine mammals. Unbelievably, the Santa Barbara spill is only the third largest spill in U.S. waters. It follows the 1989 Exxon Valdez and the 2010 Deepwater Horizon spills. These incidents keep getting bigger.
More offshore drilling means a higher risk of catastrophe, additional contamination of air and water locally, and more greenhouse gas emissions globally.
Federal Moratorium on California Offshore Leases
Up until the beginning of 2018, further oil and gas development using offshore oil rig platforms seemed quite unlikely. After the 1969 oil spill from Platform A and the subsequent ban on further leasing in state waters, the risk of another devastating oil spill was too large for even the federal government to consider new leases. The fact that the moratorium lasted through 16 years of Bush presidencies is truly a victory. Across the aisle, expanding offshore operations has been opposed. In Florida, even Republican Governor Rick Scott teamed up with environmental groups to fight the Department of Interior’s recent sales of offshore leases.
Trump’s New Gas Leasing Program
Now, the U.S. Bureau of Ocean Energy Management (BOEM) is preparing a new 2019-2024 national Outer Continental Shelf (OCS) oil and gas leasing program to replace the existing 2017-2022 program. This is an unusual practice, and part of Trump’s America-First Offshore Energy Strategy. The Trump administration opened up most of the US coastal waters for new oil and gas drilling with a recent draft proposal offering 47 new offshore block lease sales to take place between 2019 and 2024.
Where might these new leases occur?
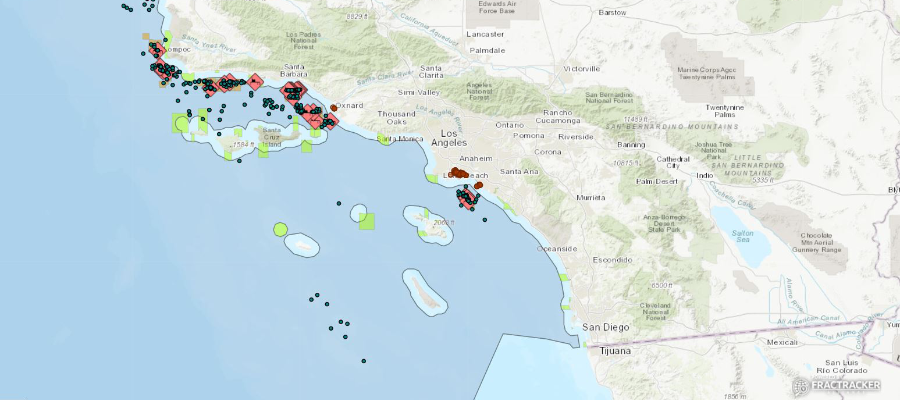
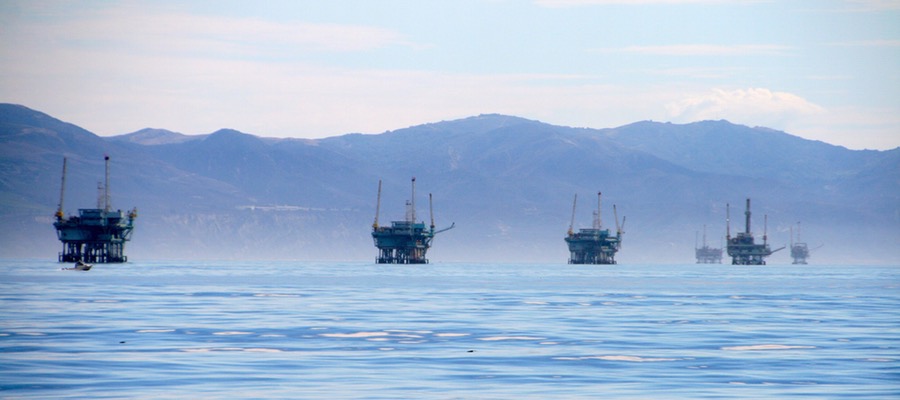
The offshore federal waters that are open for oil and gas leases are shown in dark blue in the map below (Figure 1). Zoom out to see the extent.
Southern California has a legacy of oil extraction, particularly Los Angeles. It’s not just the federal government that is keen on continuing this legacy. While the state has not permitted the leasing of new blocks in offshore waters, Governor Brown’s policies have been very friendly to the oil and gas industry. According to Oil Change International’s Sky’s the Limit report: “Under the Brown administration, the state has permitted the drilling of more than 20,000 new wells,” including 5,000 offshore wells in state waters. About 2,000 of these offshore wells have been drilled since 2012.
Southern California is the main target for future offshore leasing. The Monterey Shale formation, which underlies the city of Los Angeles and expands north offshore to the Ventura Coast, is thought to contain the largest conventional oil plays left IN THE WORLD! The map above shows the locations of state and federal offshore oil and gas wells and the rigs that service them. It also shows historical wells off the coast of Northern California.
Northern California, both onshore and offshore, sits on top of major reserves of natural gas, which may also be developed given the political climate. With an increase in the price of natural gas, operators will be developing these gas fields. Some operators, such as Chevron, have already drilled natural gas wells in northern California, but have left the wells “shut in” (capped) until production becomes more profitable.
FracTracker, in collaboration with Earthworks, recently teamed up with the Center for Biological Diversity and Greenpeace International to get up close to offshore oil rigs. As a certified Optical Gas Imaging Thermographer, Kyle Ferrar (Western Program Coordinator for FracTracker Alliance and California Community Empowerment Project Organizer for Earthworks), took footage of the offshore oil rigs.
Using infrared technology, we were able to visualize and record emissions and leaks of volatile hydrocarbons and other greenhouse gases coming from these offshore sites. We documented many cases of intense flaring from the rigs, including several cases where the poorly burning flare allowed hydrocarbons to be leaked to the atmosphere prior to complete combustion of CO2.
Below you can view a compilation of the footage we were able to capture from small pontoon boats.
Conclusion
FracTracker has looked at offshore oil and gas drilling from many different angles. We have looked to the past, and found the most egregious environmental damages in U.S. history. We have analyzed the data and shown where, when, and how much offshore drilling is happening in California. We have demonstrated that much of the drilling and many of the proposed leases are in protected and sensitive habitats. We have looked at policy and found that both Governor Brown and President Trump are aligned to promote more oil and gas development. We have even looked at the rigs in person in multiple spectrums of light and found that these operations continuously leak and emit greenhouse gases and other air toxins.
No matter which way you look at offshore oil and gas drilling, it is clearly one of the most threatening methods of oil and gas extraction in use today.
By Kyle Ferrar, Western Program Coordinator, FracTracker Alliance
https://www.fractracker.org/a5ej20sjfwe/wp-content/uploads/2018/10/CA-Offshore-Feature.png400900Kyle Ferrar, MPHhttps://www.fractracker.org/a5ej20sjfwe/wp-content/uploads/2025/09/2025-Wordmark-Logo.pngKyle Ferrar, MPH2018-11-05 14:32:422021-04-15 14:57:10The Feds Trump California’s State Ban on Offshore Oil Drilling
WASHINGTON, DC – As oil and gas representatives descend on Pittsburgh this week for the annual Shale Insight conference, four advocates working to protect their communities from the harms of oil and gas development have been selected to receive the 2018 Community Sentinel Award for Environmental Stewardship, coordinated by FracTracker Alliance:
Ellen Gerhart – Pennsylvania
Natasha Léger – Colorado
Rebecca Roter – Pennsylvania, now Georgia
Youth award: Nalleli Cobo – California
This year’s recipients have founded grassroots organizations to protect communities from nearby drilling, paired traditional advocacy with scientific savvy, protested pipelines on land taken by eminent domain, and organized to stop urban drilling despite persistent health problems related to the drilling activity.
“The impacts of the oil and gas industry are visible across the United States, but hope abounds in the volunteers working in their communities and cherished places to document, report, and confront fossil fuel harms,” remarked Brook Lenker, Executive Director of FracTracker Alliance. “We are proud to honor Ellen, Natasha, Rebecca, and Nalleli this year, whose noble actions exemplify the transformative power of caring, committed, and engaged people.”
These four steadfast advocates were nominated by peers and selected by a committee of community defense leaders: Raina Rippel of Southwest Pennsylvania Environmental Health Project (Pennsylvania); Dan Shaffer of Allegheny-Blue Ridge Alliance and Dominion Pipeline Monitoring Coalition (Virginia); Dan Xie of Student PIRG (Florida); Jill Hunkler- Native American activist (Ohio); and Elena Sorokina of Crude Accountability (Washington, DC).
The award recipients will each receive $1,000 for their efforts and be recognized at an evening reception at the Renaissance Pittsburgh Hotel in Pittsburgh, Pennsylvania on Monday, November 26, 2018. The reception will also recognize heroes of the movement who recently passed away. Purchase tickets ($40).
This year’s major Community Sentinel sponsors include 11th Hour Project, The Heinz Endowments, and Foundation for Pennsylvania Watersheds. Award partners (to date) include Allegheny-Blue Ridge Alliance, Breathe Project, Center for Coalfield Justice, Crude Accountability, Earthworks, Food & Water Watch, Halt the Harm Network, Ohio Valley Environmental Coalition, Pipeline and Property Rights Center, Save the Hills Alliance, Sierra Club, Southwest Pennsylvania Environmental Health Project, and Viable Industries. View current sponsors and partners.
To learn more about the fourth annual Community Sentinel Award for Environmental Stewardship and to purchase tickets to the reception on November 26th, please visit: fractracker.org/sentinel-award.
# # #
About FracTracker Alliance
FracTracker Alliance is a national non-profit with regional offices in California, New York, Ohio, Pennsylvania, Washington DC. The organization’s mission is to study, map, and communicate the risks of oil and gas development to protect our planet and support the renewable energy transformation. Learn more at fractracker.org.
Press Contact For Release on October 24, 2018
Samantha Rubright malone@fractracker.org (preferred)
(202) 630-6426
https://www.fractracker.org/a5ej20sjfwe/wp-content/uploads/2016/06/SentinelAward-Feature.jpg400900FracTracker Alliancehttps://www.fractracker.org/a5ej20sjfwe/wp-content/uploads/2025/09/2025-Wordmark-Logo.pngFracTracker Alliance2018-10-24 10:14:212021-04-15 14:57:35Four environmental stewards receive the 2018 Community Sentinel Award
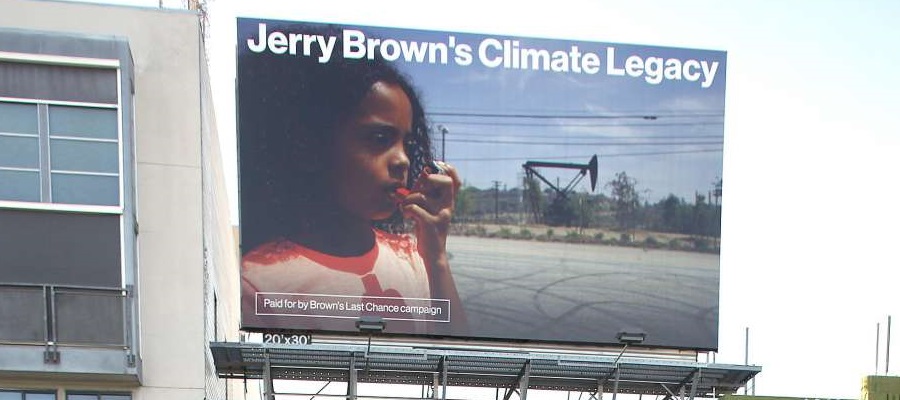
California has become a battleground for real climate action. The state Governor, Jerry Brown prides himself in his own climate leadership, and California has pushed EU nations and countries worldwide to take climate change seriously. As a final tribute to his own tenure as a term-limited governor, Brown has organized and hosted a Global Climate Action Summit, September 12-14th. The summit convenes an international invitation list of “climate leaders” to, in their words:
“Take Ambition to the Next Level.” It will be a moment to celebrate the extraordinary achievements of states, regions, cities, companies, investors and citizens with respect to climate action. It will also be a launchpad for deeper worldwide commitments and accelerated action from countries—supported by all sectors of society—that can put the globe on track to prevent dangerous climate change and realize the historic Paris Agreement.
Meanwhile, frontline communities, community organizers, and grassroots organizations contest the perspective that real change has been made. While investors and green capitalists celebrate, frontline communities fight daily for clean air and water. In solidarity with and led by frontline communities, activists have protested the summit, in an attempt to hold policy makers accountable to those most affected by the fossil fuel industry.
Rise for Climate, Jobs, and Justice
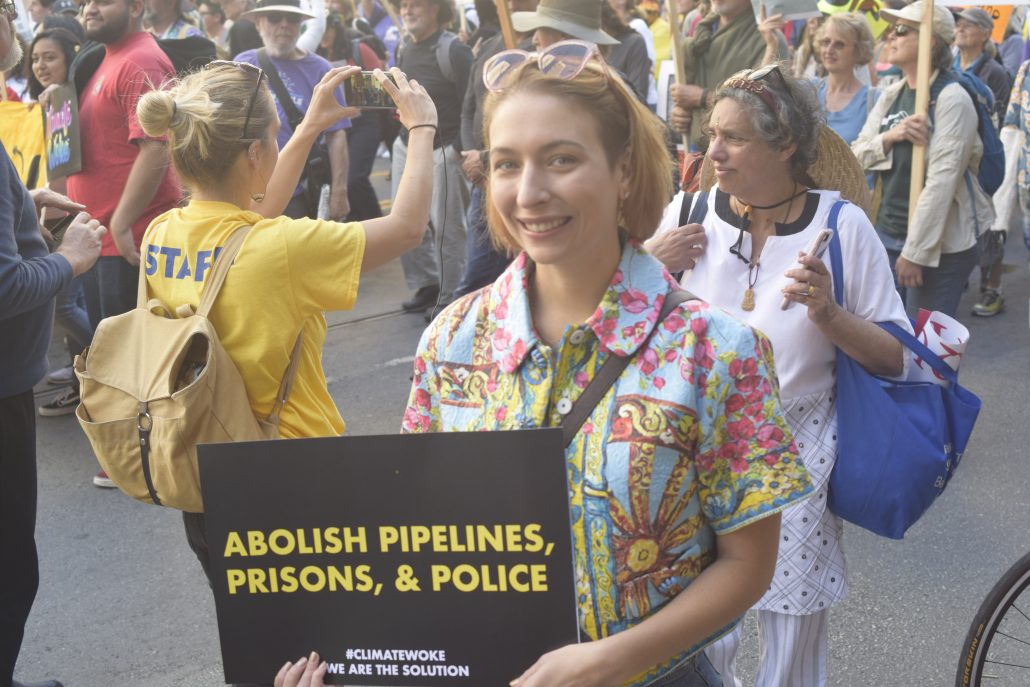
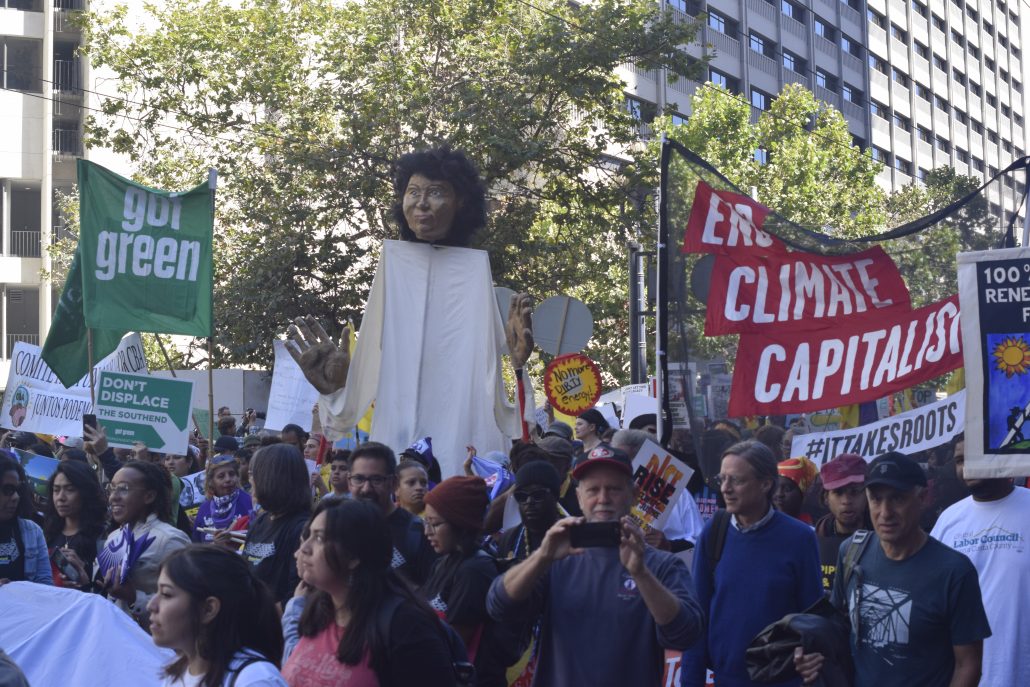
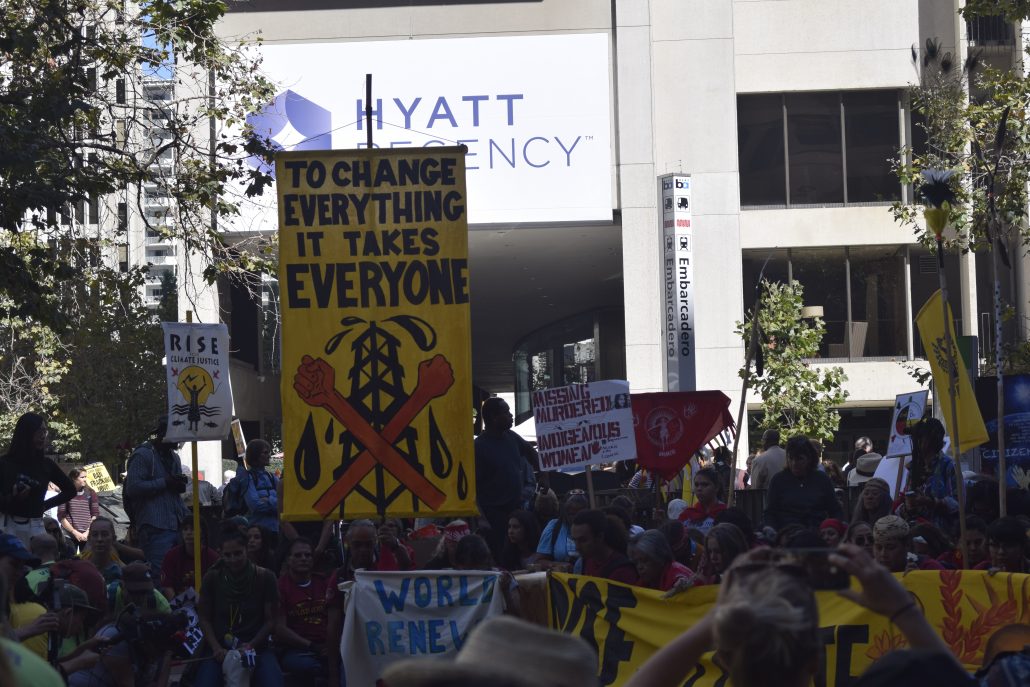
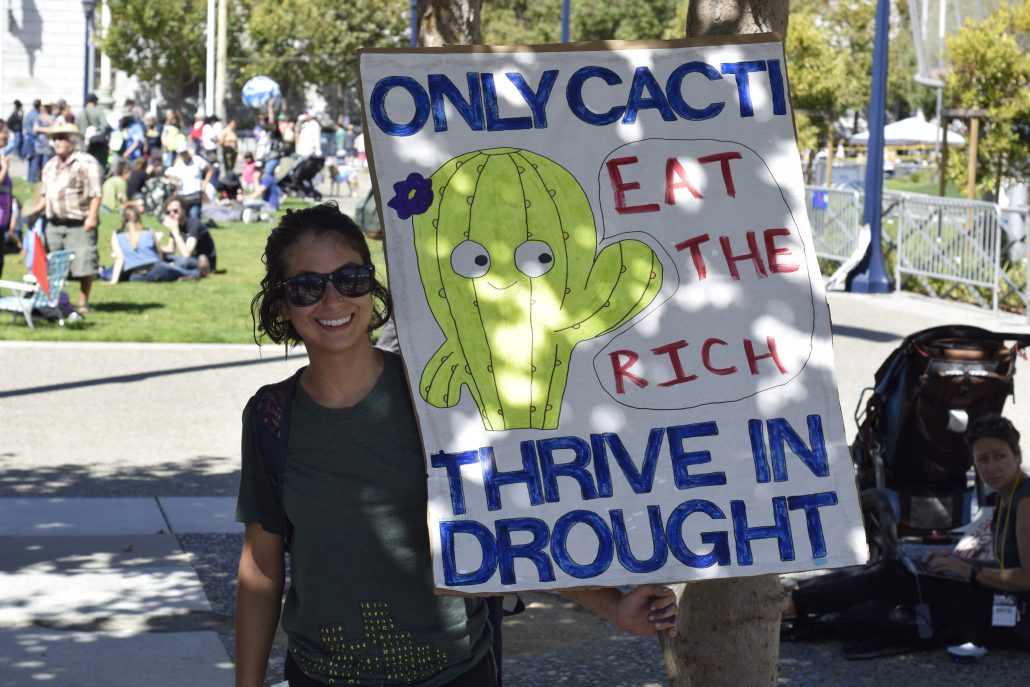
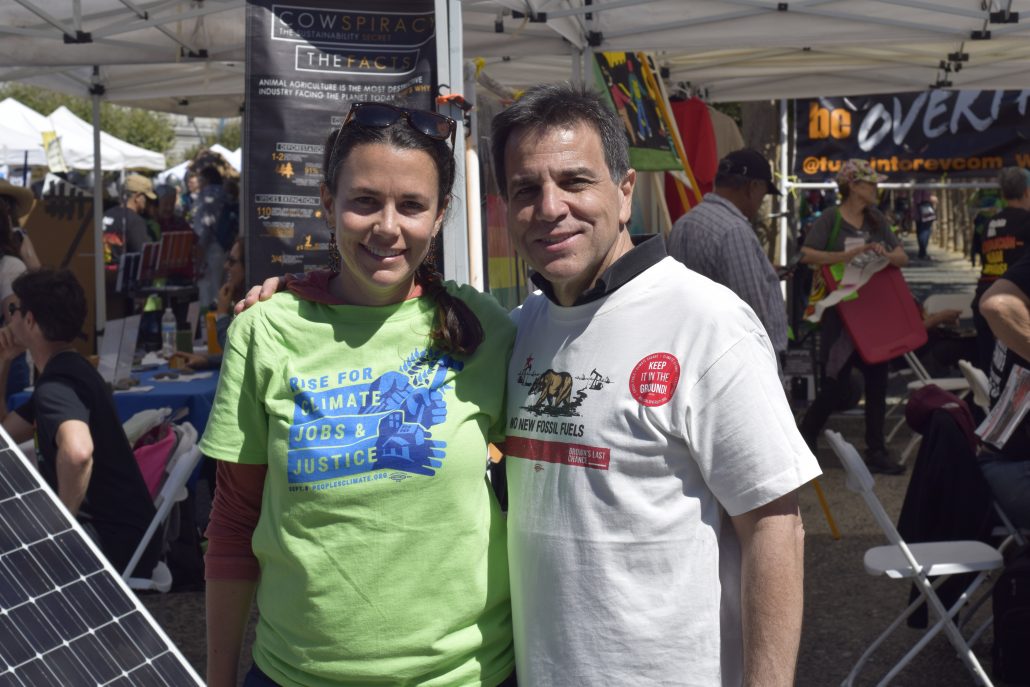
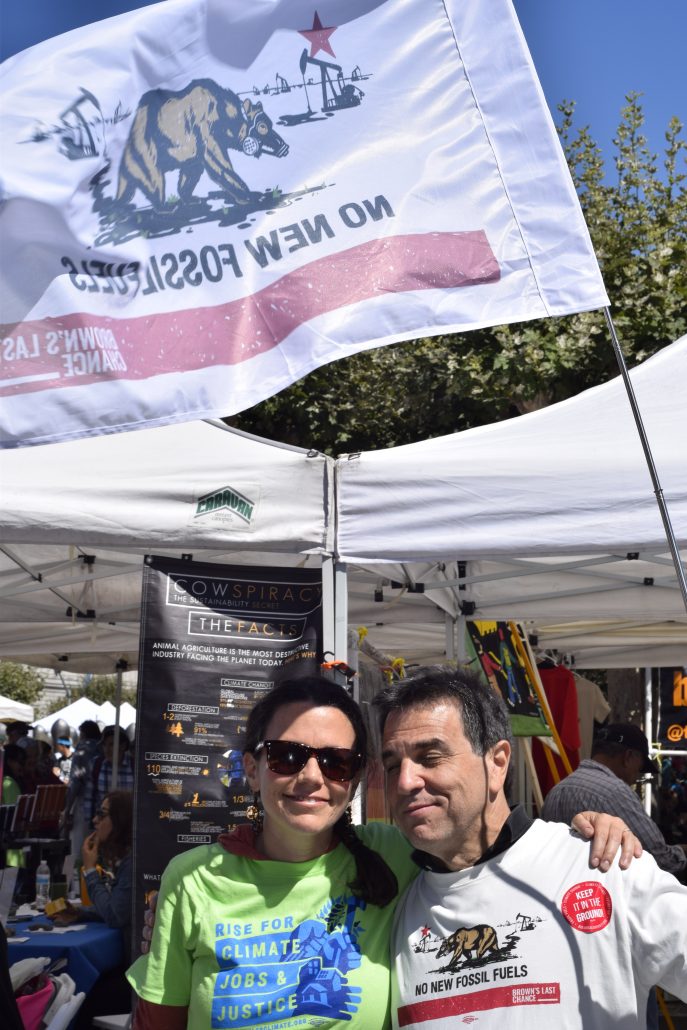
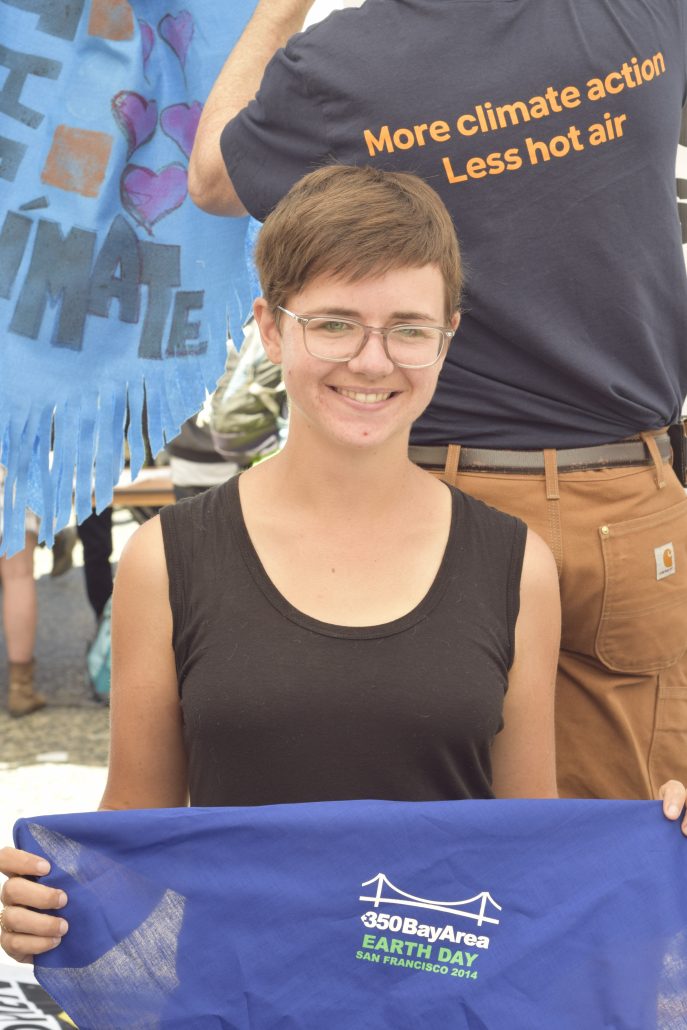
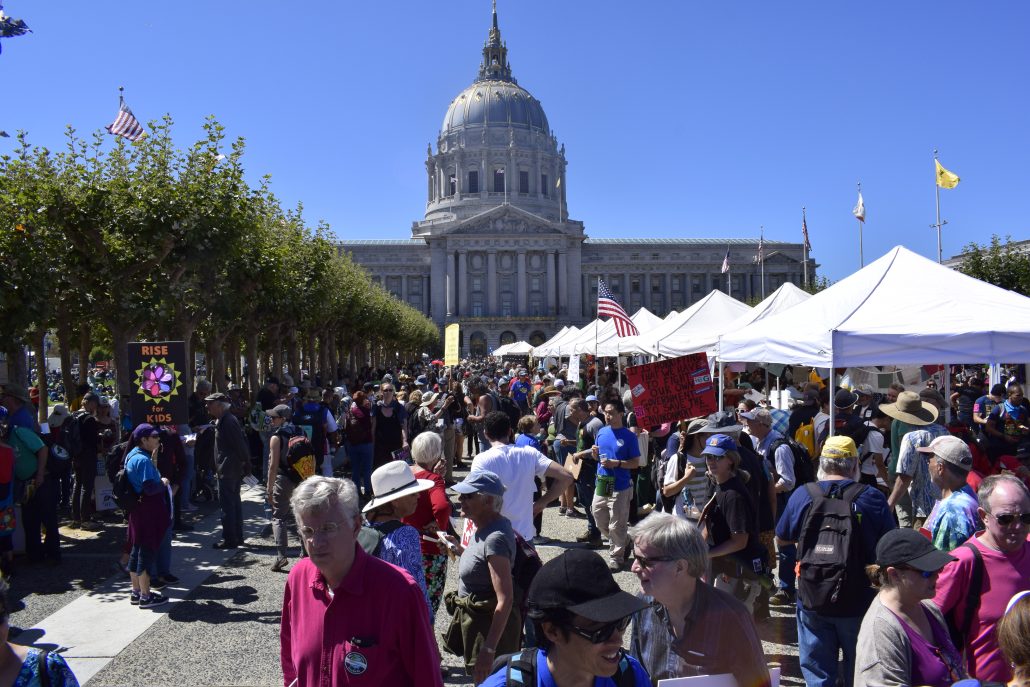
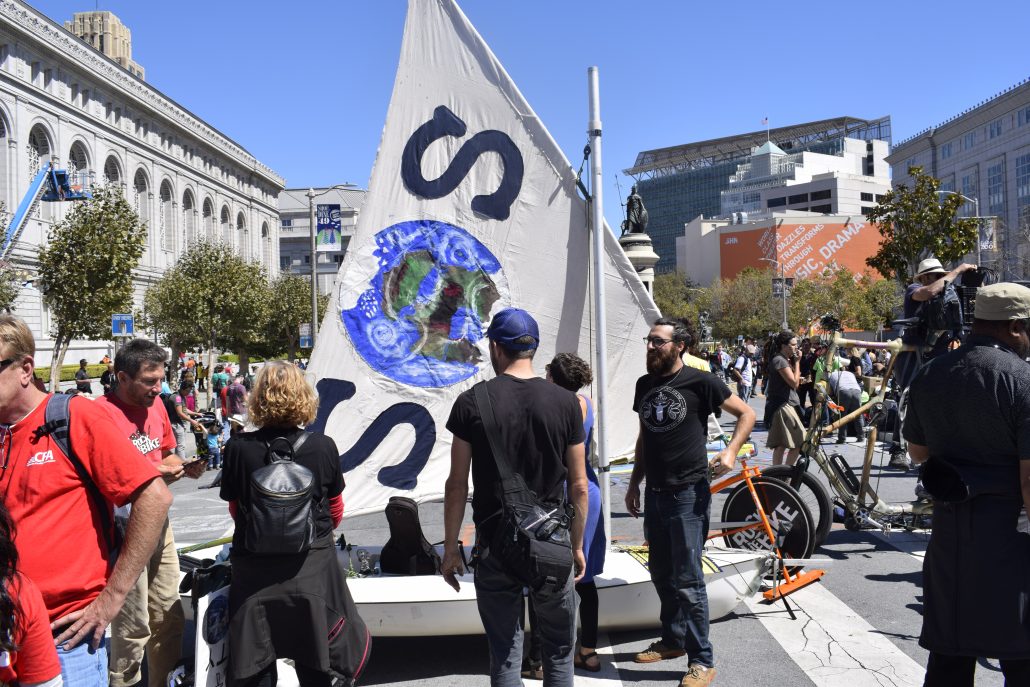
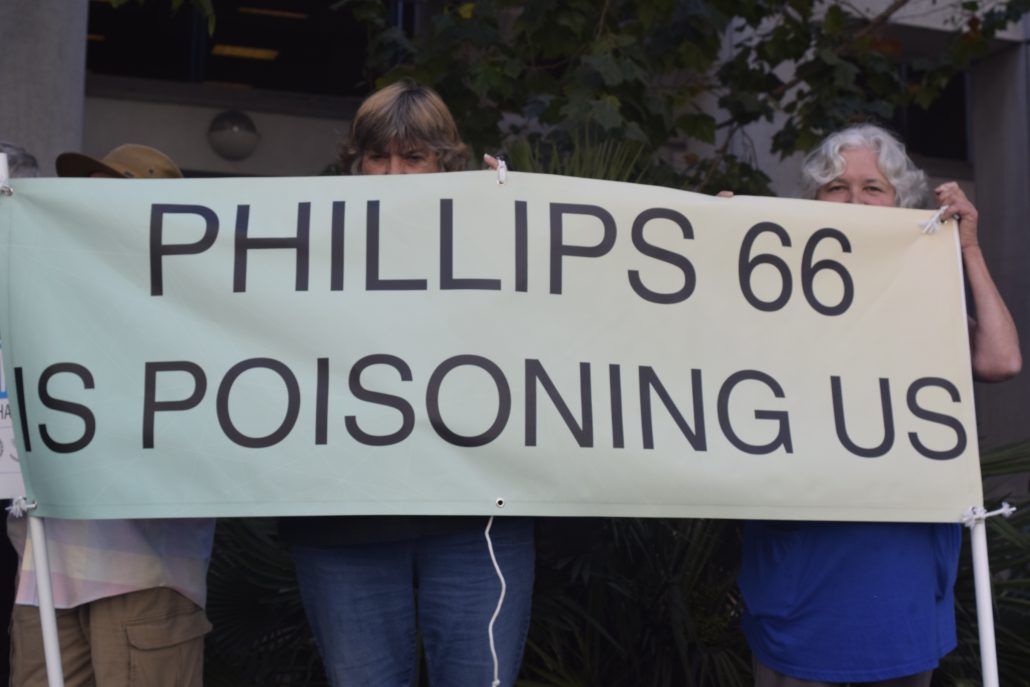
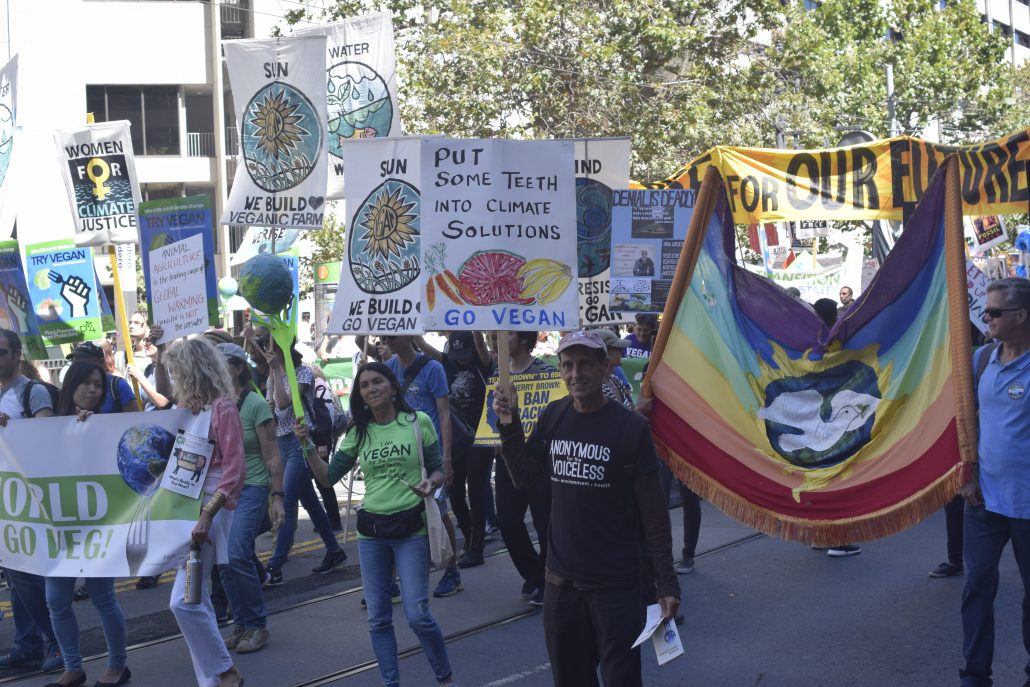
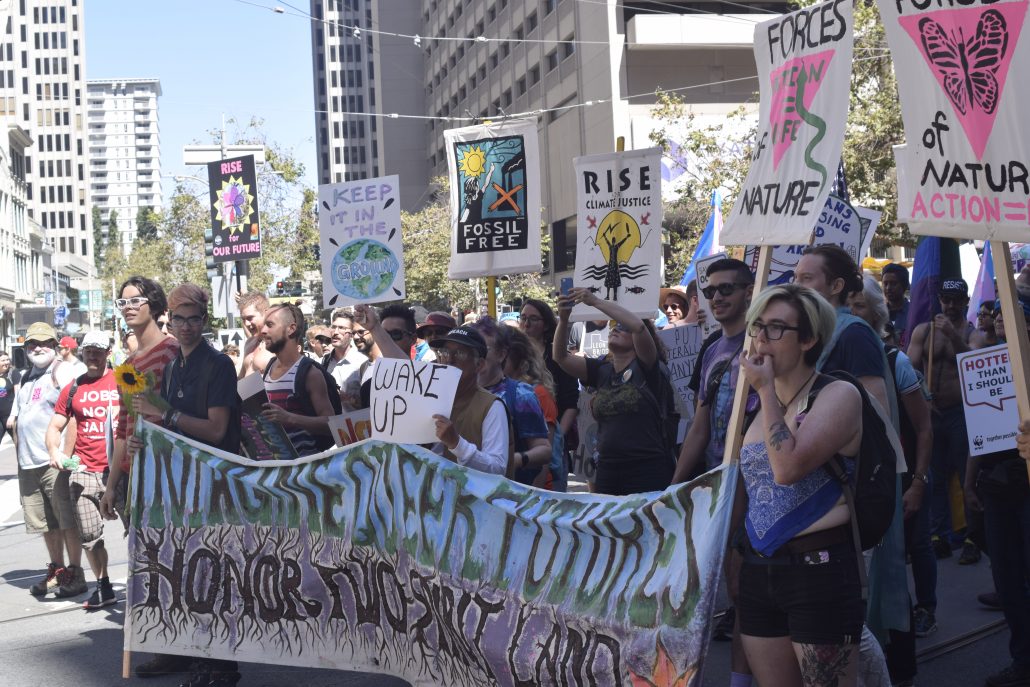
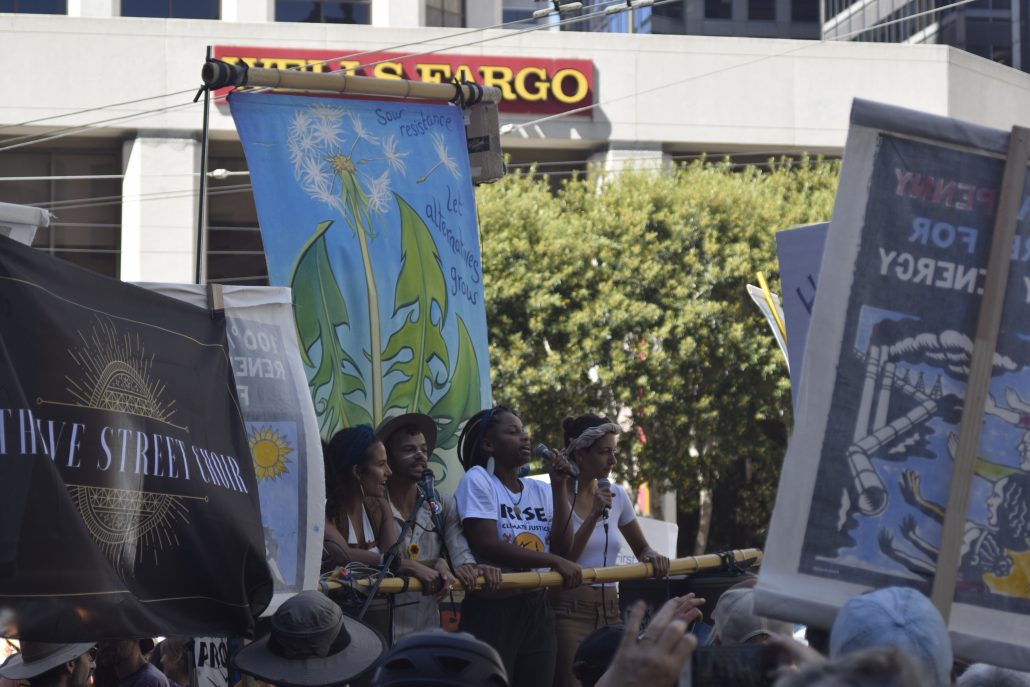
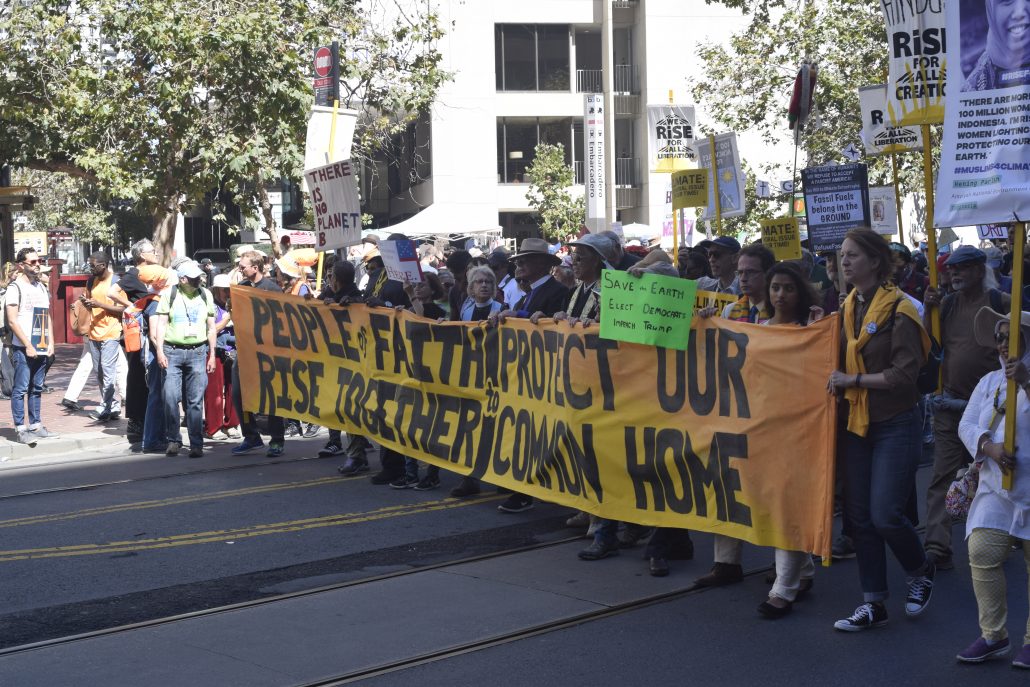
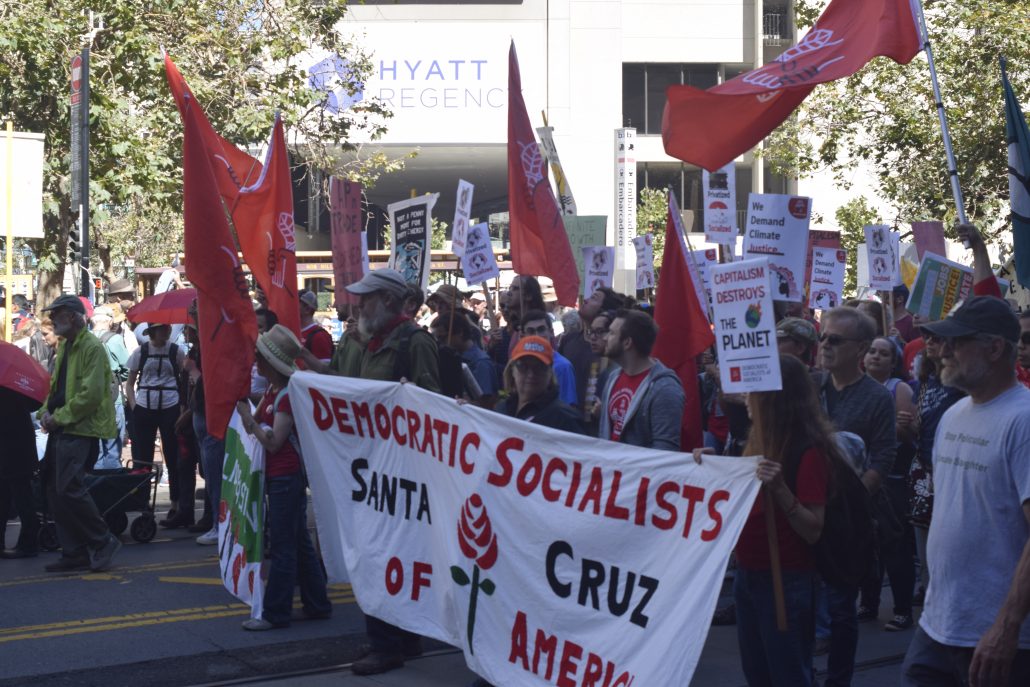
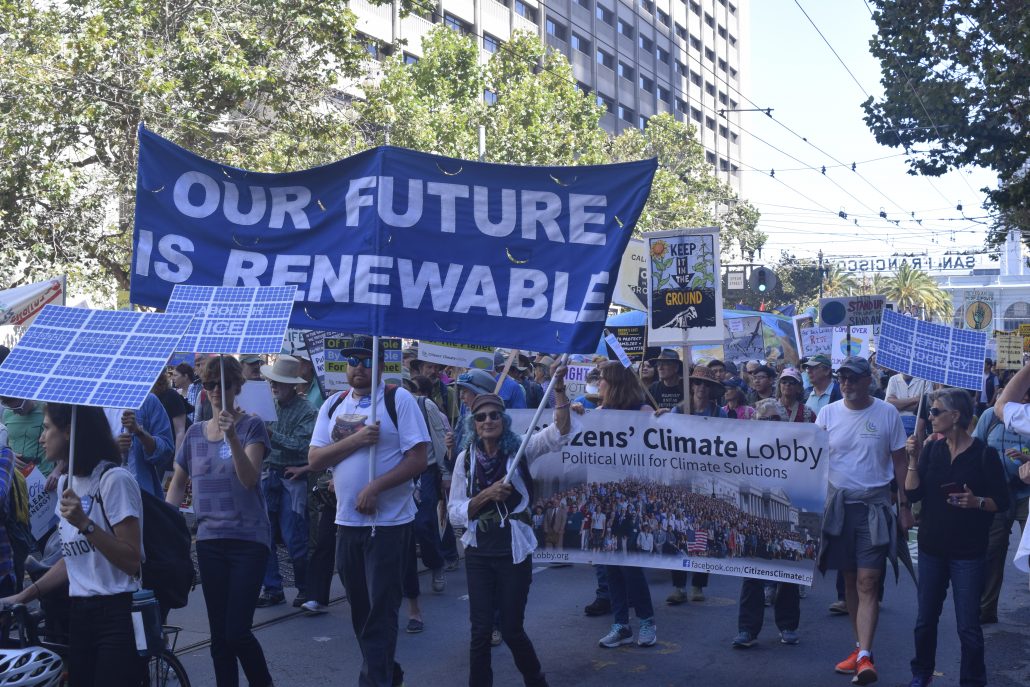
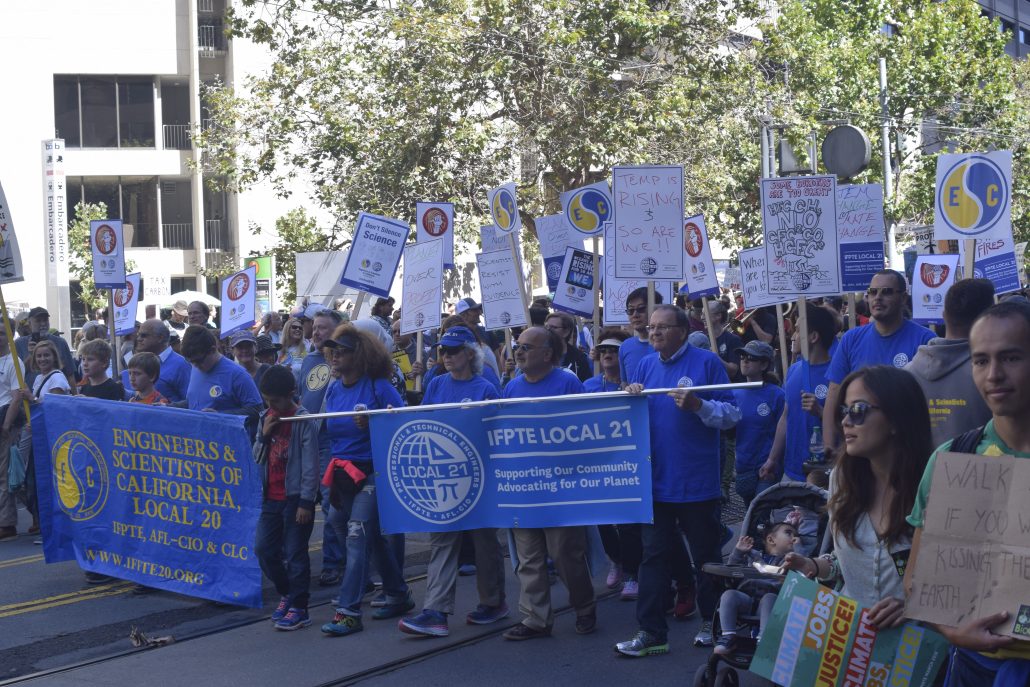
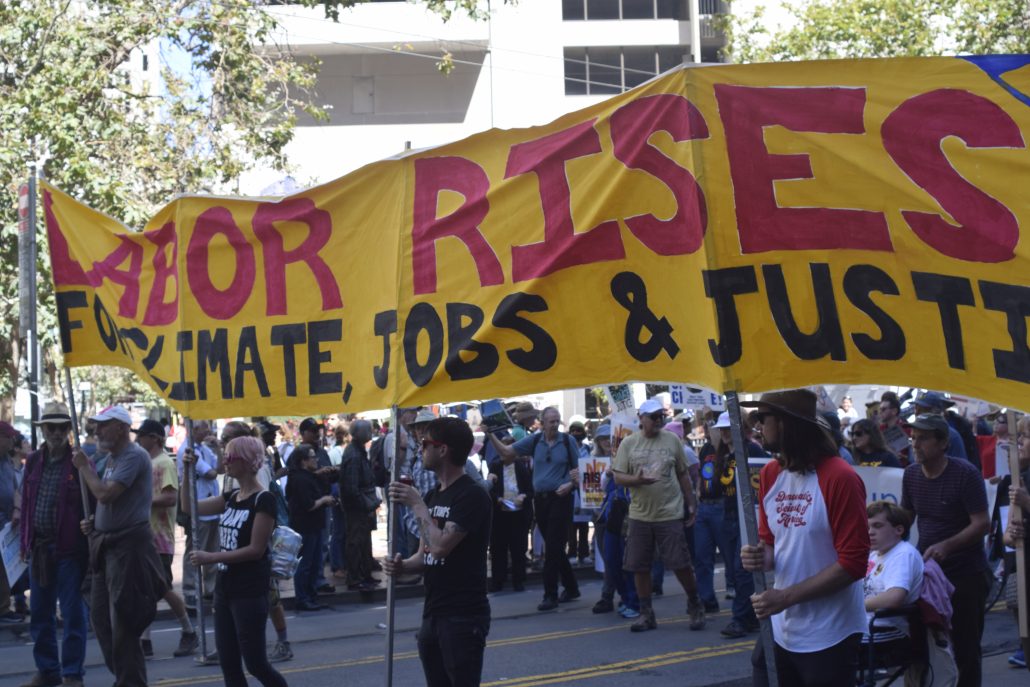
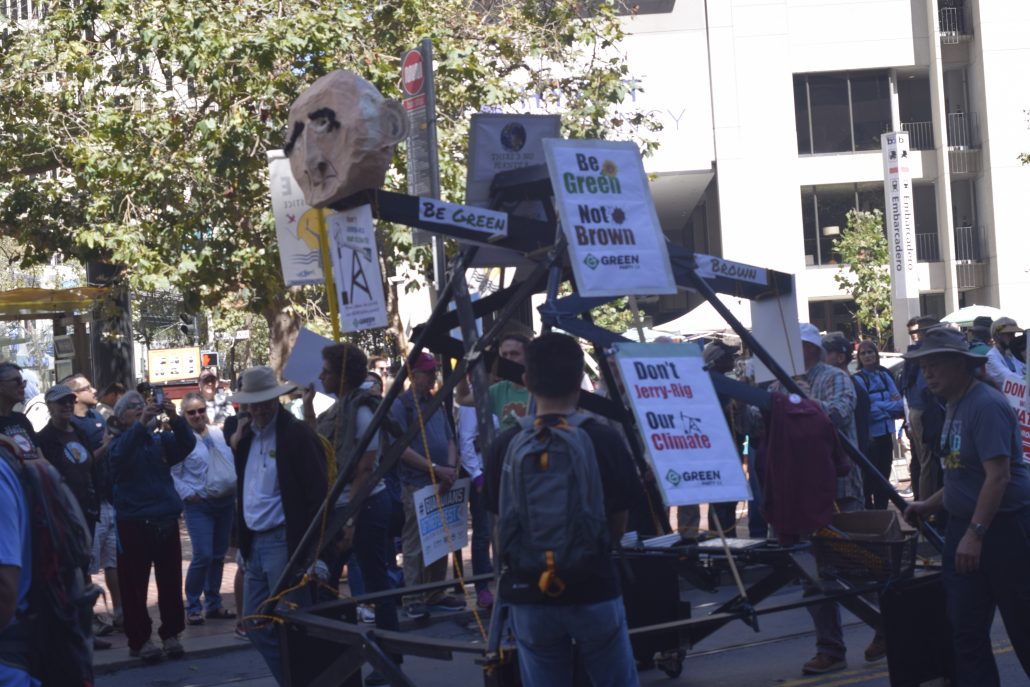
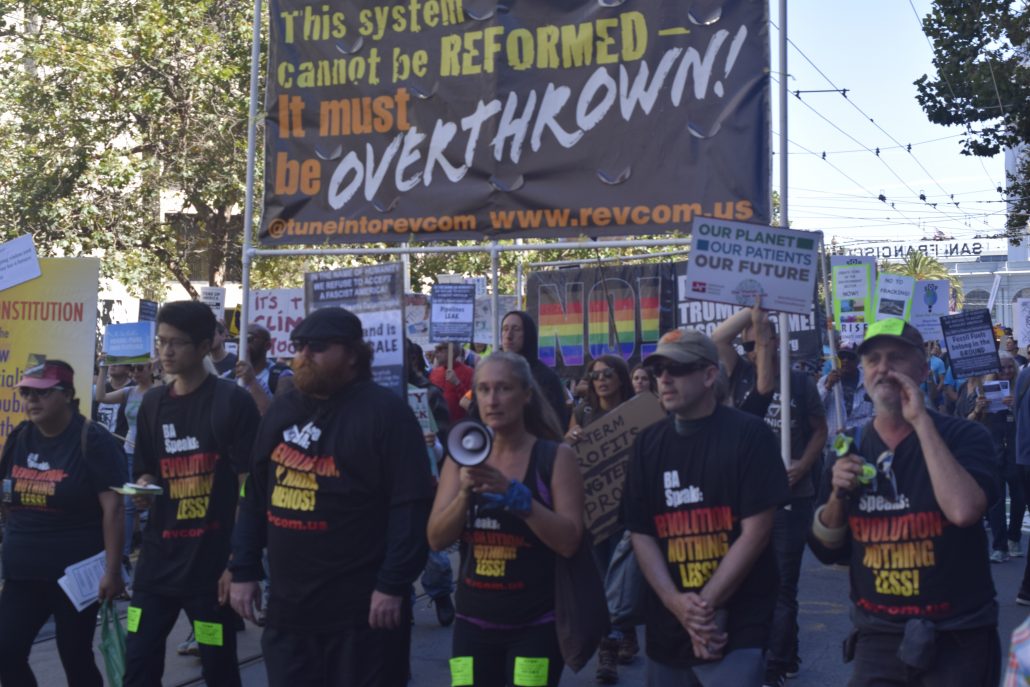
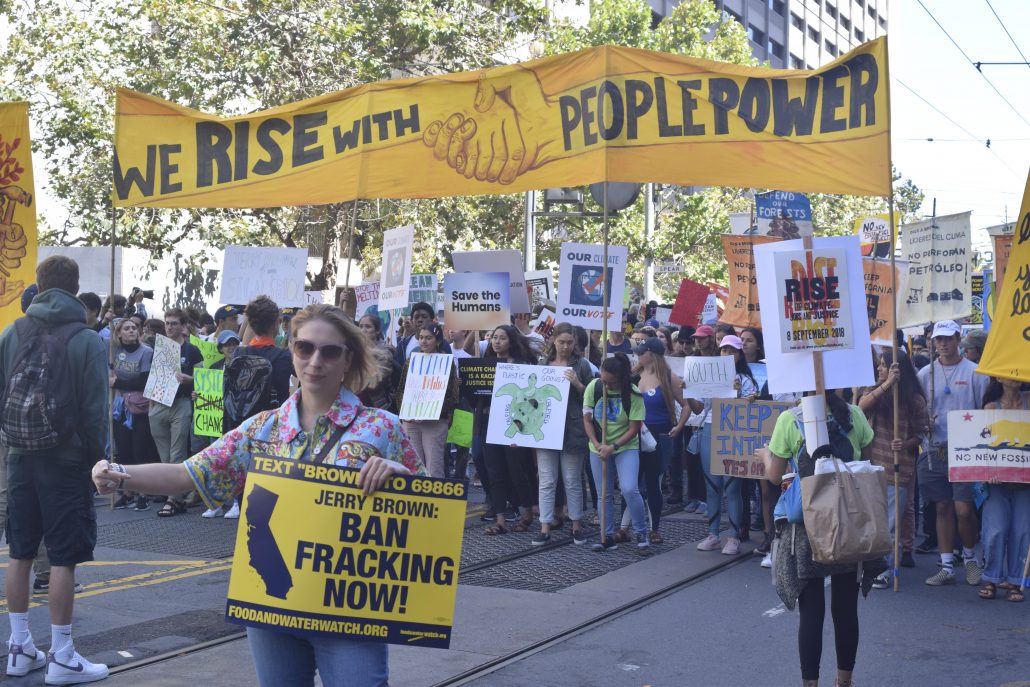
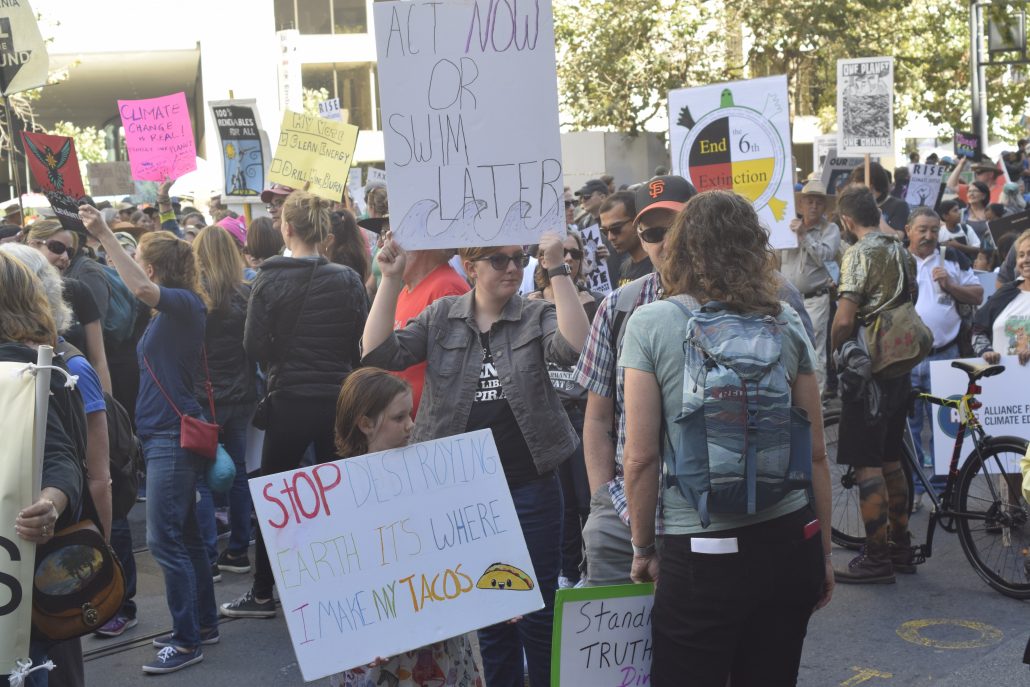
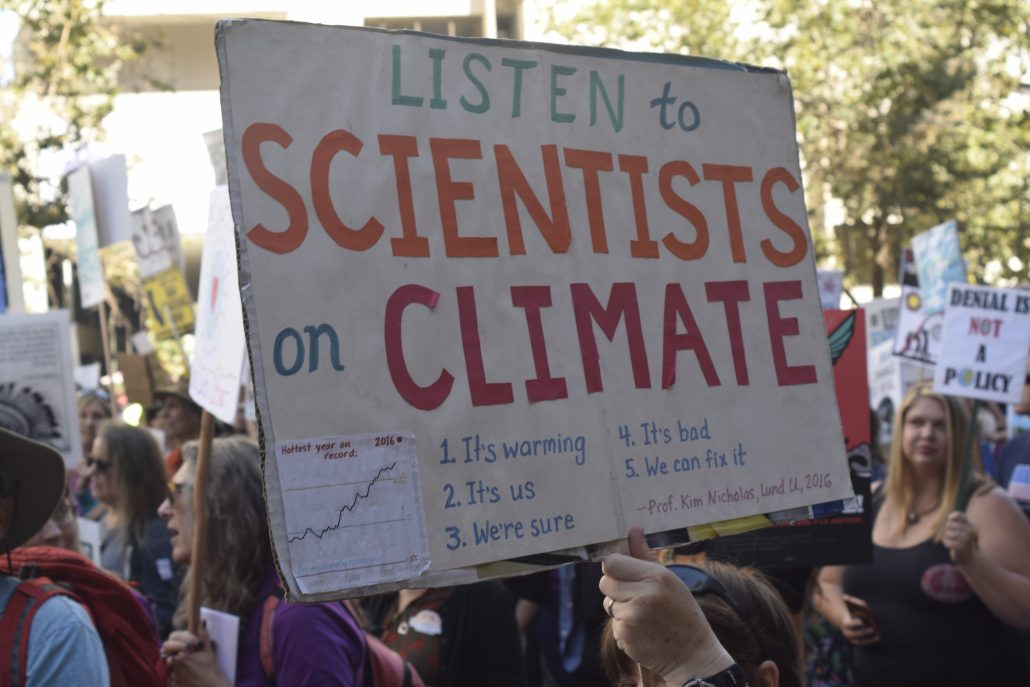
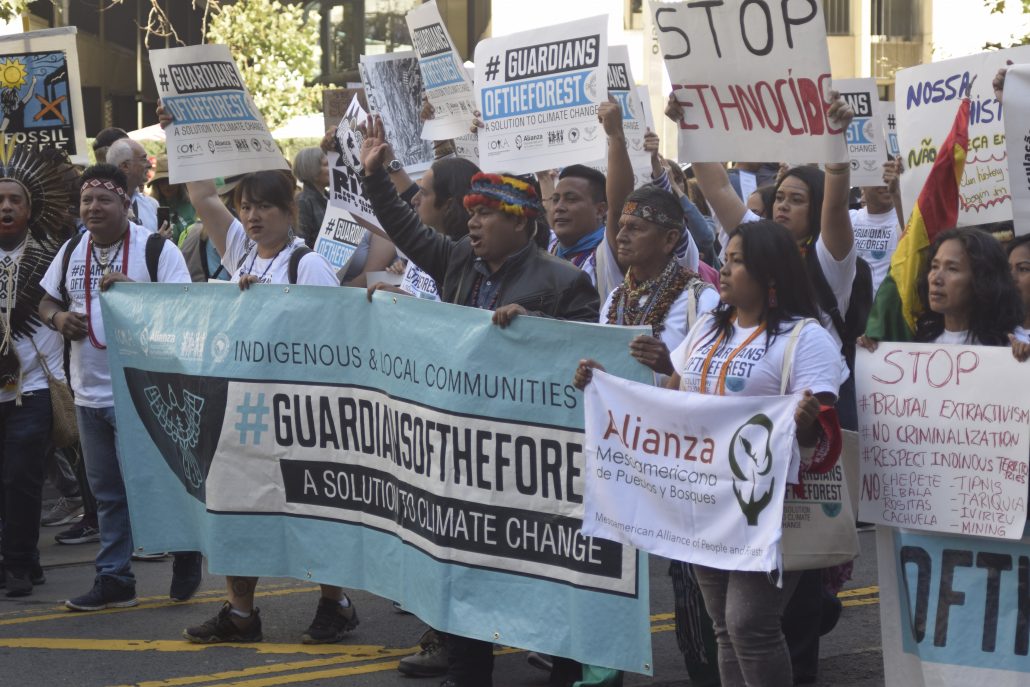
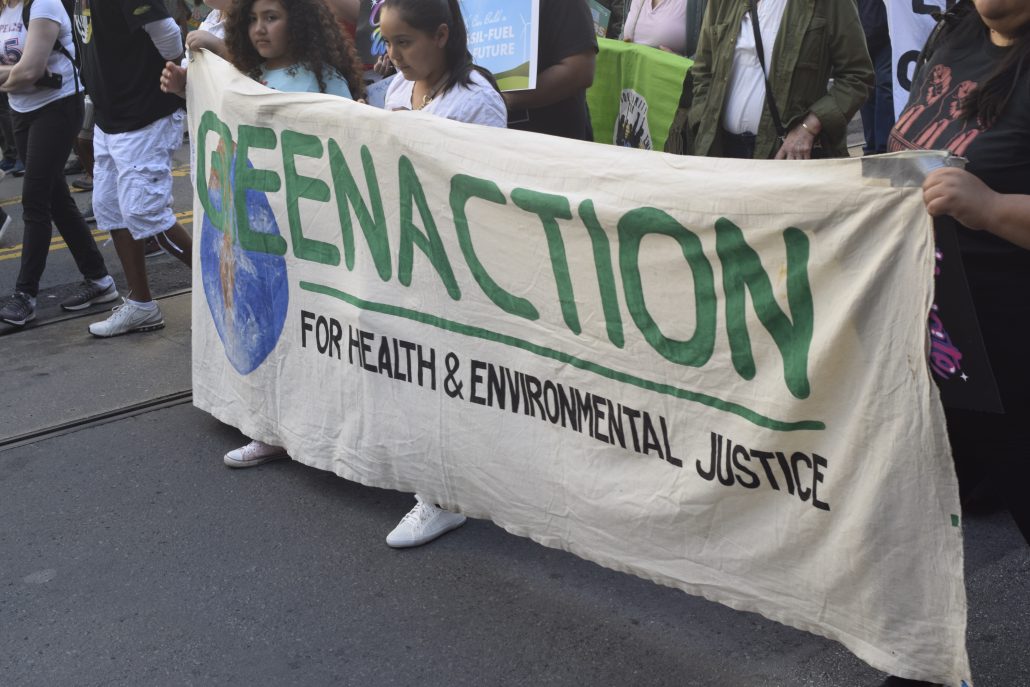
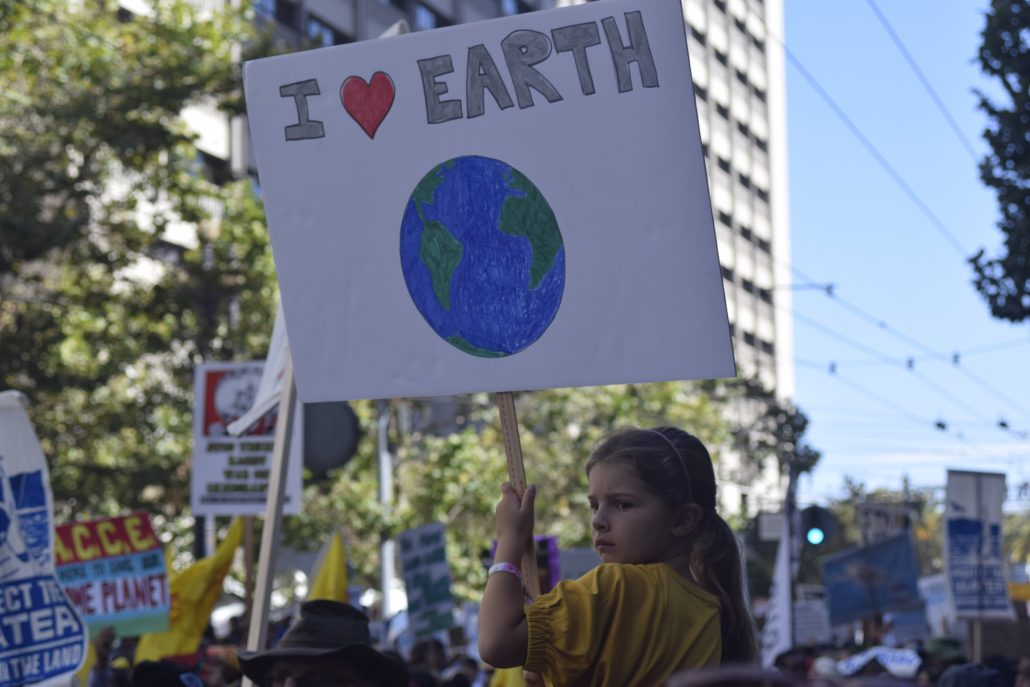
One quarter of a million people worldwide, and well over 30,000 in San Francisco hit the streets during the Rise for Climate last Saturday, September 8th. With over 900 actions taking place simultaneously people worldwide demanded real climate action from their local leaders. FracTracker Alliance staff helped coordinate and participated in events nationwide.
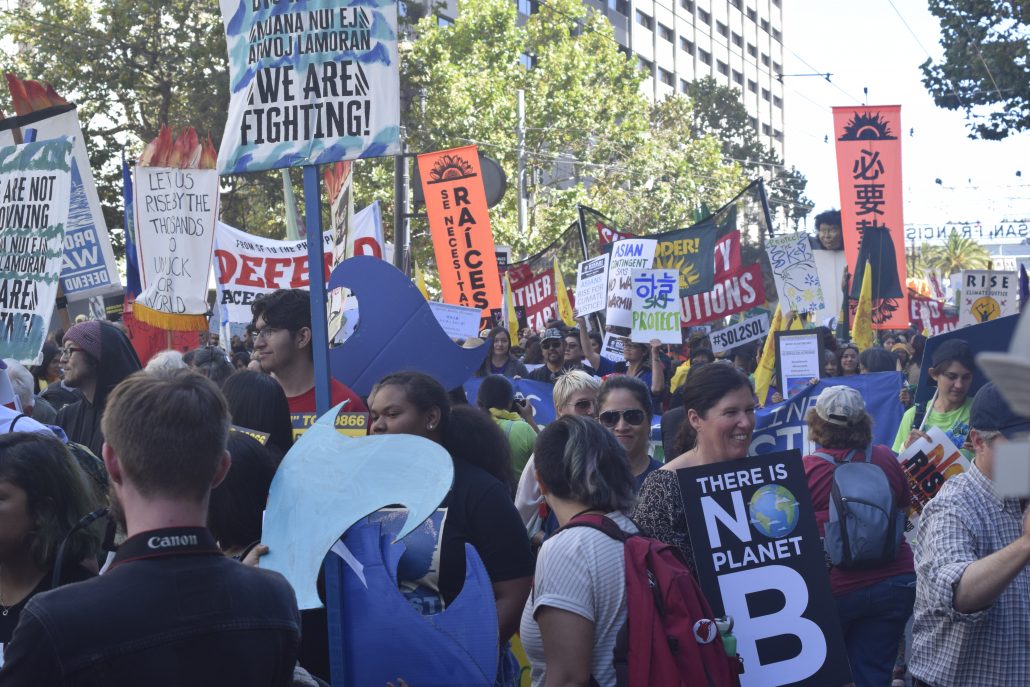
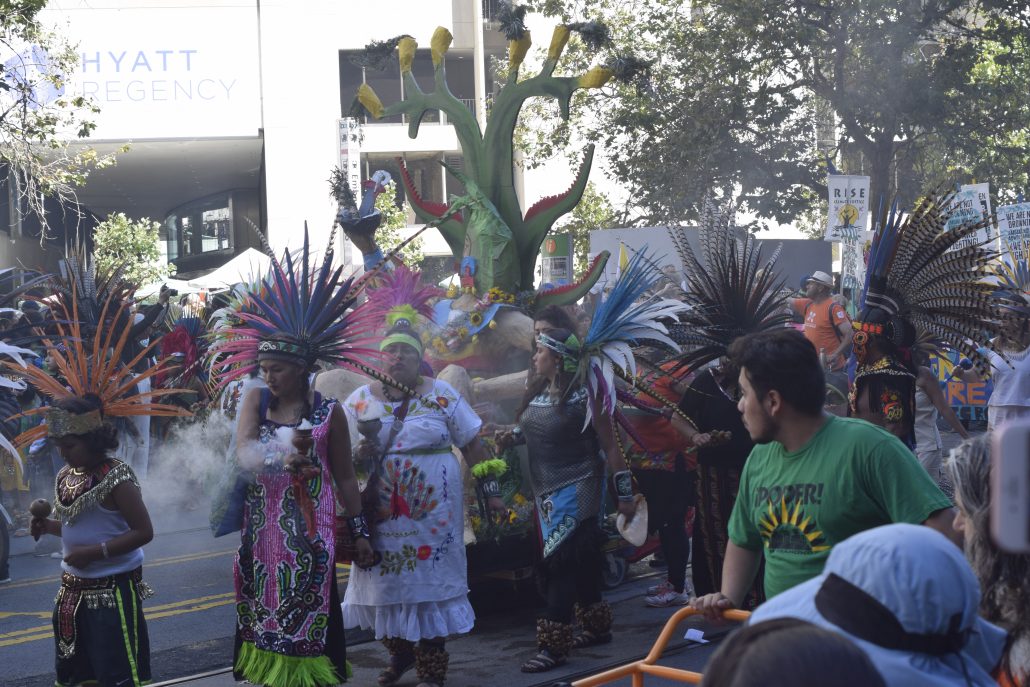
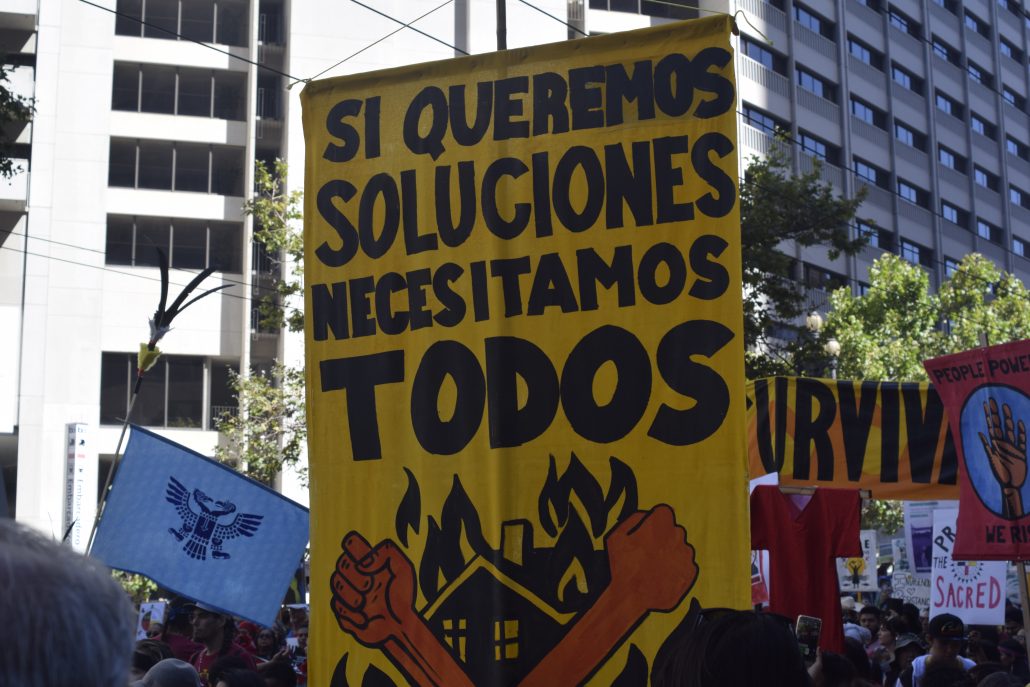
In San Francisco, the march was led by members of the Indigenous community, making up the Indigenous Bloc, on the frontlines of the action. The day officially started with prayers from Indigenous leaders and a moment of silence for Indigenous Peoples that have been most harmed by the effects of climate change. Dozens of various other movements followed the Indigenous Bloc in a parade of support. FracTracker took the opportunity to document this monumental event, and photos from the march are shown below.
March Photos
For California and international “climate leaders” in attendance, Rise kicked off a long week of climate action culminating with the Global Action Climate Summit. The week is full of activities geared towards movement building, including the Solidarity to Solutions Summit (#sol2sol) by It Takes Roots; Women’s Assembly for Climate Justice, hosted by Women’s Earth and Climate Action Network; and mass actions including a march and occupation of the Global Climate Action Summit!
SB100
To mark such a momentous movement, the Brown administration signed a new bill into law, SB100. The new law, authored by Kevin De León (D-Los Angeles), pledges that all of California’s electricity will come from clean power sources by 2045. Brown said, “California is committed to doing whatever is necessary to meet the existential threat of climate change.” This is the most ambitious state climate policy in the U.S. The legislation barely passed the state Legislature after nearly two years of debate, with opponents arguing that it would lead to higher electric bills for all Californians.
Opposition from Eco-Activists
In opposition to the feel-good, pat-yourself-on-the-back feelings from delegates at the summit, frontline communities and activists respond that the SB100 legislation does nothing to stop harms to frontline communities caused by extraction and the supply side of the fossil fuel economy. The Against Climate Capitalism campaign is a coalition of Diablo Rising Tide teamed up with Idle No More SF Bay, the Ruckus Society, It Takes Roots, Indigenous Environmental Network and the Brown’s Last Chance. Members of the coalition have been outspoken proponents organizing in support of real climate leadership. The coalition is pushing for Governor Jerry Brown and the California legislature to end the extraction of new fossil fuels in California. The green groups making up these larger coalition networks encompass a broad range research and advocacy groups, from international groups like Greenpeace to local grassroots movements from Los Angeles and California’s Central Valley. FracTracker Alliance is also a campaign member.
The goal of the campaign is to keep fossil fuels in the ground, and supports a just transition from a fossil fuel economy to clean energy sources. A petition to pressure California Governor Jerry Brown to end fossil fuel extraction can be found on their website. The California legislature and the Brown administration has consistently failed to address the impacts of extraction in its own backyard. While frontline communities are suffering, the Brown administration continues to take the easy way out with future legislation such as SB100, which does nothing to address the environmental justice spector of actual oil drilling and production. In response to SB100, the campaign has issued response:
Governor Brown has consistently failed to address the supply side of oil and the drilling in California, which is an indispensable step to avoid the worst effects of climate destruction.
Some 5.4 million Californians live within a mile of at least one oil or gas well, and this includes hundreds of thousands of children. Many suffer illnesses from toxic exposure and cannot wait for action.
Brown’s failure to act on this issue is a massive moral failure from which no bill signing can distract. Despite his signing of an important and historical bill he did nothing to draft or support, Governor Brown can expect to be greeted with energetic and committed protest at the Global Climate Action summit this week.
With these poignant criticisms, it begs the question; how can Governor Jerry Brown continue to ignore the actual cause of climate change? Brown has passed legislation ensuring that everyday Californians will bear the costs for clean energy utilities, but has done nothing to hold accountable the actual culprits responsible for climate change, the oil and gas corporations extracting the 5.7 million barrels of oil per year from California soil.
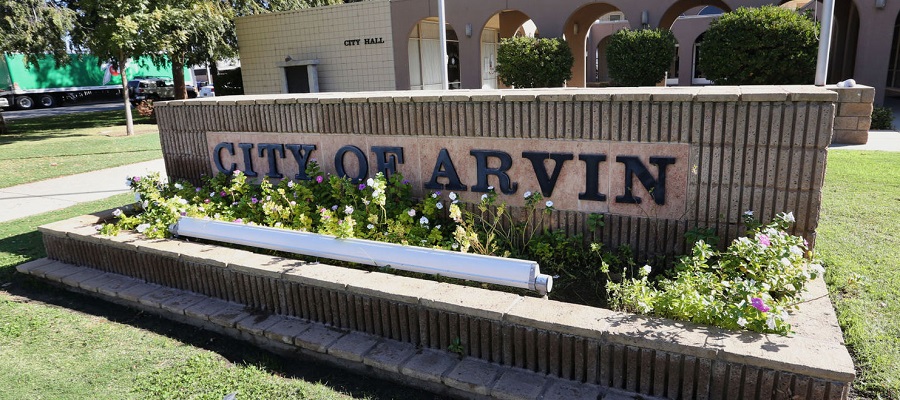
The small city of Arvin, CA has succeeded in taking a brave step forward to protect the public health of its community.
On July 17, 2018 the Arvin City Council voted 3-0 (two members were absent) in support of a setback ordinance. This is the first California oil and gas ordinance that has an actual effect, as it is the first in a region where drilling and fracking are actively occurring. The Arvin, CA setback ordinance prevents wells from being drilled in residential or commercially-zoned spaces. Also, setback distances of 300 feet for new development and 600 feet for new drilling operations have been established for sensitive sites, such as parks, hospitals, and schools.
(To see where other local actions have been taken in California, check out our coverage of local actions and map, which was recently updated.)
More details and maps of the setback ordinance and its development can be found in the initial FracTracker coverage of the proposal, below:
The measure was supported by Arvin Mayor Jose Gurrola. He described the front-lines experience of Arvin citizens:
The road to the update has been difficult for this community. Eight Arvin families were evacuated after a toxic gas leak from an underground oilfield production pipeline located near their homes in 2014. Some have now been re-occupied by concerned residents with no other options; other homes still stand empty. Meanwhile, a short distance away an older pump jack labors day and night next to homes pumping oil mixed with water to a nearby tank. Despite multiple complaints to state agencies of odors and noise by the residents, they are told by the agencies that there is nothing that can be done under the current regulations. The pump jack continues to creak along as children walk nearby on their way to school, covering their faces as the smell occasionally drifts their direction. – Jose Gurrola, Mayor of the City of Arvin
Fugitive Emissions Monitoring
In anticipation of the city council’s vote, FracTracker collaborated with Earthworks and the grassroots organization Central California Environmental Justice Network to visit the urban well sites within the city limits. Using Infrared FLIR technology, the sites were assessed for fugitive emissions and leaks. Visualizing emissions of volatile organic compounds (VOCs) at these sites provides a glimpse to what the community living near these wells are continually exposed. The infrared cameras used in these videos are calibrated to the wavelengths of the infrared spectrum where VOC hydrocarbons of interest are visible.
The map below shows the locations that were visited, as indicated by the three stars. Videos of each site are shown below the map.
In this FLIR video of Sun Mountain Simpson-1, fugitive emissions are obvious. The emissions are coming from the PV vent at the top of the produced water tank. These emissions are a mixture of a variety of volatile organic compounds, such as BTEX compounds and methane. This well site is located between homes, a small apartment complex, and a playground. While on the ground operating the FLIR camera I felt light headed, dizzy, and developed a headache. The emissions were reported to the San Joaquin Valley Air District (SJVAD), who sampled and found VOC concentrations at dangerous levels. The well operator was notified but refused to respond. Unfortunately, because this particular well produces under 50 barrels of oil/day, the site is exempt from any health related emissions regulations.
Sun Mountain Jewett 1-23 Lease
This well site is located near a number of single family homes and next two a park. The well site is also on the future location of the Arvin Community College. The FLIR video below is particularly interesting because it shows fugitive emissions from four different locations. The leaks include one at the well head that is potentially underground, one on separator equipment, and leaks from each of the tank PV hatches. When regulators were notified, they visited the site and fixed two of the leaks immediately. Fugitive emissions from the PV hatches were not addressed because this site is also exempt from regulations.
ABA Energy Corporation Richards Facility Tank Farm
The Richards Facility Tank Farm is a well site located outside the city limits on farmland. The facility is regulated as a point source of air pollution, therefore enforcement action can require the operator to fix leaks even from PV hatches on tanks. This FLIR video shows leaks from PV hatches, and a major leak from a broken regulator valve. A complaint was submitted to the SJVAD, and the operator was required to replace the broken regulator valve.
The city of Los Angeles is considering a 2,500-foot setback safety buffer between residences and oil and gas wells. Support for the proposal is being led by the grassroots group Stand Together Against Neighborhood Drilling (STAND-LA). The push for a setback follows a recent report by the Los Angeles County Department of Public Health. According to Stand LA:
The report, requested by both the Los Angeles County Supervisors and the Los Angeles City Council, outlines the health impacts faced by residents living, attending school or worshiping near one of Los Angeles County’s 3,468 active oil wells, 880 of which operate in the City of Los Angeles.
The Department outlines the clear health impacts on residents living near active oil wells, including: adverse birth outcomes, increased cancer risk, eye, nose and throat irritation, exacerbation of asthma and other respiratory illnesses, neurological effects such as headaches and dizziness, gastrointestinal effects such as nausea and abdominal pain, and mental health impacts such as depression, anxiety or fatigue.
This information is, of course, nothing new. Living near oil and gas extraction activities, and specifically actively producing wells, has been shown in the literature to increase risks of various health impacts – including asthma and other respiratory diseases, cardiovascular disease, cancer, birth defects, nervous disorders and dermal irritation, among others.1
Spatial Assessment
While Los Angeles would benefit the most from any type of setback regulation due to the county and city’s high population density, the rest of the state would also benefit from the same.
We conducted an assessment of the number of California citizens living proximal to active oil and gas production wells to see who all would be affected by such a change. Population counts were estimated for individuals living within 2,500 feet of an oil and gas production well for the entire state. An interactive map of the wells that fall within 2,500 feet of a residence in California is shown just below in Figure 1.
Figure 1. California 2,500’ oil and gas well buffer, above. The map shows a 2,500’ buffer around active oil and gas wells in California. Wells that are located within 1,000’; 1,500’; and 2,500’ from a residence, hospital or school are also shown in the map. The counts of individuals located within 2,500’ of an active well are displayed for census tracts.
Population Statistics
The number and percentage of California residents living within 2,500 feet of an active (producing) oil and gas well are listed below:
Total At-Risk Population
859,699 individuals in California live within 2,500 feet of an active oil and gas well
% Non-White
Of the total, 385,067 are “Non-white” (45%)
% Hispanic
Of the total, 341,231 are “Hispanic” (40%) as defined by the U.S. Census Bureau2
We calculated population counts within the setbacks for smaller census-designated areas, including counties and census tracts. The results of the calculations are presented in Table 1 below.
Table 1. Population Counts by County
County
Total Pop.
Impacted Pop.
Impacted % Non-White
Impacted % Hispanic
Los Angeles
9,818,605
541,818
0.54
0.46
Orange
3,010,232
202,450
0.25
0.19
Kern
839,631
71,506
0.34
0.43
Santa Barbara
423,895
8,821
0.44
0.71
Ventura
823,318
8,555
0.37
0.59
San Bernardino
2,035,210
6,900
0.42
0.59
Riverside
2,189,641
5,835
0.46
0.33
Fresno
930,450
2,477
0.34
0.50
San Joaquin
685,306
2,451
0.55
0.42
Solano
413,344
2,430
0.15
0.15
Colusa
21,419
1,920
0.39
0.70
Contra Costa
1,049,025
1,174
0.35
0.30
Table 1 presents the counts of individuals living within 2,500 feet of an active oil and gas well, aggregated by county. Only the top 12 counties with the highest population counts are shown. “Impacted Population” is the count of individuals estimated to live within 2,500 feet of an oil and gas well. The “% Non-white” and “% Hispanic” columns report the estimated percentage of the impacted population of said demographic. There may be some overlap in these categories.
Conclusions
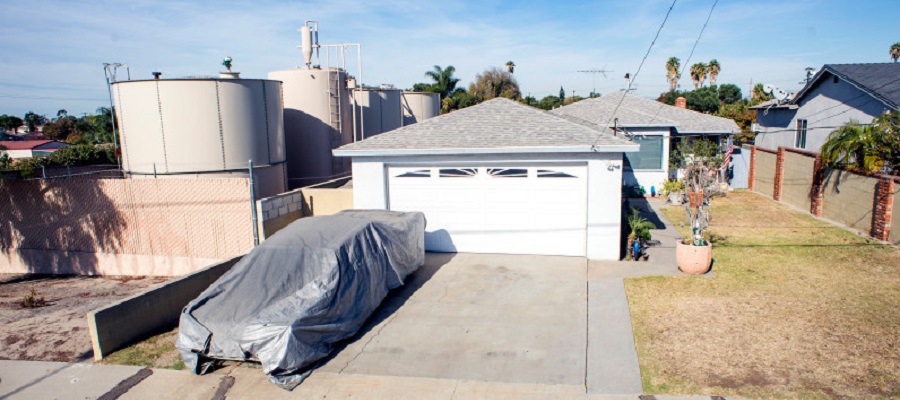
California is unique in many ways, beautiful beaches and oceans, steep mountains, massive forests, but not least of all is the intensity of the oil and gas industry. Not only are some of the largest volumes of oil extracted from this state, but extraction occurs incredibly close to homes, sometimes within communities – as shown in the photo at the top of this post.
The majority of California citizens living near active production wells are located in Los Angeles County – well over half a million people. LA County makes up 61% of Californians living within 2,500 feet of an oil and gas well, and half of them are non-white minority, people of color.
Additionally, the well sample population used in this analysis is limited to only active production wells. Much more of California’s population is exposed to pollutants from the oil and gas support activities and wells. These pollutants include acidic vapors, hydrocarbons, and diesel particulate matter from exhaust.
Our numbers are, therefore, a conservative estimate of just those living near extraction wells. Including the other activities would increase both the total numbers and the demographic percentages because of the high population density in Los Angeles.
For many communities in California, therefore, it is essentially impossible for residents to escape oil and gas pollution.
The Analysis – How it was done!
Since the focus of this assessment was the potential for impacts to public health, the analysis was limited to oil and gas wells identified as active – meaning they are producing or are viable to produce oil and/or natural gas. This limitation on the dataset was justified to remain conservative to the most viable modes of exposure to contaminants from well sites. Under the assumption that “plugged,” “buried,” or “idle” wells that are not producing (or at least reporting production figures to DOGGR) do not purvey as much as a risk of air emissions, the main route of transport for pollutants to the surrounding communities is via air emissions from “producing” oil and gas wells. The status of wells was taken from DOGGR’s “AllWells.zip” dataset (downloaded 3/7/18).
Analysis Steps:
The first step was to identify oil and gas wells in California affected by 2,500’ and shorter setbacks from occupied dwellings. To achieve this, the footprints of occupied dwellings were identified, and where there was not a data source available the footprints were digitized.
Using GIS tools, 2,500’ buffers were generated from the boundary of the occupied dwellings and a subset of active oil and gas wells located within the buffer zone were generated.
A combination of county and city zoning data and county parcel data was used to direct the selection of building footprint GIS data and the generation of additional building footprint data. Building footprint data is readily available for a number of California cities, but was not available for rural areas.
Existing footprint data was vetted using zoning codes.
Areas located within 2,500’ of well-heads were prioritized for screening satellite imagery in areas zoned for residential use.
Analytical Considerations
Buildings and facilities housing vulnerable populations were also included. Vulnerable populations include people such as children, the elderly, and the immunocompromised. These areas pose an elevated risk for such sensitive populations when they live near hazardous sites, such as oil fields in LA. A variety of these types of sites were included in the GIS analysis, including schools and healthcare facilities.
GIS techniques were used to buffer active oil and gas wells at 2,500 feet. GIS shapefiles and 2010 Decennial census data was downloaded from American Fact Finder via Census.gov for the entire state of California at the census block level.2 Census block GIS layers were clipped to the 2,500-foot buffers. Population data found in Summary File 1 for the 2010 census was attached to the clipped census block GIS layers. Adjusted population counts were calculated according to the proportion of the area of the census block falling within the 2,500’ buffer.
By Kyle Ferrar, Western Program Coordinator, FracTracker Alliance
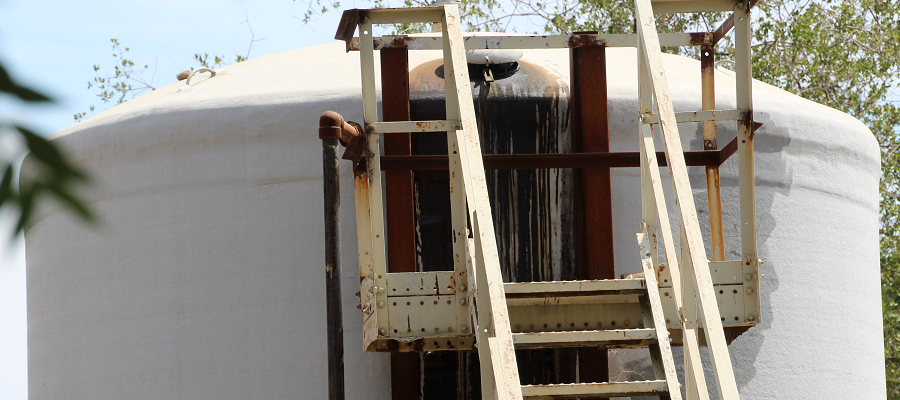
California’s 2nd Largest Waste Stream
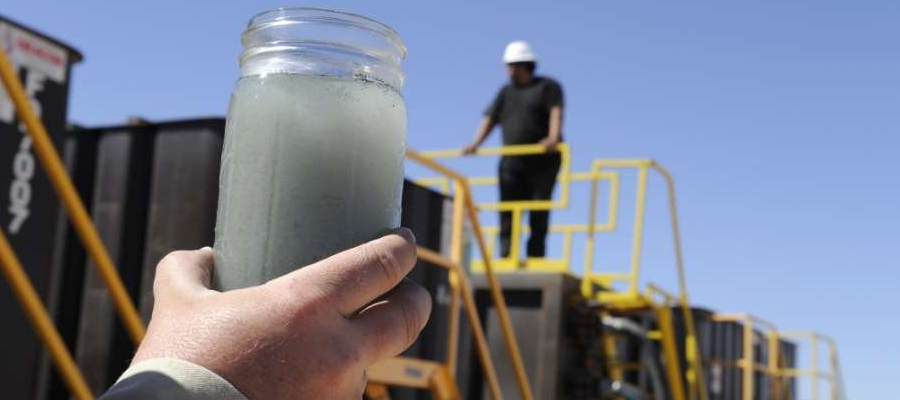
Every year the oil and gas industry in California generates billions of gallons of wastewater, also known as produced water. According to a study by the California Council on Science and Technology, in 2013, more than 3 billion barrels of produced water were extracted along with some 0.2 billion barrels of oil across the state. This wastewater is usually contaminated with a mixture of heavy metals, hydrocarbons, naturally occurring radioactive materials, and high levels of salts. Yet, contaminated wastewater from oil-field operations is exempt from the hazardous waste regulations enforced by the Resource Conservation and Recovery Act (RCRA).
Operators are, therefore, not required to measure or report the chemistry of this wastewater. Even with these unknowns, it is legally re-injected back into groundwater aquifers for disposal. Once an aquifer is contaminated it can be extremely difficult, if not impossible, to clean up again. Particularly in California, where water resources are already stretched thin, underground injection of oil and gas wastewater is a major environmental and economic concern.
The California department responsible for managing these aquifer exemption permits – the Division of Oil, Gas, and Geothermal Resources (DOGGR) – has for decades failed in its regulatory capacity. In 2015, for example, DOGGR admitted that at least 2,553 wells had been permitted to inject oil and gas waste into non-exempt aquifers – aquifers that could be used for drinking water. Independent audits of DOGGR showed decades of poor record-keeping, lax oversight, and in some cases, outright defiance of the law – showing the cozy relationship between regulators and the oil and gas industry. While 176 wells (those that were injecting into the cleanest drinking water) were initially shut down, most of the rest of the 2,377 permits were allowed to continue injecting into disputed wells through the following two years of the regulatory process.
The injection wells targeted by the Environmental Protection Agency (EPA), including those that were shut down, are shown in the map below (Figure 1).
Figure 1. Map of EPA-targeted Class II Injection Wells
The timeline of all this is just as concerning. The State of California has known about these problems since 2011, when the EPA audited California’s underground injection program and identified substantial deficiencies in its program, including failure to protect some potential underground sources of drinking water, a one-size-fits-all geologic review, and inadequate and under-qualified staffing for carrying out inspections. In 2014, the Governor’s office requested that the California EPA perform an independent review of the program. EPA subsequently made a specific remediation plan and timeline for DOGGR, and in March of 2015 the State finalized a Corrective Action Plan, to be completed by February 2017.
Scientific Review of CA Oil and Gas Activities
Meanwhile, in 2013, the California Senate passed SB-4, which set a framework for regulating hydraulic fracturing in California. Part of the bill required an independent scientific study to be conducted on oil and gas well stimulation, including acid well stimulation and hydraulic fracturing. The California Council on Science and Technology organized and led the study, in collaboration with the Lawrence Berkeley National Laboratories, which combined original technical data analyses and a review of relevant literature, all of which was extensively peer-reviewed. The report argues that both direct and indirect impacts of fracking must be accounted for, and that major deficiencies and inconsistencies in data remained which made research difficult. They also recommended that DOGGR improve and modernize their record keeping to be more transparent.
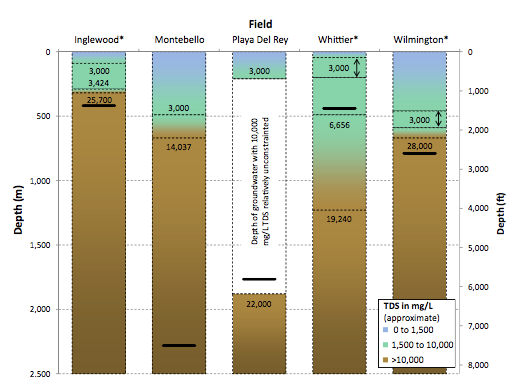
Figure 2*. Depths of groundwater total dissolved solids (a common measure of groundwater quality) in five oil fields in the Los Angeles Basin. Blue and aqua colors represent protected groundwater; the heavy black horizontal line indicates the shallowest hydraulically fractured well in each field. In three of the five wells (Inglewood, Whittier, and Wilmington), fracking and wastewater injection takes place directly adjacent to, or within, protected groundwater.
A major component of the SB-4 report covered California’s Class II injection program. Researchers analyzed the depths of groundwater aquifers protected by the Safe Drinking Water Act, and found that injection and hydraulic fracturing activity was occurring within the same or neighboring geological zones as protected drinking water (Figure 2*).
*Reproduced from California Council on Science and Technology: An Independent Scientific Assessment of Well Stimulation in California Vol. 3.
More Exemptions to be Granted
Now, EPA is re-granting exemptions again. Six aquifer exemptions have been granted, and more are on the docket to be considered. In this second time around, it is imperative that regulatory agencies be more diligent in their oversight of this permitting process to protect groundwater resources. At the same time, the 2015 California bill SB 83 mandates the appointment of an independent review panel to evaluate the Underground Injection Control Program and to make recommendations on how to improve the effectiveness of the program. This process is currently in the works and a panel has been assembled, and FracTracker Alliance will be working to provide data, maps and analyses for this panel.
Stay tuned for more to come on which aquifers are being exempted, why, and what steps are being taken to protect groundwater in California.
https://www.fractracker.org/a5ej20sjfwe/wp-content/uploads/2018/03/PatSullivan_AP_Fracwater.png400900Kyle Ferrar, MPHhttps://www.fractracker.org/a5ej20sjfwe/wp-content/uploads/2025/09/2025-Wordmark-Logo.pngKyle Ferrar, MPH2018-03-22 14:43:392021-04-15 15:01:22California regulators need to protect groundwater from oil and gas waste this time around
The City of Arvin, with a population of about 20,000, is located in Kern County, California just 15 miles southeast of Bakersfield. Nicknamed ‘The Garden in the Sun,’ Arvin is moving forward with establishing new regulations that would limit oil and gas development within the city limits.
Setback Map
The new ordinance proposes setback distances for sensitive sites including hospitals and schools, as well as residentially and commercially zoned parcels. The proposal establishes a 300-foot buffer for new development and 600’ for new operations.
In the map below, FracTracker Alliance has mapped out the zoning districts in Arvin and mapped the reach of the buffers around those districts. The areas where oil and gas well permits will be blocked by the ordinance are shown in green, labeled “Buffered Protected Zones.” The “Unprotected Zones” will still allow oil and gas permits for new development.
There are currently 13 producing oil and gas wells within the city limits of Arvin, 11 of them are located in the protected zones. Those within the protected zones are operated by Sun Mountain Oil and Gas and Petro Capital Resources. They were all drilled prior to 1980, and are shown in the map below.
Information on the public hearings and proposals can be found in the Arvin city website, where the city posts public notices. As of January 24, 2018, these are the current documents related to the proposed ordinance that you will find on the webpage:
In December of 2016, Committee for a Better Arvin, Committee for a Better Shafter, and Greenfield Walking Group, represented by Center for Race, Poverty and the Environment, sued Kern County. The lawsuit was filed in coordination with EarthJustice, Sierra Club, Natural Resources Defense Council, and the Center for Biological Diversity.
The Importance of Local Rule
Self-determination by local rule is fundamental of United States democracy, but is often derailed by corporate industry interests by the way of state pre-emption. There is a general understanding that local governments are able to institute policies that protect the interests of their constituents, as long as they do not conflict with the laws of the state or federal government. Typically, local municipalities are able to pass laws that are more constrictive than regional, state, and the federal government.
Unfortunately, when it comes to environmental health regulations, states commonly institute policies that preserve the rights of extractive industries to access mineral resources. In such cases, the state law “pre-empts” the ability of local municipalities to regulate. Local laws can be considered the mandate of the people, rather than the influence of outside interest on representatives. Therefore, when it comes to land use and issues of environmental health, local self-determination must be preserved so that communities are empowered in their decision making to best protect the health of their citizens.
https://www.fractracker.org/a5ej20sjfwe/wp-content/uploads/2018/01/Arvin_bakersfield_re.jpg400900Kyle Ferrar, MPHhttps://www.fractracker.org/a5ej20sjfwe/wp-content/uploads/2025/09/2025-Wordmark-Logo.pngKyle Ferrar, MPH2018-01-30 11:59:072021-04-15 15:01:28Arvin, CA – a City in the Most Drilled County in the Country – files for a Setback Ordinance
Air quality in the California Bay Area has been steadily improving over the last decade, and the trend can even be seen over just the course of the last few years. In this article we explore data from the ambient air quality monitoring networks in the Bay Area, including a look at refinery emissions.
From the data and air quality reports we find that that many criteria pollutants such as fine particulate matter (PM2.5) and oxides of nitrogen (NOX) have decreased dramatically, and areas that were degraded are now in compliance.
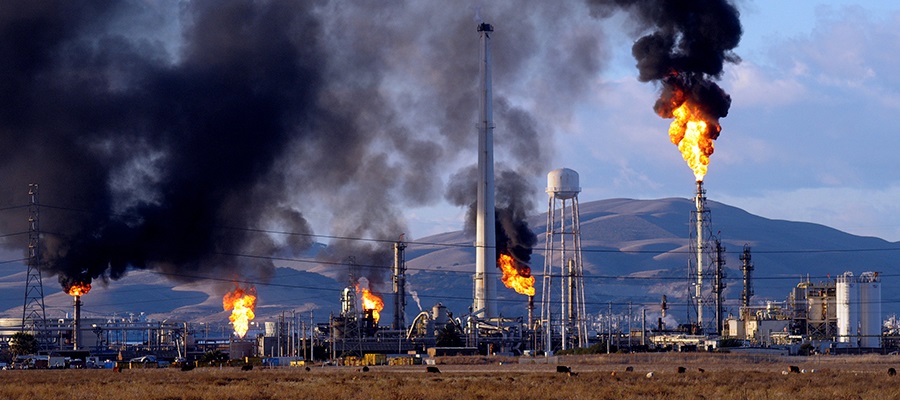
While air pollution from certain sectors such as transportation have been decreasing, the north coast of the East Bay region is home to a variety of petrochemical industry sites. This includes five petroleum refineries. The refineries not only contribute to these criteria pollutants, but also emit a unique cocktail of toxic and carcinogenic compounds that are not monitored and continue to impact cardiovascular health in the region. This region, aptly named the “refinery corridor” has a petroleum refining capacity of roughly 800,000 BPD (barrels per day) of crude oil.
Petroleum refineries in California’s East Bay have always been a contentious issue, and several of the refineries date back to almost the turn of the 20th century. The refineries have continuously increased their capacities and abilities to refine dirtier crude oil through “modernization projects.” As a result, air quality and health impacts became such a concern that in 2006 and again in 2012, Gayle McLaughlin, a Green Party candidate, was elected as Mayor of the City of Richmond. Richmond, CA became the largest city in the U.S. with a Green Party Mayor. While there have been many strides in the recent decade to clean up these major sources of air pollution, health impacts in the region including cardiovascular disease and asthma, as well as cancer rates, are still disproportionately high.
Regulations
To give additional background on this issue, let’s discuss some the regulations tasked with protecting people and the environment in California, as well as climate change targets.
However – a current proposal will actually allow the refineries to process more crude oil by setting a standard for emissions by volume of crude/petroleum refined, rather than an actual cap on emissions. The current regulatory approach focuses on “source-by-source” regulations of individual equipment, which ignores the overall picture of what’s spewing into nearby communities and the atmosphere. Even the state air resources board has supported a move to block the refineries from accepting more heavy crude from the Canadian tar sands.
New regulatory proposals incentivize refineries to continue expanding operations to refine more oil, resulting in a larger burden on the health of these already disproportionately impacted environmental justice communities. Chevron, in particular, is upgrading their Richmond refinery in a way as to allow it to process dirtier crude in larger volumes from the Monterey Shale and Canada’s Tar Sands. Since the production volumes of lighter crudes are shrinking, heavier dirtier crudes are becoming a larger part of the refinerys’ feedstocks. Heavier crudes require more energy to refine and result in larger amounts of hazardous emissions.
Upgrades are also being implemented to address greenhouse gas emissions. While the upgrades address the carbon emissions, regulatory standards without strict caps for other pollutants will allow emissions of criteria and toxic air pollutants such as VOC’s, nitrosamines, heavy metals, etc… to increase. In fact, newly proposed emissions standards for refineries will make it easier for the refineries to increase their crude oil volumes by regulating emissions on per-barrel standards. Current refining volumes can be seen below in Table 1, along with their maximum capacity.
Table 1. Bay Area refineries average oil processed and total capacity
Refinery
Location
Ave. oil processed Barrels Per Day (2012 est.)
Max. capacity (BPD)
Chevron U.S.A. Inc. Richmond Refinery
Richmond
245,271
>350,000
Tesoro Refining & Marketing, Golden Eagle Refinery
The Bay Area, and in particular the city of Richmond, have been noted in the literature as a place where environmental racism and environmental health disparity exist. The city’s residents of color disproportionately live near the refineries and chemical plants, which is noted in early works on environmental racism by pioneers of the idea, such as Robert Bullard (Bullard 1993a,b).
Since the issue has been brought to national attention by environmental justice groups like West County Toxics Coalition, progress has been made to try to bring justice, but it has been limited. People of color are still disproportionately exposed to toxic, industrial pollution in that area. A recent study showed 93% of respondents in Richmond were concerned about the link between pollution and health, and 81% were concerned about a specific polluter, mainly the Chevron Refinery (Brody et al. 2012). Recent health reports continue to show the trend that these refinery communities suffer disproportionately from cases of asthma and cardiovascular disease and higher mortality rates from a variety of cancers.
Health Impact Studies
Manufacturing and refining are known to produce particularly toxic pollution. Additionally, there has been research done on the specific makeup of pollution in the refinery corridor. The best study to do this is the Northern California Household Exposure Study (Brody et al. 2009). They examined indoor and outdoor air in Richmond, a refinery corridor community, and Bolinas, a nearby but far more rural community. They found 33% more compounds in Richmond, along with higher concentrations of each compound. The study also found very high concentrations of vanadium and nickel in Richmond, some of the highest levels in the state. Vanadium and nickel have been shown to be some of the most dangerous PM2.5 components as we previously stated, which gives reason to believe the air pollution in Richmond is more toxic than in surrounding areas.
Another very similar study compared the levels of endocrine disrupting compounds in Richmond and Bolinas homes, and found 40 in Richmond homes and only 10 in Bolinas (Rudel et al. 2010). This supports the idea that a large variety of pollutants with synergistic effects may be contributing to the increased mortality and hospital visits for communities in this region. This small body of research on pollution in Richmond suggests that the composition of air pollution may be more toxic and thus trigger more pollution-related adverse health outcomes than in surrounding communities.
Air Quality Monitoring
As discussed above and in FracTracker’s previous reports on the refinery corridor, the refinery emissions are a unique cocktail whose synergistic effects may be driving much of the cardiovascular disease, asthma, and cancer risk in the region. Therefore, the risk drivers in the Bay Area need to be prioritized, in particular the compounds of interest emitted by the petrochemical facilities.
The targets for emissions monitoring are compounds associated with the highest risk in the neighboring communities. An expert panel was convened in 2013 to develop plans for a monitoring network in the refinery corridor. Experts found that measurements should be collected at 5 minute intervals and displayed to the public real-time. The gradient of ambient air concentrations is determined by the distance from refinery, so a network of three near-fence-line monitors was recommended. Major drivers of risk are supposed to be identified by air quality monitoring conducted as a part of Air District Regulation 12m Rule 15: Petroleum Refining Emissions tracking. According to the rule, fence-line monitoring plans by refinery operators:
… must measure benzene, toluene, ethyl benzene, and xylenes (BTEX) and HS concentrations at refinery fence-lines with open path technology capable of measuring in the parts per billion range regardless of path length. Open path measurement of SO2, alkanes or other organic compound indicators, 1, 3-butadiene, and ammonia concentrations are to be considered in the Air Monitoring Plan.
The following analysis found that the majority of hazardous pollutants emitted from refineries are not monitored downwind of the facility fence-lines, much less the list explicitly named in the regulations above.
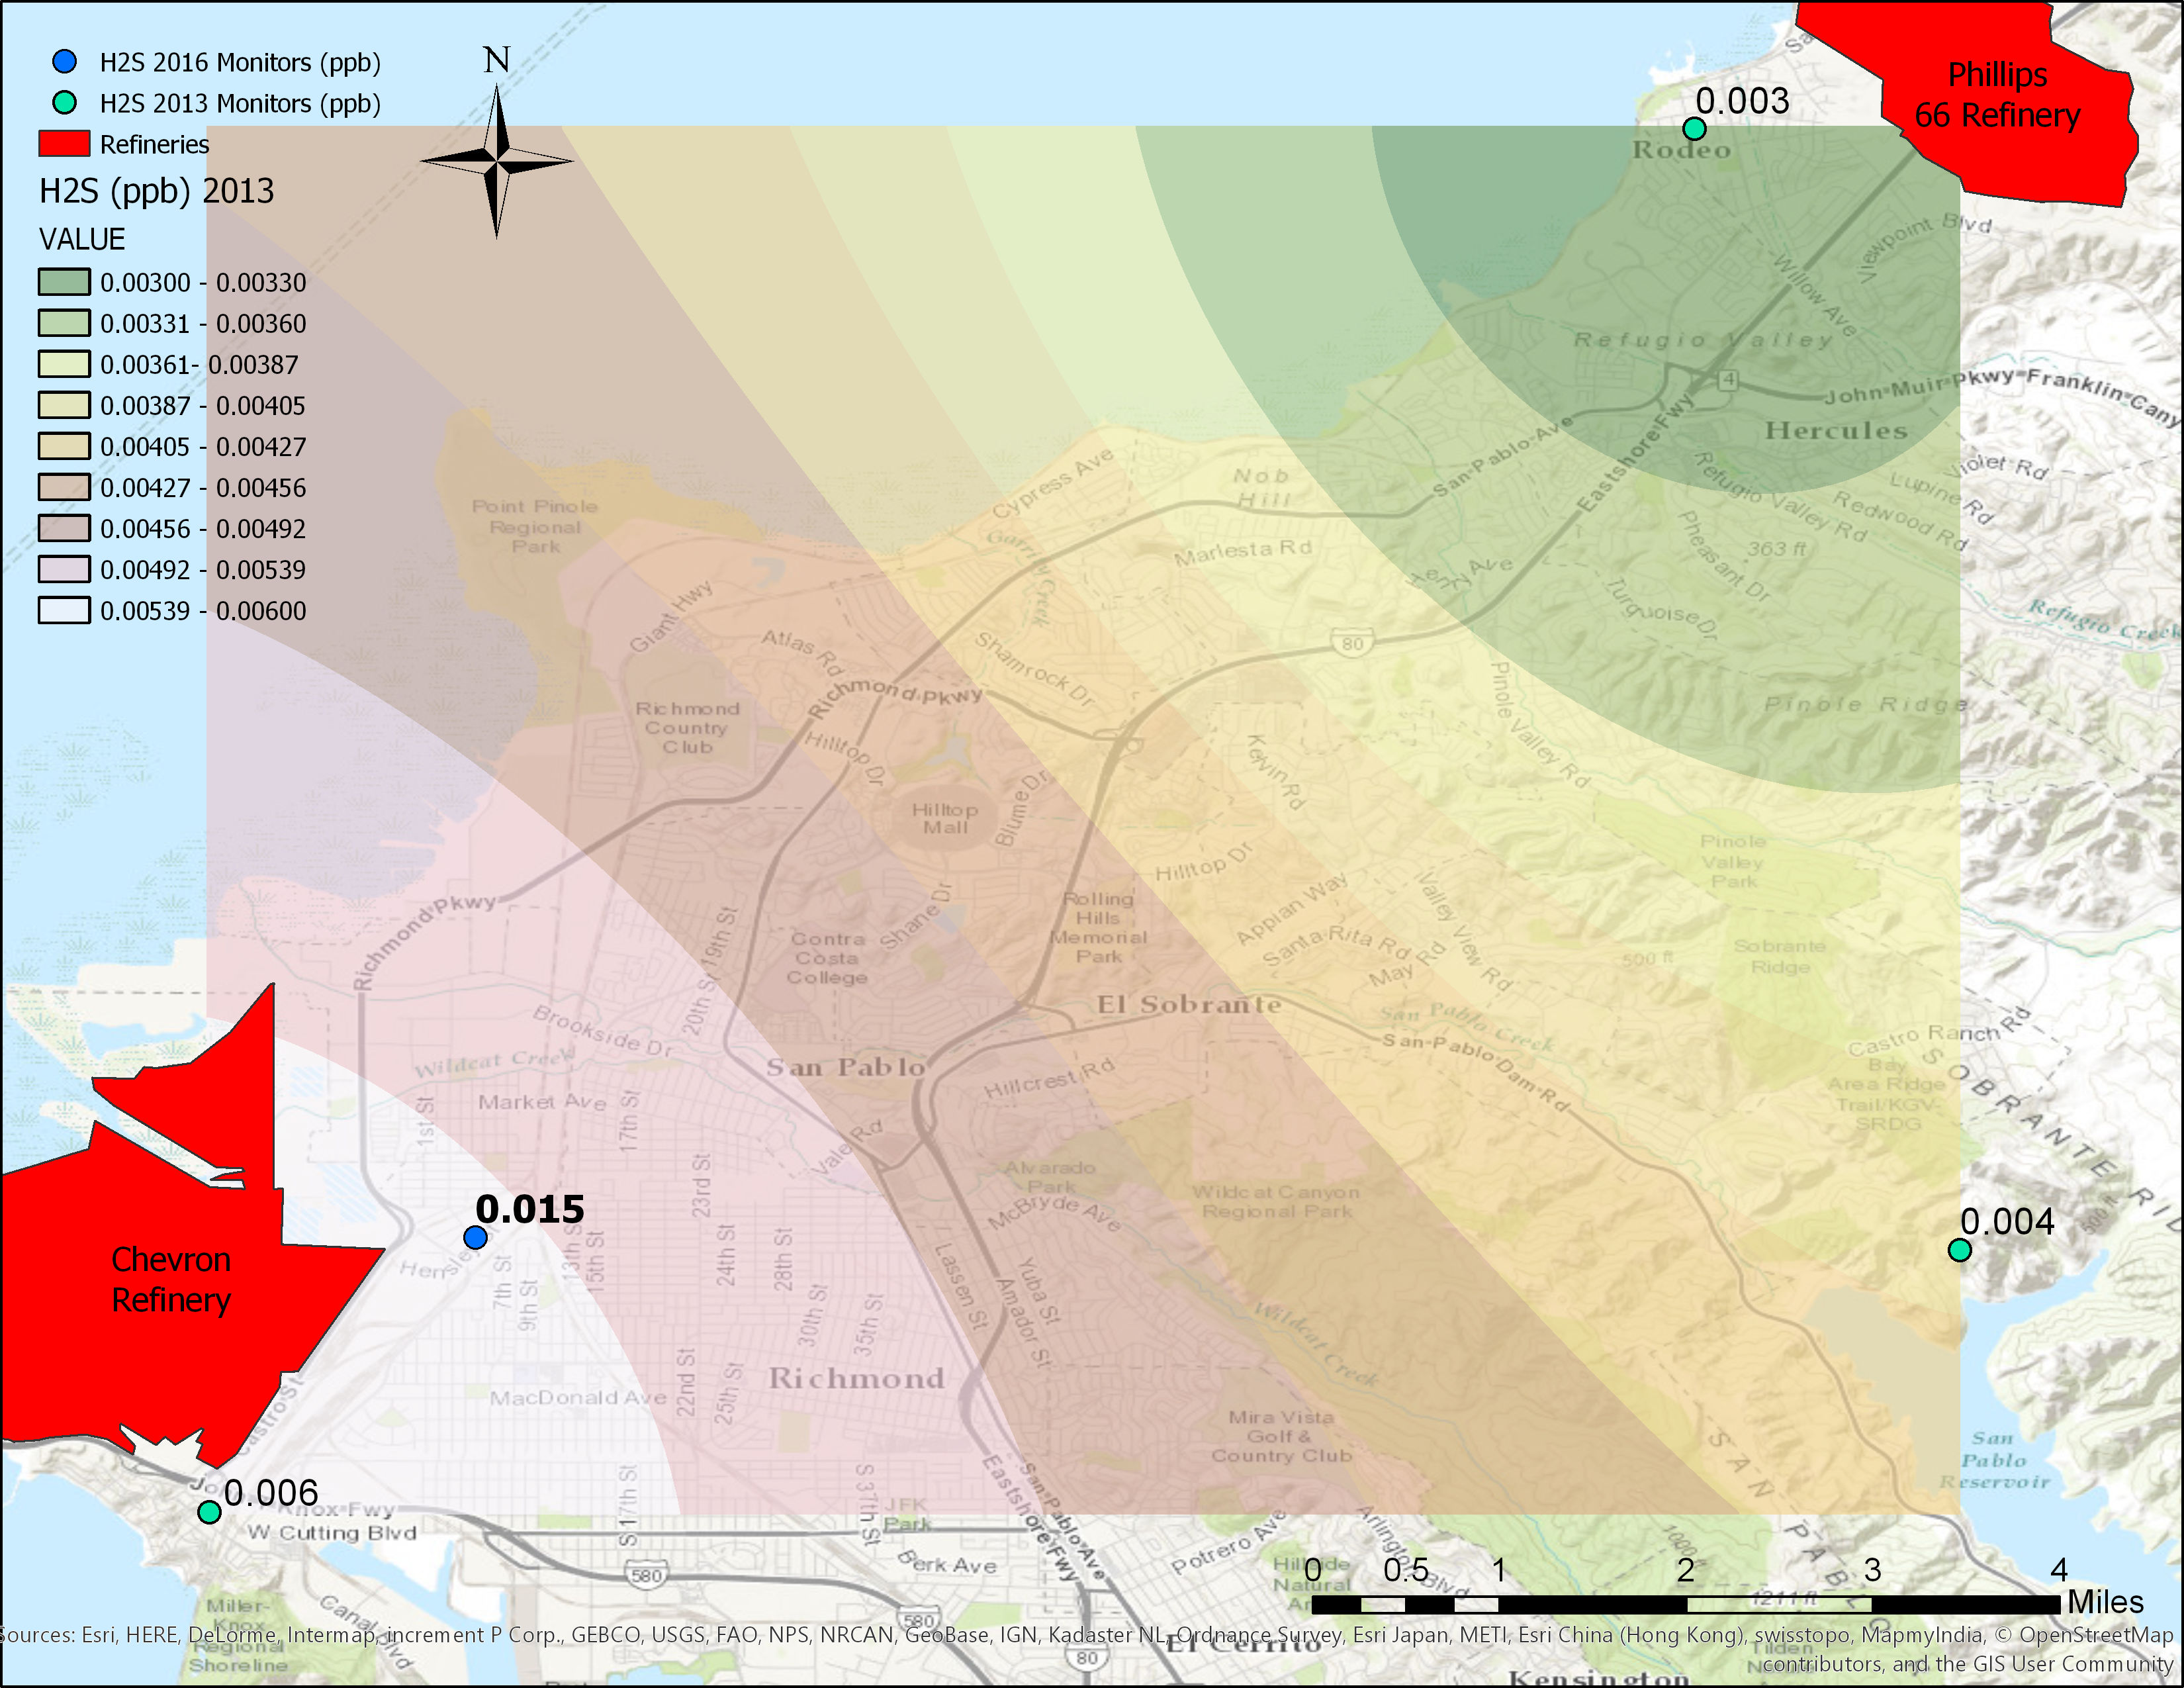
As shown below in Figure 1, the most impacted communities are in those directly downwind of the facility. According to the BAAQMD, each petroleum refinery is supposed to have fence-line monitoring. Despite this regulation developed by air quality and health experts, only two out of the five refineries have even one fence-line monitor. Real-time air monitoring data at the Chevron Richmond fence-line monitor and the Phillips 66 Rodeo fence-line monitor can be found on fenceline.org. Data from these monitors are also aggregated by the U.S. EPA, and along with the other local monitors, can be viewed on the EPA’s interactive mapping platform.
Figure 1. Map of Hydrogen Sulfide Emissions from the Richmond Chevron Refinery
Hazardous Emissions and Ambient Pollution
Since the majority of hazardous chemicals emitted from the refineries are not measured at monitoring sites, or there are not any monitoring sites at the fence-line or downwind of the facility, our mapping exercises instead focus on the hazardous air pollution for which there is data.
As shown in the map of hydrogen sulfide (H2S) above, the communities immediately neighboring the refineries are subjected to the majority of hazardous emissions. The map shows the rapidly decreasing concentration gradient as you get away from the facility. H2S would have been a good signature of refinery emissions throughout the region if there were more than three monitors. Also, those monitors only existed until 2013, when they were replaced with a singular monitor in a much better location, as shown on the map. The 2016 max value is much higher because it is more directly downwind of Chevron Refinery.
The interpolated map layer was created using 2013 monitoring data from three monitors that have since been removed. The 2016 monitoring location is in a different location and has a maximum value more than twice what was recorded at the 2013 location.
Table 2. Inventory of criteria pollutant emissions for the largest sectors in the Bay Area
Annual average tons per day
PM10
PM2.5
ROG
NOX
SOX
CO
Area wide
175.51
52.90
87.95
19.92
0.62
161.86
Mobile
20.33
16.27
183.12
380.52
14.93
1541.50
Total Emissions
16.30
12.14
106.58
50.59
45.95
44.31
Table adapted from the BAAQMD Refinery Report. PM10 = particulate matter less than 10 microns in diameter (about the width of a human hair); PM2.5 = PM less than 2.5 microns in diameter; ROG = reactive organic gases; NOX = nitrogen oxides; SOX = sulfur oxides; CO = carbon monoxide.
Additionally, exposure assessment can also rely on using surrogate emissions to understand where the plumes from the refineries are interacting with the surrounding communities. It is particularly important to also discriminate between different sources of pollution. As we see in Table 2 above, the largest volume of particulate matter (PM), NOX, and CO emissions actually come from mobile sources, whereas the largest source of sulfur dioxide and other oxides (SOX) is from stationary sources. Since the relationship between PM2.5 and health outcomes is most established, the response to ambient levels of PM2.5 in the refinery corridor gives insight into the composition of PM as well as the presence of other species of hazardous air pollution. On the other hand, SO2 can be used as a surrogate for the footprint of un-monitored air toxics.
Pollutants’ Fingerprints
Particulate Matter
Figure 2. Map of fine particulate matter (PM2.5) for the Bay Area Air Quality Management District
Figure 2 above displays ambient levels of PM2.5, and as the map shows, the highest levels of particulate matter surround the larger metro area of downtown Oakland and also track with the larger commuting corridors. The map shows evidence that the largest contributor to PM2.5 is truly the transportation (mobile) sector. PM2.5 is one hazardous air pollutant which negatively impacts health, causing heart attack, or myocardial infarction (MI), among other conditions. PM2.5 is particulate matter pollution, meaning small particles suspended in the air, specifically particles under 2.5 microns in diameter. Exposure to high levels of PM2.5 increases the risk of MI within hours and for the next 1-2 days (Brooks et al. 2004; Poloniecki et al. 1997).While refineries may not be the largest source of PM in the Bay Area, they are still large point sources that contribute to high local conditions of smog.
The chemical make-up of the particulate matter also needs to be considered. In addition, the toxicity of PM from the refineries is of particular concern. Since particulate matter acts like small carbon sponges, the source of PM affects its toxicity. The cocktail of hazardous air toxics emitted by refineries absorb and adsorb to the surfaces of PM. When inhaled with PM, these toxics including heavy metals and carcinogens are delivered deep into lung tissue.
Pooled results of many studies showed that for every 10 micrograms per meter cubed increase in PM2.5 levels, the risk of MI increases 0.4-1% (Brooks et al. 2010). However, this relationship has not been studied in the context of EJ communities. EJ communities are generally low income communities of color (Bullard 1993), which have higher exposures to pollution, more sources of stress, and higher biological markers of stress (Szanton et al. 2010; Carlson and Chamberlein 2005). All of these factors may affect the relationship between PM2.5 and MI, and increase the health impact of pollution in EJ communities relative to what has been found in the literature.
Sulfur Dioxide
Figure 3 below shows the fingerprint of the refinery emissions on the refinery corridor, using SO2 emissions as a surrogate for the cocktail of toxic emissions. The relationship between SO2 and health endpoints of cardiovascular disease and asthma have also been established in the literature (Kaldor et al. 1984).
In addition to assessing SO2 as a direct health stressor, it is also the most effective tracer of industrial emissions and specifically petroleum refineries for a number of reasons. Petroleum refineries are the largest source of SO2 in the BAAQMD by far (Table 1), and there are more monitors for SO2 than any of the other emitted chemical species that can be used to fingerprint the refineries. The distribution of SO2 is therefore representative of the cocktail of a combination of the hazardous chemicals released in refinery emissions.
Figure 3. Map of Sulfur Dioxide for the Bay Area Air Quality Management District
The next step for FracTracker Alliance is to further explore the relationship between health effects in the refinery communities and ambient levels of air pollution emitted by the refineries. Our staff is currently working with the California Department of Public Health to analyze the response of daily emergency room discharges for a variety of health impacts including cardiovascular disease and asthma.
References
Brody, J. G., R. Morello-Frosch, A. Zota, P. Brown, C. Pérez, and R. A. Rudel. 2009. Linking Exposure Assessment Science With Policy Objectives for Environmental Justice and Breast Cancer Advocacy: The Northern California Household Exposure Study. American Journal of Public Health 99:S600–S609.
Brook, R. D., B. Franklin, W. Cascio, Y. Hong, G. Howard, M. Lipsett, R. Luepker, M. Mittleman, J. Samet, S. C. Smith, and I. Tager. 2004. Air Pollution and Cardiovascular Disease. Circulation 109:2655–2671.
Brooks, R. D., S. Rajagopalan, C. A. Pope, J. R. Brook, A. Bhatnagar, A. V. Diez-Roux, F. Holguin, Y. Hong, R. V. Luepker, M. A. Mittleman, A. Peters, D. Siscovick, S. C. Smith, L. Whitsel, and J. D. Kaufman. 2010. Particulate Matter Air Pollution and Cardiovascular Disease. Circulation 121:2331–2378.
Bullard, R. D. 1993a. Race and Environmental Justice in the United States Symposium: Earth Rights and Responsibilities: Human Rights and Environmental Protection. Yale Journal of International Law 18:319–336.
Bullard, R. D. 1993b. Confronting Environmental Racism: Voices from the Grassroots. South End Press.
Carlson, E.D. and Chamberlain, R.M. (2005), Allostatic load and health disparities: A theoretical orientation. Res. Nurs. Health, 28: 306–315. doi:10.1002/nur.20084
Kaldor, J., J. A. Harris, E. Glazer, S. Glaser, R. Neutra, R. Mayberry, V. Nelson, L. Robinson, and D. Reed. 1984. Statistical association between cancer incidence and major-cause mortality, and estimated residential exposure to air emissions from petroleum and chemical plants. Environmental Health Perspectives 54:319–332.
Poloniecki, J. D., R. W. Atkinson, A. P. de Leon, and H. R. Anderson. 1997. Daily Time Series for Cardiovascular Hospital Admissions and Previous Day’s Air Pollution in London, UK. Occupational and Environmental Medicine 54:535–540.
Rudel, R. A., R. E. Dodson, L. J. Perovich, R. Morello-Frosch, D. E. Camann, M. M. Zuniga, A. Y. Yau, A. C. Just, and J. G. Brody. 2010. Semivolatile Endocrine-Disrupting Compounds in Paired Indoor and Outdoor Air in Two Northern California Communities. Environmental Science & Technology 44:6583–6590.
Szanton SL, Thorpe RJ, Whitfield KE. Life-course Financial Strain and Health in African-Americans. Social science & medicine (1982). 2010;71(2):259-265. doi:10.1016/j.socscimed.2010.04.001.
By Daniel Menza, Data & GIS Intern, and Kyle Ferrar, Western Program Coordinator, FracTracker Alliance
Cover photo credit: Claycord.com
https://www.fractracker.org/a5ej20sjfwe/wp-content/uploads/2017/05/tesoro-refinery_re.jpg400900Kyle Ferrar, MPHhttps://www.fractracker.org/a5ej20sjfwe/wp-content/uploads/2025/09/2025-Wordmark-Logo.pngKyle Ferrar, MPH2017-05-10 09:48:052021-04-15 15:03:07Tracking Refinery Emissions in California’s Bay Area Refinery Corridor
As ThinkProgress reports, these two federal agencies will now resume the approval of offshore fracking permits. In response, Governor Jerry Brown made a plea to President Obama, to prevent fracking off California’s coast. Governor Brown asked President Obama to institute a permanent ban on all new offshore oil and gas drilling in federal waters, saying:
California is blessed with hundreds of miles of spectacular coastline; home to scenic state parks, beautiful beaches, abundant wildlife and thriving communities,” Brown wrote in a letter to Obama. “Clearly, large new oil and gas reserves would be inconsistent with our overriding imperative to reduce reliance on fossil fuels and combat the devastating impacts of climate change.
A new report by Liza Tucker at Consumer Watchdog has reviewed the state regulatory agency’s own policies under the Brown Administration. The report claims, “Brown has nurtured drilling and hydraulic fracturing in the state while stifling efforts to protect the public.” The report asks Governor Brown to “direct regulators to reject any drilling in a protected coastal sanctuary, ban offshore fracking, and phase out oil drilling in state waters” among other recommendations.
FracTracker Alliance reviewed the data published by DOGGR on permitted offshore wells. (DOGGR refers to the Division of Oil, Gas, & Geothermal Resources, which regulates drilling in CA). Using API identification numbers as a timeline, we actually find that it is likely that 238 wells have been drilled offshore since the start of 2012. The DOGGR database only lists “spud” (drilling) and completion dates for 71 – a mere 1.3% of the 5,435 total offshore wells. DOGGR reports that 1,366 offshore wells are currently active production wells. It must be noted that these numbers are only estimations, since operators have a 2-year window to drill wells after receiving a permit and API number.
Using these methods of deduction, we find that since the beginning of 2012 the majority of offshore wells have been drilled offshore of Los Angeles County in the Wilmington Oil Field (204 in total); followed by 25 offshore in the Huntington Beach field; 7 in the West Montalvo field offshore of Ventura County, and 1 in the Belmont field, also offshore of Ventura County. These wells are shown as bright yellow circles in the map below. Additionally, the Center for Biological Diversity reports that at least 200 of the wells off California’s coast have been hydraulically fractured.
Offshore Oil and Gas Development and SB4-Approved Well Stimulations
In total, DOGGR data shows 5,435 offshore oil and gas wells. Of those listed as active, new or idle, they break down into well types as shown in Table 1 below.
Table 1. Offshore oil and gas well types
Well Type
Count
Oil and Gas Production
1,539
Dry Gas
5
Waste Disposal
14
Steam Flood
2
Water Flood
813
Pressure Maintenance
3
Observation
8
New Fracking under SB4 Rules
The map above also shows several datasets that detail the stimulation activity that has been occurring in California since the passage of SB4 under Jerry Brown. Prior to the adoption of the new stimulation regulations on July 1, 2015, operators submitted applications and received permits for a total of 2,130 wells. These well permits are shown in the map labeled “CA SB4 Interim Well Stimulation Permits.” Since July of 2015, 596 of these permitted wells have been stimulated. In the map above, the layer “CA SB4 Well Stimulation Disclosures” shows the time series of these wells. An additional 31 well stimulation treatment permit applications have been submitted to DOGGR, since the adoption of the final rules on July 1, 2015. They are shown in the map, labeled “CA SB4 Well Stimulation Treatment Permit Applications.”
Offshore drilling cover photo by Linda Krop, Environmental Defense Center
By Kyle Ferrar, Western Program Coordinator, FracTracker Alliance
https://www.fractracker.org/a5ej20sjfwe/wp-content/uploads/2013/10/Offshore-CA-Feature.jpg400900Kyle Ferrar, MPHhttps://www.fractracker.org/a5ej20sjfwe/wp-content/uploads/2025/09/2025-Wordmark-Logo.pngKyle Ferrar, MPH2017-02-07 14:31:072021-04-15 15:03:47More offshore drilling and “fracking” in California
