California Oil & Gas Drilling Permits Drop in Response to Decreased Permit Applications to CalGEM
As California permit approvals for new oil & gas well drills decrease, Consumer Watchdog urges the Governor to move from fossil fuels.
As California permit approvals for new oil & gas well drills decrease, Consumer Watchdog urges the Governor to move from fossil fuels.
California regulators recently denied 21 well stimulation permit applications—a welcomed move in the right direction—but not enough.
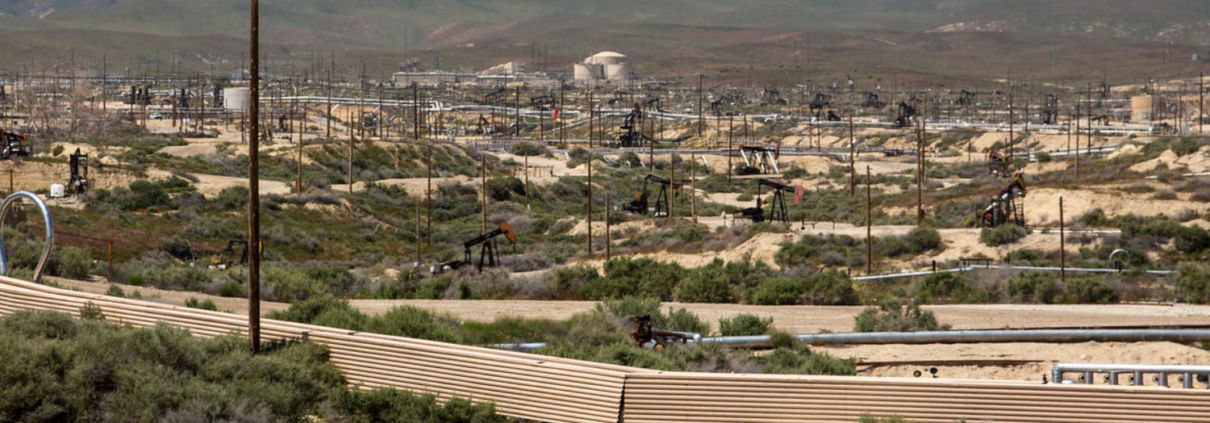
This article focuses on the city of Arvin as an example to show how some Frontline Communities in California are completely surrounded by an unrelenting barrage of carcinogenic and toxic air pollutants from oil and gas wells. Kern County’s proposed environmental impact report (EIR) would streamline the approval of an additional 67,000 new oil and gas wells in the County and thus further degrade air quality. We provide several recommendations for how local and state decision-makers can better protect public health from these serious threats.
Upstream greenhouse-gas and volatile organic compound (VOC) emissions from oil and gas extraction have been drastically under-reported throughout the United States, and California’s emissions regulations for oil and gas production wells are not comprehensive enough to protect Frontline Communities. The contribution of VOCs from the oil and gas extraction sector is responsible for California’s central valley and Kern County communities being exposed to the worst air quality in the country. As carcinogens, air toxics, and precursors to ozone, VOC’s present a myriad of health threats.
The contribution of VOCs from the well-sites in Kern, in addition to the cumulative burden of the Central Valley’s degraded air quality, puts Kern residents at considerable risk. Obvious loopholes in the California Air Resources Board’s oil and gas rule must be addressed immediately, and revised to prevent the cumulative impact of multiple exposure sources from causing additional documented negative health impacts. Additionally Kern County’s proposed environmental impact report (EIR) would streamline the approval of an additional 67,000 new oil and gas wells in the County and thus further degrade air quality. It is crucial that the EIR is instead revised to eliminate extraction near sensitive populations. (For more details on this proposal, see our more in depth environmental justice analysis of Kern County and our article on the proposed EIR.)
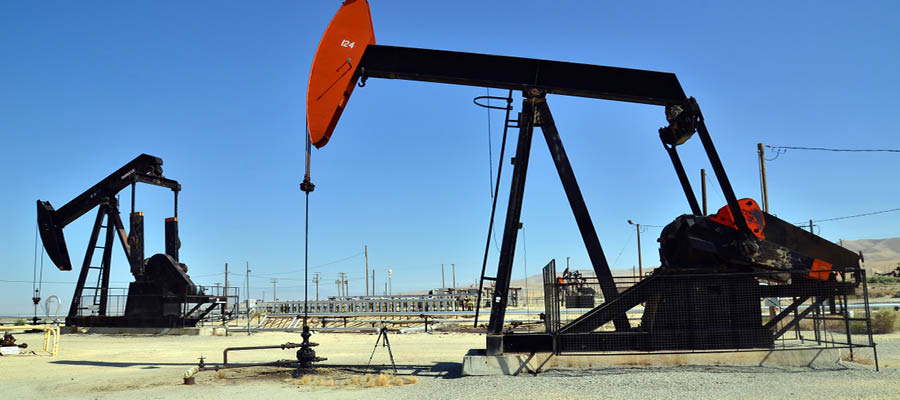
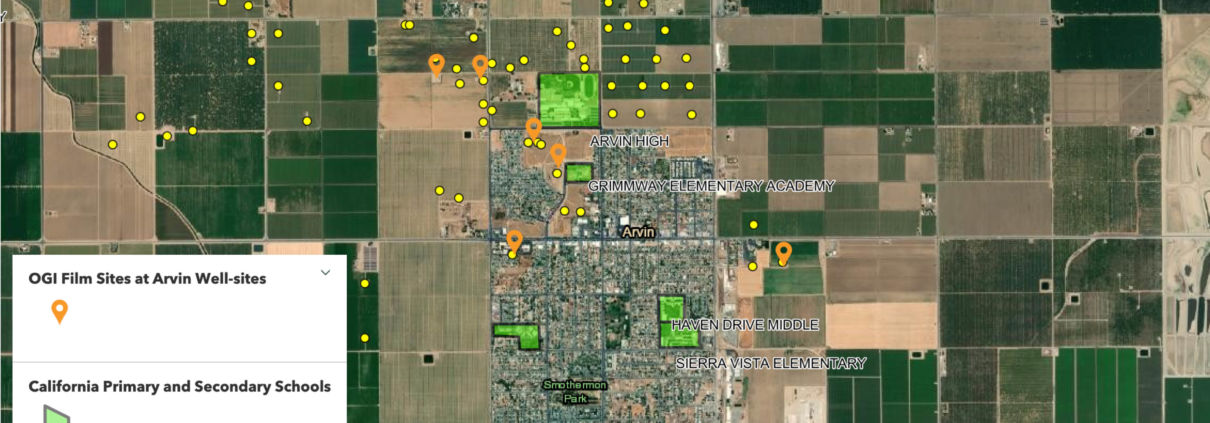
In support of establishing new public health rules that protect Frontline Communities, Earthwork’s Community Empowerment Project, in collaboration with the Central California Environmental Justice Network and FracTracker Alliance, has focused on documenting the uncontrolled emissions from extraction sites within and surrounding the small city of Arvin, California. Using infrared cameras with state of the art optical gas imaging (OGI) technology, the team documented major leaks at multiple well-sites. Footage from Arvin spans the years from 2016-2020. A collection of this footage has been compiled into the interactive story map that follows.
This StoryMap explores how current California regulations fail to stop emissions from tanks on oil and gas well-sites by looking at examples of emissions from well-sites in Arvin, California. Place your cursor over the image and scroll down to advance the StoryMap and explore a series of maps charting the fracking-for-plastic system. Click on the icon in the bottom left to view the legend.
View Full Sized Map | Updated 3/4/21
The cases of uncontrolled emissions in the story map provides just an example of the inventory of uncontrolled emissions sources in Kern County, and California at large. Finding and filming emissions sources while using OGI cameras in California is not at all uncommon, otherwise there would not be seven prime examples just in the City of Arvin. Prior to 2018, emissions from these well-sites went completely unregulated. While the California oil and gas rule (COGR) was developed to address greenhouse gas emissions from small sources, certain aspects of the rule are not being enforced by the local air districts. Rather than requiring tanks to have closed evaporation systems the air districts allow operators to set pressure/vacuum hatches to open and emit toxic and carcinogenic vapors when pressure builds inside tanks. While this is a safety mechanism on tanks, in practice it allows tanks to be consistent sources of exposure that put neighboring communities at risk. Specifically, California Code of Regulations, Title 17, Division 3, Chapter 1, Subchapter 10 Climate Change, Article 4, § 95669, Leak Detection and Repair, Paragraph I states that “Hatches shall remain closed at all times except during sampling, adding process material, or attended maintenance operations.”
New research from Harvard, Berkeley and Stanford has shown that living near oil and gas drilling and extraction exposes Frontline Communities to emissions of VOC’s and ozone that put them at risk for a variety of health impacts. Researchers at Stanford have linked proximity and density of oil and gas wells to preterm birth for pregnant mothers (Gonzalez et al. 2020), even at large distances. Similar research from UC Berkeley showed mothers living near oil and gas drilling and extraction are also at risk of birthing infants with low birth weight (Tran et al. 2020). The study found pregnant people who lived within 0.62 miles (1 kilometer) of the highest producing wells were 40% more likely to have low birth weight babies and 20% more likely to have babies who were small for their gestational age compared to people living farther away from wells or near inactive wells only. Most recently, new research from Harvard University shows that even very low ambient levels of ozone, particulate matter (PM2.5), and nitrogen dioxide increased hospitalizations for cardiac and respiratory conditions (Wang et al. 2021). These are the primary and secondary pollutants emitted from oil and gas extraction sites and also result from burning fossil fuels. The magnitude of the impact on public health is also much larger than previously considered. Another article recently published by researchers at Harvard shows that fossil fuel air pollution is responsible for 18% of total deaths, worldwide (Vohra, et al. 2021).
While the COGR rule is a step in the right direction to reduce emissions, oil and gas’s legacy of degradation to ambient air quality has placed the Central Valley in the worst categories for these pollutants in the country. This puts Kern residents at considerable risk. The local health department continues to report improved conditions and increased numbers of healthy air days, but the truth is the mean, median and maximum values of ozone concentrations at US EPA monitoring locations in Kern County have remained relatively constant at harmful levels from 2015-2019. Expanding the data to 2020 shows a two sharp decreases in ambient levels of pollutants that correspond to decreases in reported production volumes for the county. The first decrease in 2016 corresponds to a drop in production following the institution of State Bill requirements for fracking permits. The decrease in 2020 is a result of the slowed production and burning of fossil fuels related to the Covid-19 Pandemic, as shown below in Figure 1.
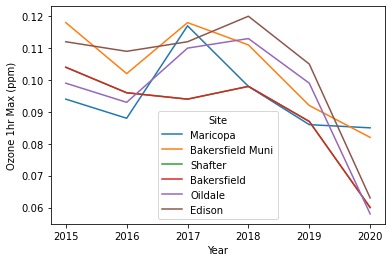
Figure 1. Plot of annual Maximum 1 hour Ozone concentrations at all monitoring locations in western Kern County. Ozone concentrations are presented in parts per million. Annual trends in ambient concentrations of ozone. Note the decrease in concentrations in 2016 and in 2020. Both events correlate to decreases in production.
Using the U.S. EPA’s AirData mapping portal, air quality data for Kern County was exported, compiled and plotted to show trends over time. Above in Figure 1, annual ambient concentrations of ozone are shown. The trends of ambient concentrations follow similar trends in the spatial and temporal distribution of CalGEM reported production volumes. FracTracker Alliance is conducting more thorough analyses of these correlations, so stay tuned for future reports.
The locations of these monitoring locations are shown below in the map in Figure 2. Note that there are not any monitors in northwestern Kern, near large oil fields including North Belridge and Lost Hills. The communities near these fields, such as the City of Lost Hills are predominantly Latinx with elevated levels of linguistic isolation and poverty.
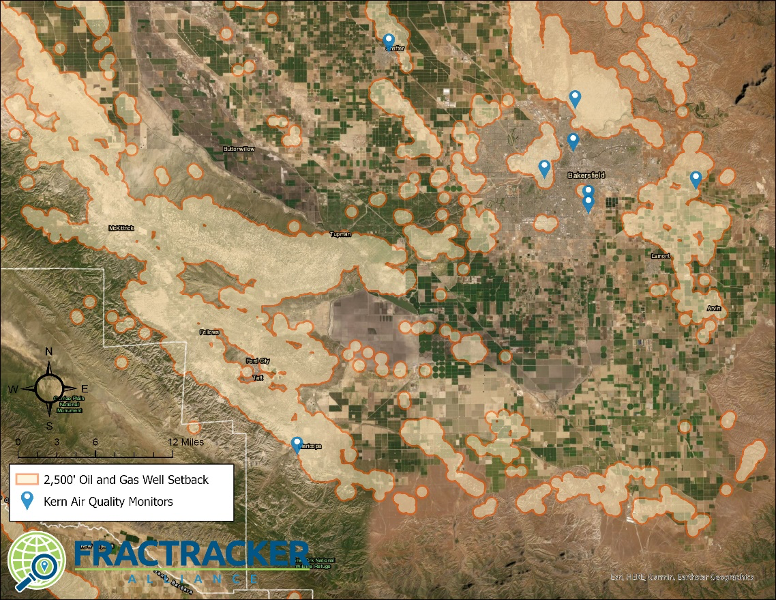
Figure 2. Map of Air Quality Monitors in Kern County.
Permitting new oil and gas wells in Kern County is certain to degrade the already harmful local and regional ambient air quality of the Central Valley. Kern County’s proposed EIR, as it stands will streamline an additional 67,000 sources of VOCs to the inventory of emissions already impacting communities. The health impacts from concentrations of ozone are well established, and the release of VOCs are major risk driver for communities living closest to oil and gas extraction operations as well as for regional public health. Together, these primary and secondary pollutants create a major risk driver for Kern County communities. Globally, these emissions are responsible for upwards of 8 million premature deaths annually. The burden on Frontline Communities in Kern County is likely much higher, and will only grow if the currently drafted EIR is passed. Additional air quality monitoring stations in northwestern Kern County should be installed immediately to help track air quality impacts.
To reduce this harm to Frontline Communities, California Senator Scott Weiner has submitted a new senate bill. Senate Bill 467 would stop the issuance of hydraulic fracturing permits and create a public health setback distance of 2,500 feet from homes, schools and other health care facilities for all new drilling permits. The bill would also create a program to provide new training and job opportunities for workers who would be negatively impacted by the bill. Senate Bill 467 provides the first step for a green transition away from the health impacts resulting from fossil fuel industries.
Built on sound data and ample research, FracTracker recommends the following measures be taken to protect the health of California’s overburdened Frontline Communities: Kern County should revise its environmental impact report to address the onslaught of harmful oil and gas emissions (EIR), California Air Resources Board’s oil and gas rule should close its loophole allowing emissions from the pressure/vacuum hatch on the tank to be exempt from regulation, and legislators should educate themselves on the importance of 2,500 foot setbacks requirements for oil and gas wells.
FracTracker’s public comments regarding recommendations to modify the Kern County Draft Environmental Impact Report (EIR): https://www.fractracker.org/a5ej20sjfwe/wp-content/uploads/2021/03/Kern.EIR_.comments_FracTrackerAlliance_3.8.21_compressed.pdf
FracTracker California articles, maps, and imagery: https://www.fractracker.org/map/us/california/
Earthwork’s Community Empowerment Project: https://www.youtube.com/playlist?list=PL9BS7nDf-8tqlaUT8pc0Yr0Tpfl0UFDMK
Newsom Well Watch, a collaboration between FracTracker and Consumer Watchdog: https://newsomwellwatch.com/
Infrastructure | Health & Safety | Legislation & Politics | Social

Kyle Ferrar, Western Program Coordinator for FracTracker Alliance, contributed to the December 2020 memo, “Recommendations to CalGEM for Assessing the Economic Value of Social Benefits from a 2,500’ Buffer Zone Between Oil & Gas Extraction Activities and Nearby Communities.”
Below is the introduction, and you can find the full memo here.
The purpose of this memo is to recommend guidelines to CalGEM for evaluating the economic value of the social benefits and costs to people and the environment in requiring a 2,500 foot setback for oil and gas drilling (OGD) activities. The 2,500’ setback distance should be considered a minimum required setback. The extensive technical literature, which we reference below, analyzes health benefits to populations when they live much farther away than 2,500’, such as 1km to 5km, but 2,500’ is a minimal setback in much of the literature. Economic analyses of the benefits and costs of setbacks should follow the technical literature and consider setbacks beyond 2,500’ also.
The social benefits and costs derive primarily from reducing the negative impacts of OGD pollution of soil, water, and air on the well-being of nearby communities. The impacts include a long list of health conditions that are known to result from hazardous exposures in the vulnerable populations living nearby. The benefits and costs to the OGD industry of implementing a setback are more limited under the assumption that the proposed setback will not impact total production of oil and gas.
The comment letter submitted by Voices in Solidarity against Oil in Neighborhoods (VISIÓN) on November 30, 2020 lays out an inclusive approach to assessing the health and safety consequences to the communities living near oil and gas extraction activities. This memo addresses how CalGEM might analyze the economic value of the net social benefits from reducing the pollution suffered by nearby communities. In doing so, this memo provides detailed recommendations on one part of the broader holistic evaluation that CalGEM must use in deciding the setback rule.
This memo consists of two parts. The first part documents factors that CalGEM should take into account when evaluating the economic benefits and costs of the forthcoming proposed rule. These include factors like the adverse health impacts of pollution from OGD, the hazards causing them and their sources, and the way they manifest into social and economic costs. It also describes populations that are particularly vulnerable to pollution and its effects as well as geographic factors that impact outcomes.
The second part of this memo documents the direct and indirect economic benefits of the proposed rule. Here, the memo discusses the methods and data that should be leveraged to analyze economic benefits of reducing exposure to OGD pollution through setbacks. This includes the health benefits, impacts on worker productivity, opportunity costs of OGD activity within the proposed setback, and the fact that impacted communities are paying the external costs of OGD.
Please find the full memo here.
The fossil fuel industry has historically taken advantage of the nation’s mineral estate for private profit, while outsourcing the public health debts of degraded environmental quality to Frontline Communities. While President Biden has recently ordered the Department of Interior to put a 60-day halt on permitting new oil and gas drilling permits on federal lands, no such policy exists for state lands in California. Governor Newsom’s administration has allowed the California Geological Energy Management Division to issue rework and new drilling permits on California state lands, bringing the total number of operational oil and gas wells on state lands up to a total of 178, almost half of which are “idle.” This number pales in comparison to the number of California oil and gas wells on federal lands; a total of 6,997 operational wells.
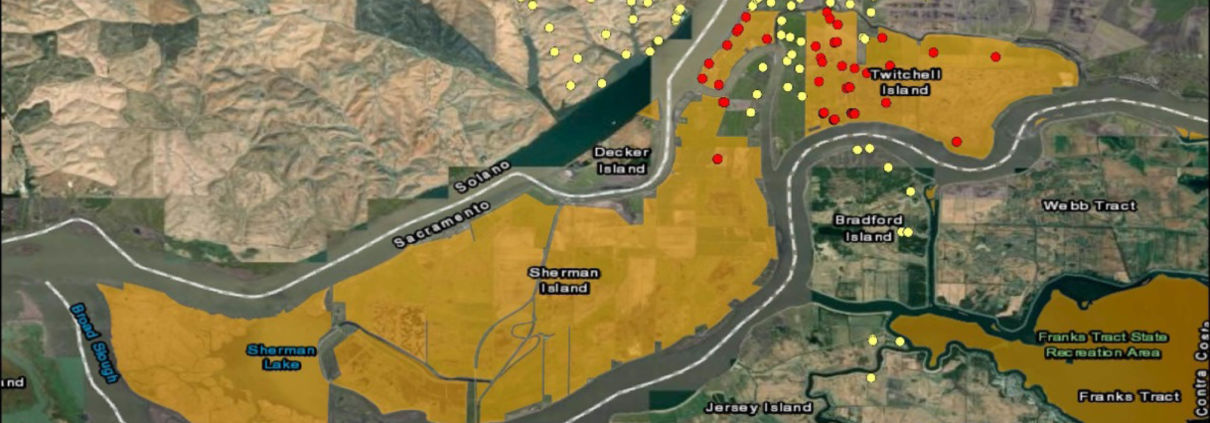
FracTracker Alliance has mapped out the operational oil and gas wells located on state lands in California, using the California Protected Areas Database. The areas containing the highest concentrations of oil and gas wells on state lands include two sensitive ecosystem environments. Figure 1 shows the 102 operational oil and gas wells located in Southern California’s Bolsa Chica Ecological Preserve. The wells are part of the Huntington Beach oil field. The preserve shares marine habitat with a marine protected area (MPA) and is habitat for numerous rare and several endangered species. More sensitive habitat also threatened by oil and gas extraction; Figure 2 shows the oil and gas production wells on the Sacramento River Delta, just upriver of the Bay Area. It is habitat for several threatened and endangered species such as the Delta Smelt and Giant Garter Snake.
California needs Governor Newsom to take a stand against the further exploitation of California’s public lands. A ban on permitting new wells on state land and a commitment to plug existing wells would set an example for Biden’s administration to make the current 60-day freeze a permanent policy.
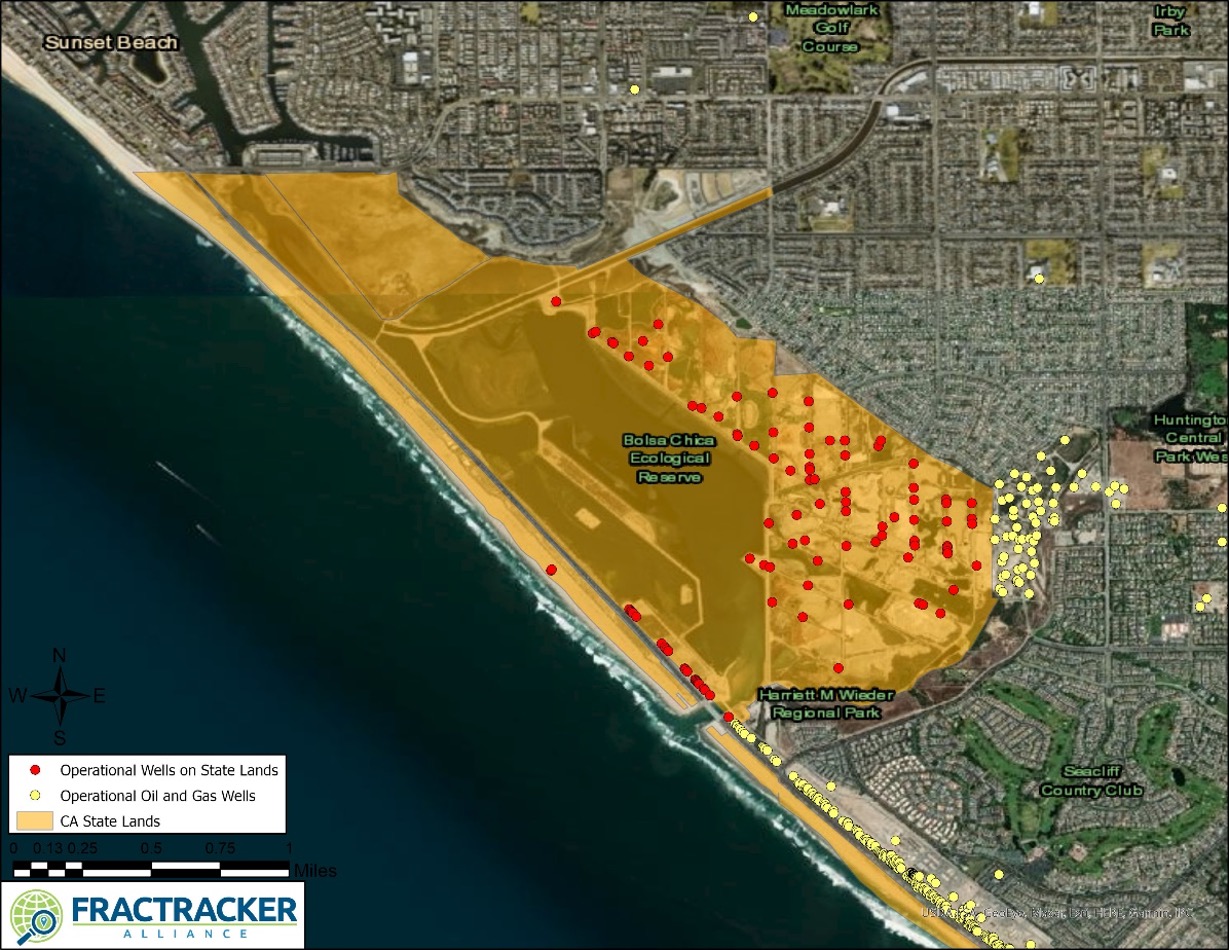
Figure 1. The Bolsa Chica Ecological Preserve hosts over 100 operational oil and gas wells that put the preserve’s ecological habitat at risk.
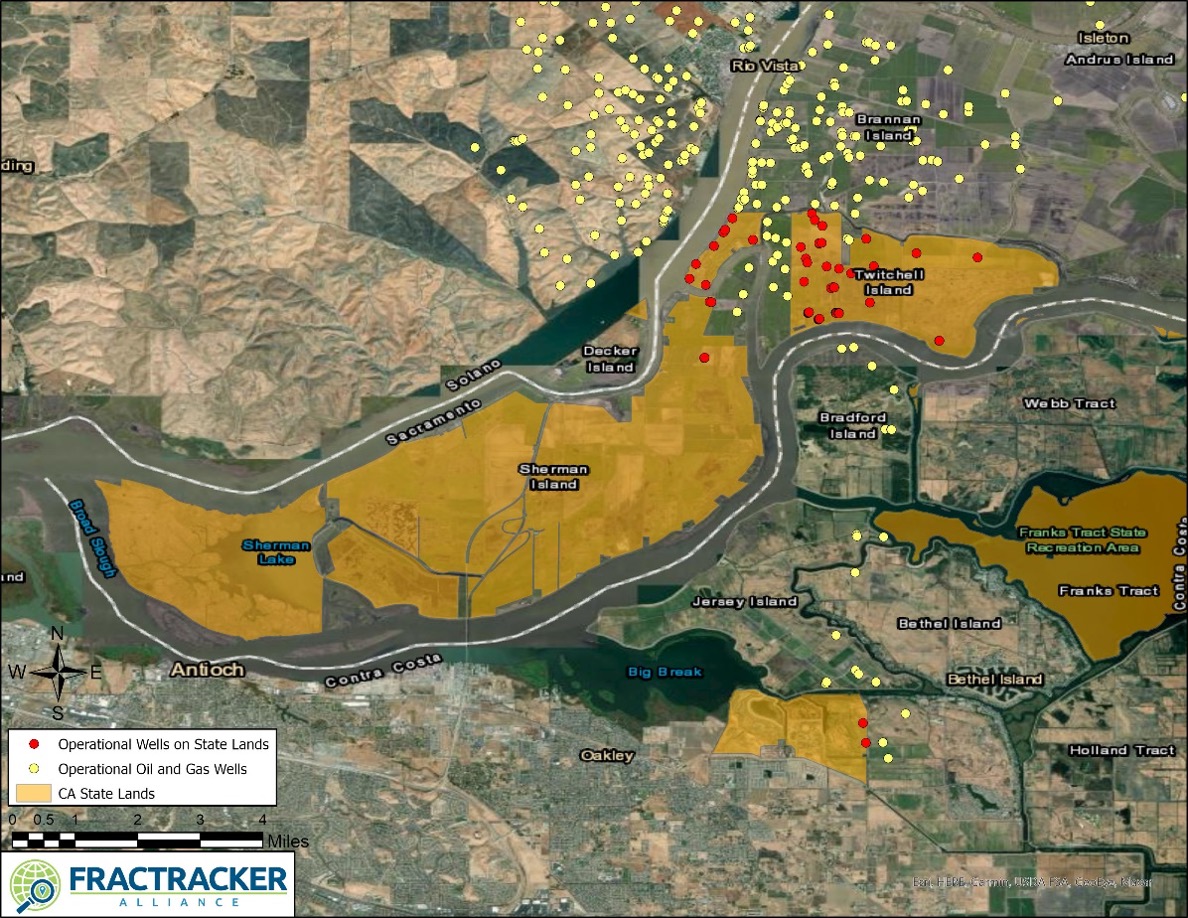
Figure 2. There are 50 operational oil and gas wells permitted on California state lands in the Sacramento River Delta.
See more California maps and articles here.
By Kyle Ferrar, Western Program Coordinator, FracTracker Alliance
New research shows that low-income communities and communities of color that are most impacted by oil and gas extraction (Frontline Communities) in California are at an elevated risk for preterm birth, low birth weight, and other negative birth outcomes. This is in addition to the elevated risks of cancer; risks for respiratory, cardiovascular, and pulmonary disorders; and risks for eyes, ears, nose, throat, and skin irritation that Frontline Communities face, among others. Public health interventions including setback requirements for oil and gas drilling are necessary to address the environmental health endemics documented in Frontline Communities.
This report focuses on the two immediate stakeholders impacted by oil and gas well drilling setbacks: Frontline Communities and oil and gas operators. First, using U.S. Census data this report helps to define the Frontline Communities most impacted by oil and gas extraction. Then, using GIS techniques and California state data, this report estimates the potential impact of a setback on California’s oil production. Results and conclusions of these analyses are outlined below.
Demographics
CalEnviroScreen
Spatial Bias
Well Density
Shafter
Lost Hills, Arvin, and Taft
Bakersfield
Ventura
Los Angeles
Los Angeles
Kern County
The energy focused on instituting policies to protect the health of Frontline Communities in California from the negative impacts of oil and gas extraction is at an all-time high. In August 2020, Assembly Bill 345 was heard in the State Senate’s Natural Resources Committee, but was blocked from reaching the Senate floor for a vote. The bill would have required the Geologic Energy Management Division in the Department of Conservation (CalGEM) to establish a minimum setback distance between oil and gas production and related activities and sensitive receptors like homes, schools, and hospitals. While this strong effort to establish health and safety setbacks through the state legislature may have failed, the movement has paved the way for local actions. Additionally, California is in the midst of a statewide public health rule-making process to address the health impacts of oil and gas extraction currently experienced by Frontline Communities.
In related advocacy, Frontline Community groups in California recommended a minimum 2500’ setback based on scientific studies, including a 2015 report by the California Council on Science and Technology which identified “significant” health risks at a distance of one-half mile from drill sites. A recent grand jury report from Pennsylvania recommended 5,000’ setbacks, with 2,500’ as a minimum requirement to address the most impacted communities. Additionally, the state of Colorado has recently adopted 2,000’ setbacks for homes and schools, while the existing 2,000’ setback has had minimal impacts on oil and gas production.
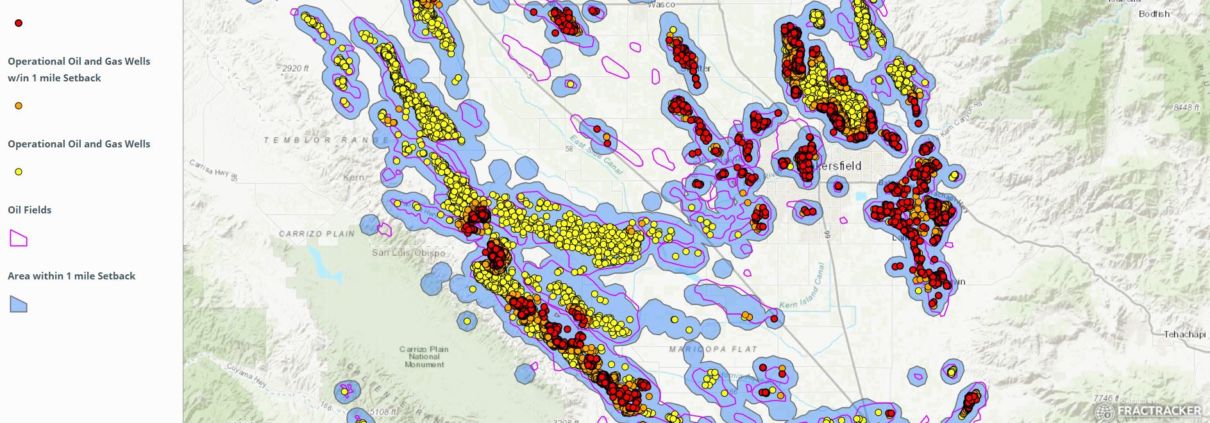
In September 2020, Governor Newsom declared the deadline for the first draft of the pre-regulatory rule-making report will be the first of January 2021. FracTracker Alliance has therefore completed an updated assessment of the Frontline Communities most impacted by oil and has projected the potential impact on oil and gas extraction operations. An interactive map of oil and gas activity and Frontline Communities is shown below in Figure 1. The map identifies the operational (active, idle, and new) oil and gas wells located within 2,500’ and 1 mile buffer zones from sensitive receptors, defined as homes, schools, licensed daycares and healthcare facilities.
The impacts of oil and gas drilling do not stop at 2,500’, as regional groundwater contamination and air quality degradation of ozone creation and PM2.5 concentrations are widespread hazards of oil and gas extraction. Phasing out wells within 2,500’ of homes will reduce the negative health effects for the Frontline Communities bearing the brunt of the risks associated with living near oil and gas wells, as well as reduce regional environmental hazards. These risks include over 24 categories of health impacts and symptoms associated with 14 bodily systems, including eyes, ears, nose, and throat; mental health; reproduction and pregnancy; endocrine; respiratory; cardiovascular and pulmonary; blood and immune system; kidneys and urinary system; general health; sexual health; and physical health among others. The most regularly documented health outcomes include mortality, asthma and respiratory outcomes, cancer risk including hematological (blood) cancer, preterm birth, low birth weight and other negative birth outcomes.
The interactive map below in Figure 1 shows the operational oil and gas wells located within 2,500’ of sensitive receptors, including homes, schools, healthcare facilities, prisons, and permitted daycares. Overall in the state of California, 16,724 operational (8,618 active, 7,786 idle, and 320 new) wells are located within the 2,500’ setback. Of the total ~105,000 operational (62,000 active, 37,400 idle, and 6,000 new), about 16% are within the setback. These wells accounted for 12.8% of the total oil/condensate produced in California in 2019. Table 1 below shows the counties where these wells are located, by well permit status. It bears noting that these figures on well location and production represent only a snapshot of current industry activity. As discussed below, current setback proposals would provide a phase out period for existing wells that would greatly reduce any immediate impact on production. Further, directional and even horizontal drilling is common in California, meaning operators can relocate their surface drilling equipment to safer distances and still access oil and gas reserves to maintain production.
Table 1. Status of wells within the 2,500’ setback zone, by county. The table shows the counts of wells located within the 2,500’ setback from homes and other sensitive receptors, broken out by the status of the wells.
| Well Count by Status | |||
| County | Active | New | Idle |
| Kern | 3,501 | 234 | 2,171 |
| Los Angeles | 2,580 | 29 | 3,006 |
| Orange | 914 | 13 | 816 |
| Ventura | 534 | 7 | 600 |
| Santa Barbara | 198 | 17 | 241 |
| Los Angeles Offshore | 168 | 2 | 51 |
| Glenn | 133 | 76 | |
| San Joaquin | 97 | 71 | |
| Monterey | 88 | 9 | 95 |
| Fresno | 86 | 6 | 137 |
| Sutter | 73 | 71 | |
| Tulare | 65 | 1 | 30 |
| Colusa | 47 | 80 | |
| Tehama | 38 | 34 | |
| Solano | 30 | 0 | 65 |
| Sacramento | 22 | 1 | 38 |
| San Bernardino | 14 | 29 | |
| Humboldt | 12 | 11 | |
| Alameda | 7 | 3 | |
| Contra Costa | 5 | 1 | 16 |
| San Benito | 3 | 4 | |
| San Luis Obispo | 2 | 14 | |
| Yolo | 1 | 13 | |
| Grand Total | 8,618 | 320 | 7,786 |
Figure 1. Map of California operational oil and gas wells with 2,500’ and one mile setback distances. One mile setbacks are included as a minimum recommendation of this report based on peer reviewed literature. This report recommends the state of California consider one mile as a minimum setback distance to protect Frontline Communities. As you zoom into the map additional, more detailed layers will appear.
In this article we conducted spatial analyses using both the demographics of Frontline Communities and the amount of oil produced from wells near Frontline Communities. This assessment used CalGEM data (updated 10/1/20) to map the locations of operational oil and gas wells and permits, as shown above in Figure 1. The analyses of oil production data utilized CalGEM’s annual production data reporting barrels of oil/condensate. GIS analyses were completed using ESRI ArcGIs Pro Ver. 2.6.1 with data projected in NAD83 California Teale Albers.
Wells within 2,500’ and 1 mile of sensitive receptors were determined using GIS techniques. This report defines sensitive receptors as residences, schools, licensed child daycare centers, healthcare facilities. Sensitive receptor datasets were downloaded from California Health and Human Services, and the California Department of Education.
We used block group level “census designated areas” from American Community Survey (2013-2018) demographics to estimate counts of Californians living near oil and gas extraction activity. Census block groups were clipped using the buffered datasets of operational oil and gas wells. A uniform population distribution within the census blocks was assumed in order to determine the population counts of block groups within 2,500’ of an operational oil and gas well, 2,500’ to 1 mile from an operational well, and beyond 1 mile from an operational well. Census demographics and total population counts were scaled using the proportion of the clipped block groups within the setback area (Areal percentage = Area of block group within [2,500’; 2,500’-1 mile; Beyond 1 mile] of an operational well / Total area of block group).
This conservative approach provided a general overview of the count and demographics of Californians living near extraction operations, but does little to shed light on most impacted Frontline Communities; specifically urban areas with dense populations near large oil fields. More granular analyses at the local level were necessary to address the spatial bias resulting from non-uniform census block group dimensions and population density distributions, as well as the distribution of operational oil and gas wells within the census block groups. Consequently, we conducted further analysis utilizing customized sample areas for each oil field, which were selected manually using remote sensing data. Full census blocks were used to summarize the actual areas and the urban populations constituting the majority of Frontline Communities.
In the localized, static maps that follow, the census blocks included in the population summaries are shown in pink, while the surrounding census blocks are shown in blue. As seen in Table 2, census data for this initial environmental justice assessment was limited to “Race” (Census Table XO2), “Hispanic or Latino Origin” (Census Table XO3) and several other indicators including “Annual Median Income of Households” (Census Table X19) and “Poverty” (Census Table X17).
As a baseline, it is important to provide statewide estimations to track the total number of Californians living near oil and gas extraction operations. This analysis showed that about 2.17 million Californians live within 2,500’ of an operational oil and gas well, and about 7.37 million Californians live within 1 mile. The demographics of these communities at and between these distances is shown below in Table 2, alongside demographic estimates of the California population living beyond 1 mile from an oil and gas well. Census block groups closer to oil and gas wells have higher proportions of Non-white (calculated by subtracting “White Only” from “Total Population”) and Latinx (“Hispanic or Latino Origin”) populations, as well as higher proportions of low-income households, based on both median annual income and poverty thresholds. The analysis show that communities living closer to oil and gas wells have higher percentages of non-white and Latinx populations when compared to the population living beyond 1 mile from an operational oil and gas wells. Communities closer to oil and gas wells are also more likely to be closer to the poverty threshold with lower median annual household incomes.
Table 2. The table shows statewide demographics at multiple distances from operational oil and gas wells. Included are estimates of the non-white and Latinx proportions of the populations within set distances from operational oil and gas wells. The percentage of populations within several poverty thresholds were also summarized, along with median annual household income and age.
| Distance from an operational oil and gas well | |||
| Indicators of Disparity | Within 2,500′ | 2,500′ – 1 Mile | Beyond 1 Mile (Statewide) |
| Demographics: Non-white | 44.44% | 43.56% | 39.16% |
| Demographics: Latinx | 43.25% | 44.97% | 37.79% |
| Poverty: Under Poverty Threshold | 15.01% | 14.97% | 14.12% |
| Poverty: Under 1.5X Poverty Threshold | 24.31% | 24.85% | 23.25% |
| Poverty: Under 2X Poverty Threshold | 33.59% | 34.25% | 32.17% |
| Median Annual Household Income < $40k | 30.09% | 30.73% | 28.72% |
| Median Annual Household Income <$75k | 53.53% | 54.36% | 51.76% |
| Age: 0-5 years | 6.08% | 6.12% | 6.37% |
| Age: <18 years | 21.54% | 22.12% | 23.39% |
| Age: 65+ | 13.17% | 13.11% | 13.68% |
| Demographics: White only | 55.56% | 56.44% | 60.84% |
CalGEM operational wells data was also overlaid on CalEnviroScreen 3.0 (CES) indicators of environmental health. CES is provided by the Office of Environmental Health Hazard Assessment (OEHHA), on behalf of the California Environmental Protection Agency (CalEPA).
CalEnviroScreen data, like U.S. Census data, is also aggregated at the census block group level. While this data can also suffer from the same spatial bias as the statewide analysis above, CES is still very useful to visualize and map the regional pollution burden to assess disparate impacts. The results of the analysis are shown below in Table 3. Counts of operational oil and gas wells for ranges of CES percentile scores. Higher percentiles represent increased environmental degradation or negative health impacts as specified. Of note, the majority of operational oil and gas wells are located in census tracts with the worst scores for air quality degradation and high incidence of low birth weight.
The large number of wells located in the 60-80th percentile rather than the worst (80-100th percentile) is a result of spatial bias, and the many factors that are aggregated to generate the CES Total Scores. These factors include relative affluence and other indicators of socio-economic status. The majority of the worst (80th-100 percentile for Total CES Score) census block groups are located in low-income urban census block groups, many in Northern California cities that do not host urban drilling operations.
This spatial bias results from edge effects of census block groups, where communities living near oil and gas extraction operations may not live in the same census block groups as the oil and gas wells, and are therefore not counted. The authors would recommend future analyses be designed that use CES data to assess disparate impacts in the census block groups most impacted by oil and gas extraction. Neighboring census block groups that do not physically contain operational wells still suffer the consequences of proximity.
For the asthma rankings, the majority of wells are located in the best CES 3.0 percentile (0-20th percentile) for Asthma. While there is much urban drilling in Los Angeles, the spatial bias in this type of analysis gives more weight to the majority of oil and gas wells that are located in rural areas, which historically have much lower asthma rates. This is a result of the very high incidence of asthma in cities without urban drilling such as the Bay Area and Sacramento (80-100th percentile).
Table 3. Counts of operational oil and gas wells in select CalEnviroScreen 3.0 indicators census tracts.
| Operational Well Counts by CES3.0 Percentile | |||||
| 0-20%ile | 20-40%ile | 40-60%ile | 60-80%ile | 80-100%ile | |
| PM2.5 Air Quality Degradation | 5,708 | 4,237 | 16,614 | 7,089 | 69,987 |
| Ozone Air Quality Degradation | 2,238 | 5,435 | 6,107 | 9,898 | 79,957 |
| Contaminated Drinking Water | 1,019 | 1,675 | 53,452 | 6,214 | 41,206 |
| High Incidence of Low Birth Weight | 10,186 | 13,368 | 14,995 | 3,236 | 58,036 |
| High Incidence of Asthma | 40,247 | 19,827 | 18,902 | 4,867 | 19,792 |
| Total CES 3.0 | 1,583 | 5,756 | 15,671 | 65,356 | 12,985 |
Using census data to assess the demographics of those communities most affected by oil and gas drilling can produce misleading results both because of how census designated areas (census tracts and block groups) are designed and because of the uneven distribution of residents within tracts. For example, the majority of Californians who live closest to high concentrations of oil and gas extraction, such as the Kern River oil field, do so in residentially zoned cities and urban settings. In most Frontline Communities the urban census designated areas do not actually contain many wellsites. Instead urban census designated areas are located next to the “estate” and “industrial” (including petroleum extraction) zoned census designated areas that contain the well-sites.
Estate and industrially zoned census designated areas contain the majority of well-sites in Kern County. They are much larger than residentially zoned areas with very low population densities and higher indicators of socioeconomic status. Population centers within the estate zoned areas are often located on the opposite end and farther from well sites than the lower income communities and communities of color living in the neighboring, residentially-zoned census designated areas (e.g., Lost Hills and Shafter). In these cases the statewide demographic summaries above misrepresent the Frontline Communities who are truly closest to extraction operations. Localized environmental justice demographics assessments can also be manipulated in this way.
For instance, The 2020 Kern County draft EIR (chapter 7 PDF pp. 1292-1305) used well counts aggregated by census tracts to conclude that wells in Kern County were not located in disparately impacted communities. Among other requirements for scientific integrity, the draft Kern EIR fails to take into account how the shape, size, and orientation of census designated areas affect the results of an environmental justice assessment. In addition, the EIR uses low-resolution data summarized at the census tract level. Census tracts are much too large to be used to investigate localized health impacts or disparities. Using these blatantly inadequate methods, the draft EIR even claimed Kern County’s oil and gas wells are predominantly located in higher income, white communities, which is outright wrong. For more specific criticisms of the Draft EIR read the FracTracker analysis of the 2020 Kern County EIR.
Results from these types of analyses can be very misleading. Using generalized methods of attributing wells to specific census designated areas does little to identify the communities most impacted by the localized environmental degradation resulting from oil and gas extraction operations, particularly when large census areas such as census tracts are used.
This report therefore takes a different approach, focusing directly on California’s most heavily drilled communities. To understand who and which communities are most harmed by the large-scale industrial oil and gas extraction operations in California, spatial analyses must be refined to focus individually on the communities closest to the highest density extraction operations. For the analyses below, census block groups within 2,500’ of ten different Frontline Communities, all located near some of California’s largest oil and gas fields, were manually identified. The selected block groups’ major population centers were all located within the 2,500’ buffers. Unlike the statewide analysis above, the localized analyses below do not assume homogenous population distributions. Using these methods, FracTracker has identified and demographically described some of the most vulnerable California communities most at risk to the impacts of oil and gas extraction. In the maps below, the “case” census block groups used to generate descriptive demographic summaries of at risk communities bordering extraction operations are outlined in pink, while surrounding census block groups are outlined in light blue.
The analyses above are important to understand some of the public health risks of living near oil and gas drilling in California. Yet the methods above used statewide aggregation of well counts and static buffers that do not not show the spectrum of risk resulting from well density. Numerous Frontline Communities in California are within 1 mile or even 2,500’ of literally thousands of oil and gas wells. Conversely, there are many census areas in California that have been included within the spatial analysis of the full state, as described above, located near a single low producing well. Therefore the above methods conservatively summarize demographics and dilute the signal of disparate impacts for low income communities of color. Those methods are not able to differentiate between such scenarios as living near one low-producing well in the Beverly Hills golf course versus living in the middle of the Wilmington Oil Field.
As with any toxin, the dosage determines the intensity of the poison. In environmental sciences, increasing exposure to toxins by increasing the number of sources of a toxin can increase the dosage and therefore the severity of the health impact. The impact of well density has been documented in numerous epidemiological studies as a significant indicator of negative health outcomes, including recently published reports from Stanford University and The University of California – Berkeley linking adverse birth outcomes with living near oil and gas wells in California (Tran et. al 2020, Gonzalez et. al 2020). Therefore the rest of this report focuses on the Frontline Communities living near large oil extraction operations–i.e., oil fields with high densities of operational oil and gas wells.
Toggle between the sections below by clicking in the upper left corner of the title bar.
Shafter
The City of Shafter, California, is located near more than 100 operational wells in the North Shafter oil field, as shown below in the map in Figure 2. Technically, the wells are located within a donut-shaped census block group (outlined in blue) that surrounds the limits of the urban census block groups (outlined in pink). Shafter’s population of nearly 20,000 is over 86% Latinx, but the surrounding “donut” with just 2,000 people is about 70% Latinx, much wealthier, and with very low population density. The other neighboring rural census areas housing the rest of the Shafter oil field wells follow this same trend.
An uninformed analysis, such as the Kern County EIR, would conclude that the 2,000 individuals who live within the blue “donut” are at the highest risk, because they share the same census designated area as the wells. Notably, the only population center of this census block group (or census tracts, which follow this same trend) is at the opposite end of the block group, farthest from the Shafter oil field. Instead, the most at-risk community is the urban community of Shafter with high population density; the census block groups within the pink hole of the donut contain the communities and homes nearest the North Shafter field.
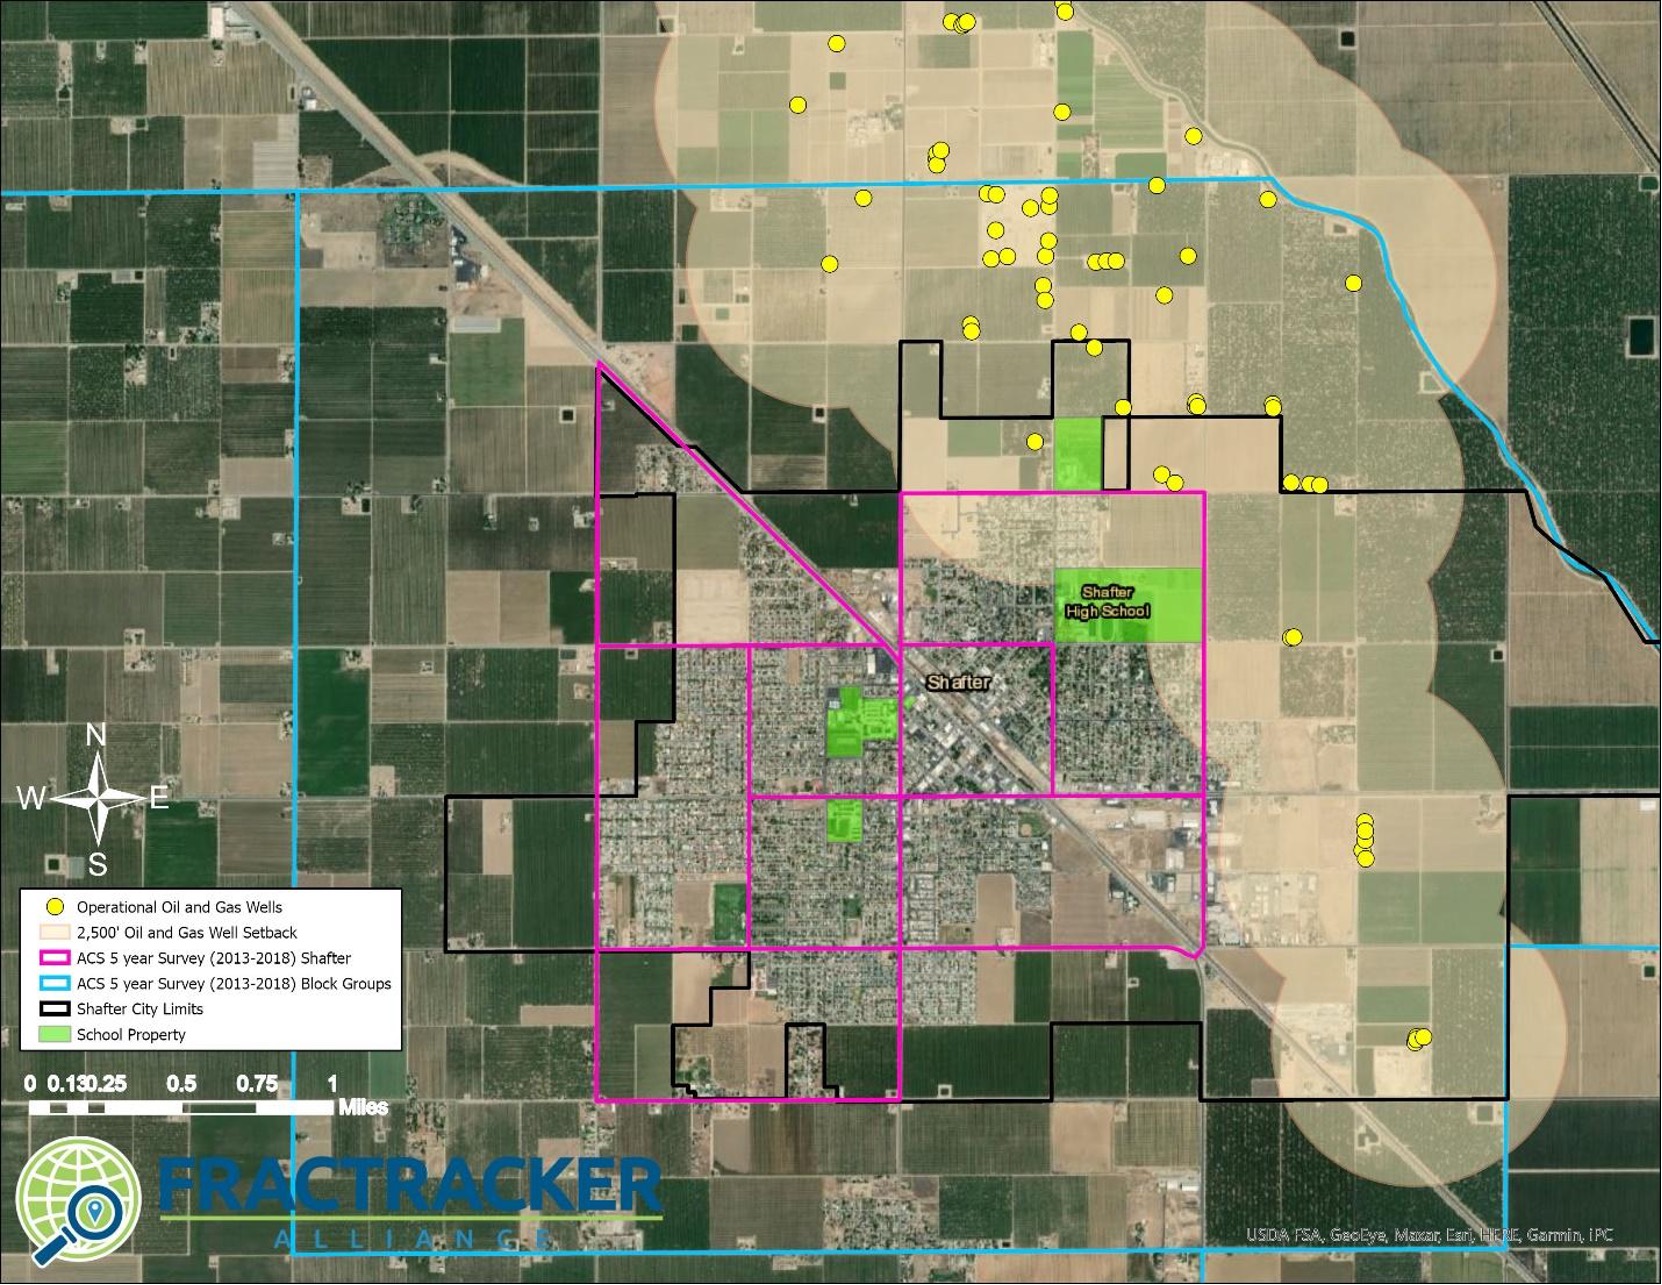
Figure 2. The City of Shafter, California is located just to the south of the North Shafter oil field. The map shows the 2,500’ setback distance in tan, as well as the census block groups in both pink and blue. Pink block groups show the urban case populations used to generate the demographic summaries.
Lost Hills, Arvin, & Taft
The cities of Lost Hills, Arvin, and Taft are all very similar to Shafter. The cities have densely populated urban centers located within or directly next to an oil field. In the maps below in Figures 3 readers can see the community of Lost Hills next to the Lost Hills oil field. Lost Hills, like the densely populated cities of Arvin and Taft, are located very close to large scale extraction operations. Census block groups that include the most impacted area of Lost Hills is outlined in pink, while surrounding low population density census block groups are shown in blue. The majority of the areas outlined in blue are zoned as “estate” and “agriculture” areas. The outlines of the city boundaries are also shown, along with 2,500’ and 1 mile setback distances from currently operational oil and gas wells.
Lost Hills is another situation where a donut-shaped census area distorts the results of low resolution demographics assessments, such as the one conducted by Kern County in their 2020 Draft EIR (PDF pp. 1292-1305). Almost all of the wells within the Lost Hills oil fields are just outside of a 2,500’ setback, but the incredibly high density of extraction operations results in the combined impact of the sum of these wells on degraded air quality. While stringent setback distances from oil and gas wells are a necessary component of environmental justice, a 2,500’ setback on its own is not enough to reduce exposures and risk for the Frontline Community of Lost Hills. For these Frontline Communities, a setback needs to be much larger to reduce exposures. In fact, limiting a public health intervention to a setback requirement alone is not sufficient to address the environmental health inequities in Lost Hills, Shafter, and other similar communities.
Lost Hill’s nearly 2,000 residents are over 99% Latinx, and over 70% of the households make less than $40,000 in annual income (which is substantially less than the annual median income of Kern County households [at $52,479]). The map in Figure 3 shows that the Lost Hills public elementary school is located within 2,500’ of the Lost Hills oil field and within two miles of more than 2,600 operational wells, in addition to the 6,000 operational wells in the rest of the field.
The City of Arvin has 8 operational oil and gas wells within the city limits, and another 71 operational wells within 2 miles. Arvin, with nearly 22,000 people, is over 90% Latinx, and over 60% of the households make less than $40,000 in annual income.
Additionally the City of Taft, located directly between the Buena Vista and Midway Sunset Fields, has a demographic profile with a Latinx population at least 10% higher than the rest of southern Kern County.
Lost Hills, Arvin, and Taft are among the most impacted densely populated areas of Kern County and represent the most Kern citizens at risk of exposure to air quality degradation from oil and gas extraction.
In all of these cases, if only census tract well counts are considered, like in the 2020 Kern County draft EIR, these Frontline Communities will be completely disregarded. Census tracts are intentionally drawn to separate urban/residential areas from industrial/estate/agricultural areas. The census areas that contain the oil fields are very large and sparsely populated, while neighboring census areas with dense population centers, such as these small cities, are most impacted by the oil and gas fields.

Figure 3. The Unincorporated City of Lost Hills in Kern County, California is located within 2,500’ of the Lost Hills Oil Field. The map shows the 2,500’ setback distance in tan, as well as the census block groups in both pink and blue. Pink block groups show the urban case populations used to generate the demographic summaries.
Bakersfield
The City of Bakersfield is a unique scenario. It is the largest city in Kern County and as a result suburban developments surround parts of the city. Urban flight has moved much of the wealth into these suburbs. The suburban sprawl has occurred in directions including North toward the Kern River oil field, predominantly on the field’s western flank in Oildale and Seguro. In the map below in Figure 4, these areas are located just to the north of the Kern River.
This is a poignant example of the development of cheap land for housing developments in an area where oil and gas operations already existed; an issue that needs to be considered in the development of setbacks and public health interventions and policies. This small population of predominantly white, middle class neighborhoods shares similar risks as the lower-income Communities of Color who account for the majority of Bakersfield’s urban center. Even though these suburban communities are less vulnerable to the oppressive forces of systemic racism, real estate markets will continue to prioritize cheap land for development, moving communities closer to extraction operations.
Regardless of the implications of urban sprawl and suburban development, it is important to no disregard the risks to the demographics of the at-risk areas of the city of Bakersfield are predominantly Non-white (31%) and Latinx (60%), particularly as compared to the city’s suburbs (15% Non-white and 26% Latinx). About 33,000 people live in the city’s northern suburbs, and another 470,000 live in Bakersfield’s urban city center just to the south of the 16,500 operational wells in the Kern River, Front, and Bluff oil fields. The urban population of Bakersfield is a large Frontline Community exposed to the local and regional negative air quality impacts of the Kern River and numerous other surrounding oil fields.

Figure 4. Map of the city of Bakersfield in Kern County, California located between several major oil fields including the Kern Front oil field. The map shows the 2,500’ setback distance in tan, as well as the census block groups in both pink and blue. Pink block groups show the urban case populations used to generate the demographic summaries.
Ventura
The City of Ventura and the proximity of the Ventura oil field is a similar situation to cities in Kern. The urban center of Ventura is bisected by the Ventura oil field’s nearly 1,200 operational wells. While over 70% of the city’s population is Latinx, the very sparsely populated census areas also containing portions of the oil field are 34% Latinx.
In the map below in Figure 5, take note of the population distribution within the portion of the city closest to the oil field versus the census areas to the east. While a statewide or less granular analysis would assume an evenly distributed population density, in this localized analysis, it is clear that the most vulnerable Frontline Communities are the urban centers closest to the oil fields. Even though the census blocks to the east contain oil and gas wells, the populations are less at risk because the population centers are located farther from the oil field.
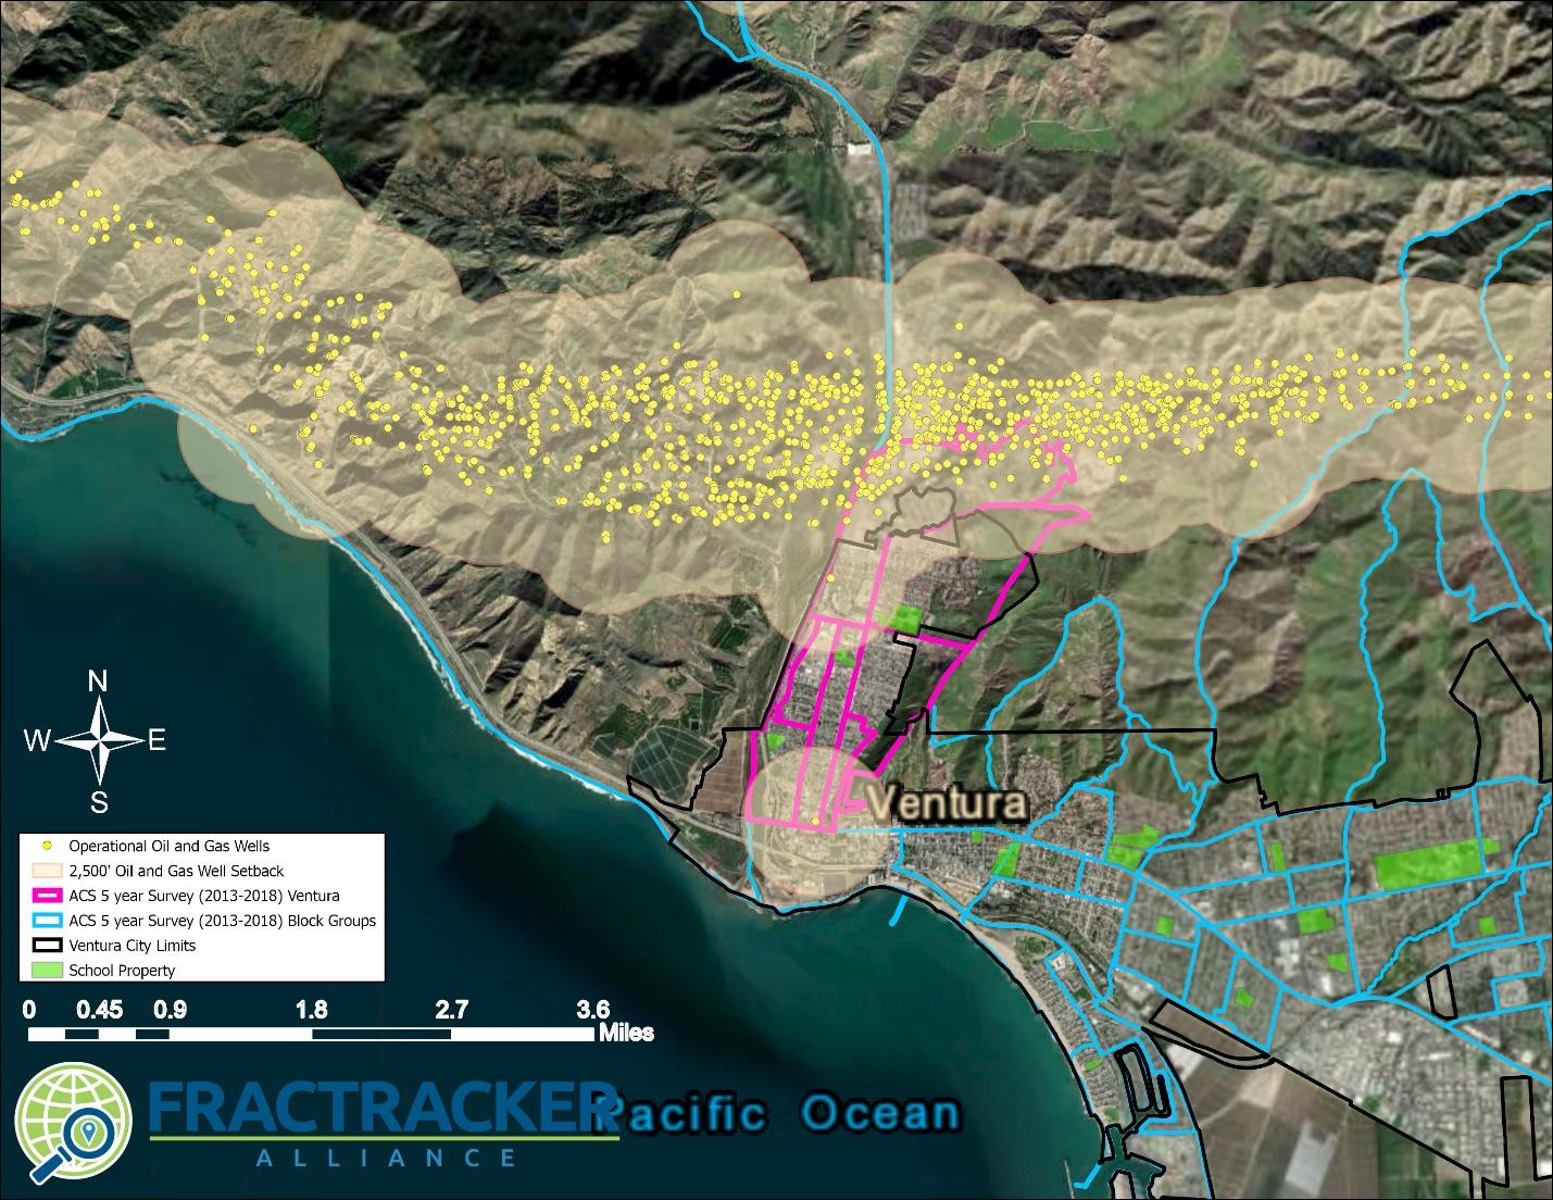
Figure 5. Ventura Oil Field in Ventura, California census areas within the 2,500’ setback area. The map shows the 2,500’ setback distance in tan, as well as the census block groups in both pink and blue. Pink block groups show the urban case populations used to generate the demographic summaries.
In Los Angeles County, Inglewood, Wilmington, Long Beach, and Los Angeles City are some of the largest oil and gas fields. There are many areas in Los Angeles where a single low-producing well is located in an upper middle class suburb, on a golf course, or next to the Beverly Hills High School.
While all well sites present sources of exposure to volatile organic compounds (VOCs) and other air toxics, these four oil fields have incredibly high densities of oil and gas wells in urban neighborhoods. The demographics of the Frontline Communities located within 2,500’ of these major fields are presented below in Table 4. These areas are additionally lower income communities; for example, over 50% of annual household incomes in the census areas surrounding the Los Angeles City oil field are below $40,000, while the Los Angeles County median annual income is over $62,000.
Table 4. Demographics for Frontline Communities living within 2,500’ of Los Angeles’s major oil and gas fields along with counts of operational wells in the fields are shown in the table. The demographic “Latinx” is the count of “Hispanic or Latino Origin” population, and “non-white” was calculated by subtracting “white only” from “total population.”
| Oil Field | Well Count | Non-white (%) | Latinx (%) |
| Inglewood | 914 | 62% | 11% |
| Wilmington | 2,995 | 56% | 63% |
| Long Beach | 687 | 50% | 30% |
| Los Angeles City | 872 | 69% | 59% |
| Ventura | 1,193 | 10% | 72% |
Toggle between the sections below by clicking in the upper left corner of the title bar.
Inglewood
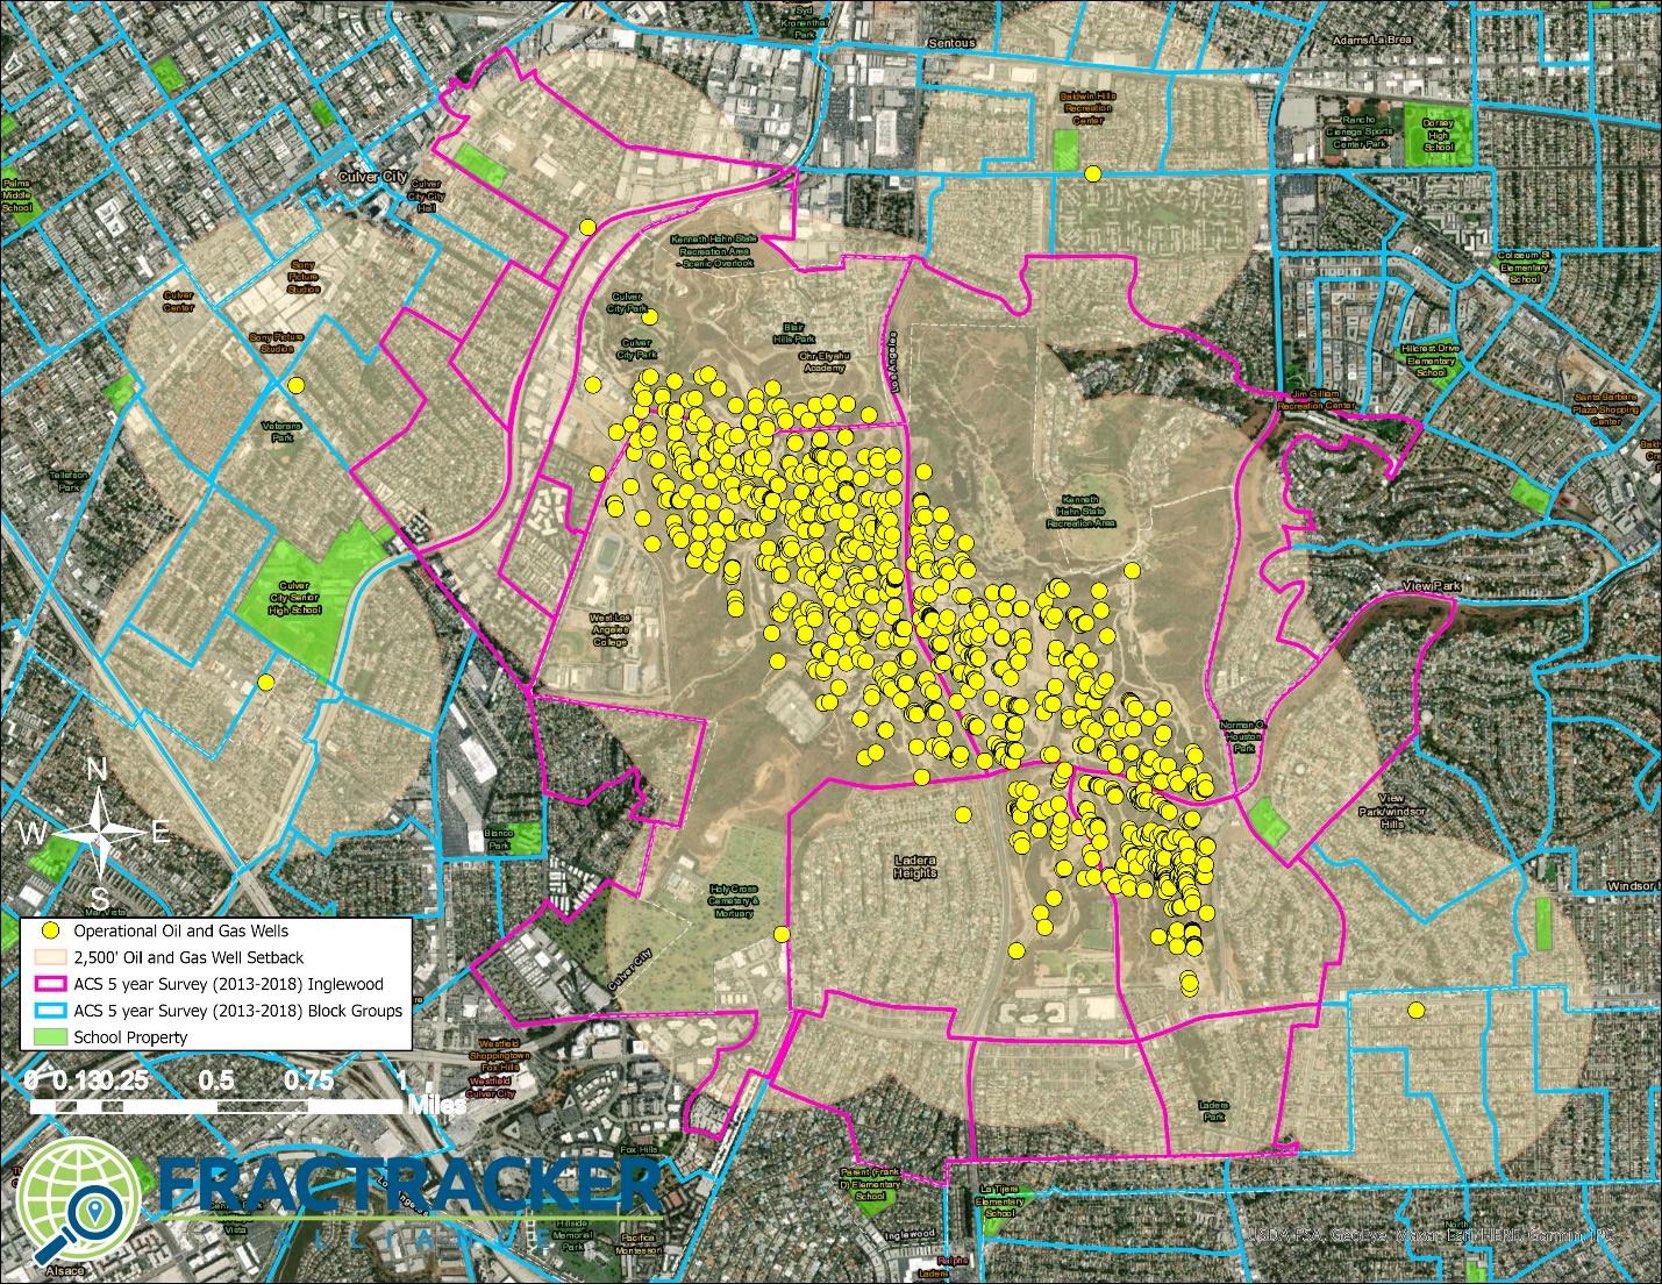
Figure 6. Inglewood Oil Field Frontline Community, Inglewood, California census areas within a 2,500’ setback area. The map shows the 2,500’ setback distance in tan, as well as the census block groups in both pink and blue. Pink block groups show the urban case populations used to generate the demographic summaries.
Wilmington
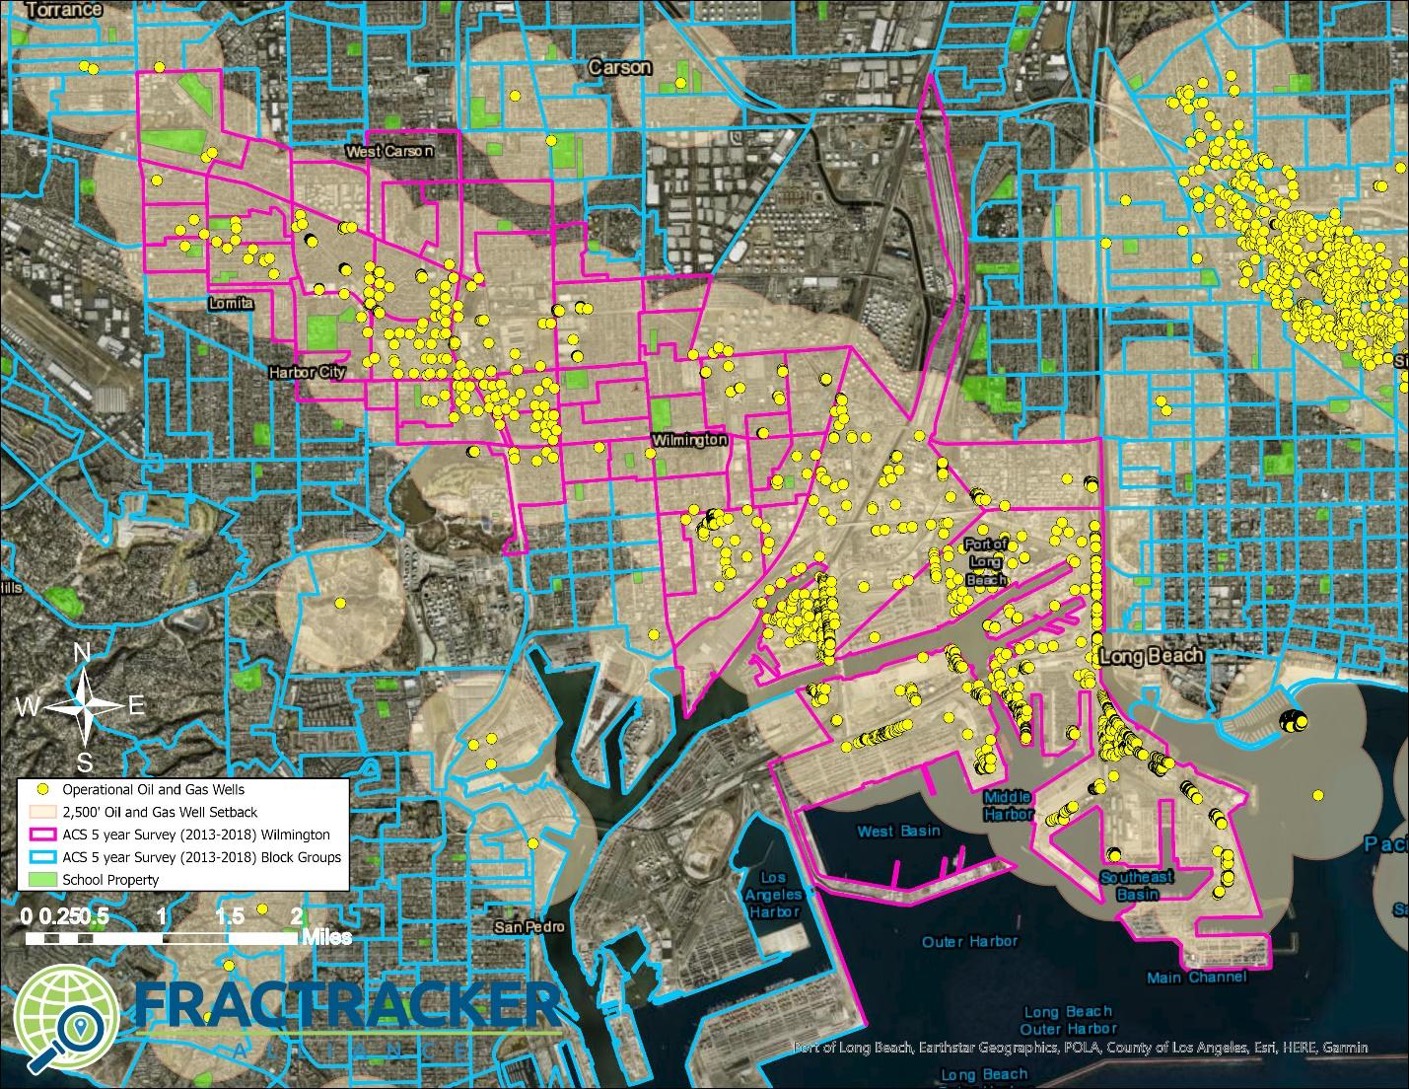
Figure 7. Wilmington Oil Field Frontline Community, Wilmington, California census areas within a 2,500’ setback area. The map shows the 2,500’ setback distance in tan, as well as the census block groups in both pink and blue. Pink block groups show the urban case populations used to generate the demographic summaries.
Long Beach
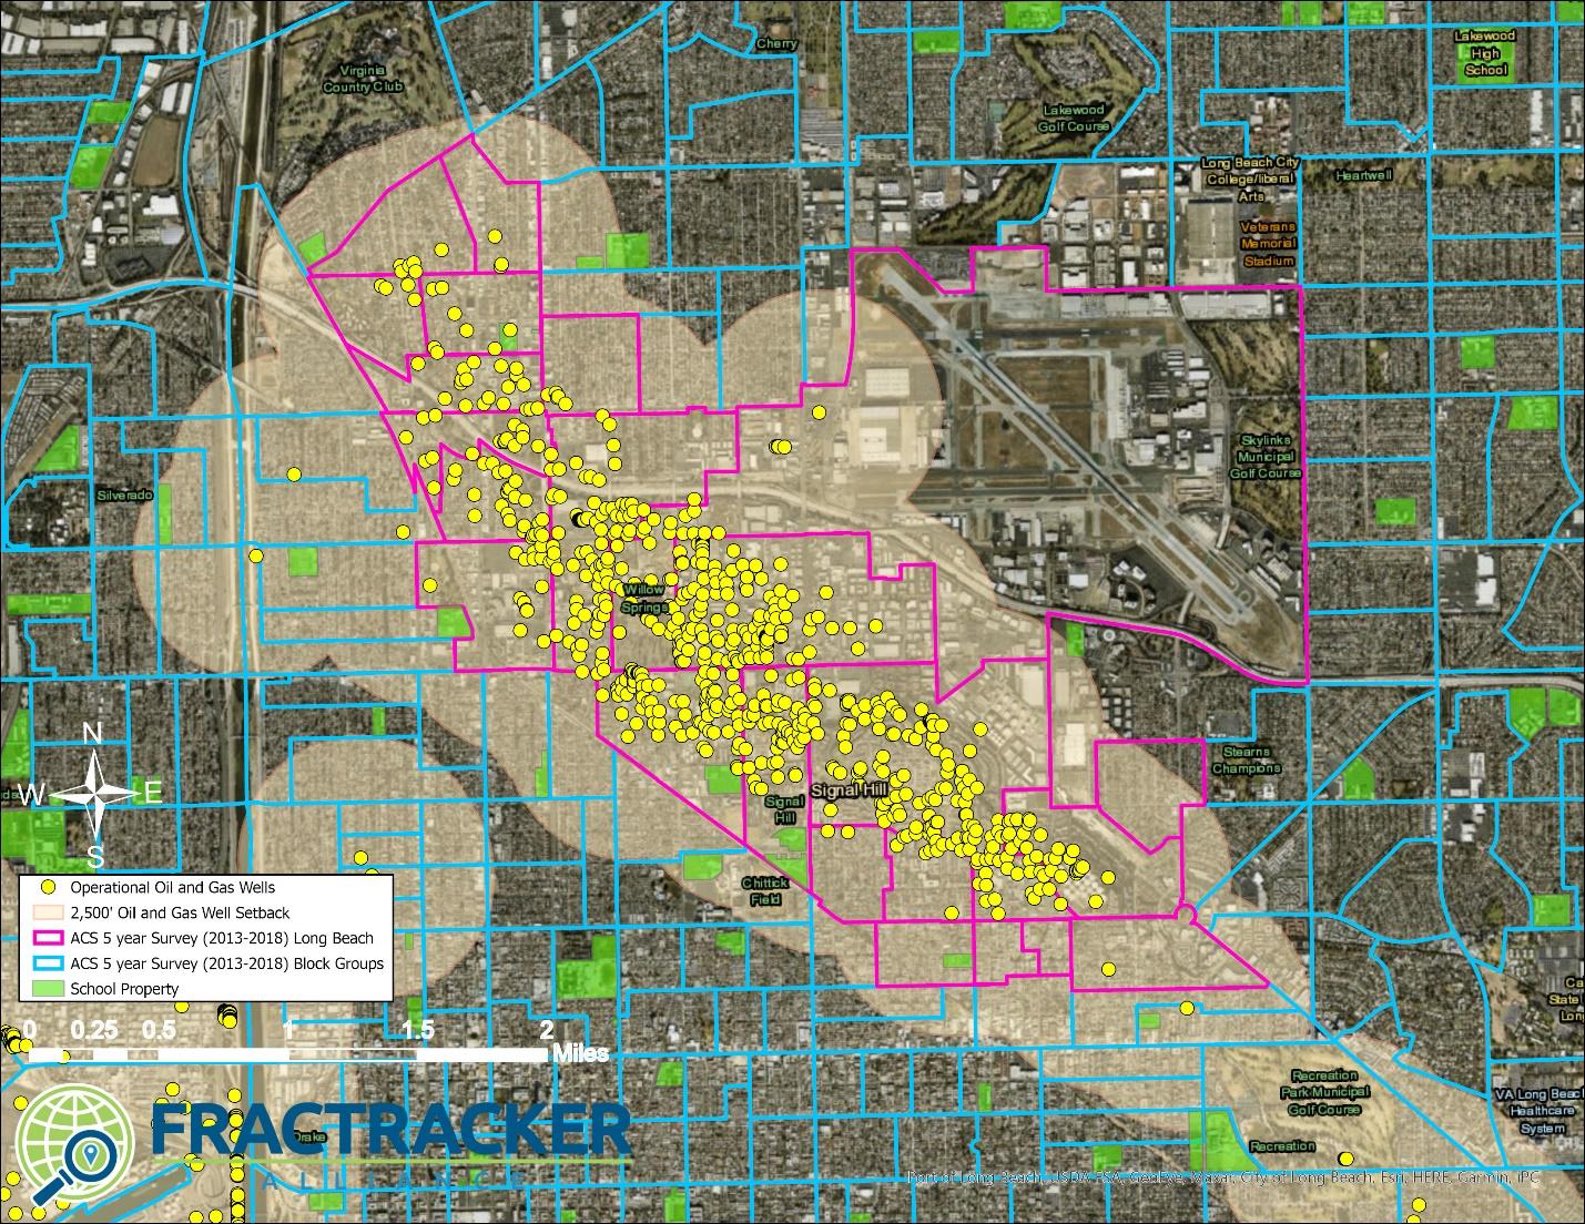
Figure 8. Long Beach Oil Field Frontline Community, Long Beach, California census areas within a 2,500’ setback area. The map shows the 2,500’ setback distance in tan, as well as the census block groups in both pink and blue. Pink block groups show the urban case populations used to generate the demographic summaries.
Los Angeles City
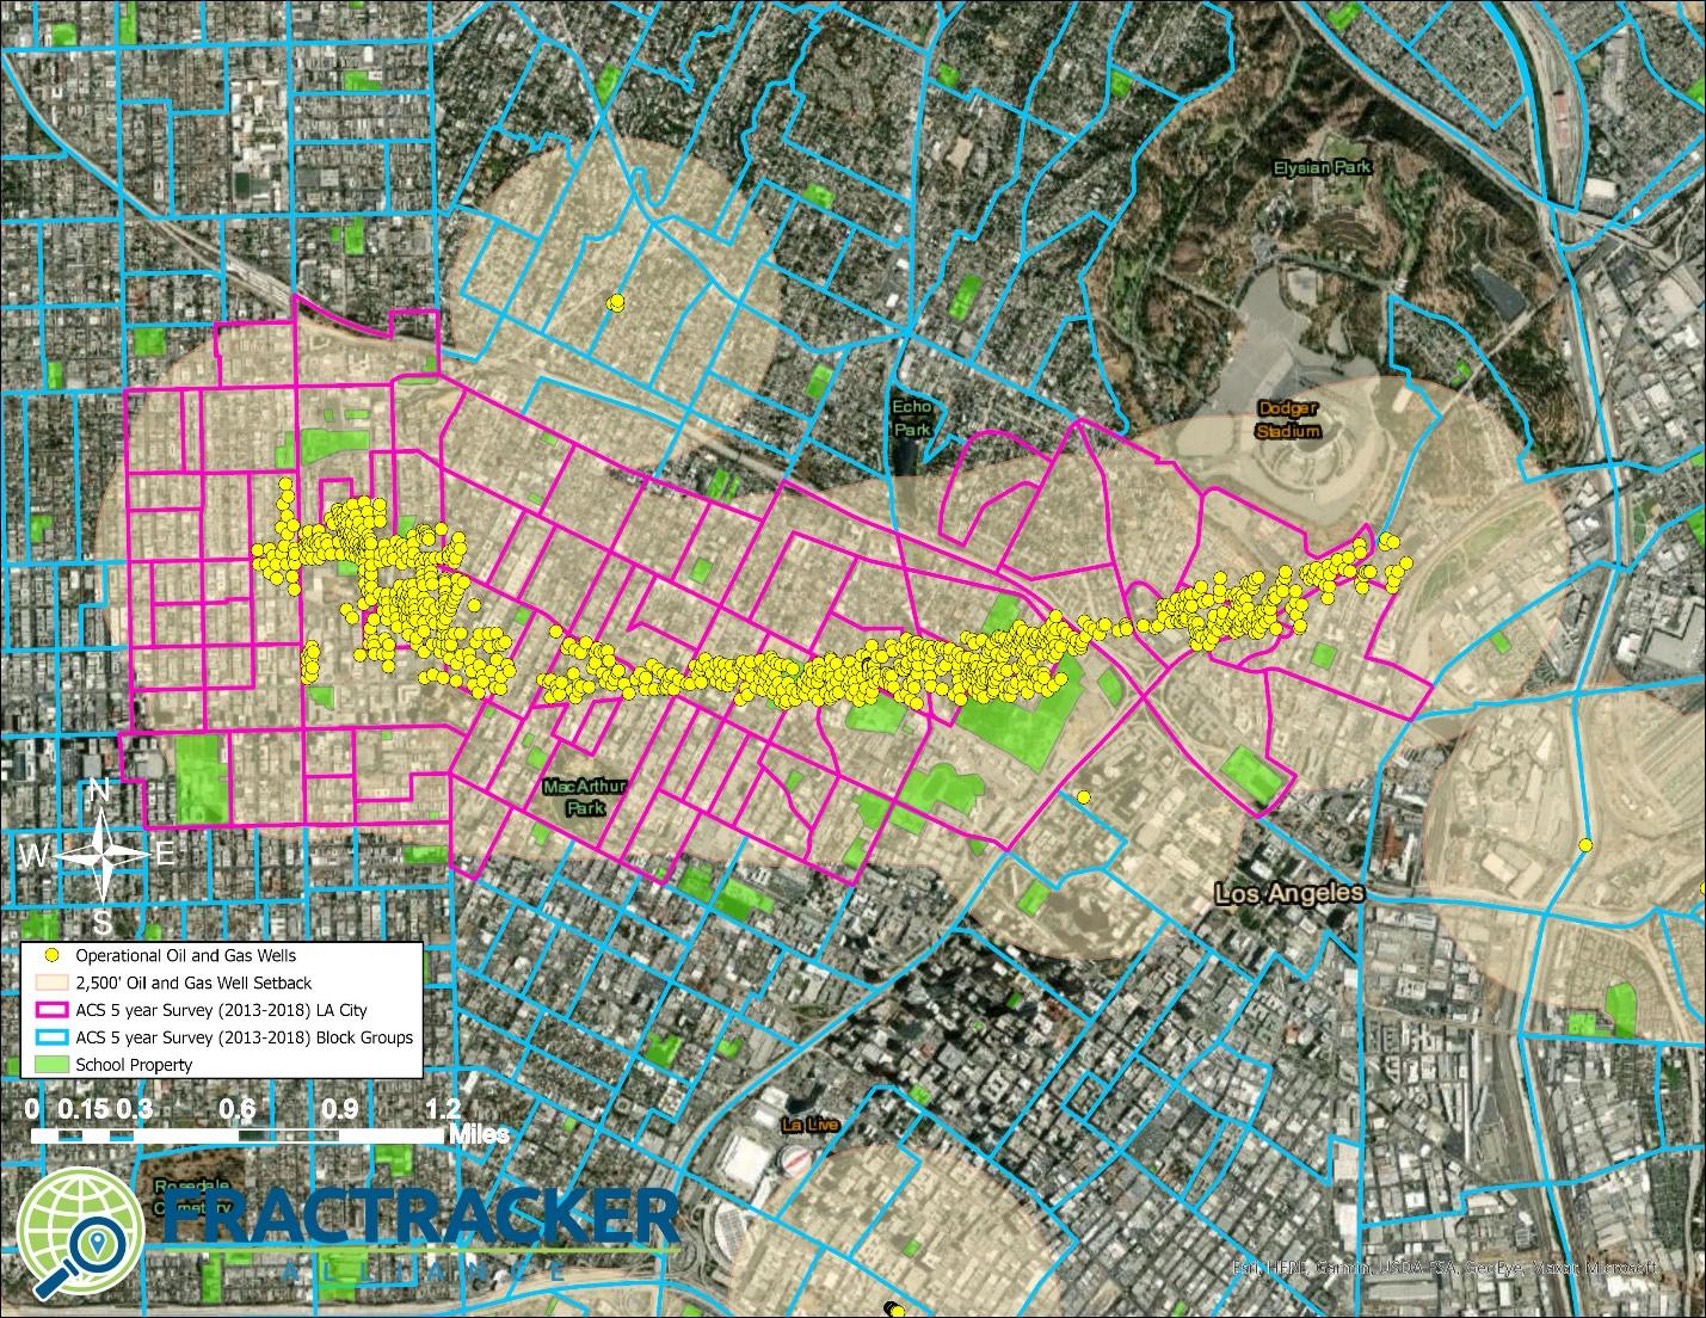
Figure 9. Los Angeles City Oil Field Frontline Community census areas within a 2,500’ setback area. The map shows the 2,500’ setback distance in tan, as well as the census block groups in both pink and blue. Pink block groups show the urban case populations used to generate the demographic summaries.
The creation of public health policies such as 2,500’ setbacks to help protect Frontline Communities is controversial in California as many state legislators are still beholden to the oil and gas industry. The industry itself pushes back strongly against any proposal that could affect their bottom line, no matter how insignificant the financial impact may be. When AB345 was proposed, the industry’s lobbying organization Western States Petroleum Association claimed that institution of 2500’ setbacks would immediately shut down at least 30% of California’s total oil production. This number is an outright fabrication.
As shown in Table 1 above, a 2,500’ setback would impact the less than 9,000 active and new wells; 42% in Kern County and 29% in Los Angeles County. Ventura and Orange Counties are a distant 3rd and 4th, respectively. These counts are further broken down by field in Table 5 below. Statewide these wells accounted for just 12.8% of California’s current oil production by volume (as reported in barrels of oil/condensate by CalGEM), which is much smaller than the wholly unsubstantiated 30% decline claimed by industry.
Table 5. Counts of wells by well status for operational (active, idle, and new) oil and gas wells located within a 2,500’ setback. Fields include the count of wells within the 2,500’ setback and the amount of oil produced from those wells within the setback. The percentage of total oil from that field is also included.
| Oil Field | County | Well Count | Well Ct % of Total | 2019 Oil Prod (BBLS) | Oil Prod % of Total |
| Wilmington | Los Angeles | 2,514 | 83% | 2,292,669 | 22% |
| Kern River | Kern | 1,338 | 9% | 2,121,071 | 12% |
| Inglewood | Los Angeles | 891 | 97% | 1,806,354 | 96% |
| Midway-Sunset | Kern | 1,892 | 10% | 1,614,081 | 8% |
| Ventura | Ventura | 287 | 24% | 1,202,764 | 31% |
| Long Beach | Los Angeles | 687 | 100% | 1,036,506 | 100% |
| Brea-Olinda | Los Angeles | 695 | 97% | 967,223 | 95% |
| Huntington Beach | Orange | 528 | 83% | 753,494 | 42% |
| Placerita | Los Angeles | 448 | 100% | 508,182 | 100% |
| Santa Fe Springs | Los Angeles | 304 | 99% | 421,719 | 72% |
| Cat Canyon | Santa Barbara | 115 | 10% | 418,697 | 36% |
| Beverly Hills | Los Angeles | 156 | 100% | 351,877 | 100% |
| McKittrick | Kern | 334 | 18% | 346,738 | 10% |
| Montebello | Los Angeles | 227 | 98% | 318,657 | 97% |
| Fruitvale | Kern | 286 | 80% | 316,184 | 75% |
| San Ardo | Monterey | 180 | 13% | 313,339 | 4% |
| Torrance | Los Angeles | 219 | 100% | 307,413 | 100% |
| Seal Beach | Los Angeles | 175 | 88% | 282,790 | 74% |
| Shafter, North | Kern | 70 | 78% | 267,256 | 66% |
| Edison | Kern | 520 | 41% | 261,098 | 39% |
| Brentwood | Contra Costa | 4 | 100% | 230,868 | 100% |
| Oxnard | Ventura | 124 | 82% | 214,884 | 100% |
| Sansinena | Los Angeles | 162 | 100% | 207,474 | 100% |
| Poso Creek | Kern | 320 | 16% | 193,533 | 4% |
| Rosecrans | Los Angeles | 94 | 100% | 174,720 | 100% |
| Rio Bravo | Kern | 80 | 74% | 166,444 | 82% |
| Richfield | Orange | 231 | 100% | 165,426 | 100% |
| Coyote, East | Orange | 81 | 100% | 163,639 | 100% |
| San Vicente | Los Angeles | 48 | 100% | 162,940 | 100% |
In the case that setback regulations are crafted both to prohibit new drilling and to phase out existing operations within the setback distance, the industry would have the opportunity to respond with measures that preserve the majority of production volumes, particularly in the Central Valley. For example, in Kern County, the overwhelming majority of new wells drilled in 2020 are directional or horizontal; these drilling technologies would allow operators to access the same below ground resources from surface locations that are further away from and safer for communities. Further, for existing wells within the 2,500’ setback, current proposals would institute a phase out period. Existing wells could be allowed to continue to operate under the terms of their current permits but not allowed to expand or rework their operations to increase or extend production; alternatively (or in addition), well operators could continue for a prescribed timeframe formulated to allow them to recoup their investment (called “amortization”).
It is clear that the oil fields of Los Angeles would be the most impacted if setbacks phased out the wells responsible for the highest risk to Frontline Communities. The majority of Los Angeles’s urban oil fields are located entirely within 2,500’ of homes, schools, healthcare facilities and daycares.
As shown above in Table 5, wells within the setback produce 96% of the oil in the Inglewood fields, 84% in the Long Beach field, and 100% of the oil in several other smaller fields. With the phase out of these wells, oil extraction would cease in these fields. Most of these fields produce very low volumes of oil and already have high counts of idle wells, 28% idle in Wilmington, 25% in Inglewood, and 56% in Long Beach for example. The sole outlier of this trend is the Wilmington field. The majority of production in the Wilmington field comes from wells located in the Long Beach harbor, enough of them located outside of the 2,500’ setback such that while 83% of the Wilmington field wells are within the 2,500’ setback, these wells account for only 22% of the field’s overall production.
The situation in Kern County is quite the opposite of Los Angeles, where the majority of operational wells are located within 2,500’ of homes, residences, and other sensitive receptors like healthcare facilities. In Kern, the overwhelming majority of wells are located beyond 2,500’ and even 1 mile from sensitive receptors. While the Midway-Sunset and Kern River fields have the most wells within the 2,500’ setback area, those wells make up a small percentage of the total operational wells in the fields. As can be seen in the map in Figure 1, wells within the 2,500’ setback zone in the large Kern oil fields are entirely located on the borders of the fields. Overall, a 2,500’ setback in Kern County would only affect 7.1% of active/new wells, accounting for 5.97% of the county’s production.
The oil and gas industry and operators in states including Texas, Colorado, North Dakota, Pennsylvania, Ohio, West Virginia, New Mexico, and Oklahoma are very vocal of their ability to avoid surface disturbance and target oil and gas pools located under sensitive receptors (homes, schools, healthcare facilities, endangered species habitat etc.) using directional drilling. According to the industry, directional drilling has been used for nearly a century to extract resources from areas where surface disruption would impact sensitive communities and habitats.
The same is true for California, especially in Kern County and especially recently. An October 2020 draft environmental impact report by the Kern County Planning and Natural Resource Department disclosed that in a dataset of 9,803 wells drilled from 2000 to 2020 by the California Resources Corporation, the majority of wells were drilled directionally (46%) or horizontally (10%), as opposed to vertically. More recent wells in the County have utilized directional and horizontal drilling even more heavily: a 2020 dataset of wells drilled county-wide indicates that 76% were drilled directionally and an additional 7% were drilled horizontally; only 17% were drilled vertically. These statistics indicate that, even if all wells neighboring Frontline Communities in Kern County were to be phased out (itself a small percentage of the total number of wells in the county), there would only be a small impact on Kern County oil production owing to the prevalence of non-vertical techniques that allow operators the flexibility to access reserves from different surface locations. As noted previously, if all oil production from within the 2,500’ setback zone were to be immediately eliminated statewide, it would mean a maximum decrease of just 12.8% of California’s current annual oil production. But the availability of directional and horizontal drilling in Kern County, where the lion’s share of all drilling statewide occurs, means it is more likely that the decrease in production will be significantly less than 12.8% and likely much less than 10%.
Any assertion that a 2,500’ setback would immediately affect oil production is baseless because current setback proposals would institute a phase out period for existing wells. For example, existing permitted wells could be allowed to continue to operate under the terms of their current permits but not allowed to expand or rework their operations to increase or extend production. Alternatively, under a policy approach known as amortization, well operators could continue for a prescribed timeframe formulated to allow them to recoup their investment.
If wells within the setback distance are phased out pursuant to a “no rework” policy, operators would be afforded some time to maximize production in order to ensure that operators receive a sufficient return on their investment under the terms of their existing permits before they shut down. Under such an approach, older wells with increasing risks of fugitive emissions through leaks at the surface and well casing failures could be sequentially phased out by placing a ban on rework permits not required for maintenance or safety. CalGEM permitted well reworks, including sidetracks and deeper drills, increase production and the lifespan of wells. The catalog of rework permits can be found on the CalGEM website.
Based on CalGEM’s production data from 2018 and 2019, a phase out effectuated by disallowing well reworks would result in an annual reduction of less than 1% of total oil production. Of the 52,997 wells reporting oil/condensate production volumes in 2018, 338 received a rework permit in the same year. In 2019, of the 48,860 wells reporting oil production volumes, 285 received rework permits. By volume, the wells that received rework permits accounted for 0.87% of oil production in 2018 and just 0.04% in 2019.
The oil and gas industry in California has consistently pushed back against Frontline Communities who demand public health protections against emissions from oil and gas operations. This occurs even when there will be little to no impact reducing production. It is an industry policy to refuse any concessions and oppose all measures, even to protect public health, by leveraging the industry’s wealth at every level of the political hierarchy.
Fatefully, 2020 has resulted in multiple wins for public health in California. While the failure of AB345 made it clear that the California state legislature is still beholden to the fossil fuel industry, the momentum has continued. Community grassroots groups in Ventura County successfully passed a 1,500’ setback ordinance for occupied dwellings and 2,500’ setbacks for sensitive receptor sites including healthcare facilities and schools. Just south of Ventura, the County of Los Angeles is also in the midst of a rule-making process that is considering multiple setbacks, including 1,000’ to 2,500’ distances. And a committee of the Los Angeles City Council just voted to develop a proposal that would phase out oil drilling across the city as a non-conforming use.
While Ventura and Los Angeles are making progress, Kern County is creating a new process to streamline oil and gas well permitting and has even proposed to decrease the existing zone-specific 300’ setbacks from homes to 210’.
Kern County Frontline Communities and the rest of California also deserve the same consideration as residents of Ventura and Los Angeles Counties. The research is clear that a setback of at least one mile in addition to more site specific public health interventions are necessary to reduce the negative health impacts resulting from these industrial operations within and neighboring Frontline Communities.
By Kyle Ferrar, Western Program Coordinator, FracTracker Alliance

Working with the environmental nonprofit Earthworks, FracTracker Alliance filmed emissions from oil and gas sites that have been issued permits in California under Governor Gavin Newsom since the beginning of 2019. Using state-of-the-art technology called optical gas imaging (OGI), we documented otherwise invisible toxic pollutants and greenhouse gas emissions (GHGs) being released from oil and gas wells and other infrastructure. This powerful technology provides further evidence of the negative consequences that come from each issued permit. Every single permit approval enabled by decisions made under Newsom can have substantial, visible impacts on local and regional air quality, contributes to climate change, and potentially exposes communities to health-harming pollution.
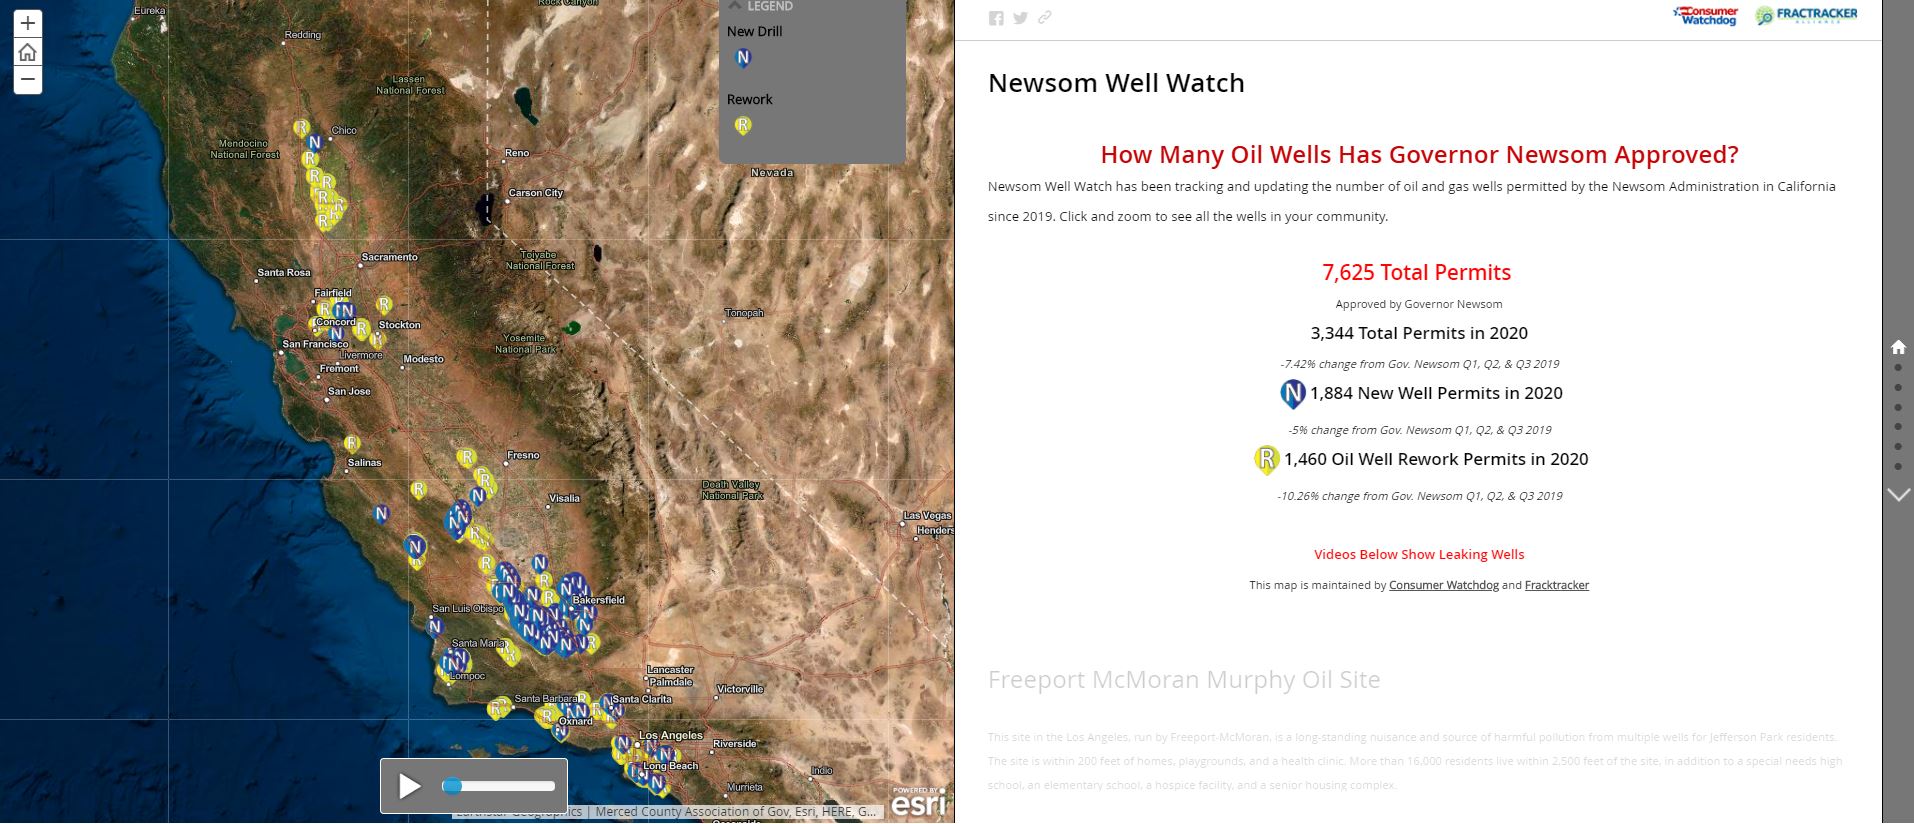
Despite a stated commitment to transition rapidly off fossil fuels, California has issued 7,625 permits to drill new oil and gas wells and rework existing wells since the beginning of 2019 — that is, on Governor Gavin Newsom’s watch. This expansion of the industry has clear implications for climate change and public health, as this article will demonstrate.
In collaboration with Consumer Watchdog, FracTracker Alliance has been periodically reporting on the number and locations of oil and gas wells permitted by Governor Newsom in California. In July of 2019, we showed how the rate of fracking under Governor Newsom had doubled, as compared to counts under former Governor Brown. Since then we have continued tracking the numbers and updating the California public via multiple news stories, blog reports, and with a map of new permits on NewsomWellWatch.com, where permitting data for the third quarter of 2020 has just been posted.
Now again, the rate of new oil and gas well permits issued by the California Geologic Energy Management division (CALGEM) continues to increase even faster in 2020, with permits issued to drill new oil and gas production wells nearly doubling since 2019. But what exactly does this mean for Frontline Communities and climate change? To answer this question, FracTracker Alliance and Consumer Watchdog teamed up with Earthworks’ Community Empowerment Project (CEP).
CEP’s California team worked with community members and grassroots groups to film emissions of methane and other volatile organic compounds (VOCs) emitted from oil and gas extraction sites, including infrastructure servicing oil and gas production wells such as the well-heads, separators, compressors, crude oil and produced water tanks, and gathering lines. Emissions of GHGs, such as methane, are a violation of the California Air Resources Board’s (CARB) California oil and gas rule (COGR), California Code of Regulations, Title 17, Division 3, Chapter 1, Subchapter 10 Climate Change, Article 4, § 95669, Leak Detection and Repair.
The emissions were filmed by a certified thermographer with a FLIR (Forward Looking Infrared) GF320 camera that uses optical gas imaging (OGI) technology. The OGI technology allows the camera to film and record visualizations of VOC emissions based on the absorption of infrared light. It is the exact same technology required by the U.S. EPA under the rule for new source performance standards and the by California Air Resources Board for Leak Detection and Repair (LDAR) to properly inspect oil and gas infrastructure. The video footage clearly shows the presence of a range of VOCs, methane, and other gases that are otherwise invisible to the naked eye.
The footage shown below is in greyscale and can appear grainy when the camera is being operated in high sensitivity modes, which is sometimes necessary to visualize certain pollution releases. The descriptions preceding each video explain what the trained camera operator saw and documented. A map of these sites is presented at NewsomWellWatch.com.
Navigate to the next slide using the arrows at the bottom of the map.
Find the story map, and more by clicking the image below.
Earthworks’ California CEP thermographer visited this site in December of 2019, and just happened to arrive while the operator (oil and gas company) was conducting activities underground, including drilling new wells and reworking existing wells. In 2019 the operator, Vaquero Energy, was approved to drill 10 new cyclic steam wells and rework 23 existing oil and gas production wells at this site.
The footage shows significant emissions coming from an unknown source near the wellheads on the well pad; most likely these emissions were coming directly from the open boreholes of the wells. The emissions potentially include a cocktail of VOCs and GHGs such as methane, ethane, benzene, and toluene. This footage provides a candid view of what is released during these types of activities. The pollution shown appears to be the result of an uncontrolled source commonly resulting from drilling and reworking wells
Additionally, inspectors are rarely, if ever, present during these types of activities to ensure that they are conducted in accordance with regulations. The CEP camera operator reported the emissions and provided the OGI video to the Santa Barbara County Air Pollution Control District. By the time the inspector arrived, however, the drilling crew had ceased operations. The inspector did not detect any of these emissions, and as a result the operator was not held accountable for this large pollution release.
In the footage below, the emissions can be seen traveling over the fenceline of the well pad, swirling and mixing with the wind. This site is a clear example of what to look for in the following videos, since the emissions are so obvious. Fortunately, there are no homes or buildings in close proximity to this site, which potentially limited direct pollution exposure — although the pollution still degrades air quality and can pose an occupational health risk to oil field workers.
The Murphy Drill Site in Los Angeles has been a long-standing nuisance and source of harmful pollution for neighbors in Jefferson Park. The site houses 31 individual operational wells, including 9 enhanced oil recovery injection wells and 22 oil and gas production wells, as shown below in the map in Figure 1. The wells are operated by Freeport-McMoran, while the site is owned by the Catholic archdiocese of Los Angeles. The site is within 200 feet of homes, playgrounds and a health clinic. There are over 16,000 residents within 2,500’ of the site, as well as a special needs high school, an elementary school, a hospice facility, and a senior housing complex.
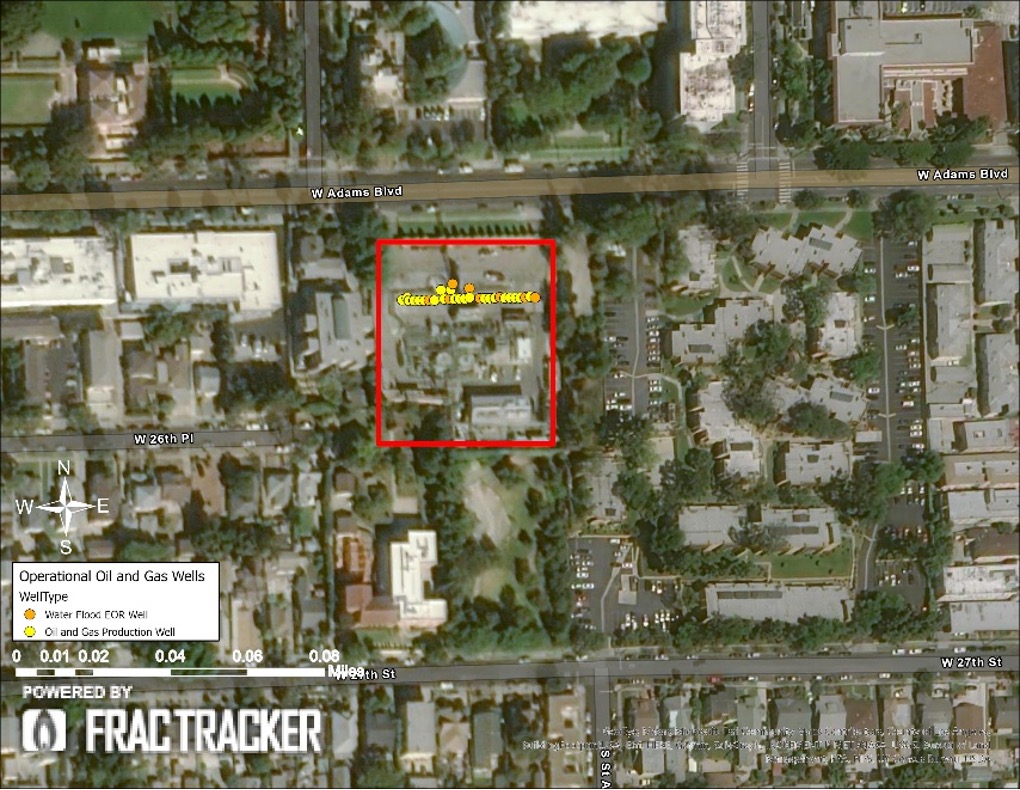
Figure 1. Map of the Murphy drill site
The neighborhoods near the Murphy Site are plagued with strong chemical odors, including those linked to oil and gas operations (such as the “rotten egg” smell of health-harming hydrogen sulfide), most likely from the toxic waste incinerators on site. Community members have suffered from respiratory problems, chronic nosebleeds, skin and eye irritation, and headaches. The operators have received multiple violations, including for releasing emissions at concentrations 400% over the allowable limit of methane and VOCs. Some of these violations were the direct result of complaints from the community and the Earthworks CEP team, which filmed pollution from the site on multiple occasions. Yet despite receiving “Notices of Violations” and fines, Freeport-McMoran has been allowed to continue operations. In OGI footage, emissions are visible continuously escaping from a vent on the equipment. While this leak has been addressed by regulators, each new visit to this site tends to result in finding new uncontrolled emissions sources.
The Jefferson drill site is very similar situation to the Murphy Site. The sites have the same operator, Freeport-McMoran, and surrounding neighborhoods in both locations have suffered from exposure to toxic pollution as well as odors, truck traffic, and noise. The Jefferson site has 49 operational wells, including 15 enhanced oil recovery wells, as shown below in Figure 2. In 2013 the operator reported using over 130,000 pounds of corrosive acids and other toxic chemicals for enhanced oil recovery operations. Regardless, an environmental impact report has never been completed for this site.
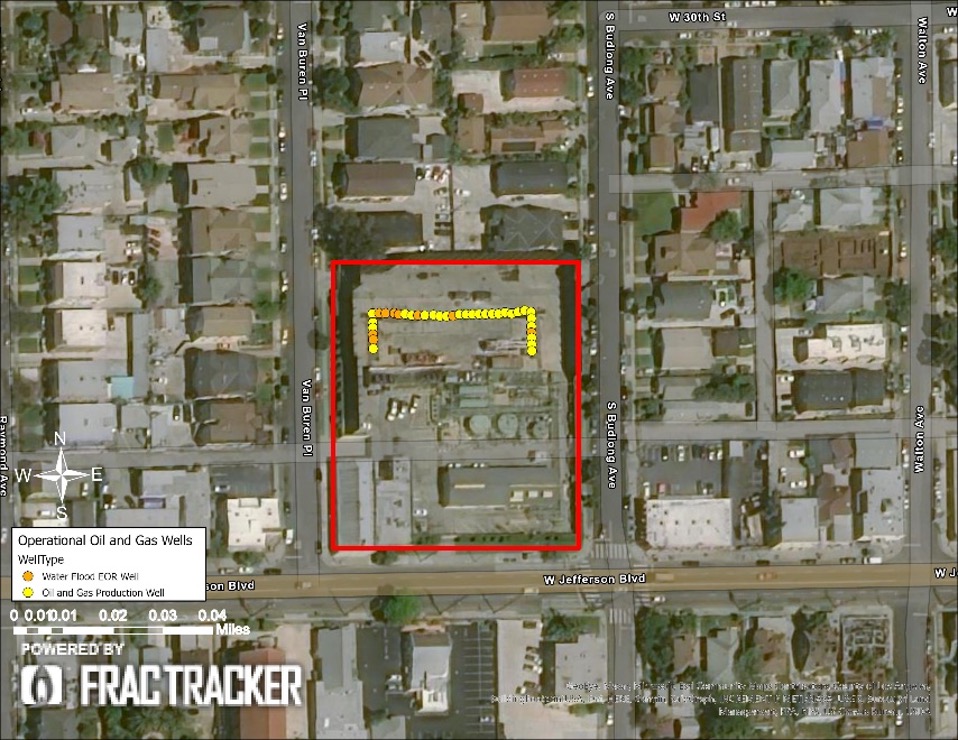
Figure 2. Map of the Jefferson drill site in South Los Angeles.
The site is located 3 feet from the nearest home, and the surrounding residential buildings are considered “buffers” for the rest of the neighborhood, which also includes an elementary school about 700 feet away. The site was nearly shut down by the City of Los Angeles in 2019, but is currently still operational. In 2019 the site was even issued a permit to rework an existing well in order to increase production from the site. The footage below shows a large, consistent release of pollution from equipment on the well pad. The plume appears above the site and is visible against the background of the sky. The Earthworks CEP team reported the pollution to the South Coast Air Quality Management District (SCAQMD), which conducted an inspection, stopped the leak, and issued a notice of violation and a fine. It is not clear exactly how long this pollution problem had gone unnoticed or unaddressed, and it is not unlikely that another leak will occur without being quickly identified.
The WNF-I drilling site is located in Carson in the City of Los Angeles. Operated by E&B Natural resources in the Wilmington oil and gas field, the site houses 35 operational oil and gas wells, including 12 enhanced oil recovery wells and a wastewater disposal well. There is also extensive above-ground infrastructure on the well site, including a large, high-volume tank battery used to store oil and wastewater produced from numerous oil and gas wells in the area.
Using OGI, Earthworks identified a large pollution release from the top of the largest tank. In the video footage, the plume or cloud of gases (likely methane and VOCs) can be seen hovering over the site and slowly dispersing over the fence-line into the communities of West Carson and Avalon Village. Despite clear operational problems, CalGEM approved this site for two rework permits in 2019 and then three re-drills (known as sidetracks) of existing wells in 2020 in order to increase production. The SCAQMD reports that they have inspected this facility, but it is not clear whether this major uncontrolled source has been stopped.
At an urban drilling site in the neighborhood of Signal Hill in Los Angeles County, Earthworks filmed and documented pollution releases from numerous pieces of equipment. The site includes 15 operational oil and gas wells operated by Signal Hill Petroleum and The Termo Company. Emissions of gases (likely methane and VOCs) were documented on infrastructure from both operators. At this site, Signal Hill Petroleum received a permit in April 2019 to rework an operational well to increase production. That well is located less than 70’ from a home.
While this site is located within Los Angeles County, it is outside the jurisdiction of the city itself. Any local protections for drilling sites within the Los Angeles city limits are not afforded to communities such as Signal Hill. This area that includes the Signal Hill oil field and the Signal Hill portion of the Long Beach oil field, where many well sites are unmaintained and oversight is limited — conditions that in turn can result in corrosion and pollution leaks. The SCAQMD inspected this site and reported that these uncontrolled sources of emissions have been addressed by the operator, but it is not clear if the emission have stopped.
This tank farm, located in Kern County, services a number of wells operated by Holmes Western Oil Corporation on the outskirts of the Mid-Way Sunset Field. Of the wells serviced by this site, permits were issued to four active oil and gas production wells in 2019. The permits authorized the operator to rework the wellbores in order to increase production. The site contains nine operational oil and gas wells, including eight production wells pumping oil to the surface and one wastewater disposal well. There are multiple homes near this site, within 400’ to the west and within 300’ to the northeast.
For each gallon of oil produced, another ten gallons of contaminated wastewater are brought to the surface. Using diesel or gas generators this wastewater is pumped back into the ground. California regulators have a bad track record of managing underground injection of wastewater, which is now under the U.S. EPA’s oversight. The groundwater in this area of Kern County is largely contaminated and considered a sacrifice zone.
The emissions from this site are from the pressure release valves on the tops of multiple tanks. The tanks store both crude oil and wastewater. The infrared spectrum allows the camera to film the tank levels, which are nearly full. As the tanks fill with more crude oil and hydrocarbon contaminated wastewater the head space of the tank pressurizes with more VOC’s. This footage was also filmed at night when emissions are typically much lower. During the day heat from the sun (radiative energy) heats the tanks and increases the head space pressure resulting in greater emissions. While the San Joaquin Valley Air Pollution Control District (SJVAPCD) was notified of these uncontrolled sources of emissions, their own inspections of the site did not identify an actionable offense on the part of the operator and these uncontrolled emissions continue to be released.
Crude oil and wastewater storage tanks are a common source of fugitive emissions and represent the majority of emissions presented in this report. Some tanks and well-sites use best practices that include closed vapor recovery systems to prevent venting tanks from leaking, but the vast majority do not and vent directly to the atmosphere. In all cases, tanks and pipeline infrastructure use pressure release valves to vent emissions when pressure builds too high. This venting is permitted as strictly an emergency activity to prevent hazardous build-up of pressure. Vents are even designed to open and reset themselves automatically. Consequently, tank venting is a common practice and operators seem to often leave these valves open.
While the recently enacted California Oil and Gas Rule (COGR) places limits on GHG emissions from all oil and gas facilities, internal policy of the San Joaquin Air Valley Air Pollution Control District has previously exempted tanks at low-producing well sites from having to be kept in a leak-free condition, creating a regulatory conflict that air districts and CARB need to resolve. This type of emissions source is also difficult for regulators to identify during inspections, for a number of reasons. These valves are typically located on the tops of large tanks where they are difficult to access and view, and inspections and sampling can only occur by chance (i.e., when the valve in open). Further, these valves can be immediately closed by operators during or upon notification of an upcoming inspection.
When Earthworks CEP uses OGI cameras to inspect an oil and gas site in California, finding and documenting pollution releases is so common that it is the default expectation. Because of access and proximity limitations, it is possible that more pollution is being released from sites than CEP can identify. All of these examples of pollution, including releases of methane and VOCs, add up to potentially degrade air quality and expose Frontline Communities to health risks — as well as many others just like them. This summary represents a small collection of leaking well sites visited by Earthworks CEP, which have coincidentally received new permits to operate and rework existing wells since January 1, 2019. CEP has also documented many other hazardous cases, such as the Jewett 1-23 site in Arvin (shown in the footage below), that is persistently exposing elementary school students to VOCs. These sites surely make up only a small proportion of the polluting oil and gas sites in California that harm climate and health.
From the initial drilling of an oil and gas well, during production, and into subsequent reworks, all phases of a well’s lifetime result in unpermitted and undocumented fugitive emissions. Regulating emissions from oil and gas extraction operations has not been effective in California. Regardless of notices of violations and fines, polluting facilities and well sites continue to operate and even receive new permits. Even the COGR rule, lauded as the most stringent GHG emissions regulation in the nation is technically unable to eliminate or even identify these uncontrolled sources. It is clear that the only ways to reduce exposures to these emissions for Frontline Communities is to institute protective setbacks and stop permitting the drilling of new wells and the reworking of aging wells.
By Kyle Ferrar, Western Program Coordinator, FracTracker Alliance
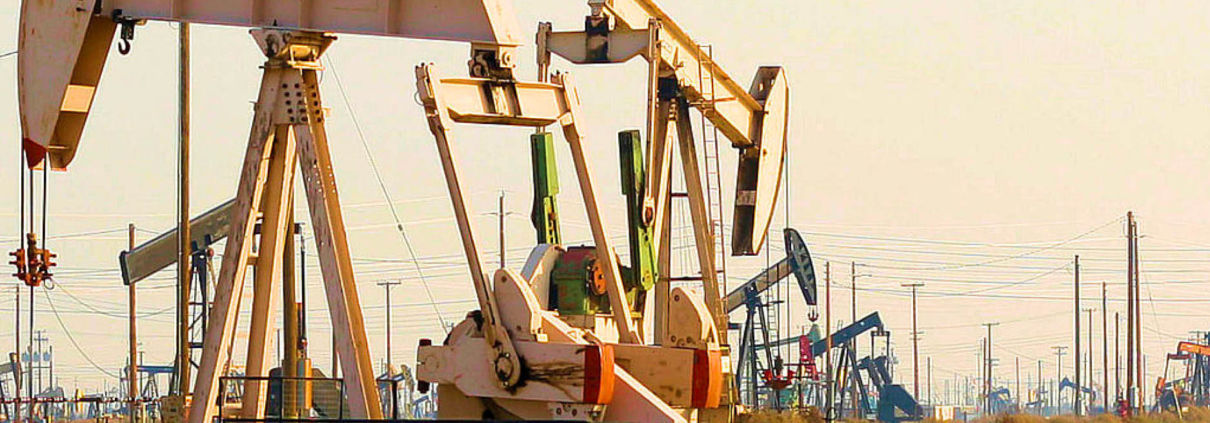
As we have discussed in previous reports, Kern County is required to develop a new set of environmental impact report (EIR) requirements for permitting new oil and gas wells.
With this recent development, it is necessary to provide science-based recommendations for the EIR to prioritize the protection of the health of frontline communities. Frontline communities bear the most risk. Emissions from oil and gas infrastructure and exposure to water and soil contamination most affect those living closest. It is therefore vital for an EIR to institute protections that address these known and well-established sources of exposure. In addition, the EIR must prioritize a requirement by law that all regulatory information is equitably available and imparted to Frontline Communities; with Kern County, this means providing regulatory notices in Spanish, the predominantly spoken language in this area, according to household census data.
In preparation of the Kern County rule-making process, FracTracker Alliance has prepared new analyses of Kern County communities. These analyses have mapped and assessed the distribution of oil and gas wells within Kern County for proximity to sensitive receptors. This information is vital to understand how the “most drilled County” in the United States manages the risks associated with oil and gas extraction. According to CalGEM data updated September 1, 2020, there are 78,016 operational oil and gas wells countywide. Of these, 5,906 (7.6%) are within 2,500 feet of a sensitive receptor, receptors being homes, schools, healthcare facilities, child daycare facilities, and elderly care facilities. Thirty-six CHHS healthcare facilities and 35 schools in Kern County are within 2,500 feet of an operational oil and gas well. In fact, 646 operational wells are within 2,500 feet of a school in Kern County. Most of these at-risk, sensitive receptors are in Kern’s cities, large and small.
Table 1. Well Counts in Kern County
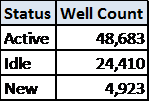
Most of the population of Kern County is in its cities. Unincorporated, rural areas of Kern County are in majority zoned for large estate landownership and agriculture, and have low population density, rather than designated for residential, single-family homes, apartments, developments, and mobile homes. Oil and gas extraction operations and well sites are dispersed throughout the county, including near and within the residentially-zoned areas of cities. Given that the county’s population density is highest in cities, these areas present the greatest public health risk for exposures to toxic emissions and spills from fossil fuel extraction operations. This analysis focuses specifically on the Frontline Communities of Kern County, where oil and gas extraction is occurring near city limits.
Table 2. Operational oil and gas well counts near cities and sensitive receptors.
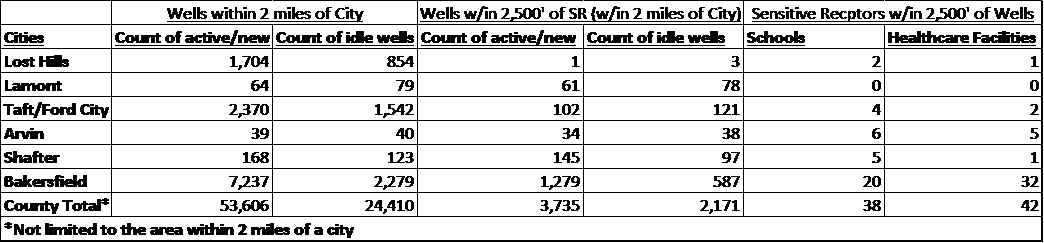
These include Lost Hills, Lamont, Taft, Arvin, Shafter and Bakersfield. In Table 2 (above) are counts of operational wells within two miles of each city, along with demographic profiles for each incorporated/unincorporated city, based on American Community Survey (2013-2018) census data (downloaded from Census.gov). Population estimates are based on the ACS block groups. For block groups larger than city boundaries, the population was assumed to be within city limits, although in certain cases, such as Arvin, a small section of a block group was eliminated from the city demographic counts. This assumption is validated by the county and city zoning parcels. The maps below in Figures 1 – 6 show the municipal zoning parcels for these cities, with maps that include operational oil and gas wells. Note the proximity of residential- and urban-zoned parcels to oil and gas extraction in Kern County, and the difference in zoning between the cities and the rest of the county. Cities are zoned for residences, including apartments, single-family homes, and mobile homes. Most of the rest of the county is agriculture and estates, where predominantly wealthy residents and corporations own large holdings.
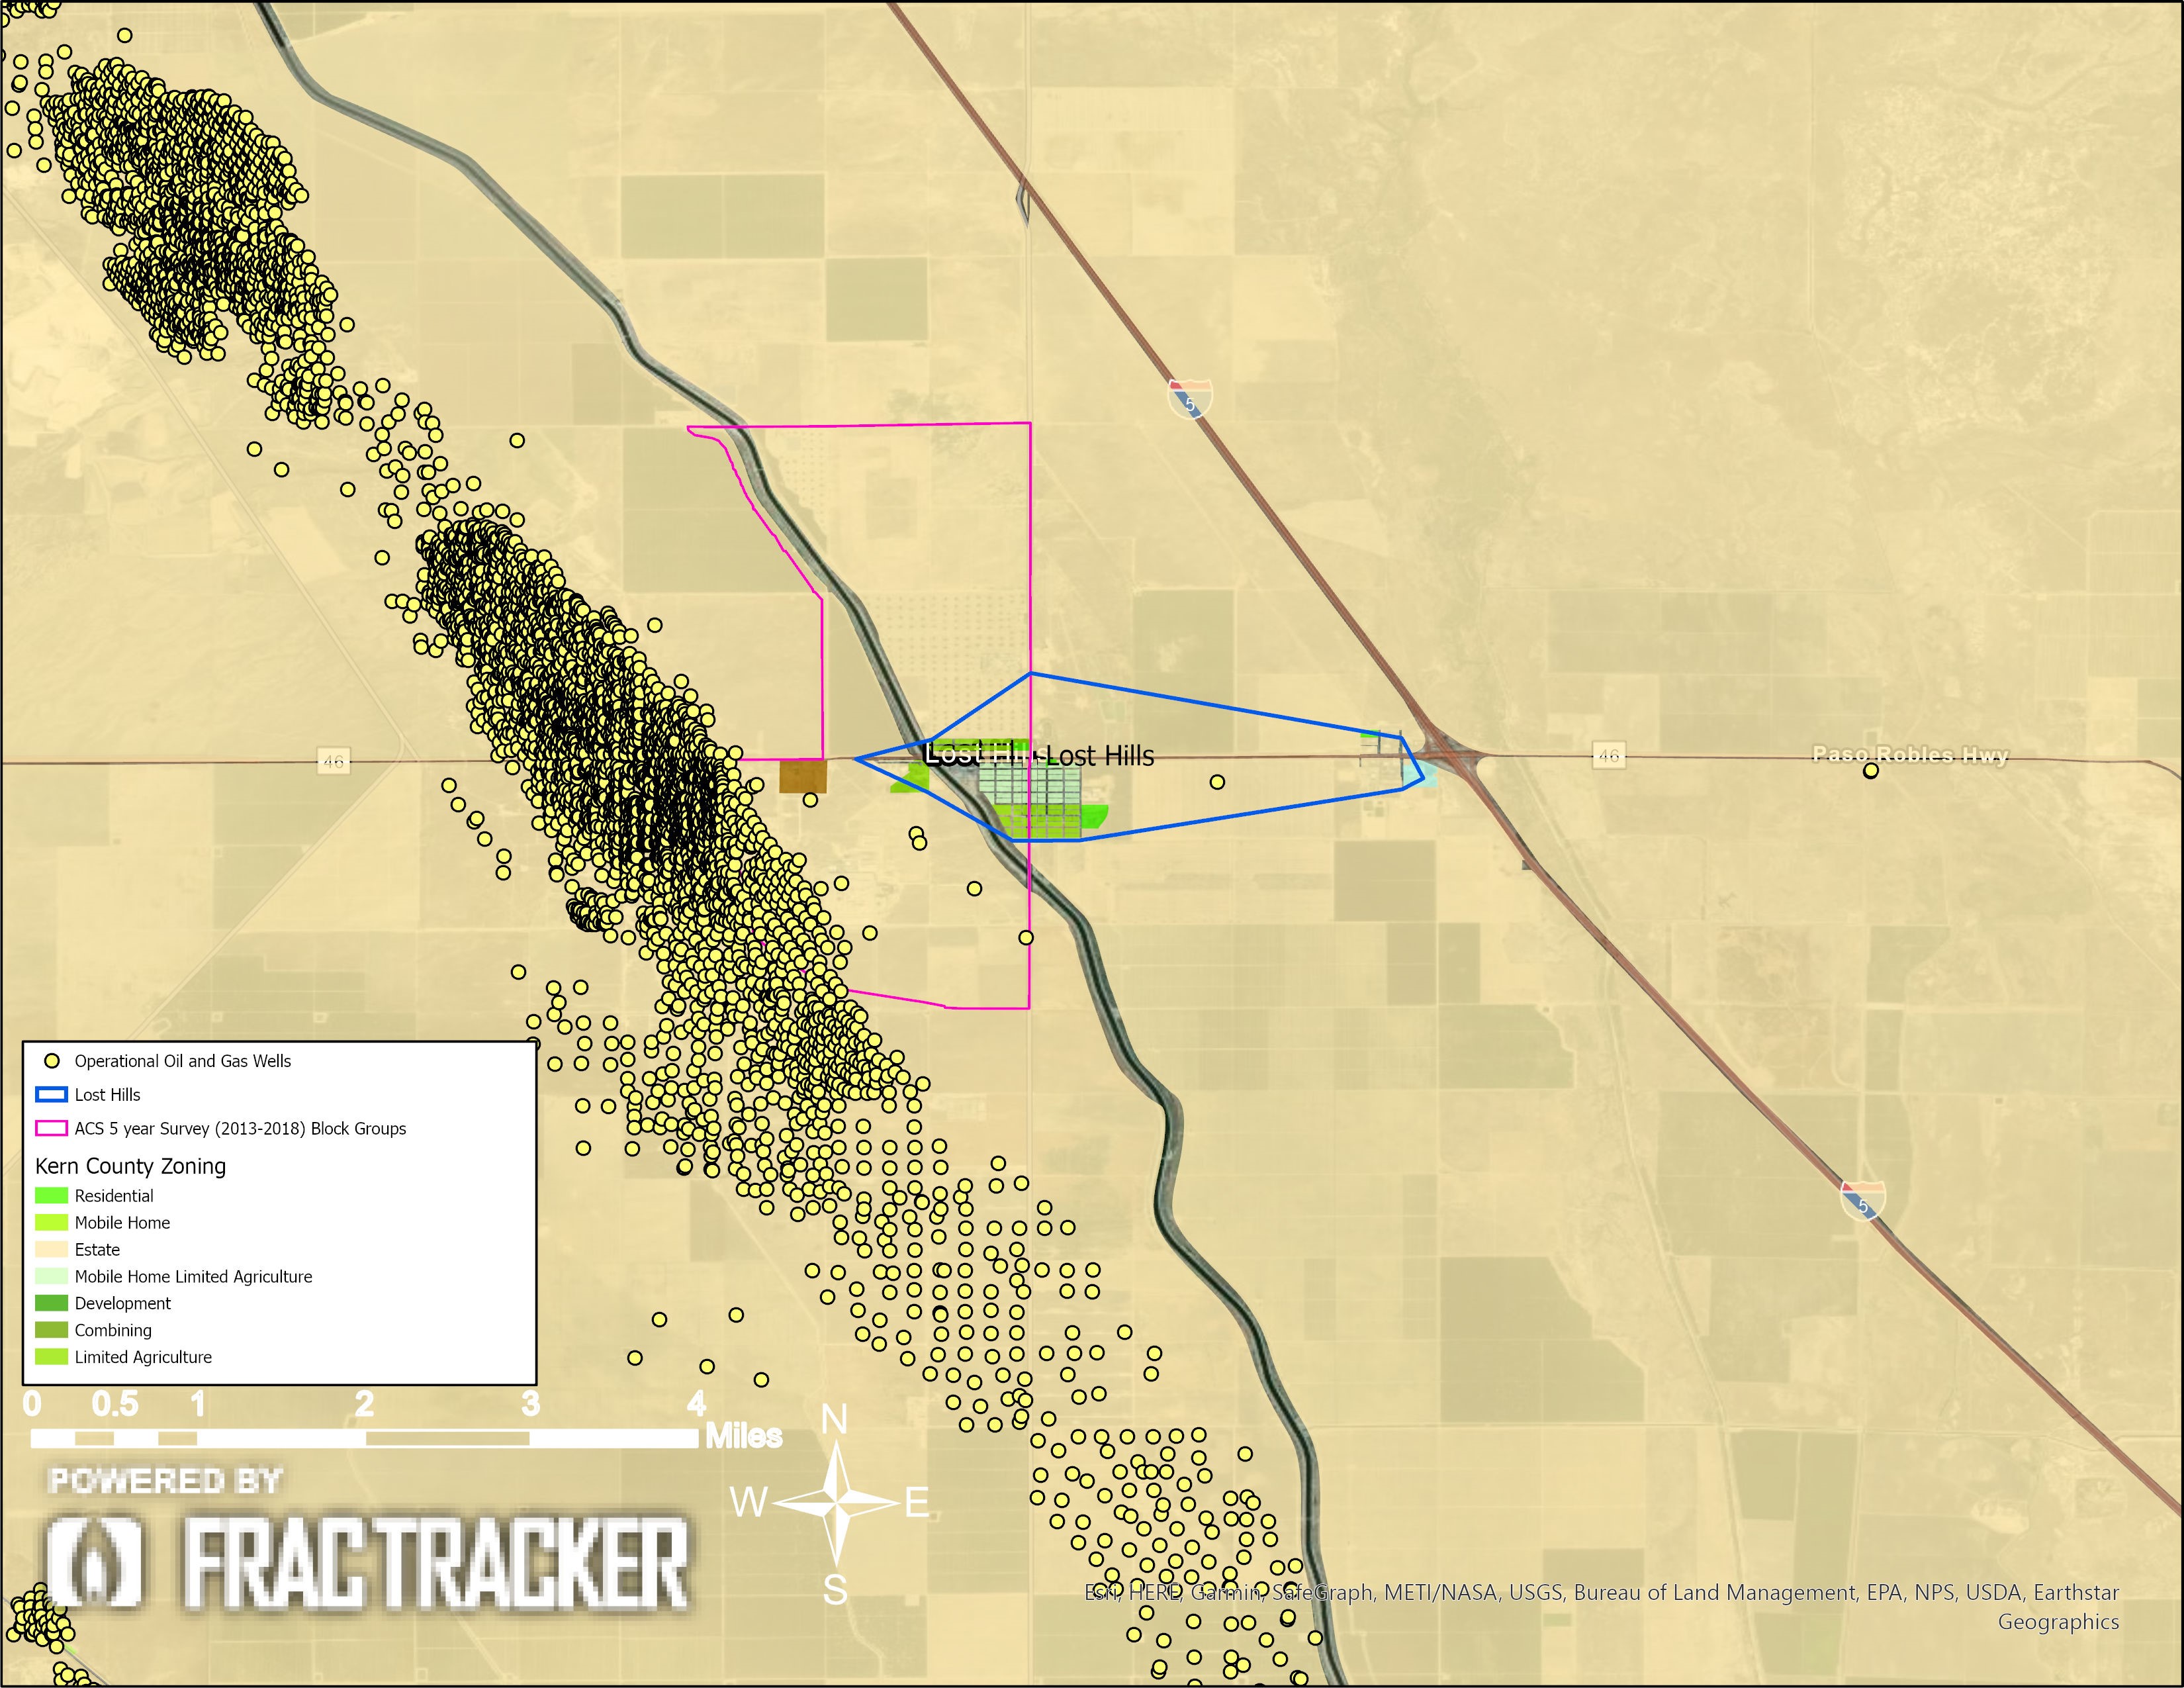
Figure 1. Municipal zoning boundaries of the City of Lost Hills.
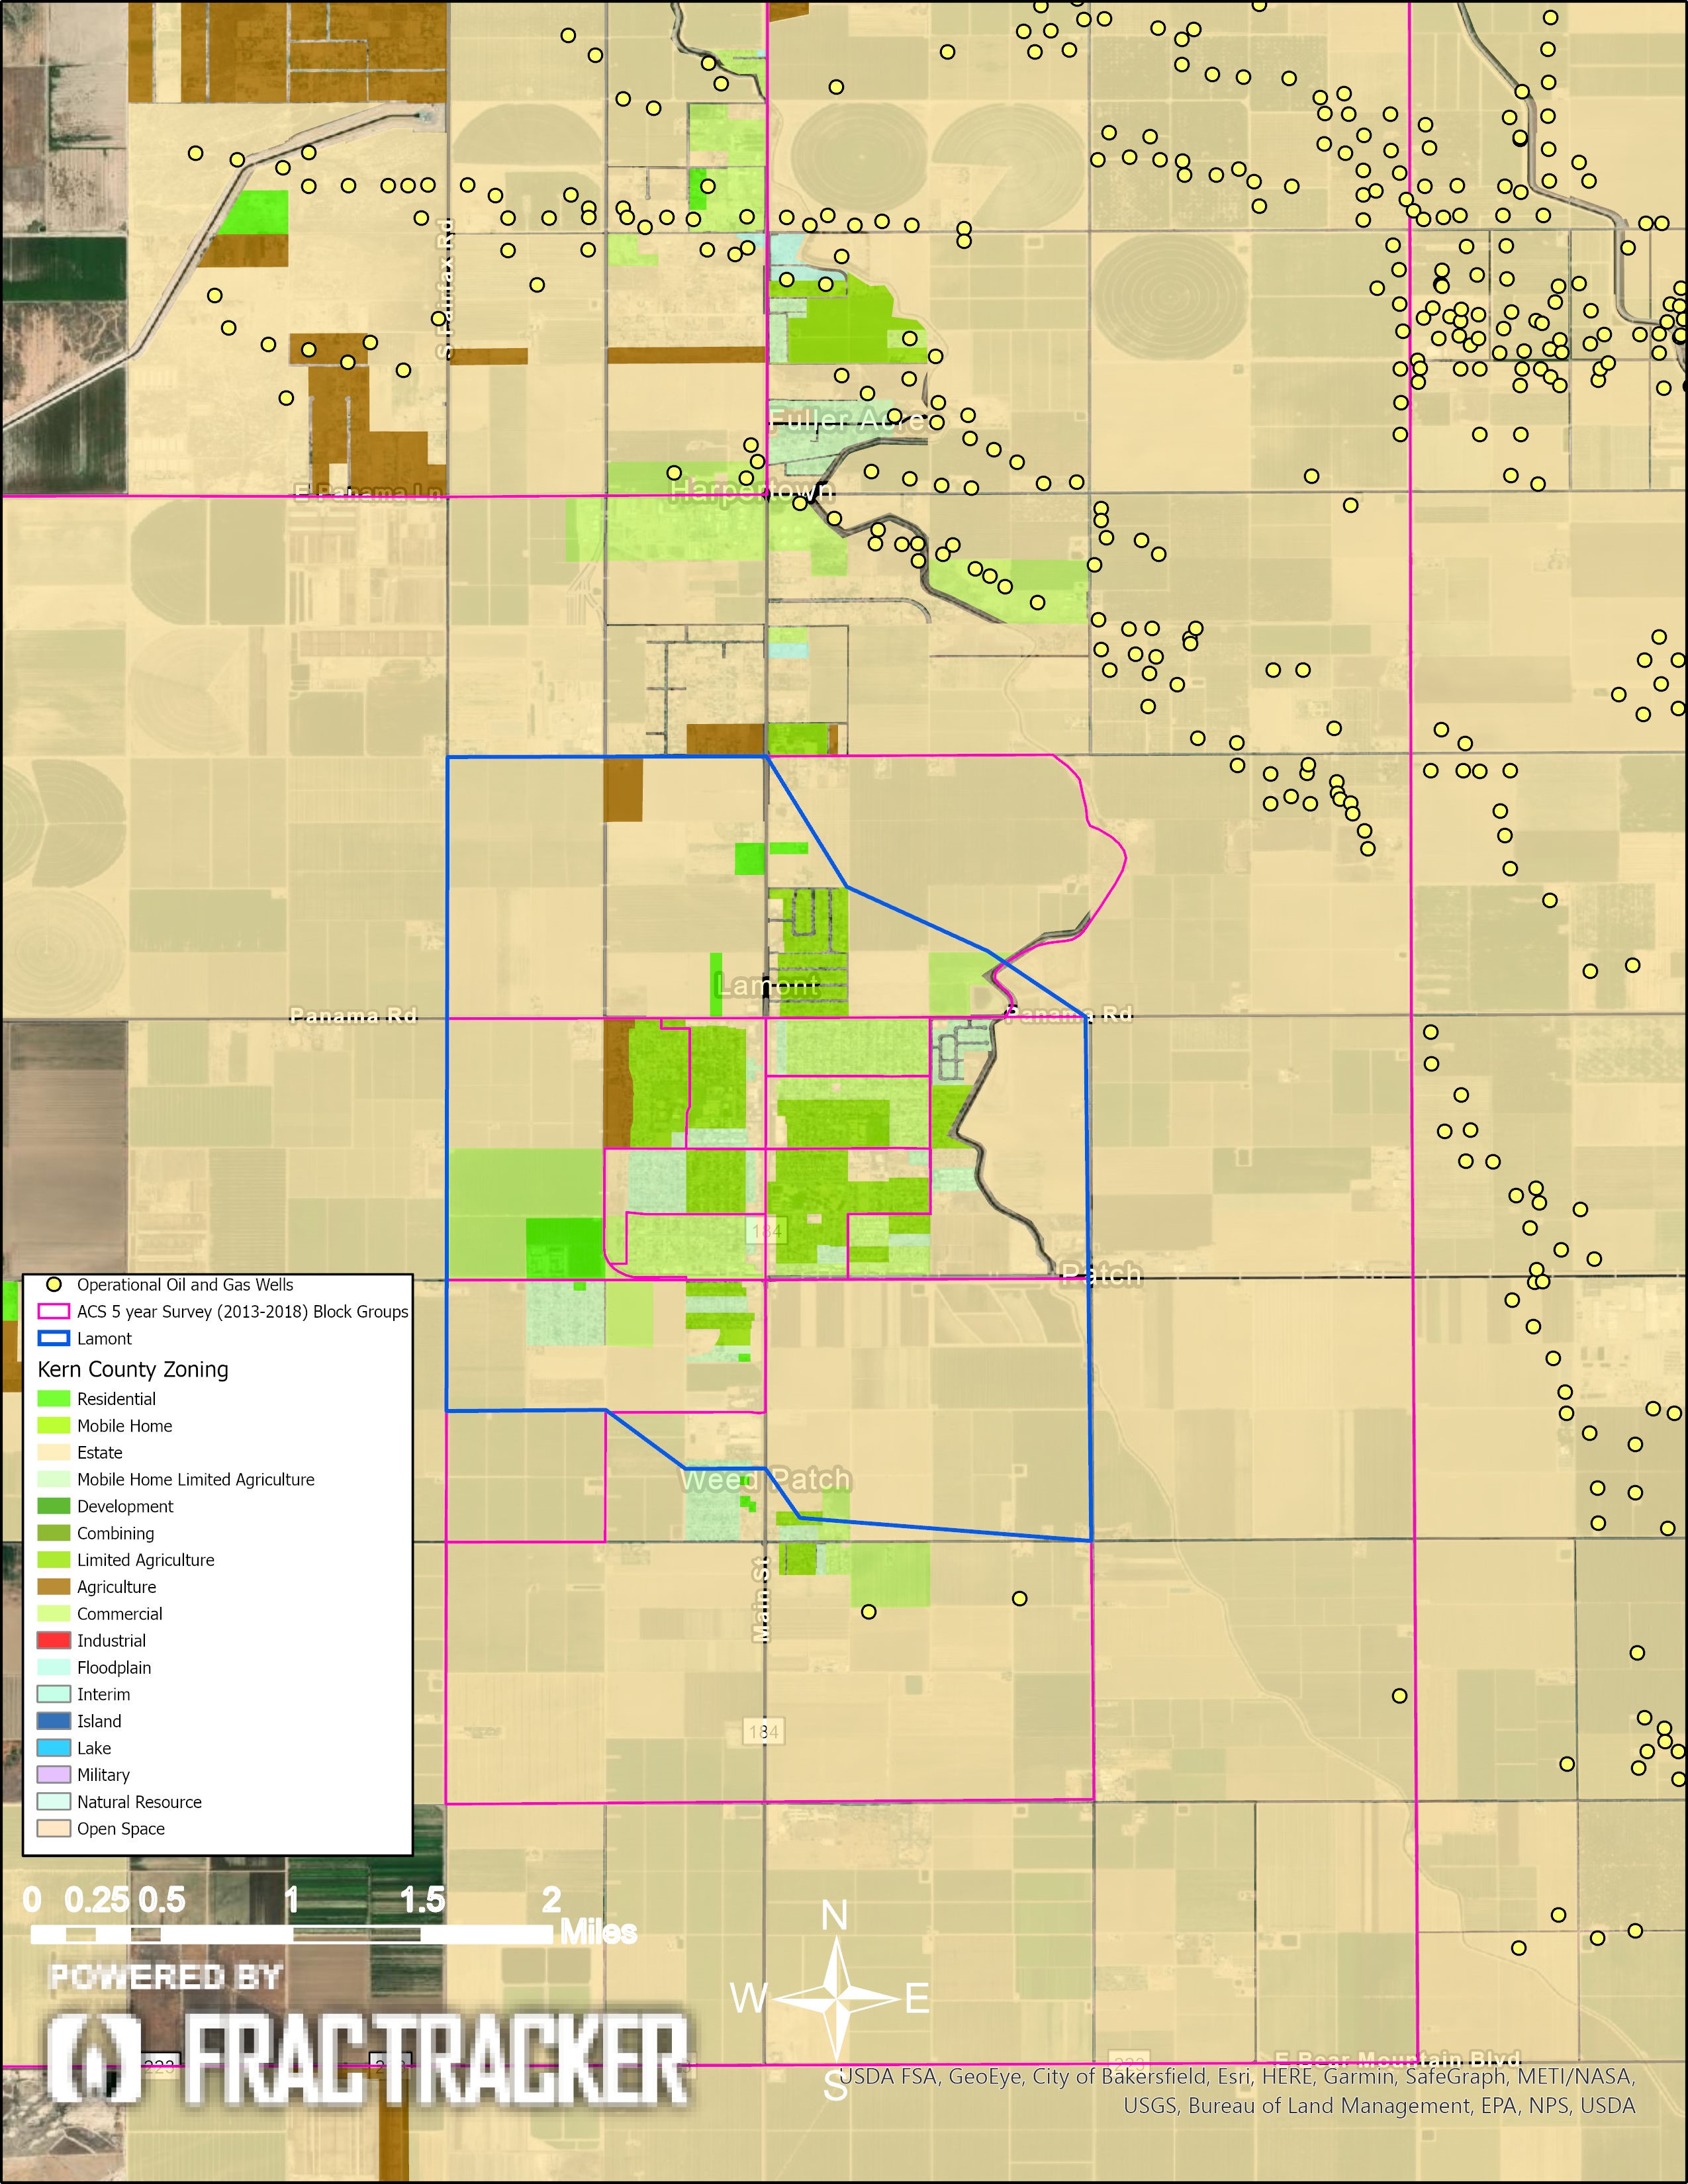
Figure 2. Municipal zoning boundaries of the City of Lamont.
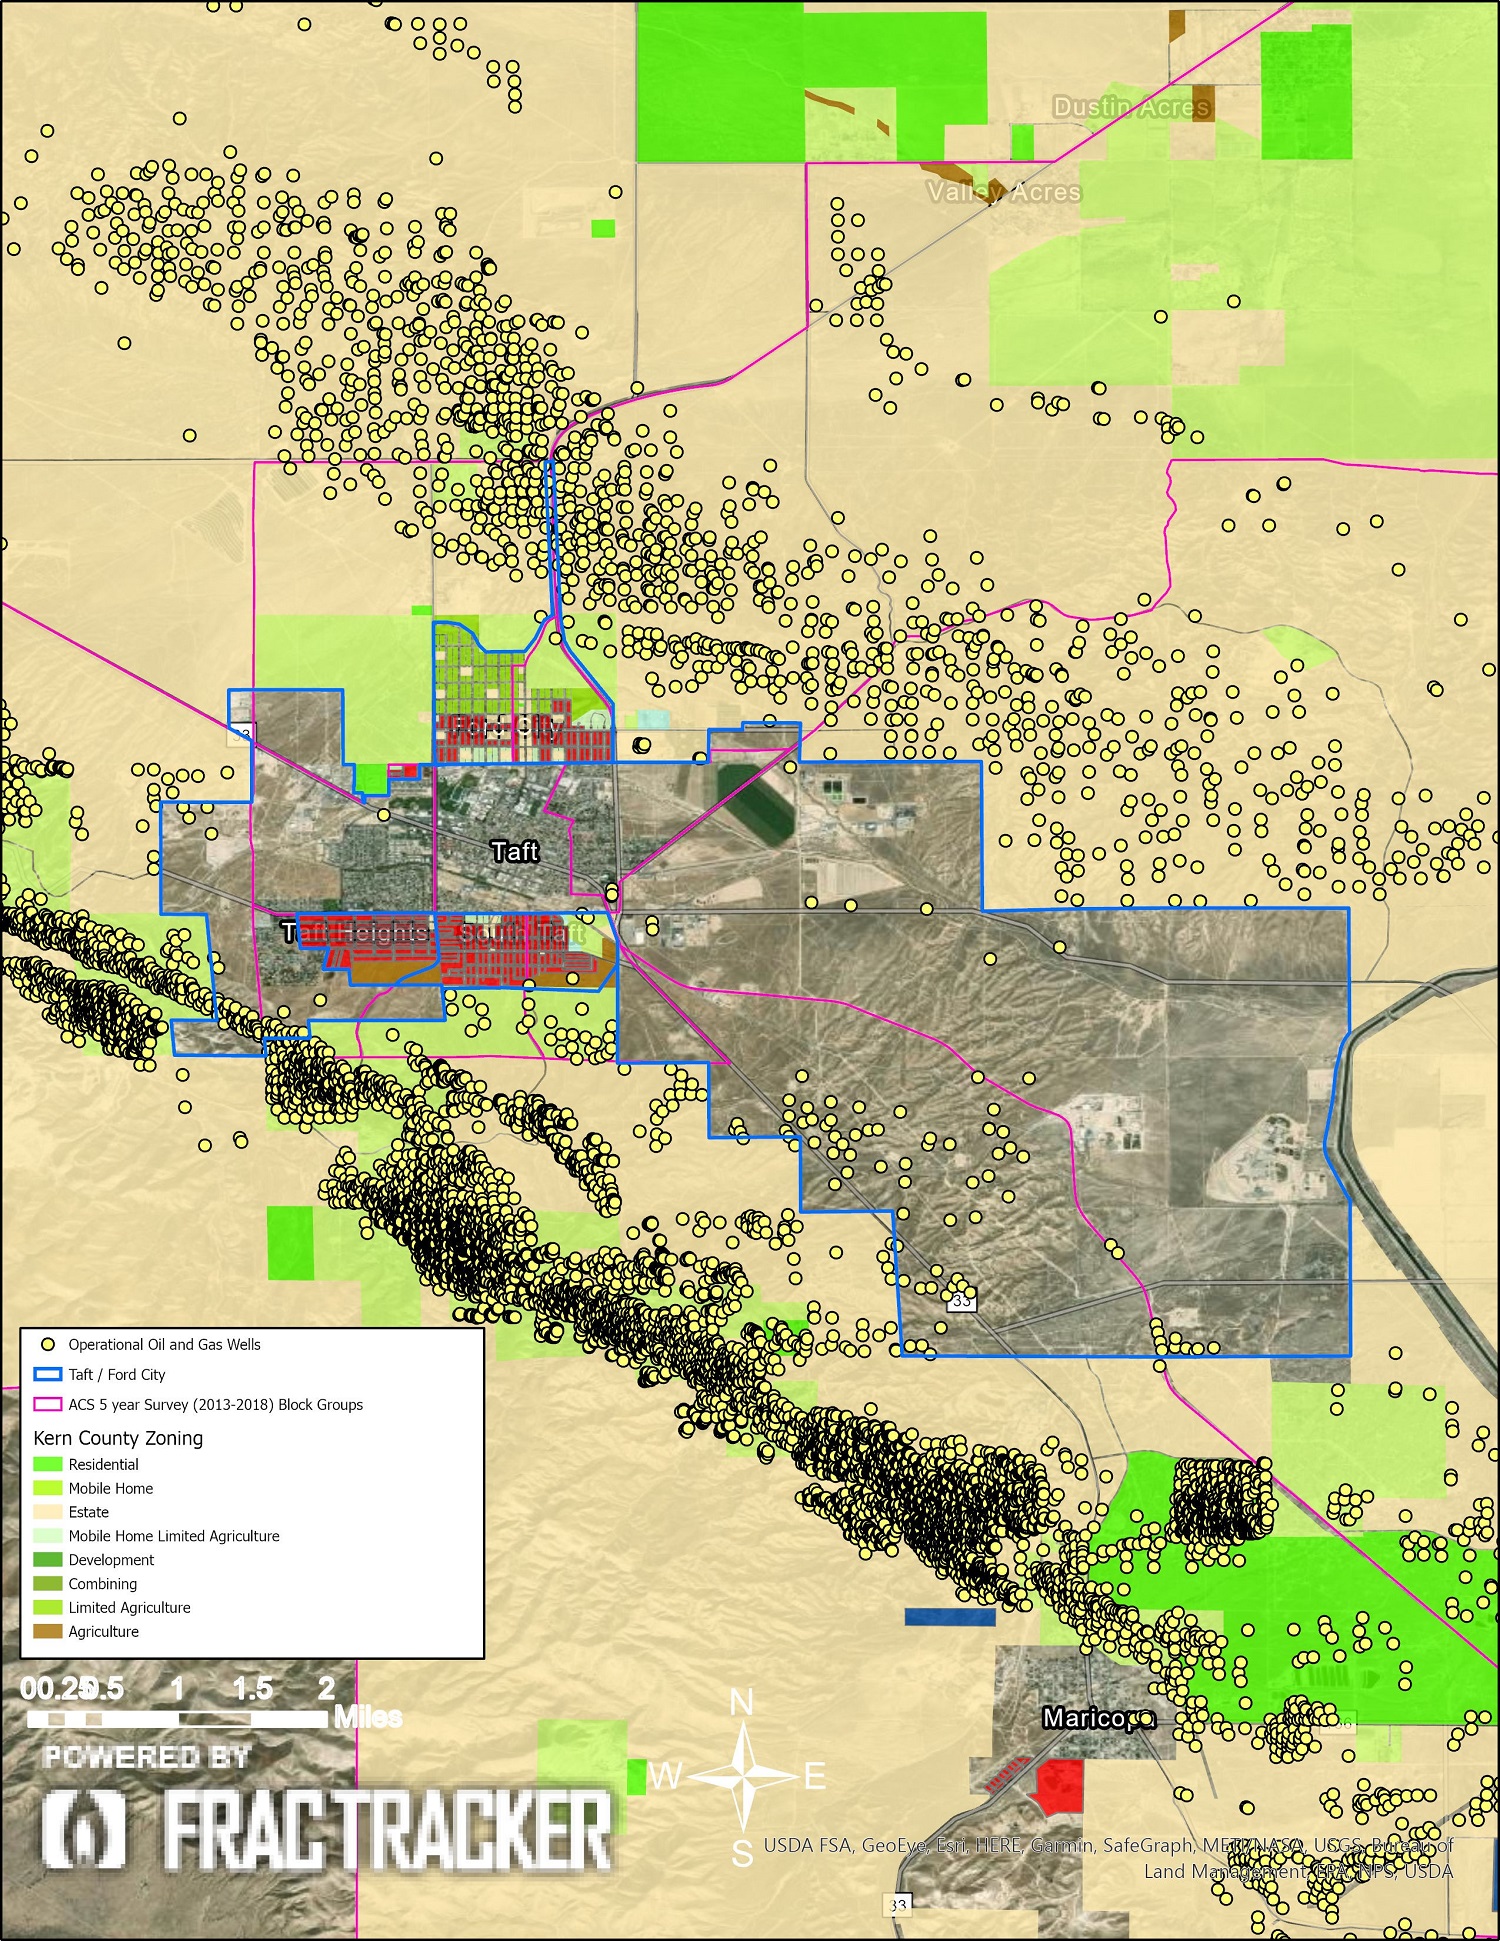
Figure 3. Municipal zoning boundaries of the City of Taft.
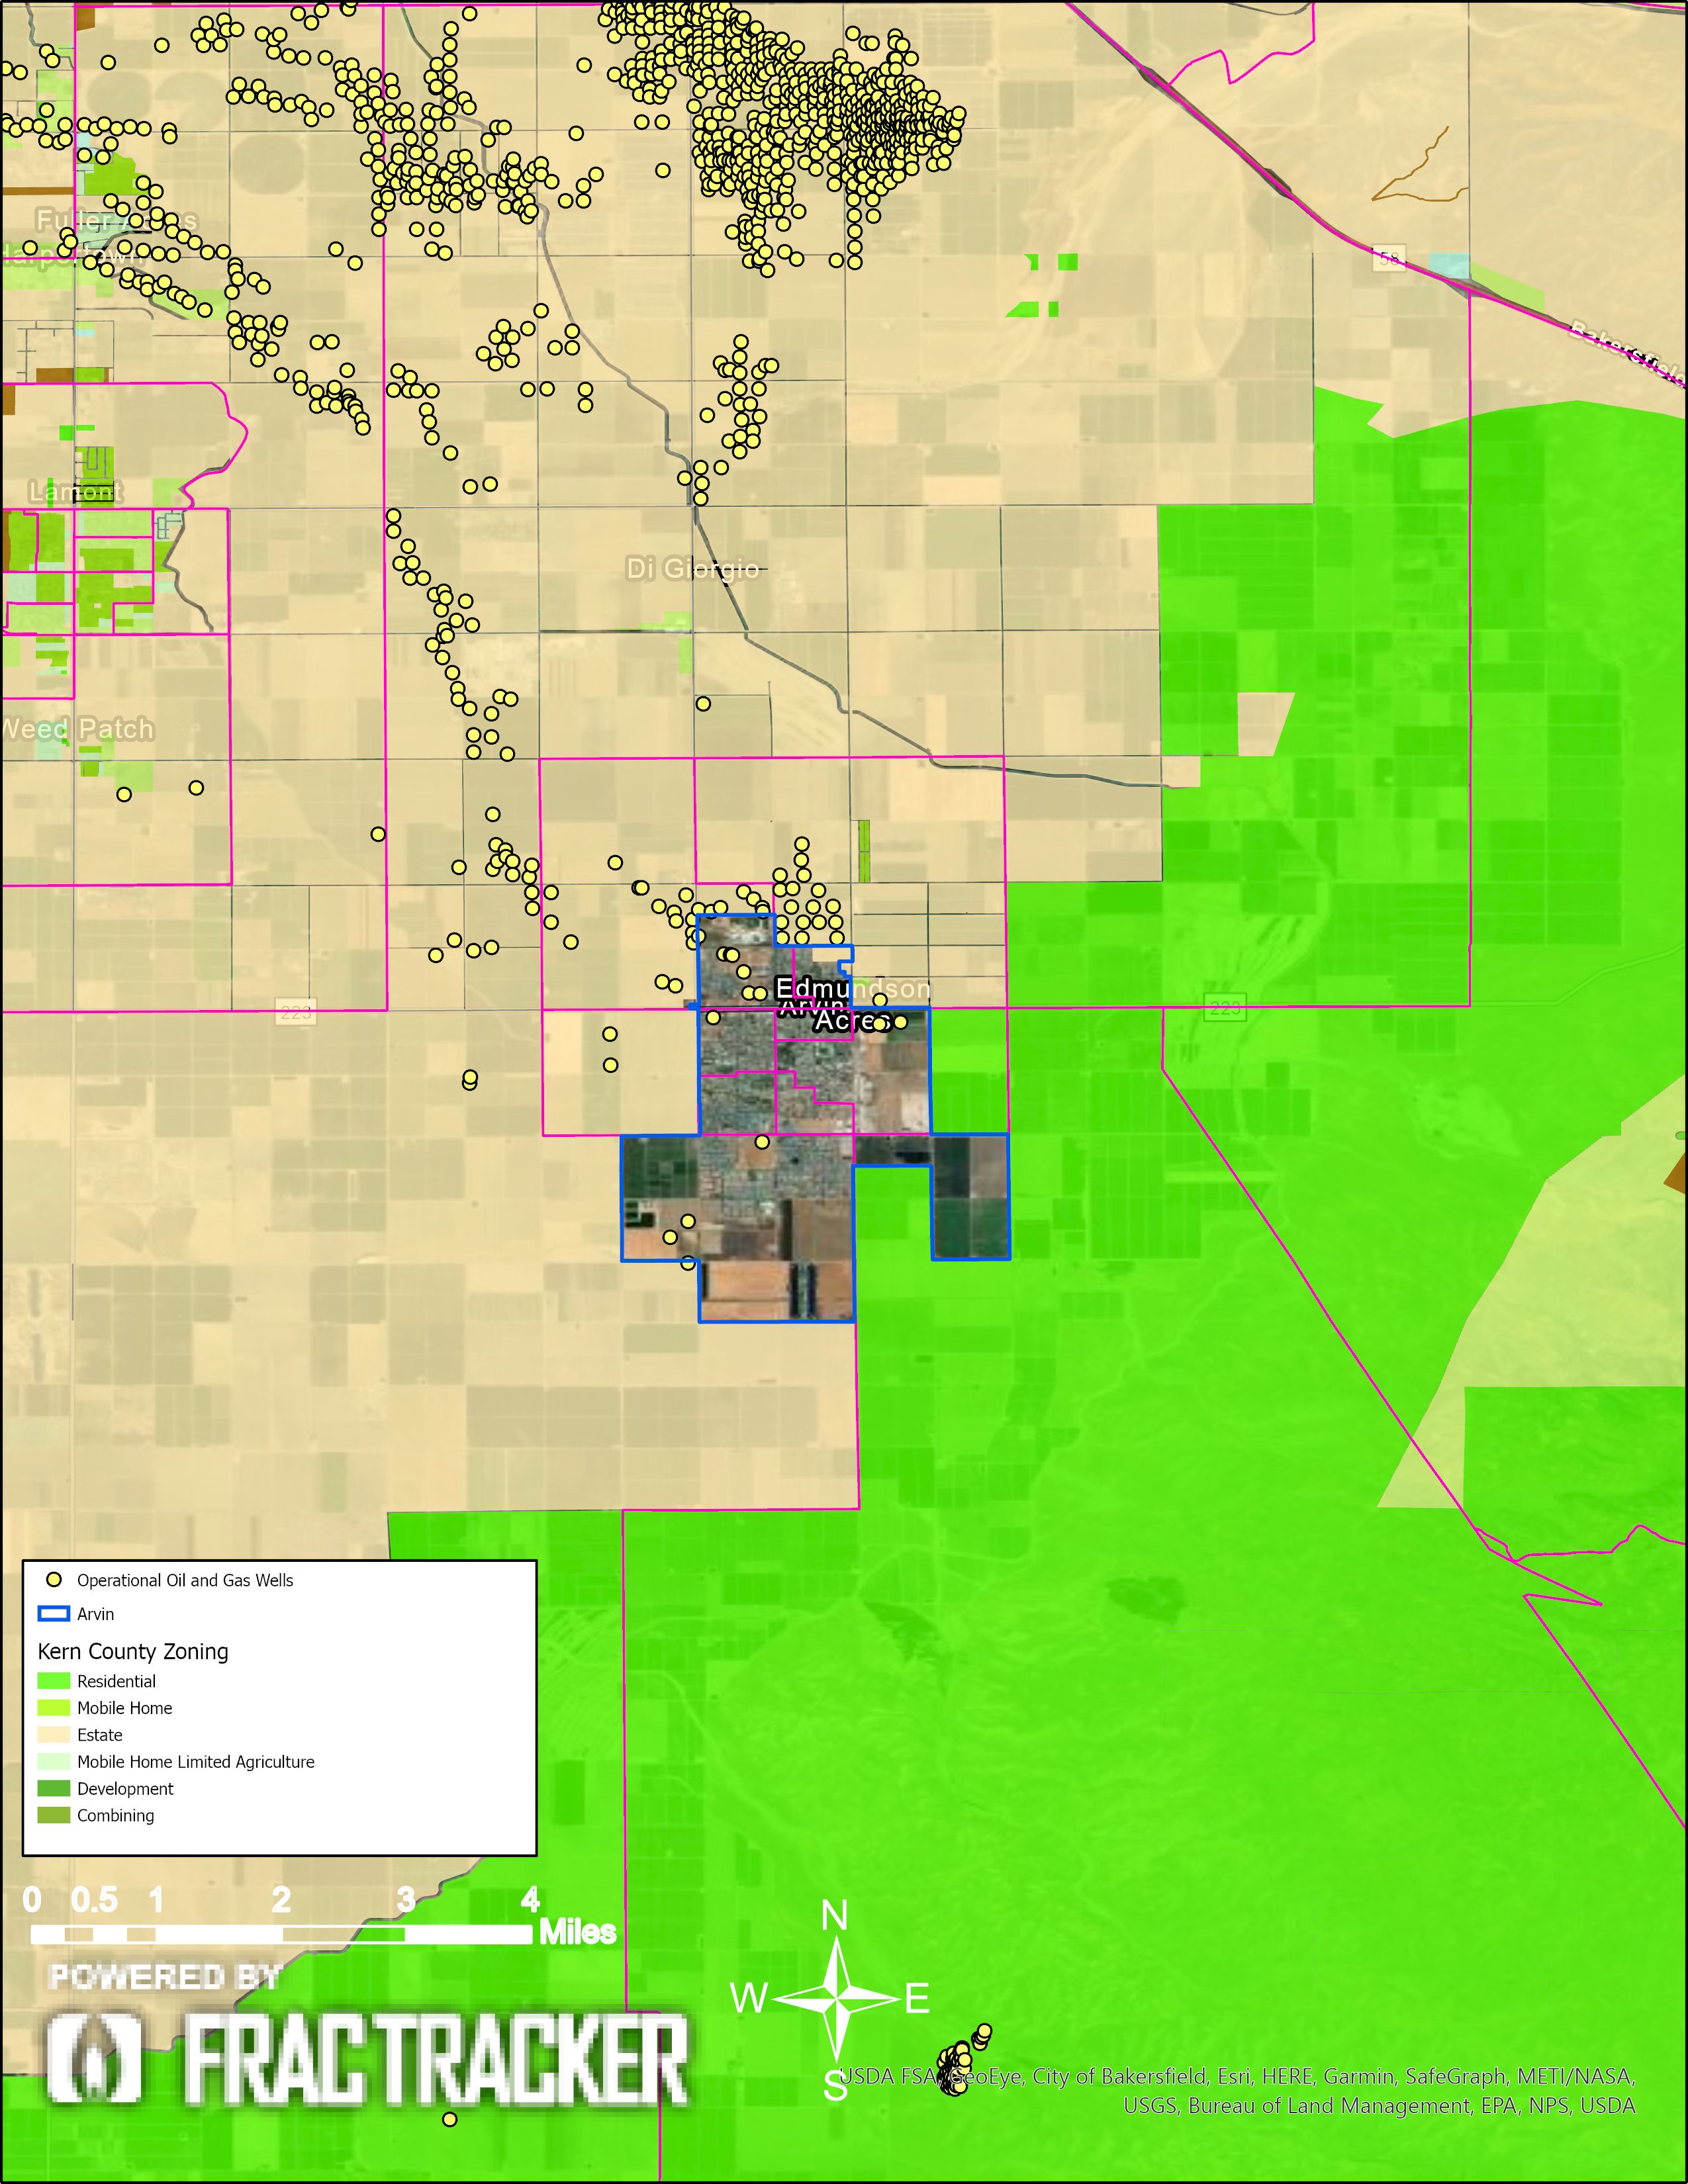
Figure 4. Municipal zoning boundaries of the City of Arvin.
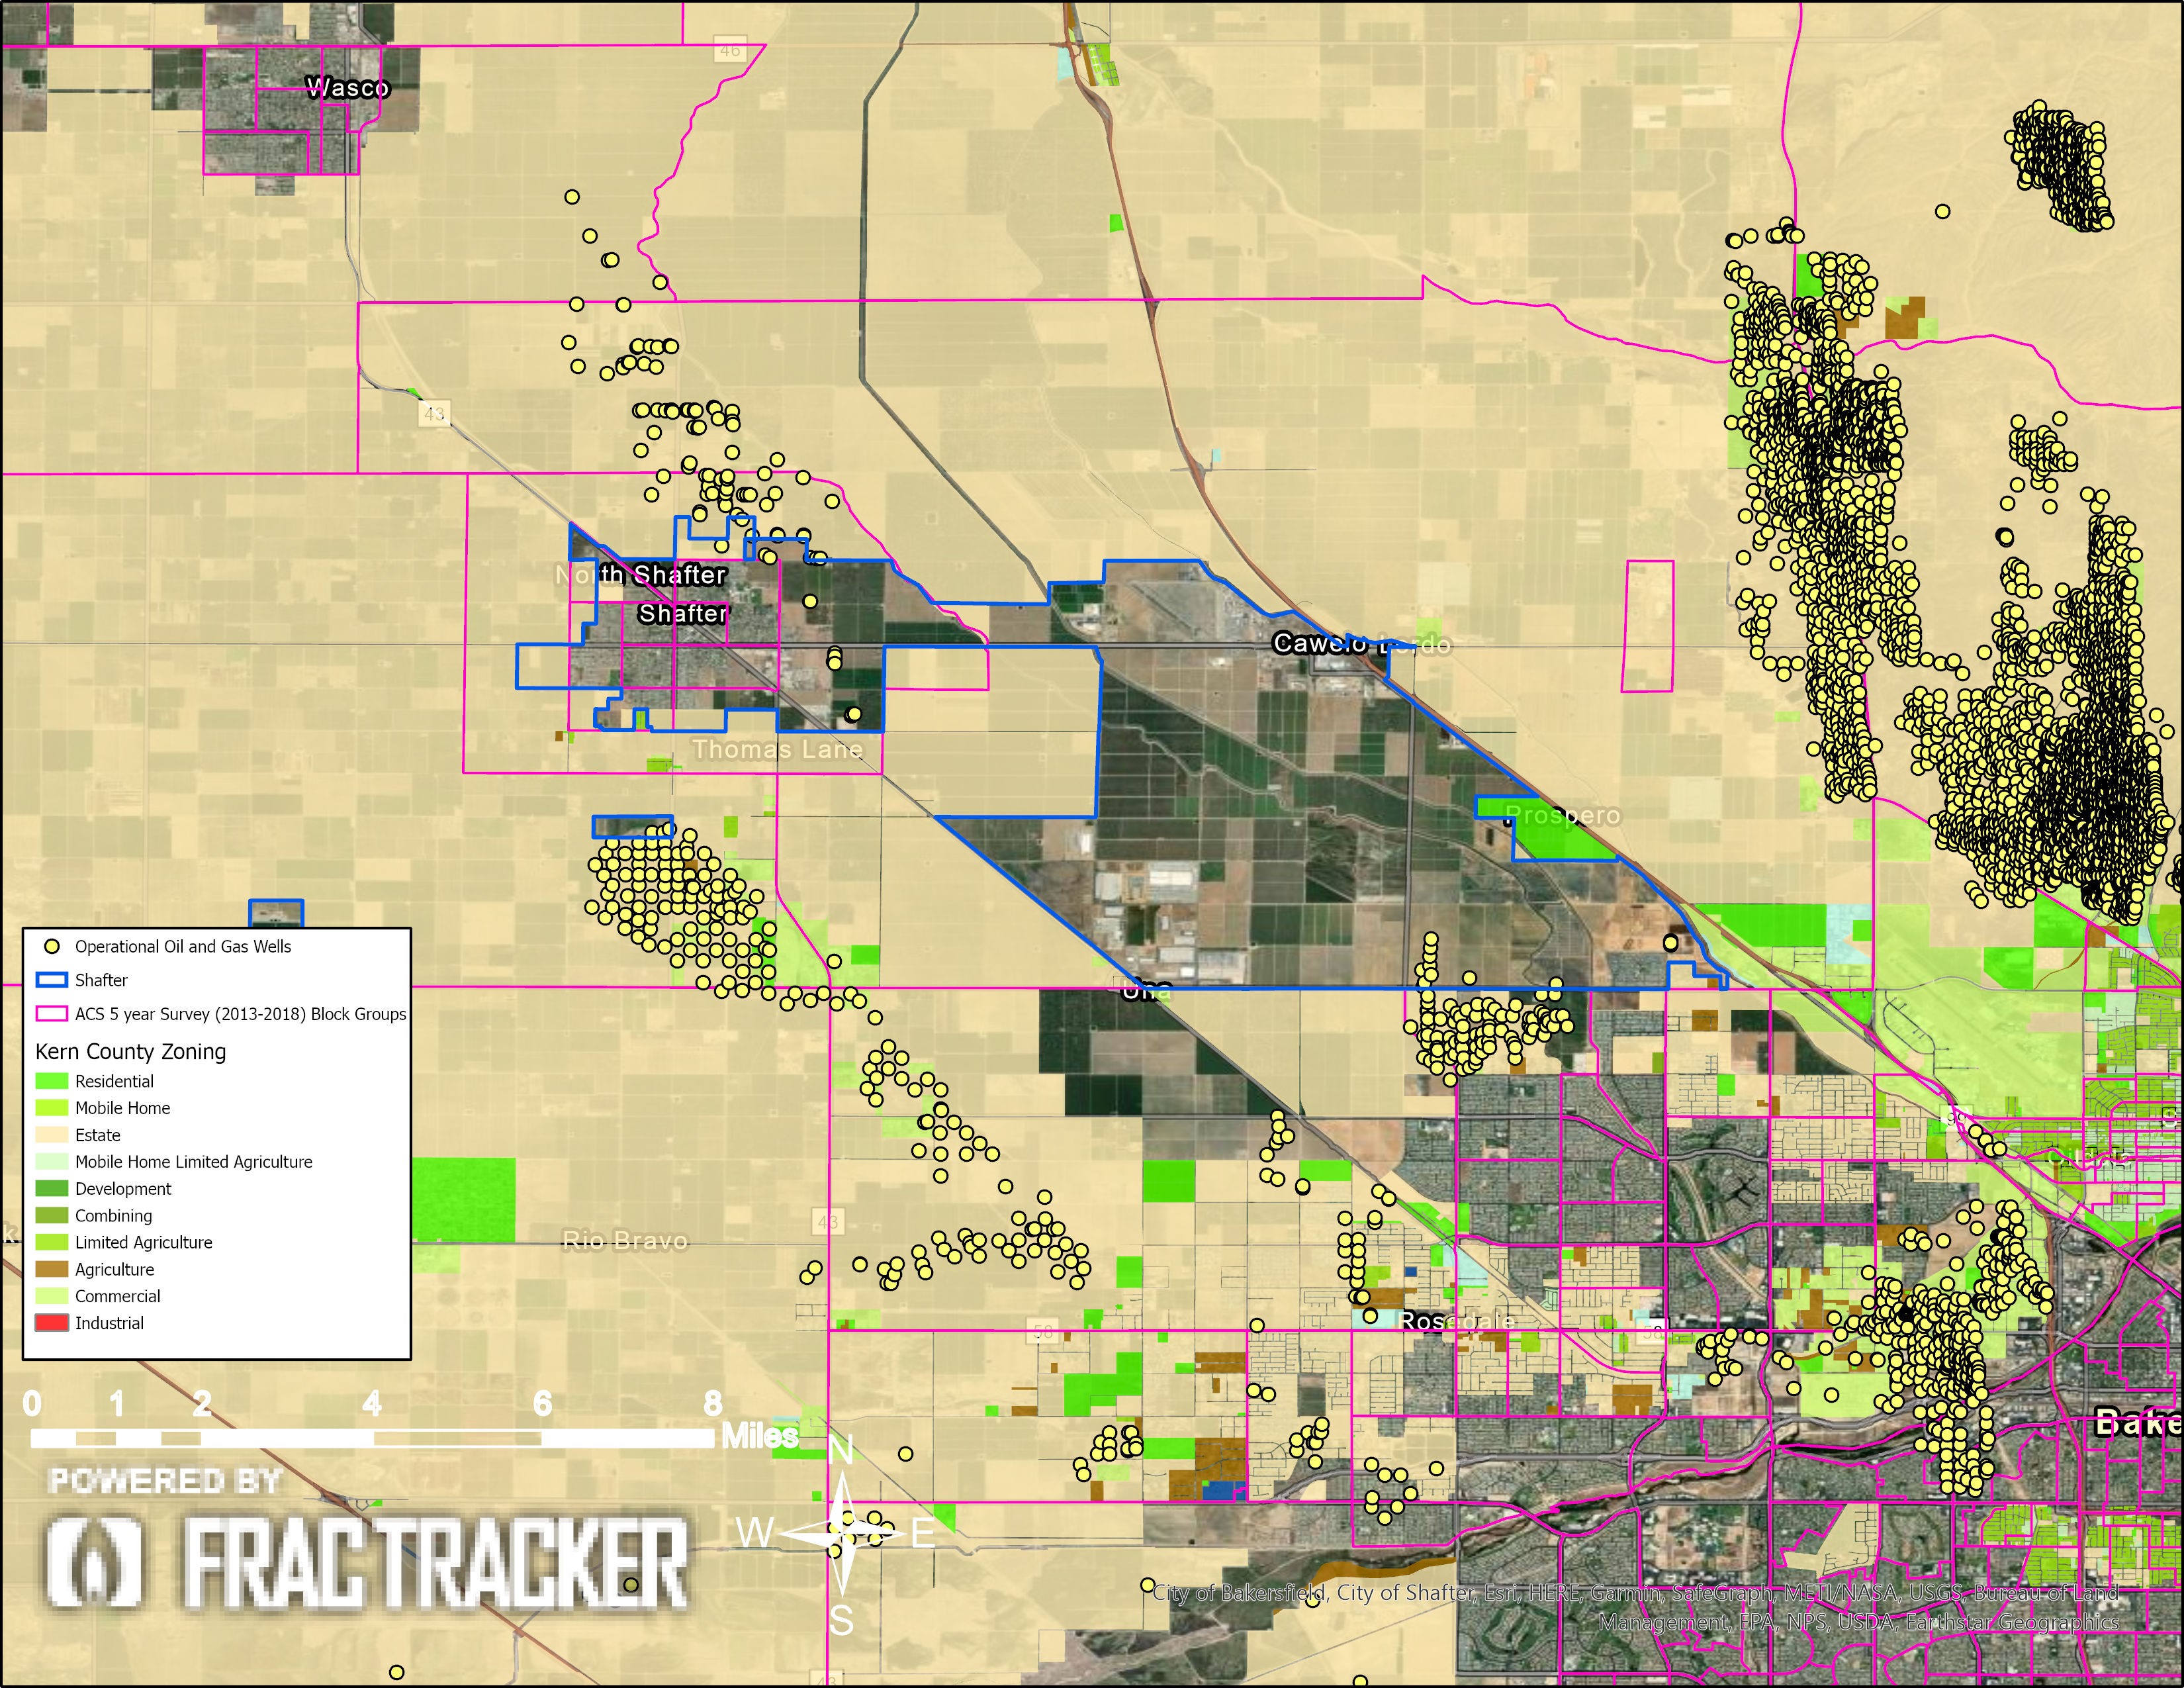
Figure 5. Municipal zoning boundaries of the City of Shafter.
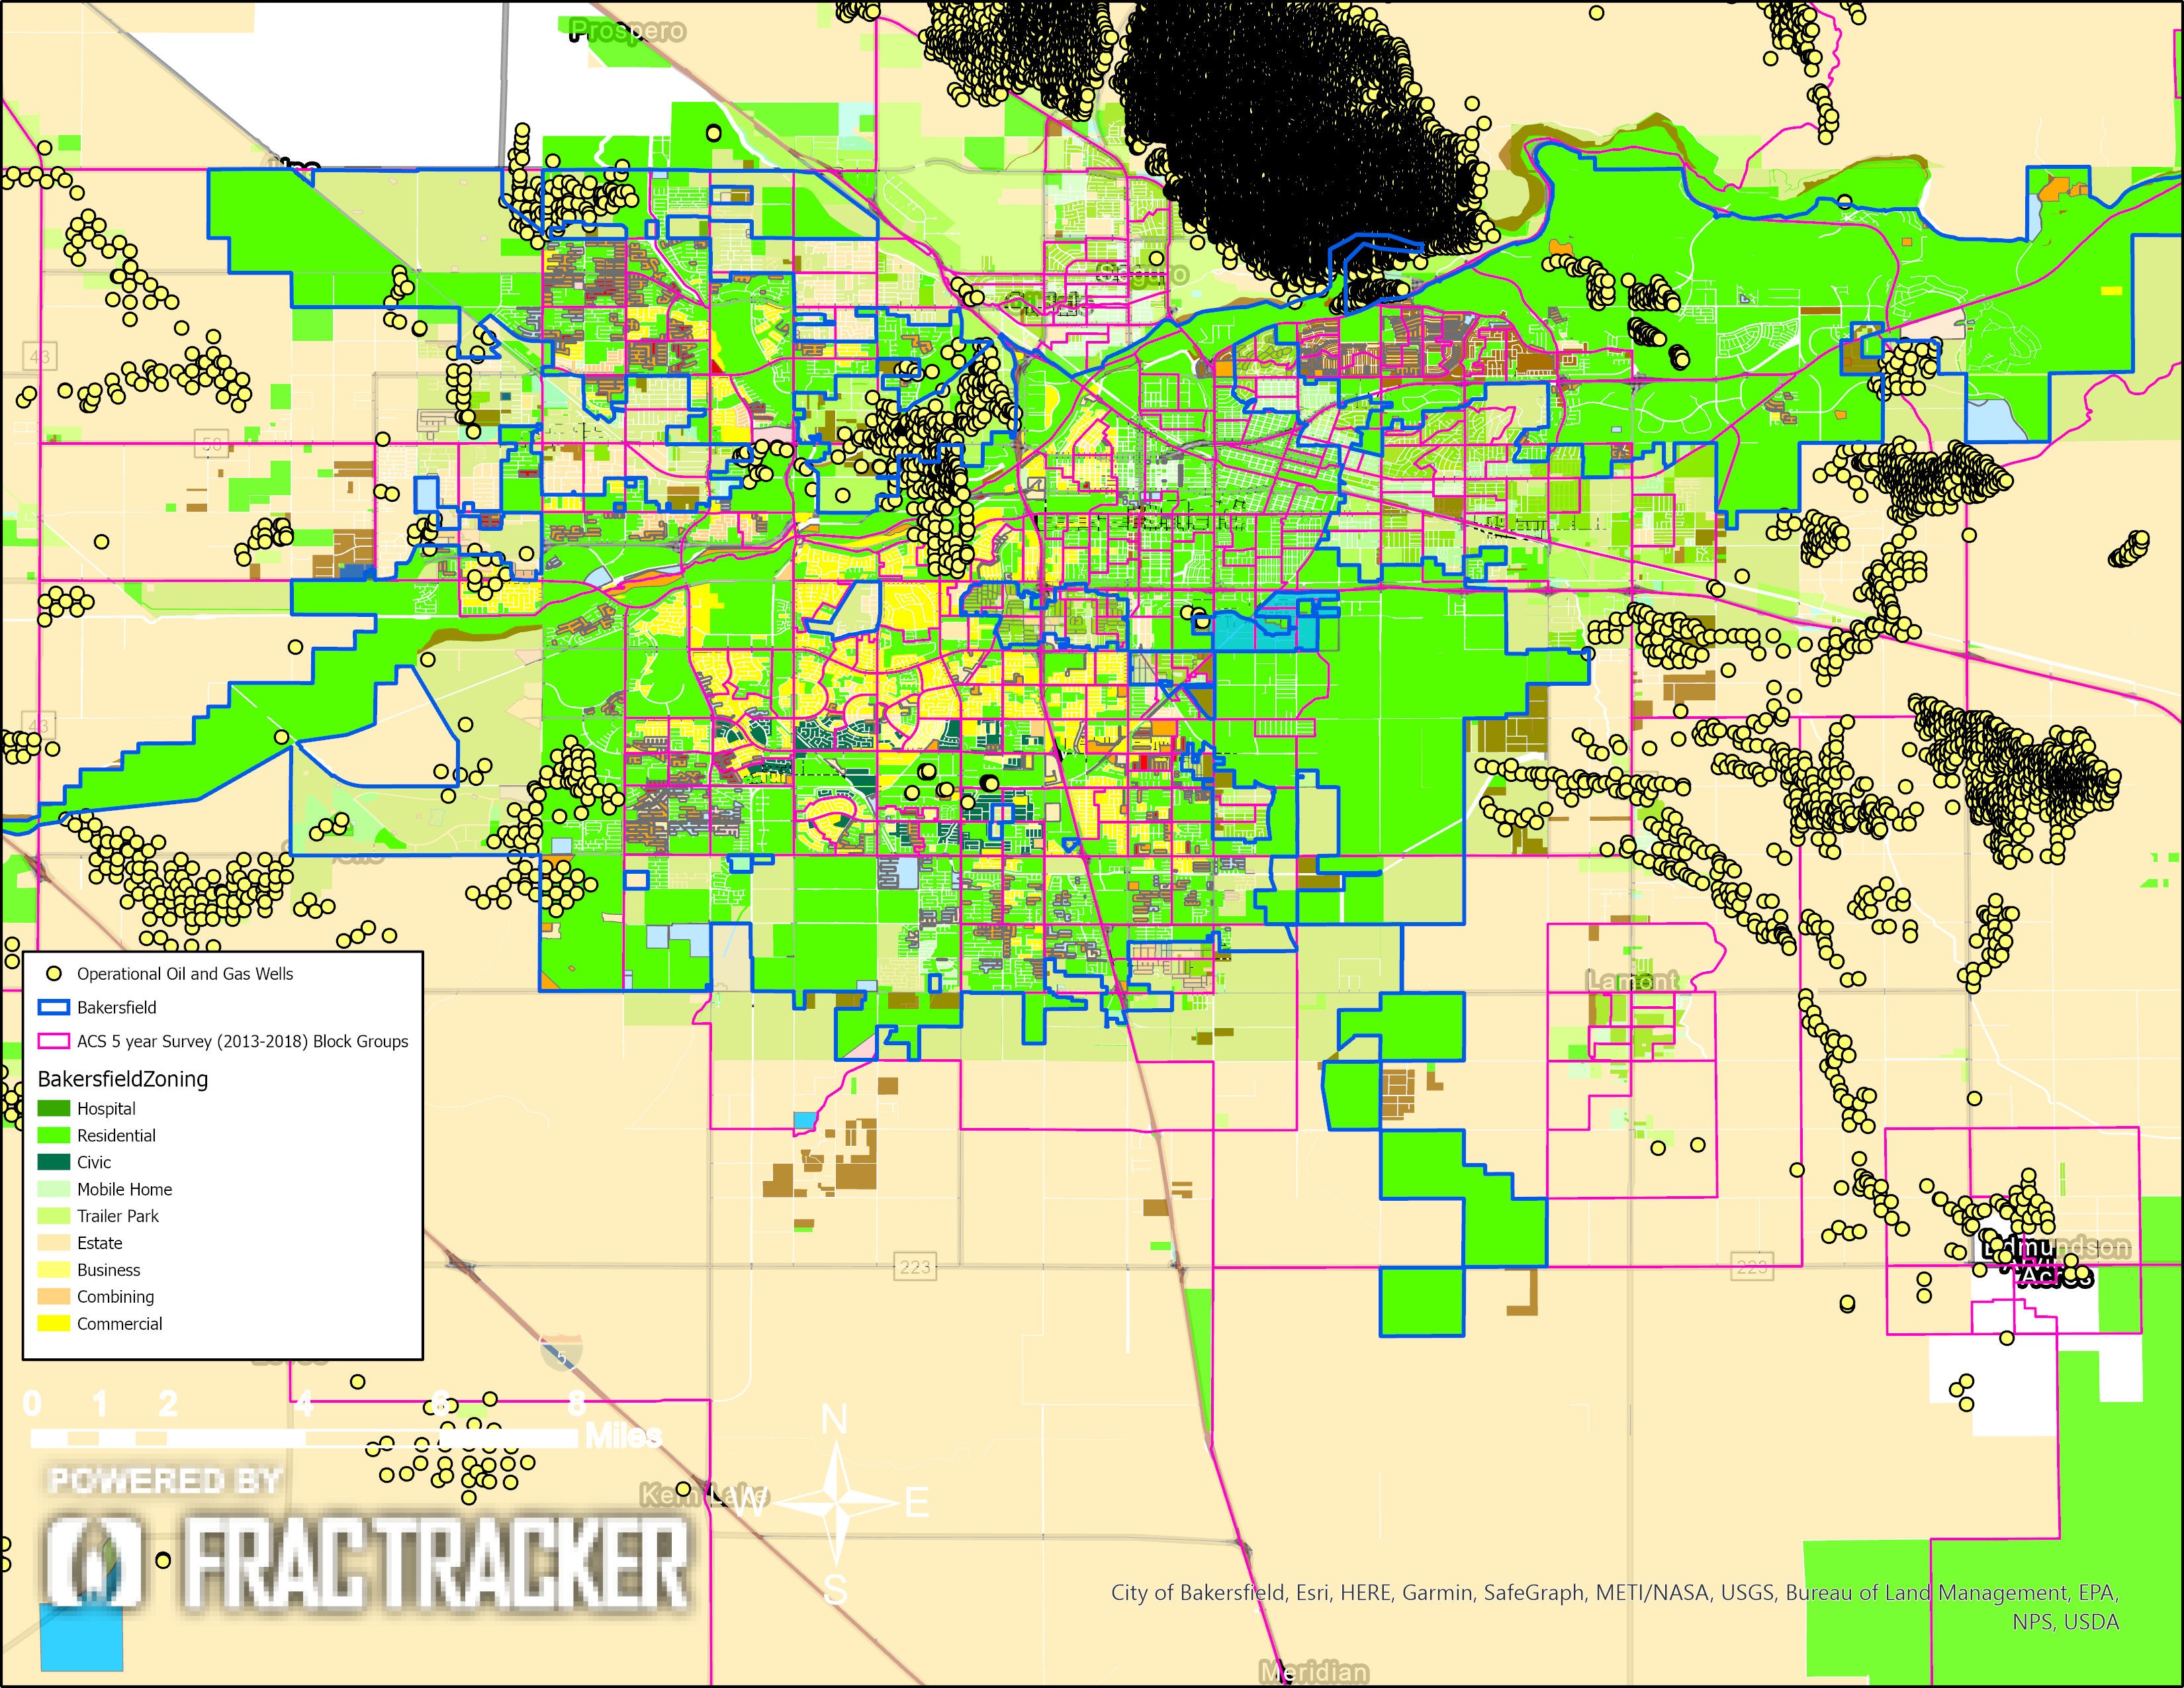
Figure 6. Municipal zoning boundaries of the City of Bakersfield.
These six cities and their Frontline Communities experience a disparity of exposure to environmental pollutants, particularly emissions from oil and gas extraction operations — as well as pesticides, regionally degraded air quality (from ozone and particulate matter), and contaminated groundwater. Besides the risk disparity, these communities are also vulnerable from several other factors, including disparities in economic opportunity, demographics, and access to information.
Compared to the rest of Kern County, Frontline Communities in these unincorporated and incorporated cities have less financial opportunity. The maps in Figures 7 – 9 below show block groups and the proportions of the population with annual median incomes less than or equal to $40,000. This value was chosen because it is less than 80% of the countywide median income of $51,579 in 2018. For comparison, the statewide median income is $75,277. Lack of economic opportunity for these communities limits the ability to leverage financial resources to protect their community health and to maintain local-level financial independence from corporate influence. In Lost Hills, over 80% of the city block group closest to the Lost Hills Oil Field has a median income less than or equal to $40,000. The same trend is visible for Lamont, Taft, and Arvin. In Figure 9, the only section of Taft with higher annual median income is sparsely populated and predominantly open space, as confirmed in Figure 3. For the areas of Frontline Community block groups within 2,500 feet of an operational well, 36% of the population makes under $40,000; 80% of the Kern County annual median income is $41,000.
In the maps below, the American Community Survey data is summarized in percentages of one, where, for example, light orange (<.400) in the map refers to areas where 20% – 40% of the population’s annual median income is less than or equal to $40,000.

Table 3. Demographical Profile of each city, including the percentage of Spanish-speaking households and proportion of households with limited English proficiency.
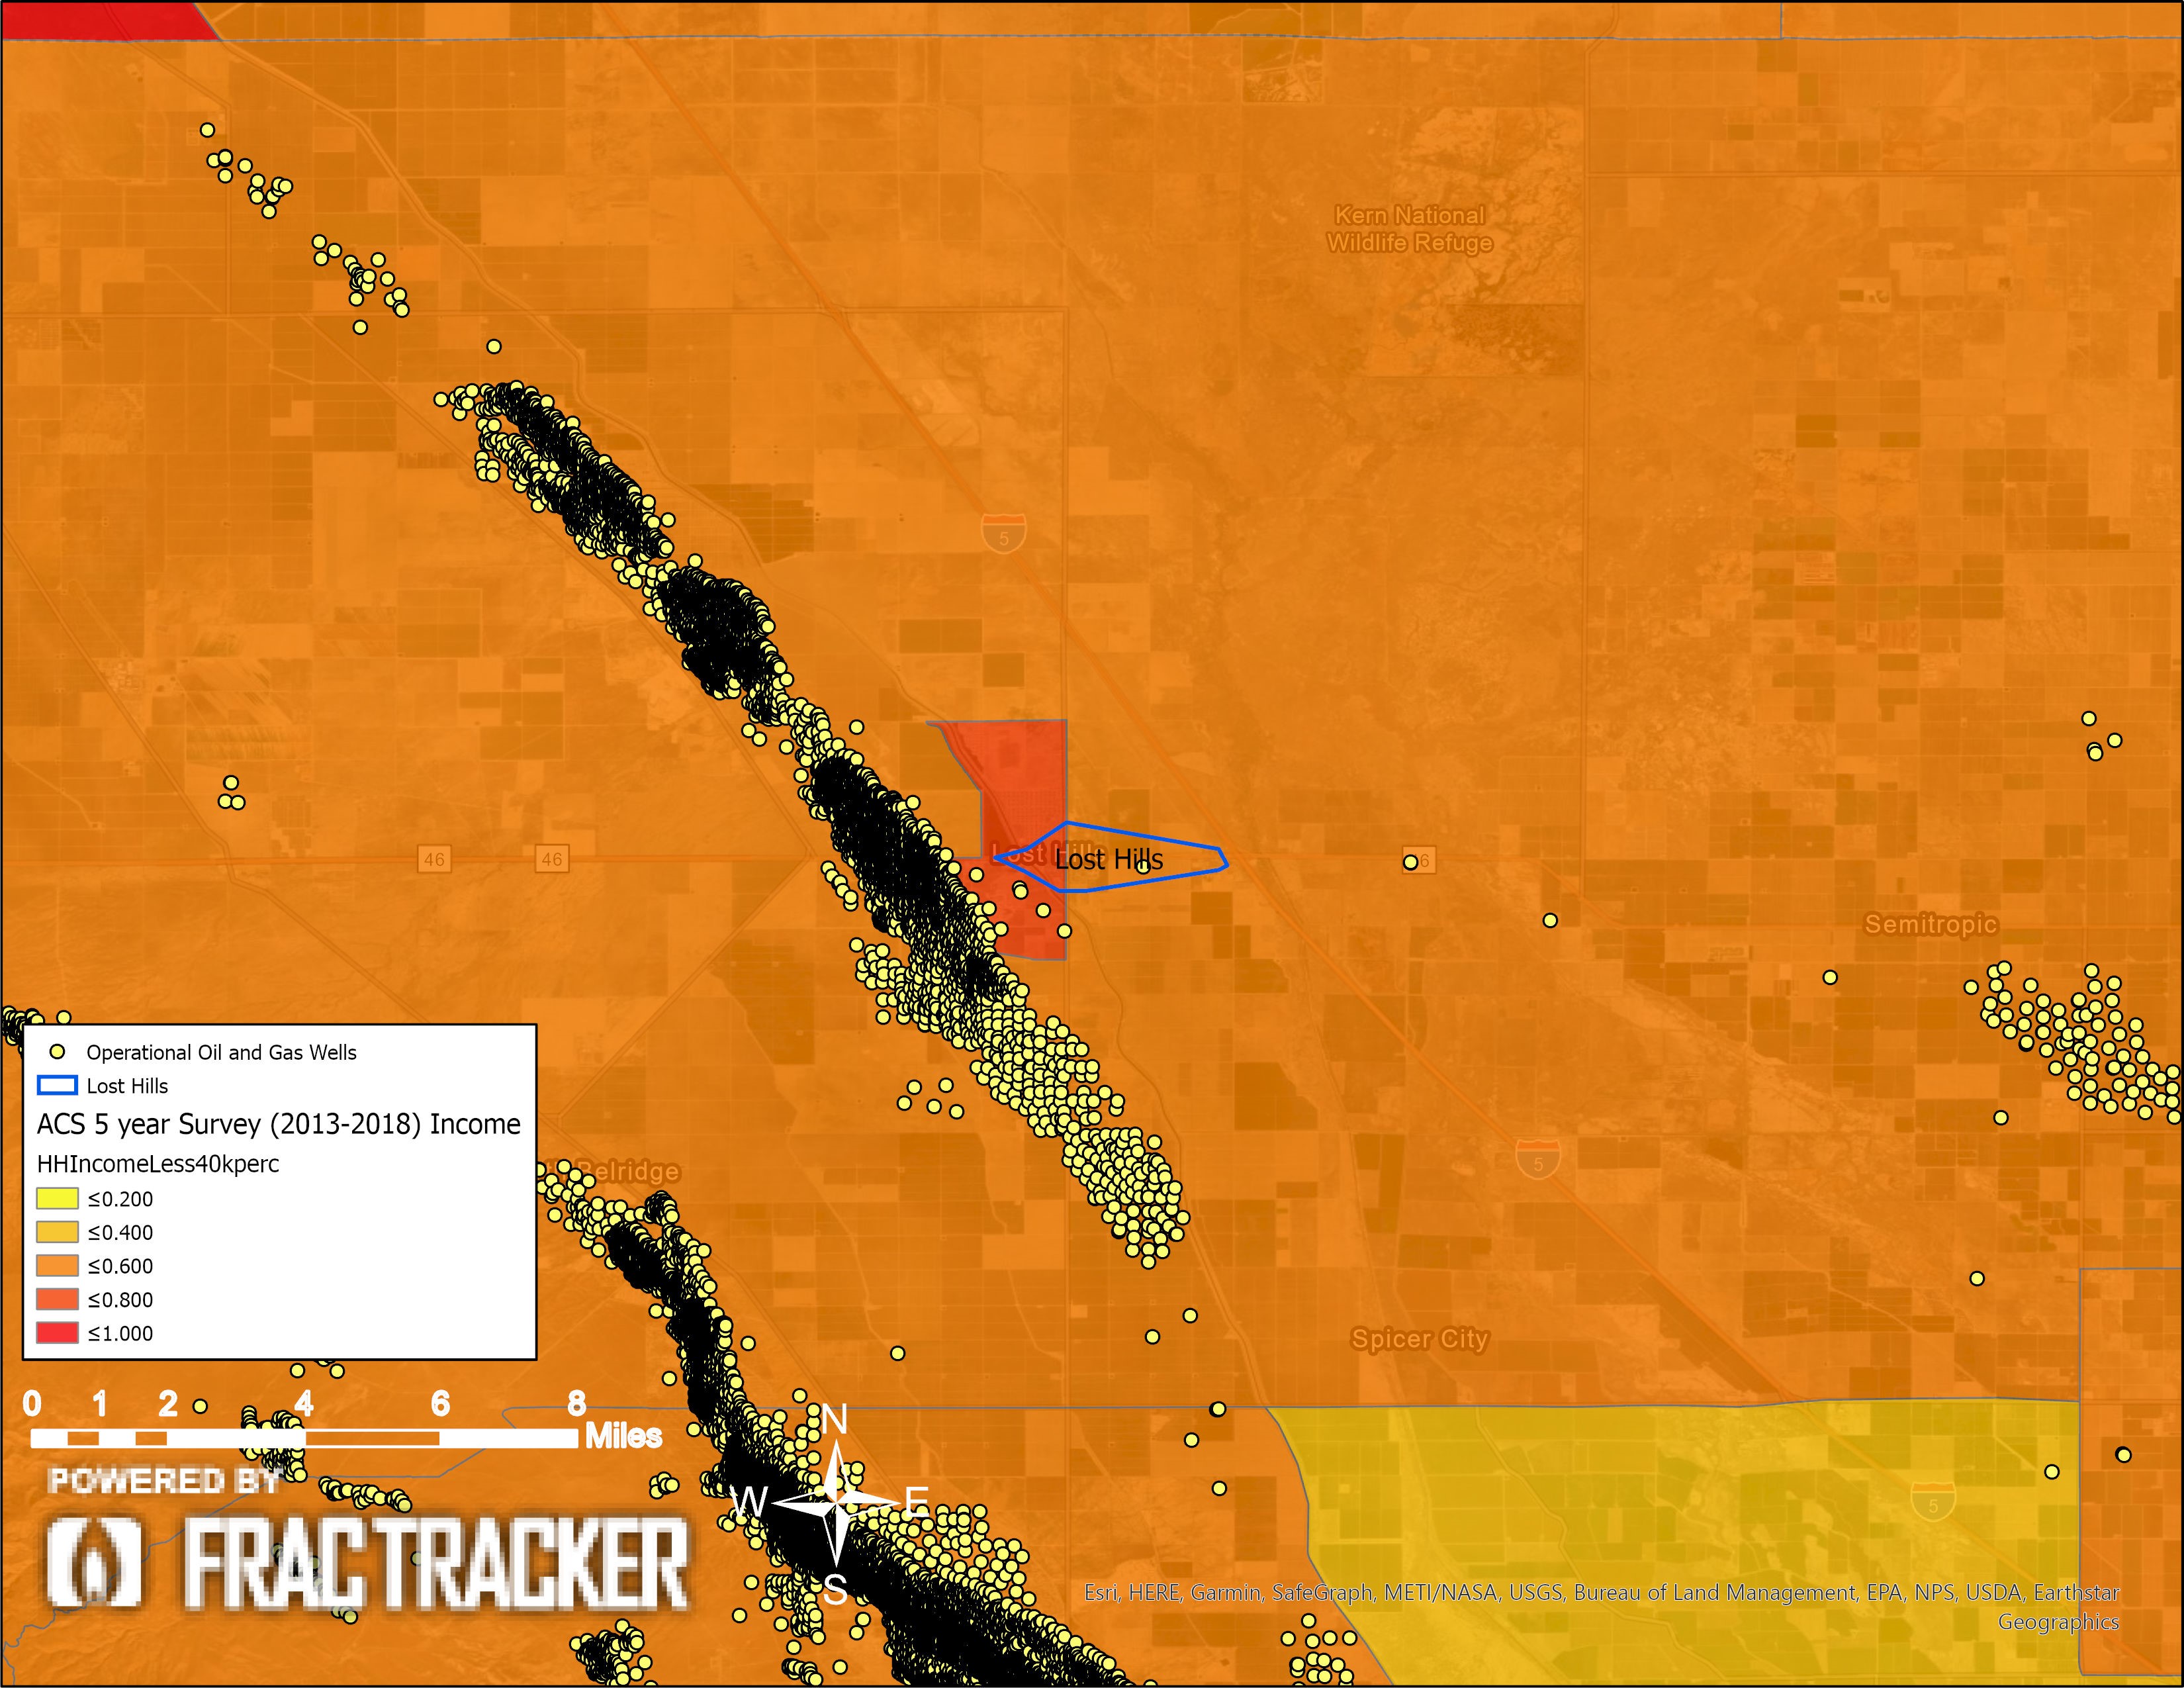
Figure 7. Lost Hills income disparity: This map shows the population percentage with annual incomes of less than or equal to $40,000, which is less than 80% of the Kern median income of $51,579 (2018).
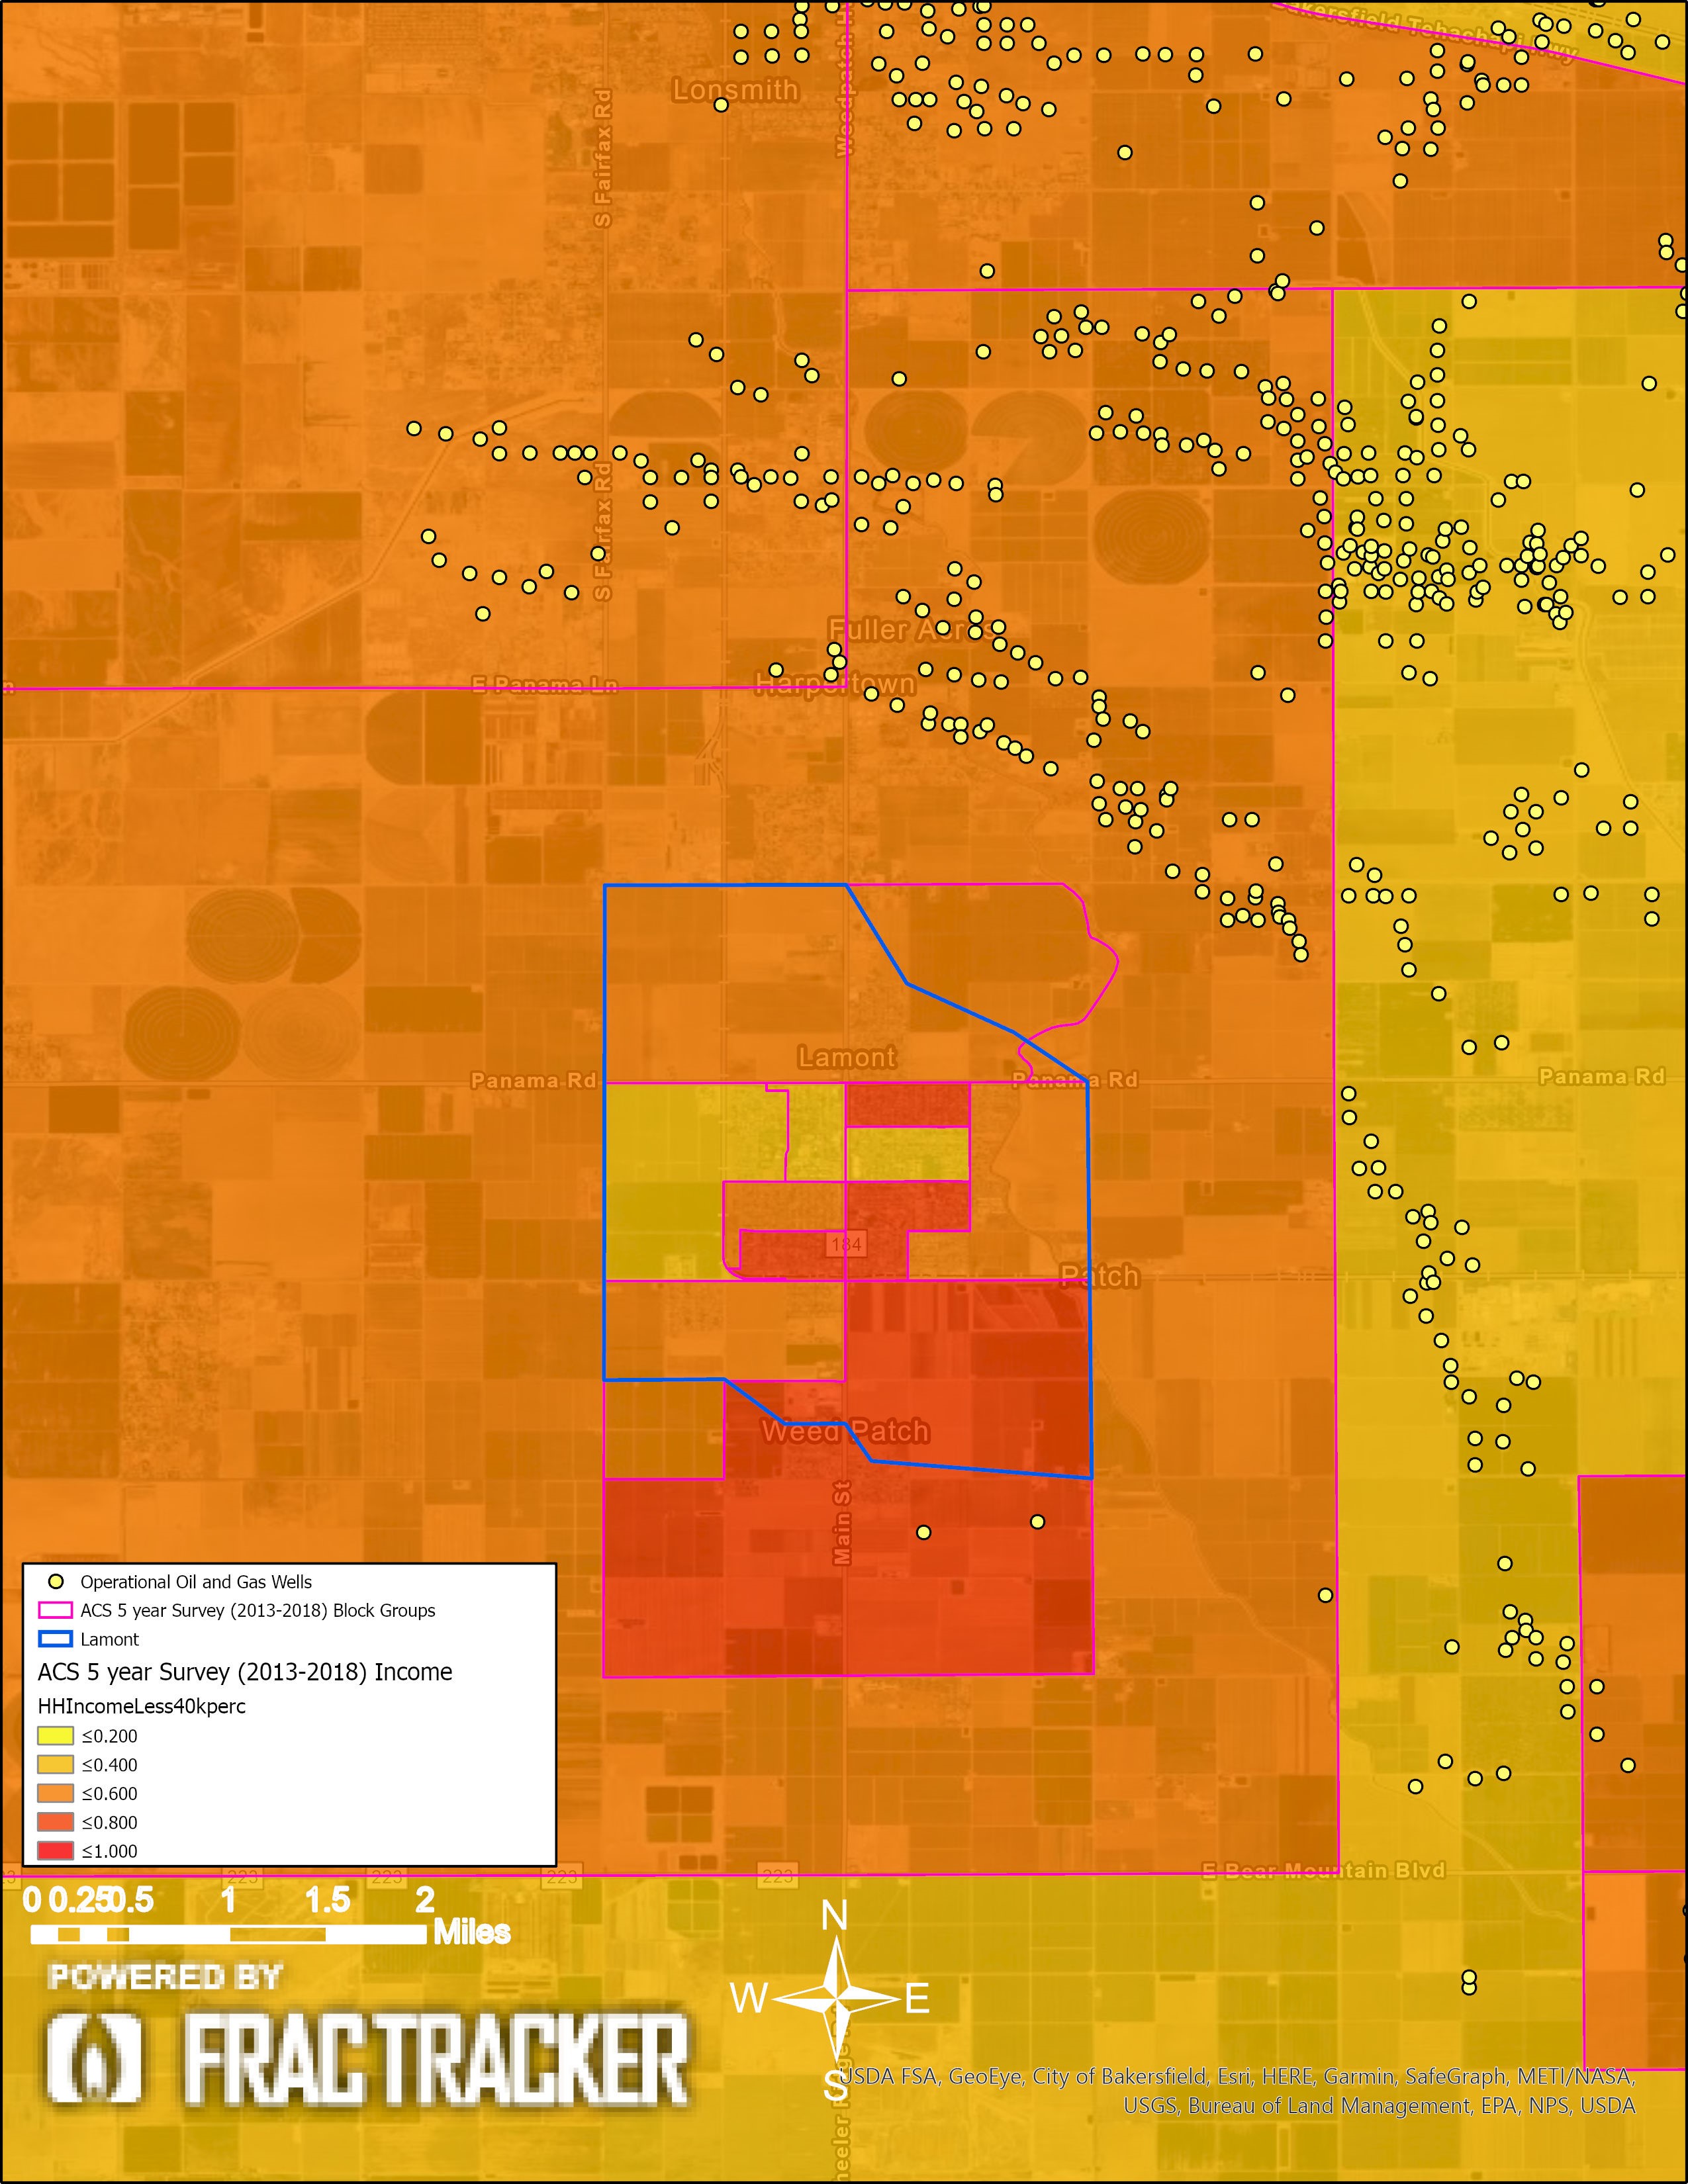
Figure 8. Lamont income disparity: This map shows the population percentage with annual incomes less than or equal to $40,000, which is less than 80% of the Kern median income of $51,579 (2018).
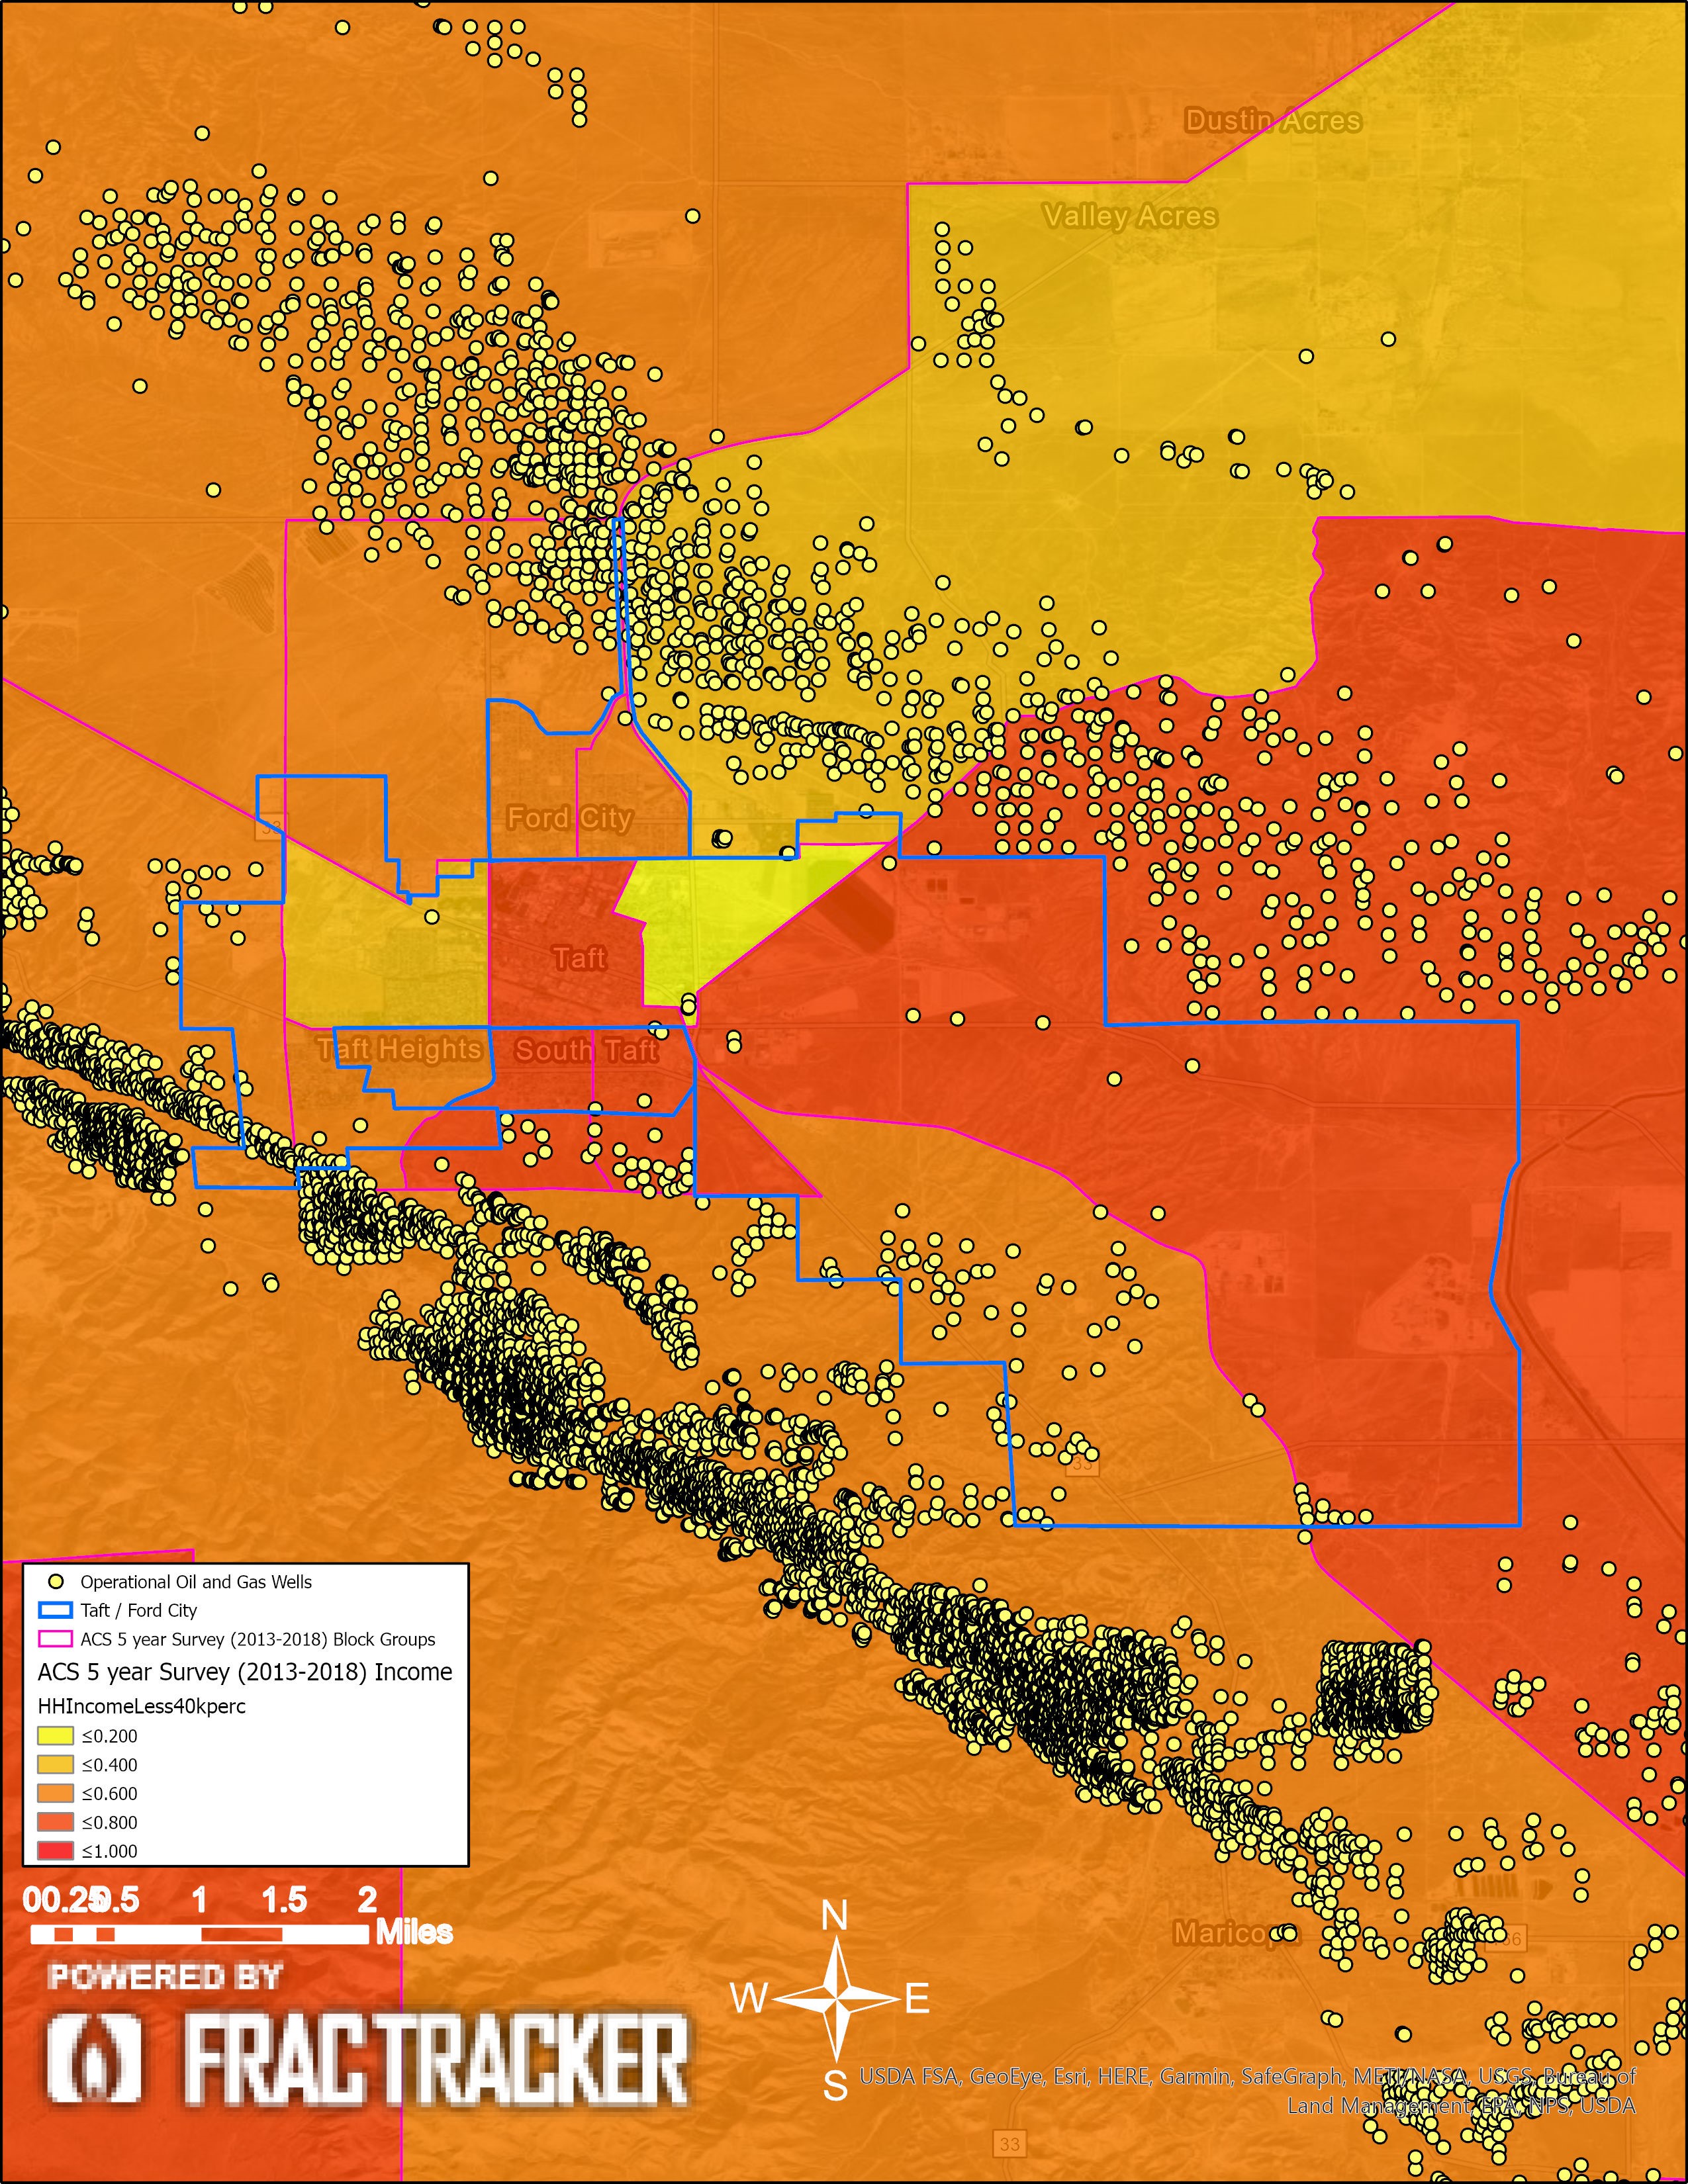
Figure 9. Taft income disparity: This map shows the population percentage with annual incomes less than or equal to $40,000, which is less than 80% of the Kern median income of $51,579 (2018).
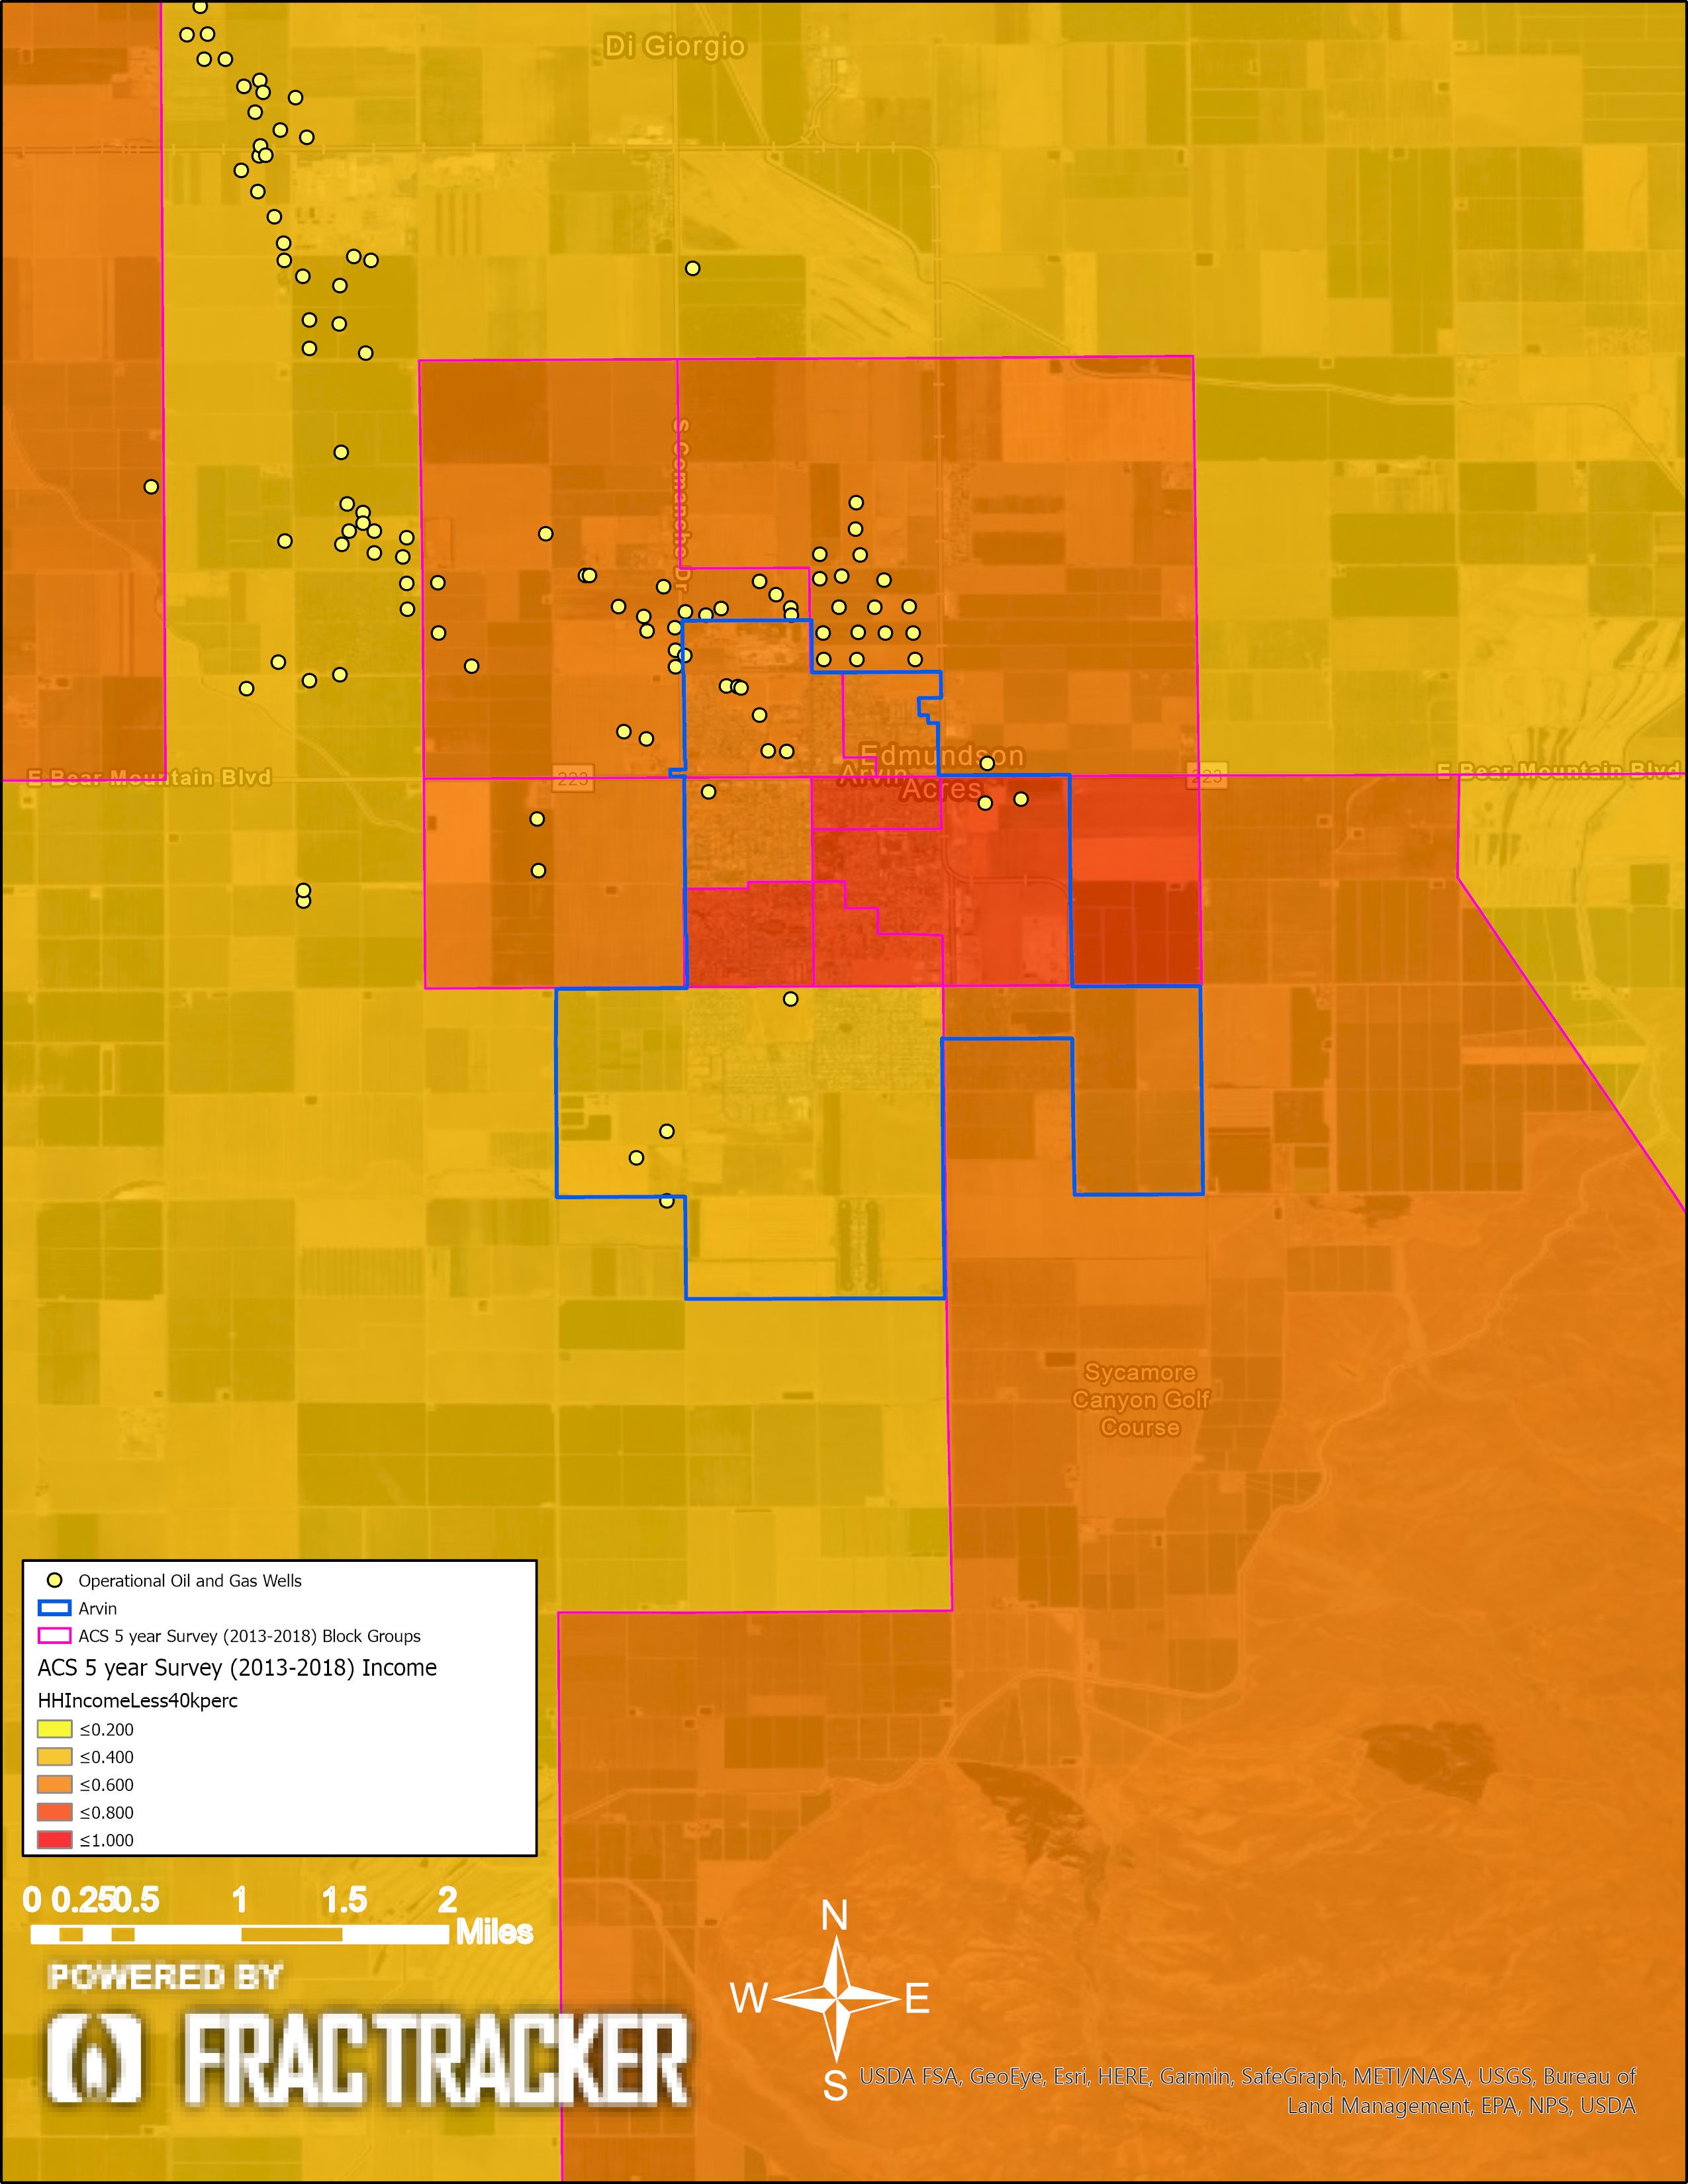
Figure 10. Arvin income disparity: This map shows the population percentage with annual incomes less than or equal to $40,000, which is less than 80% of the Kern median income of $51,579 (2018).
Access to information is vital for representation. Without representation, communities have no power over their autonomy. Kern County’s Frontline Communities are denied this basic, but absolutely vital right. According to the U.S. Census, over 51% of Kern County is Hispanic, and the maps below show that the demographics of the Frontline Communities in these cities are regularly between 80 – 100% Hispanic. Additionally, the maps illustrate that the households in these communities are majority Spanish-speaking households, many with limited English proficiency (all persons aged five and older reported speaking English less than “very well”). Yet Kern County regulators only provide information, notices, and other materials in English. This linguistically segregates power in Kern County, limiting Spanish-speaking Kern residents and citizens from participating in local decision-making processes.
Using the five-year ACS census data (2018) clipped by the 2,500 feet well setback zone, I have calculated the percentage and number of Spanish-speaking households. For the areas of Frontline Community block groups within 2,500 feet of an operational well, 9,077 households (30.8%) speak Spanish as their primary language, and 1,900 households have limited access to proficient English translators.
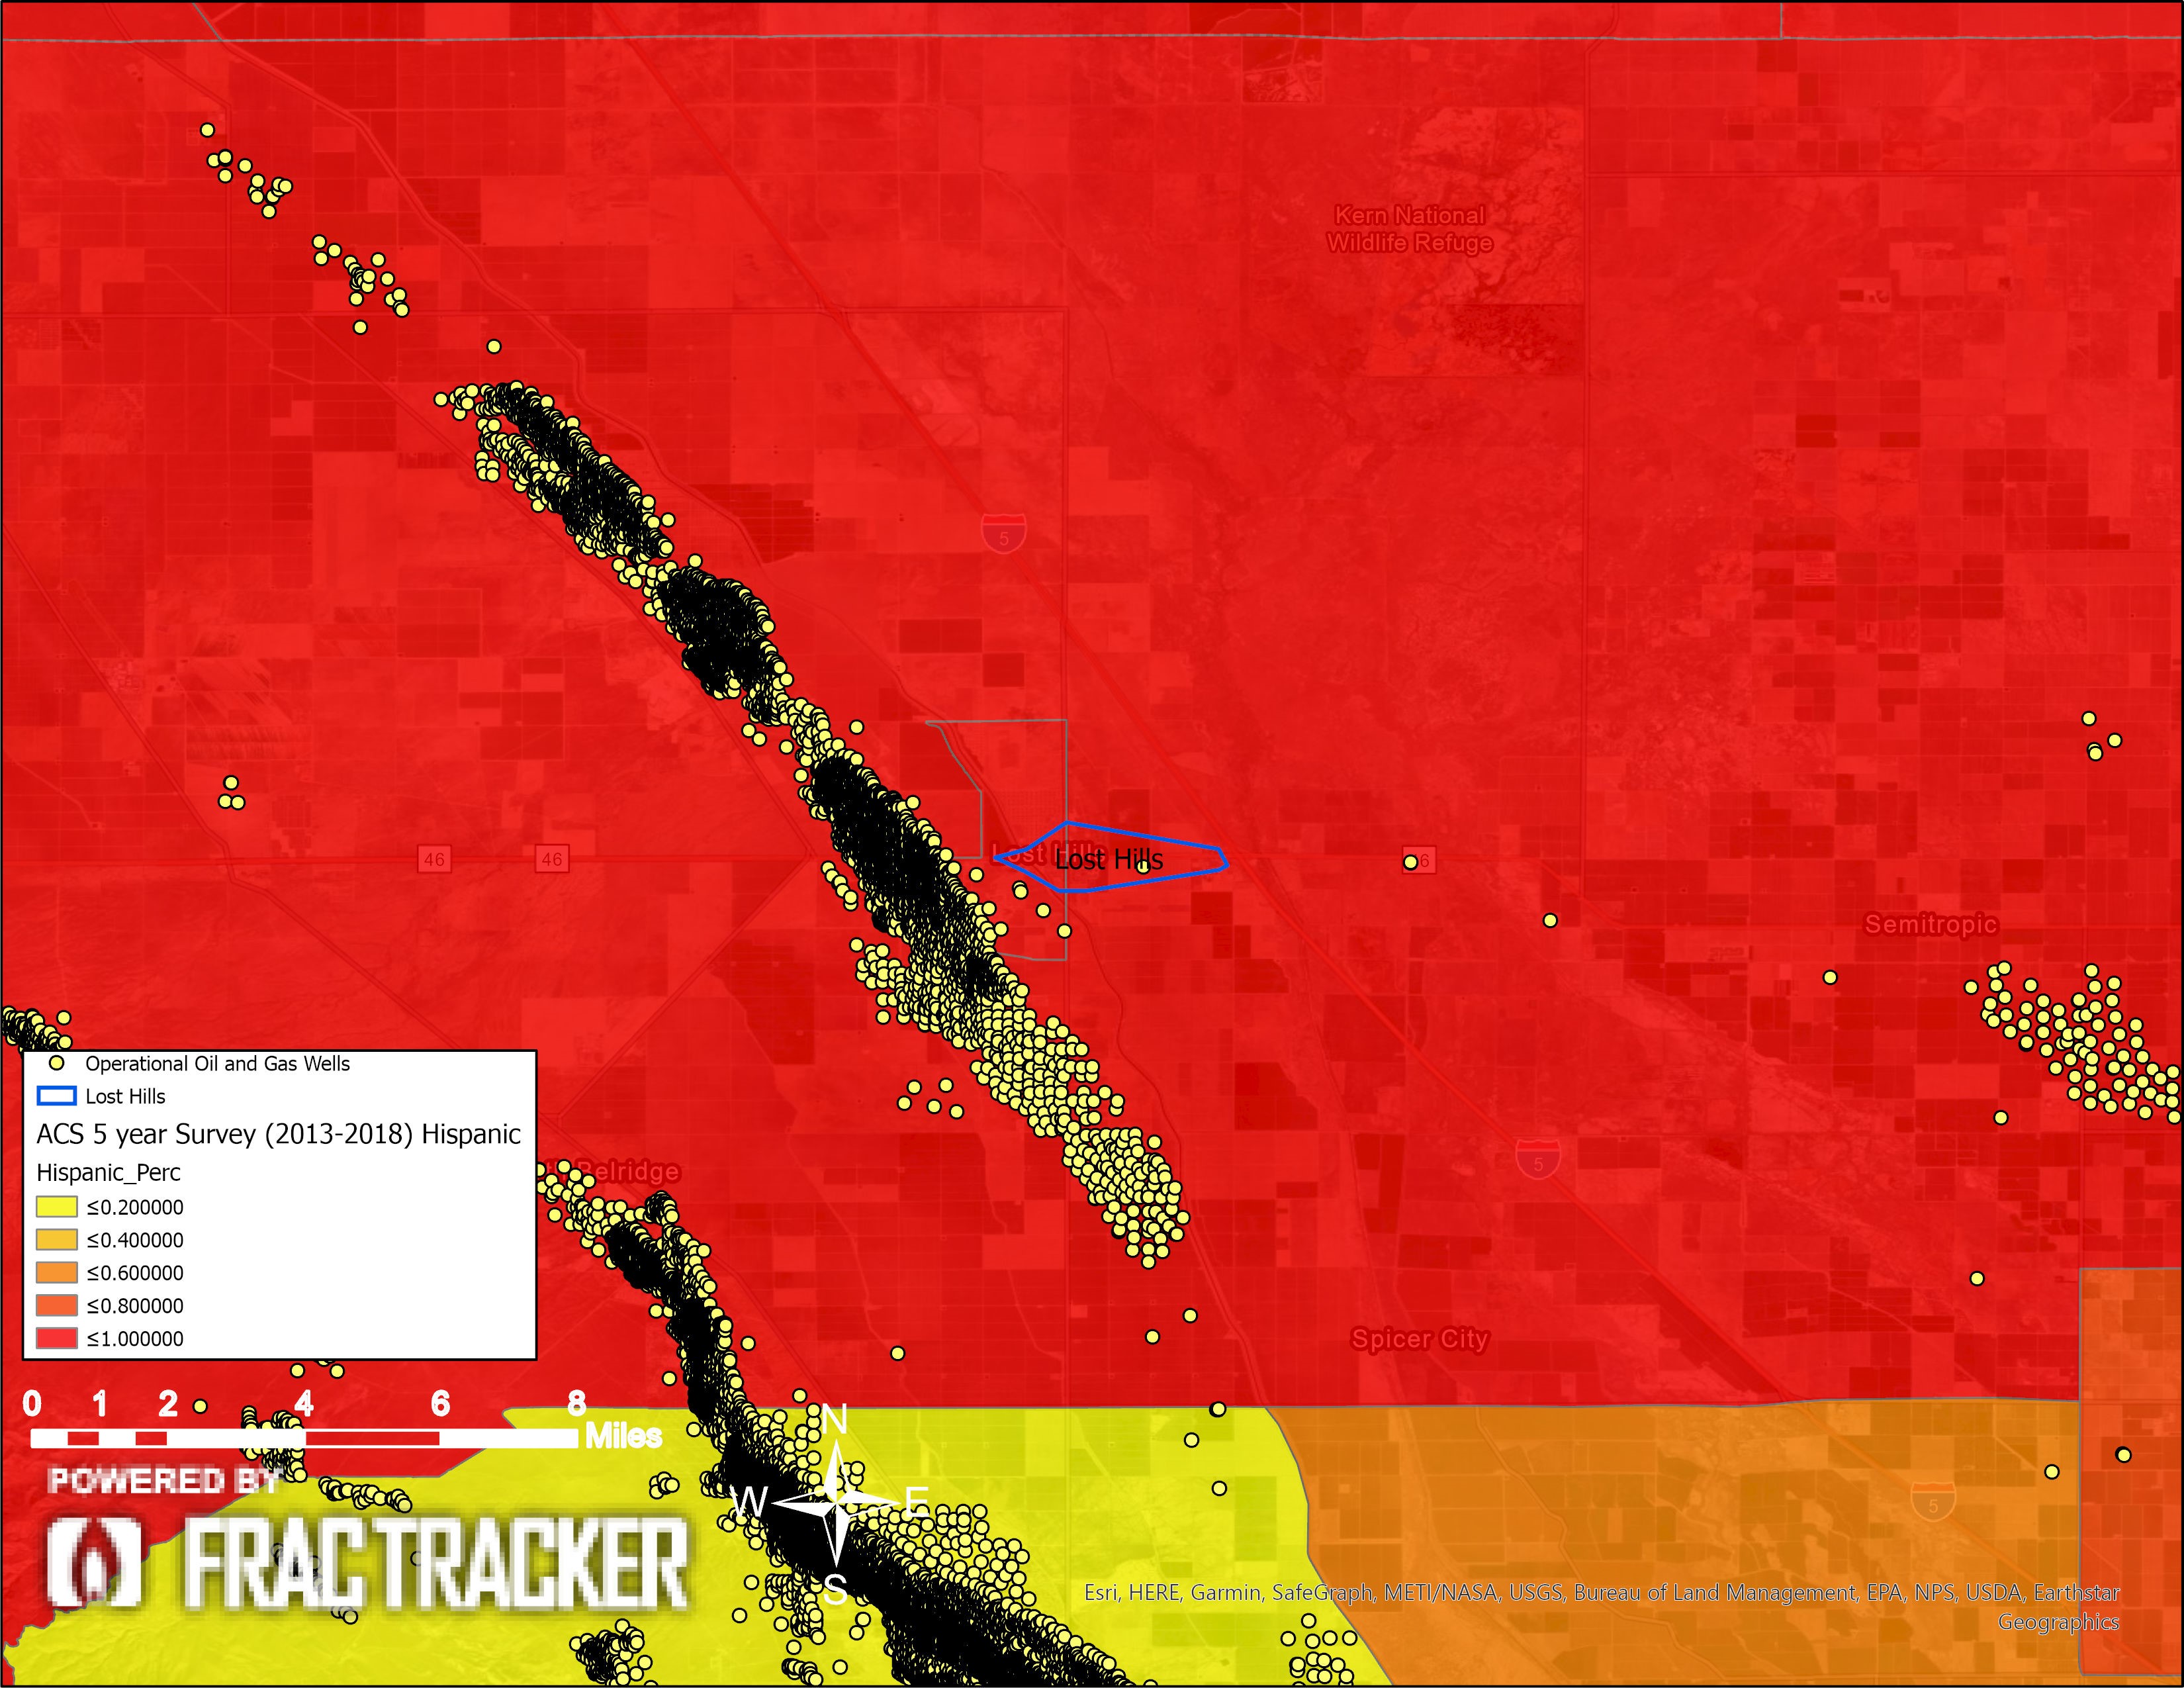
Figure 11. Lost Hills Hispanic population demographics: This map shows the Hispanic percentage of the population. In these maps, the ACS data is summarized in percentages of one, where, for example, light orange (<.400) refers to areas where 20% – 40% of the population is Hispanic.
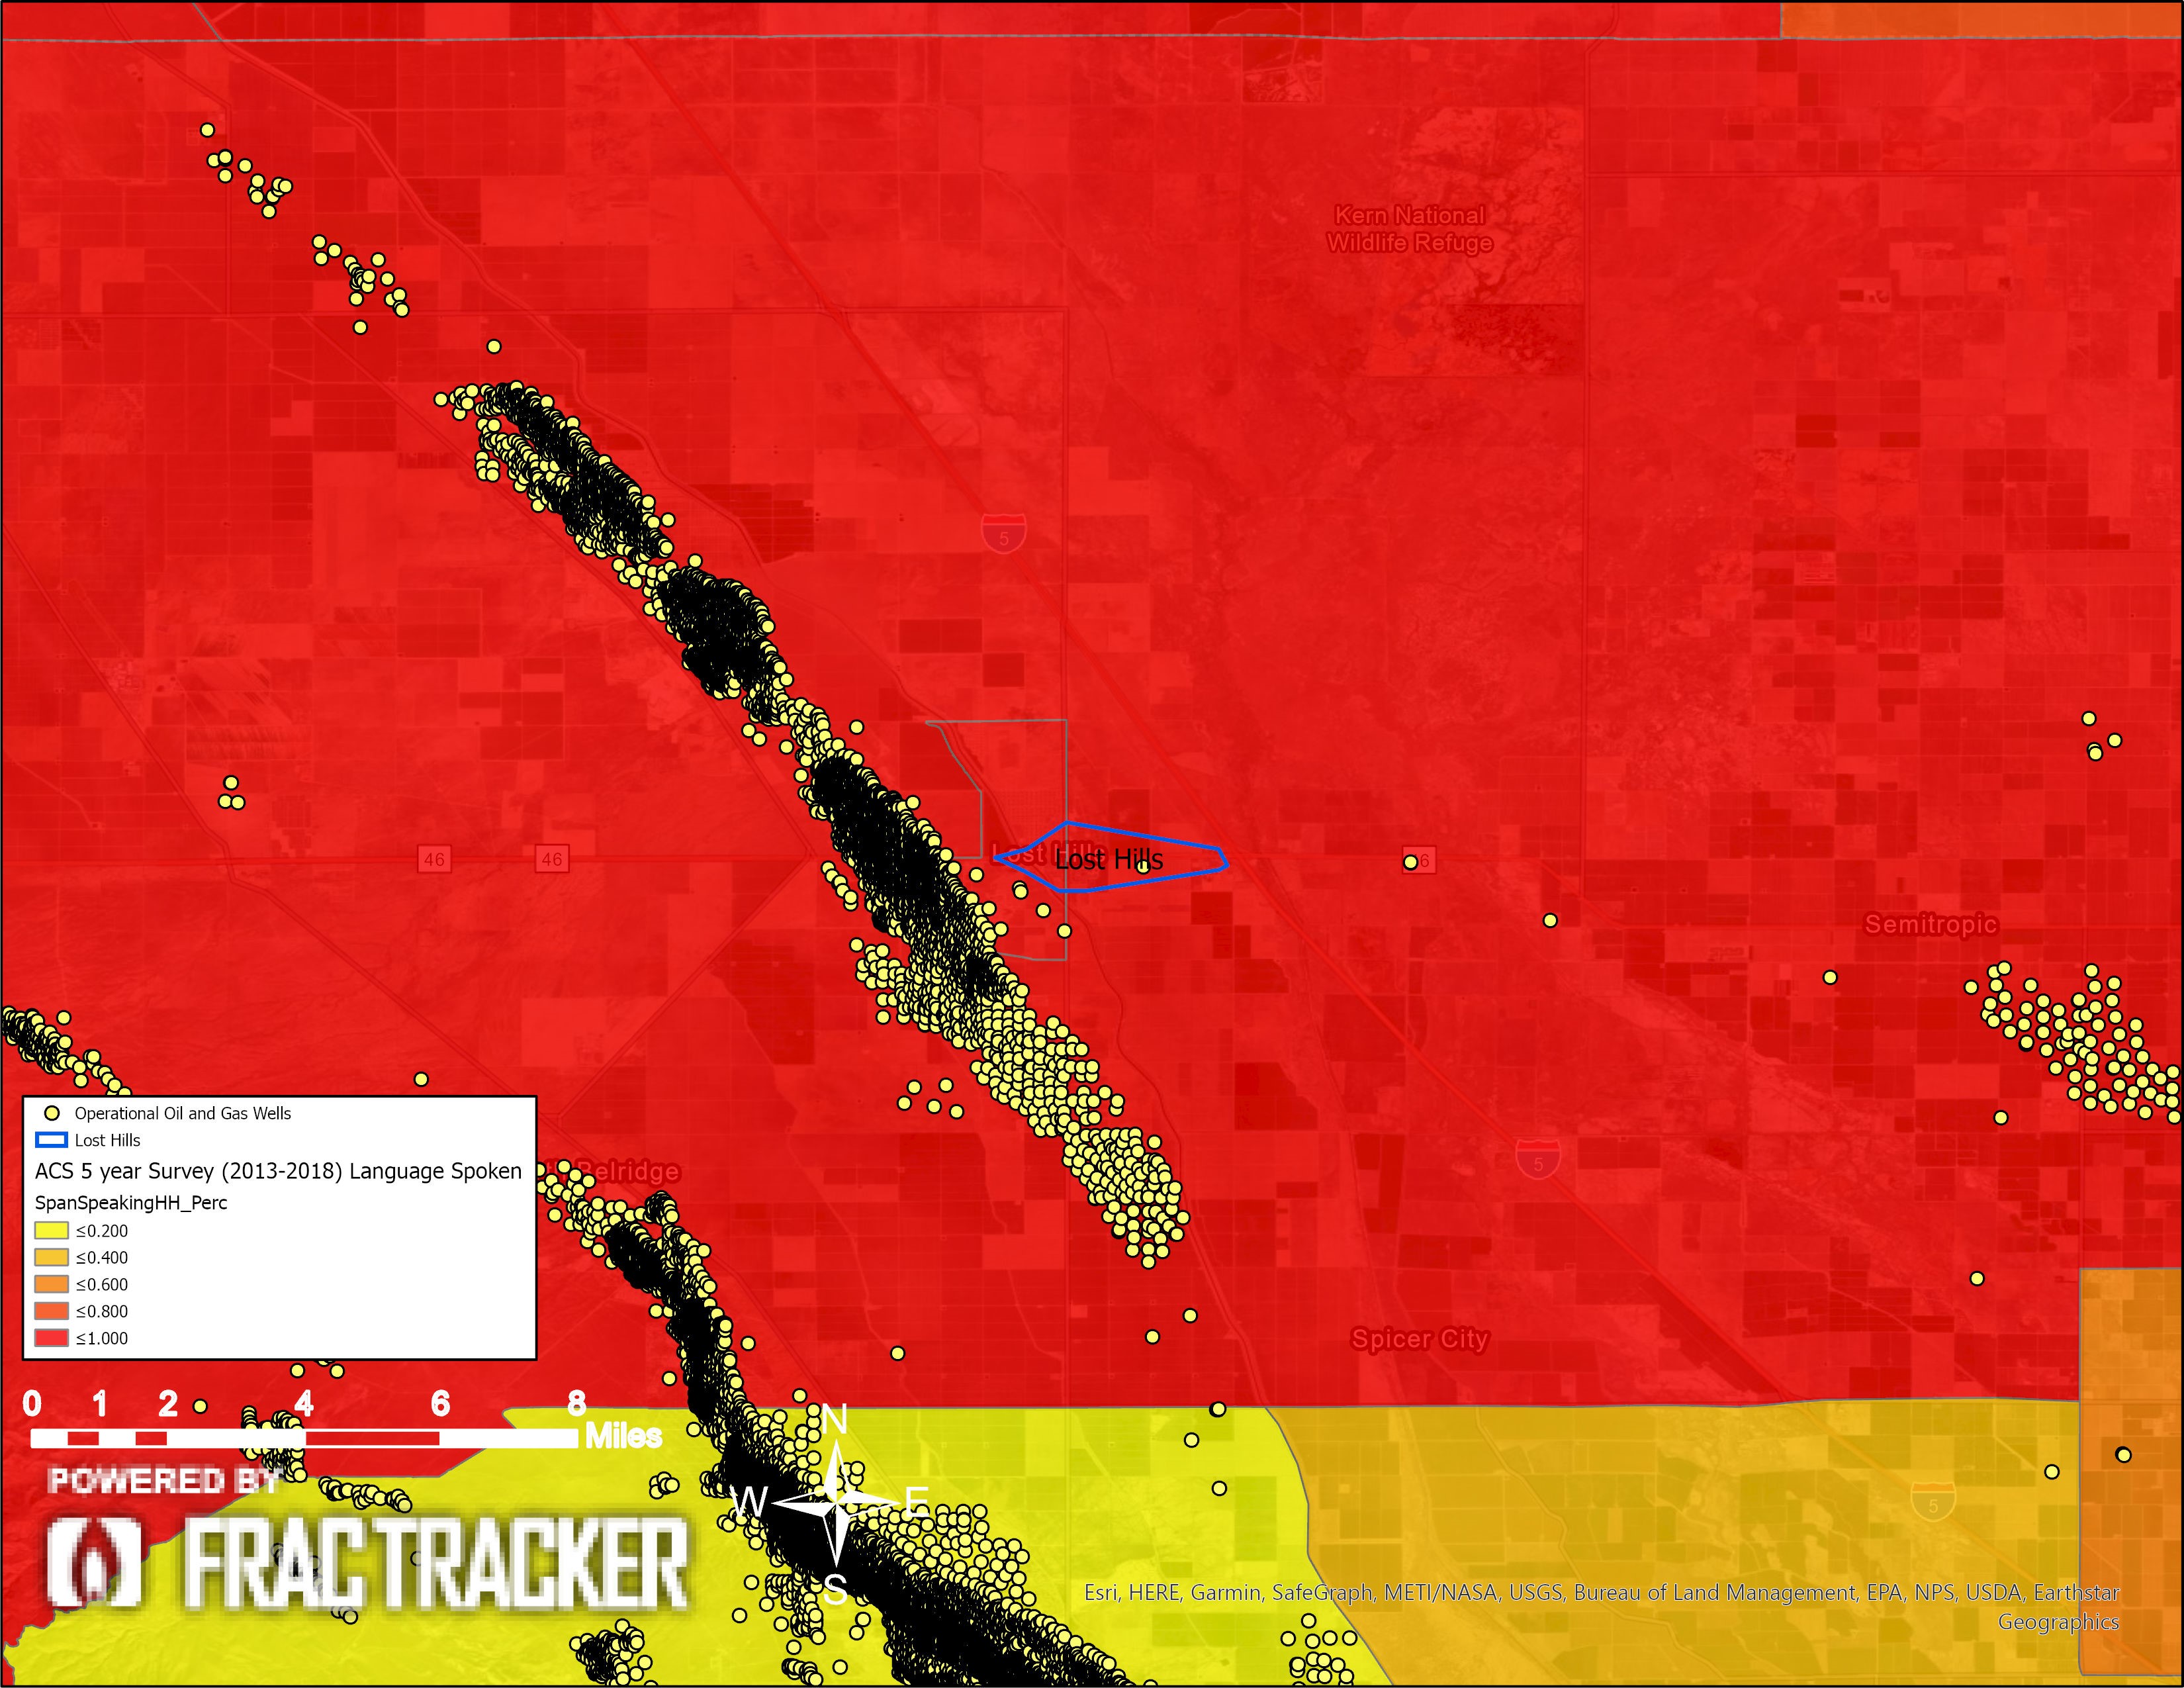
Figure 12. Lost Hills Spanish-speaking households: This map shows the percentage of the households that speak Spanish as their primary language. In these maps, the ACS data is summarized in percentages of one, where, for example, light orange (<.400) refers to areas where 20% – 40% of the households are Spanish speaking.
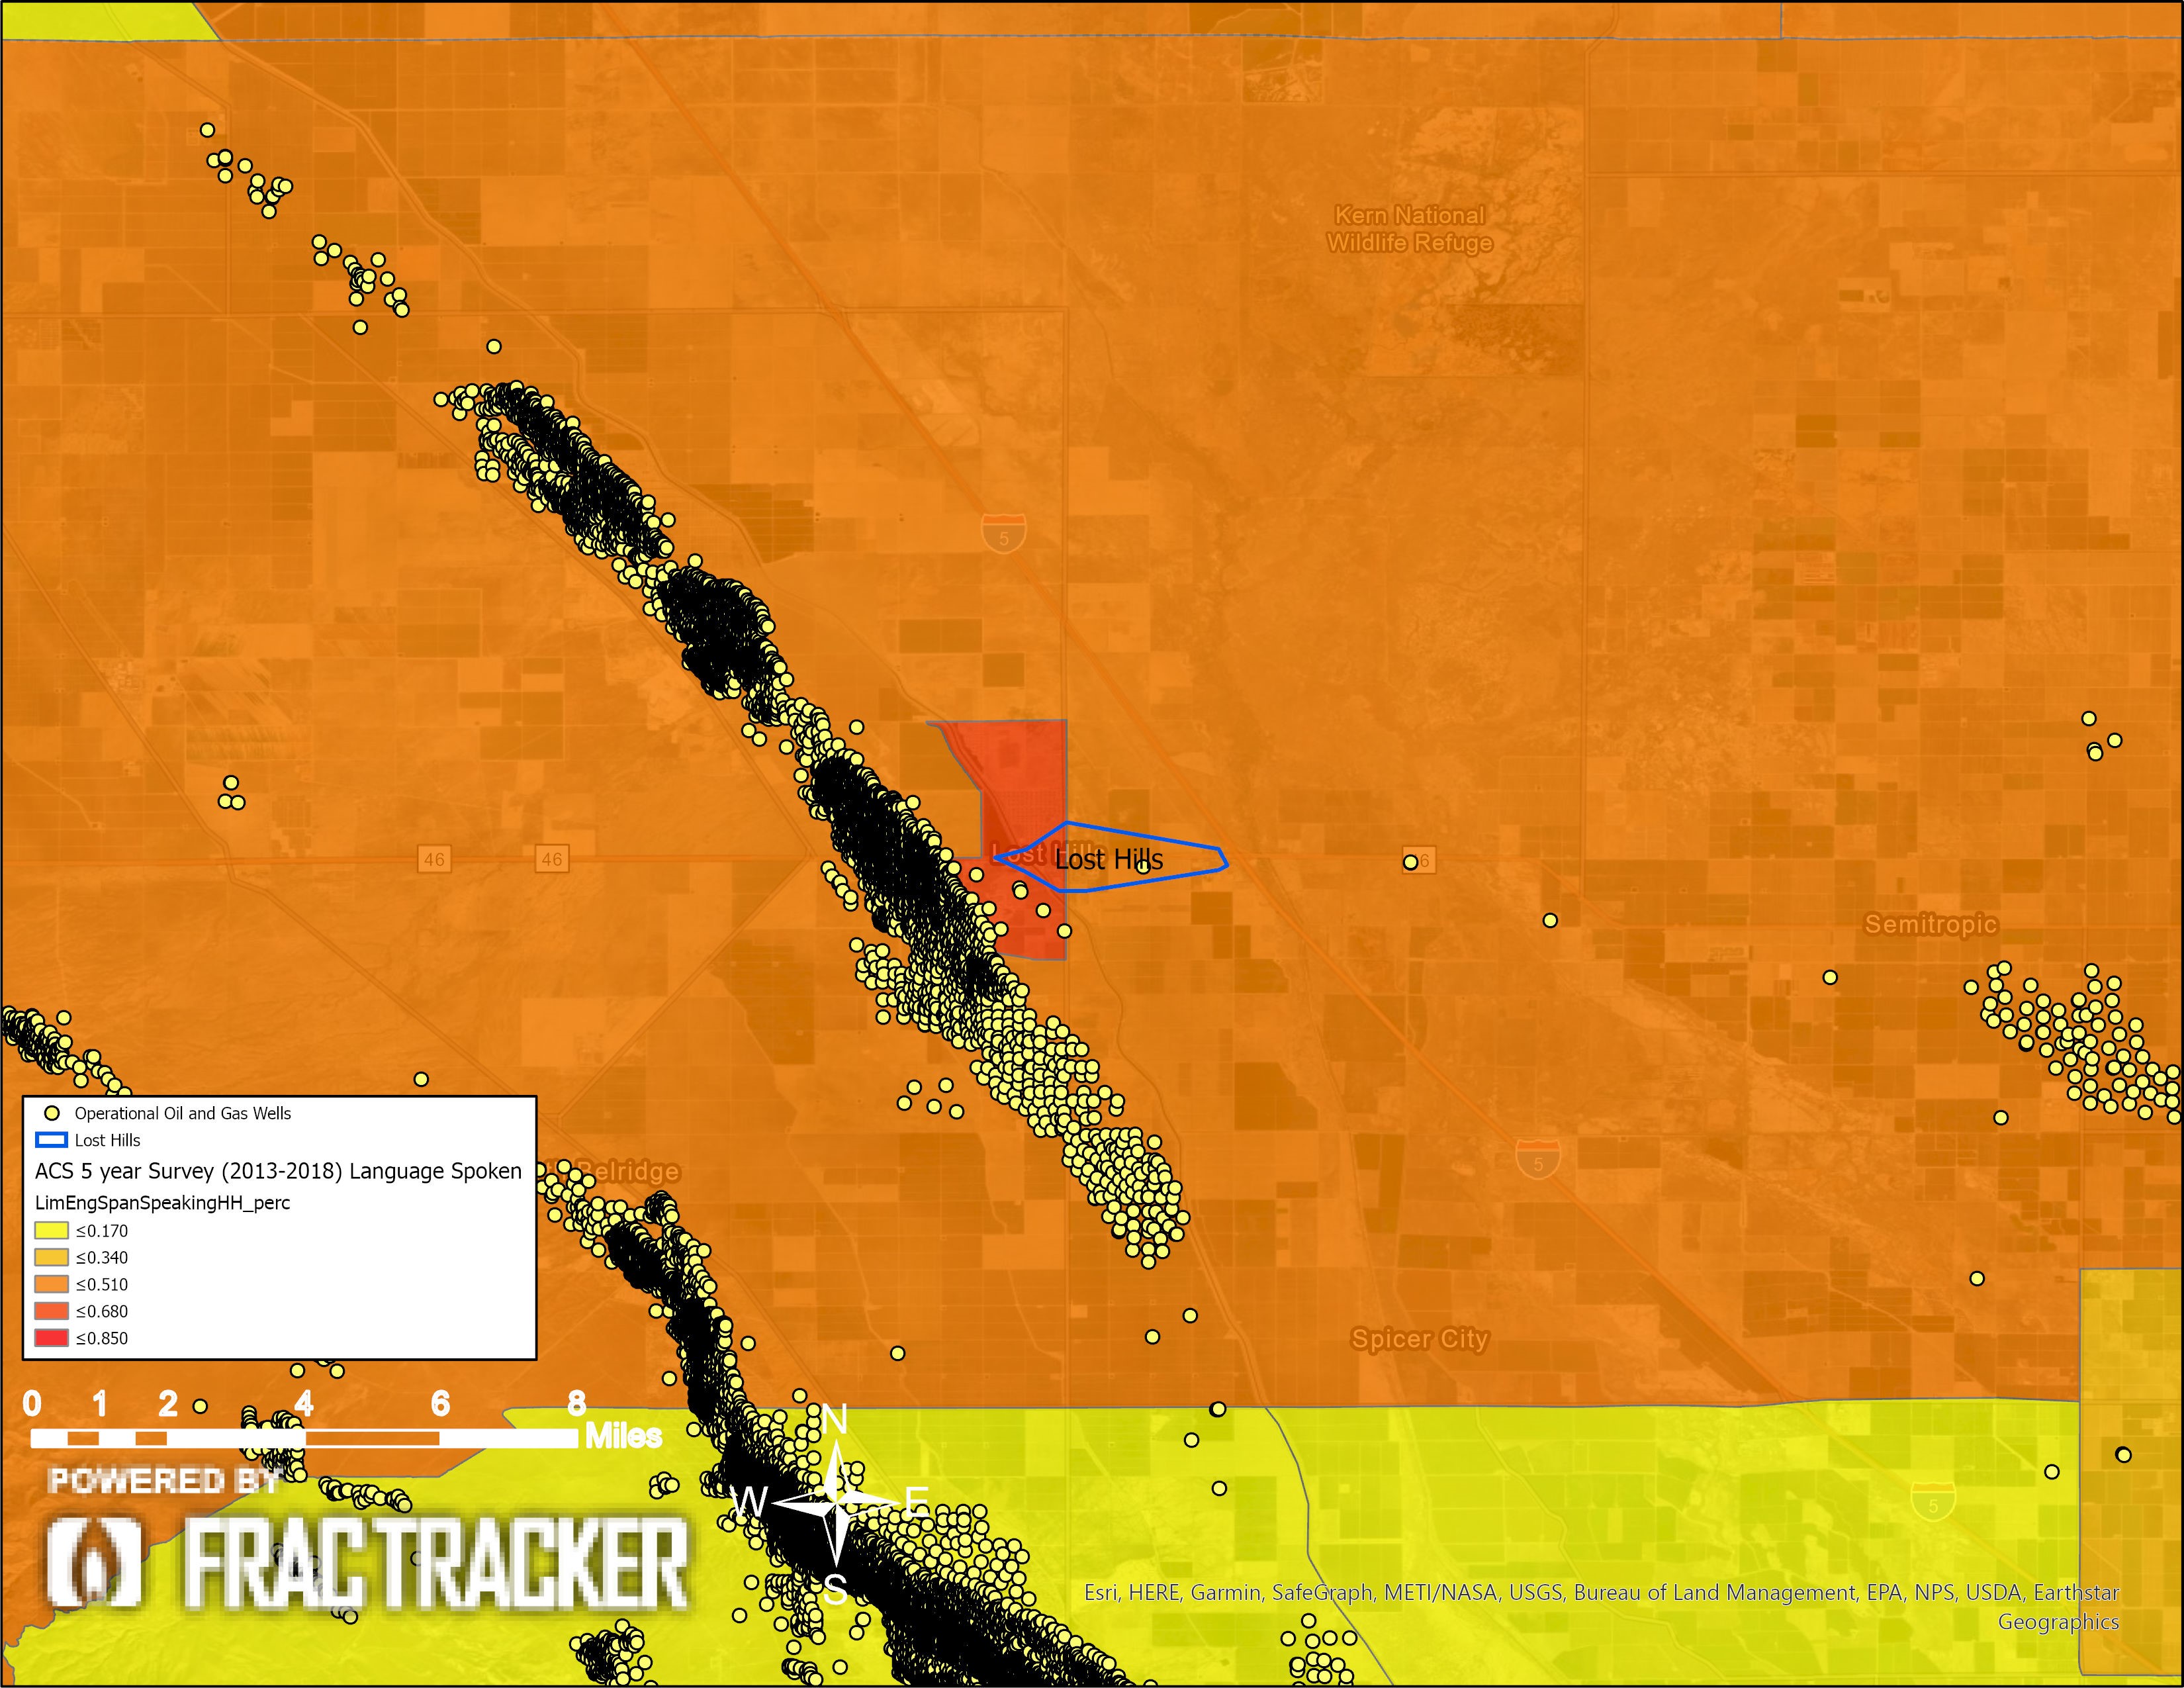
Figure 13. Lost Hills Limited English Spanish-speaking households: This map shows the household percentage that speak Spanish as their primary language, with limited English-speaking proficiency. In these maps, the ACS data is summarized in percentages of one, where, for example, light orange (<.400) refers to areas where 20% – 40% of the households are Spanish speaking and have limited English proficiency.
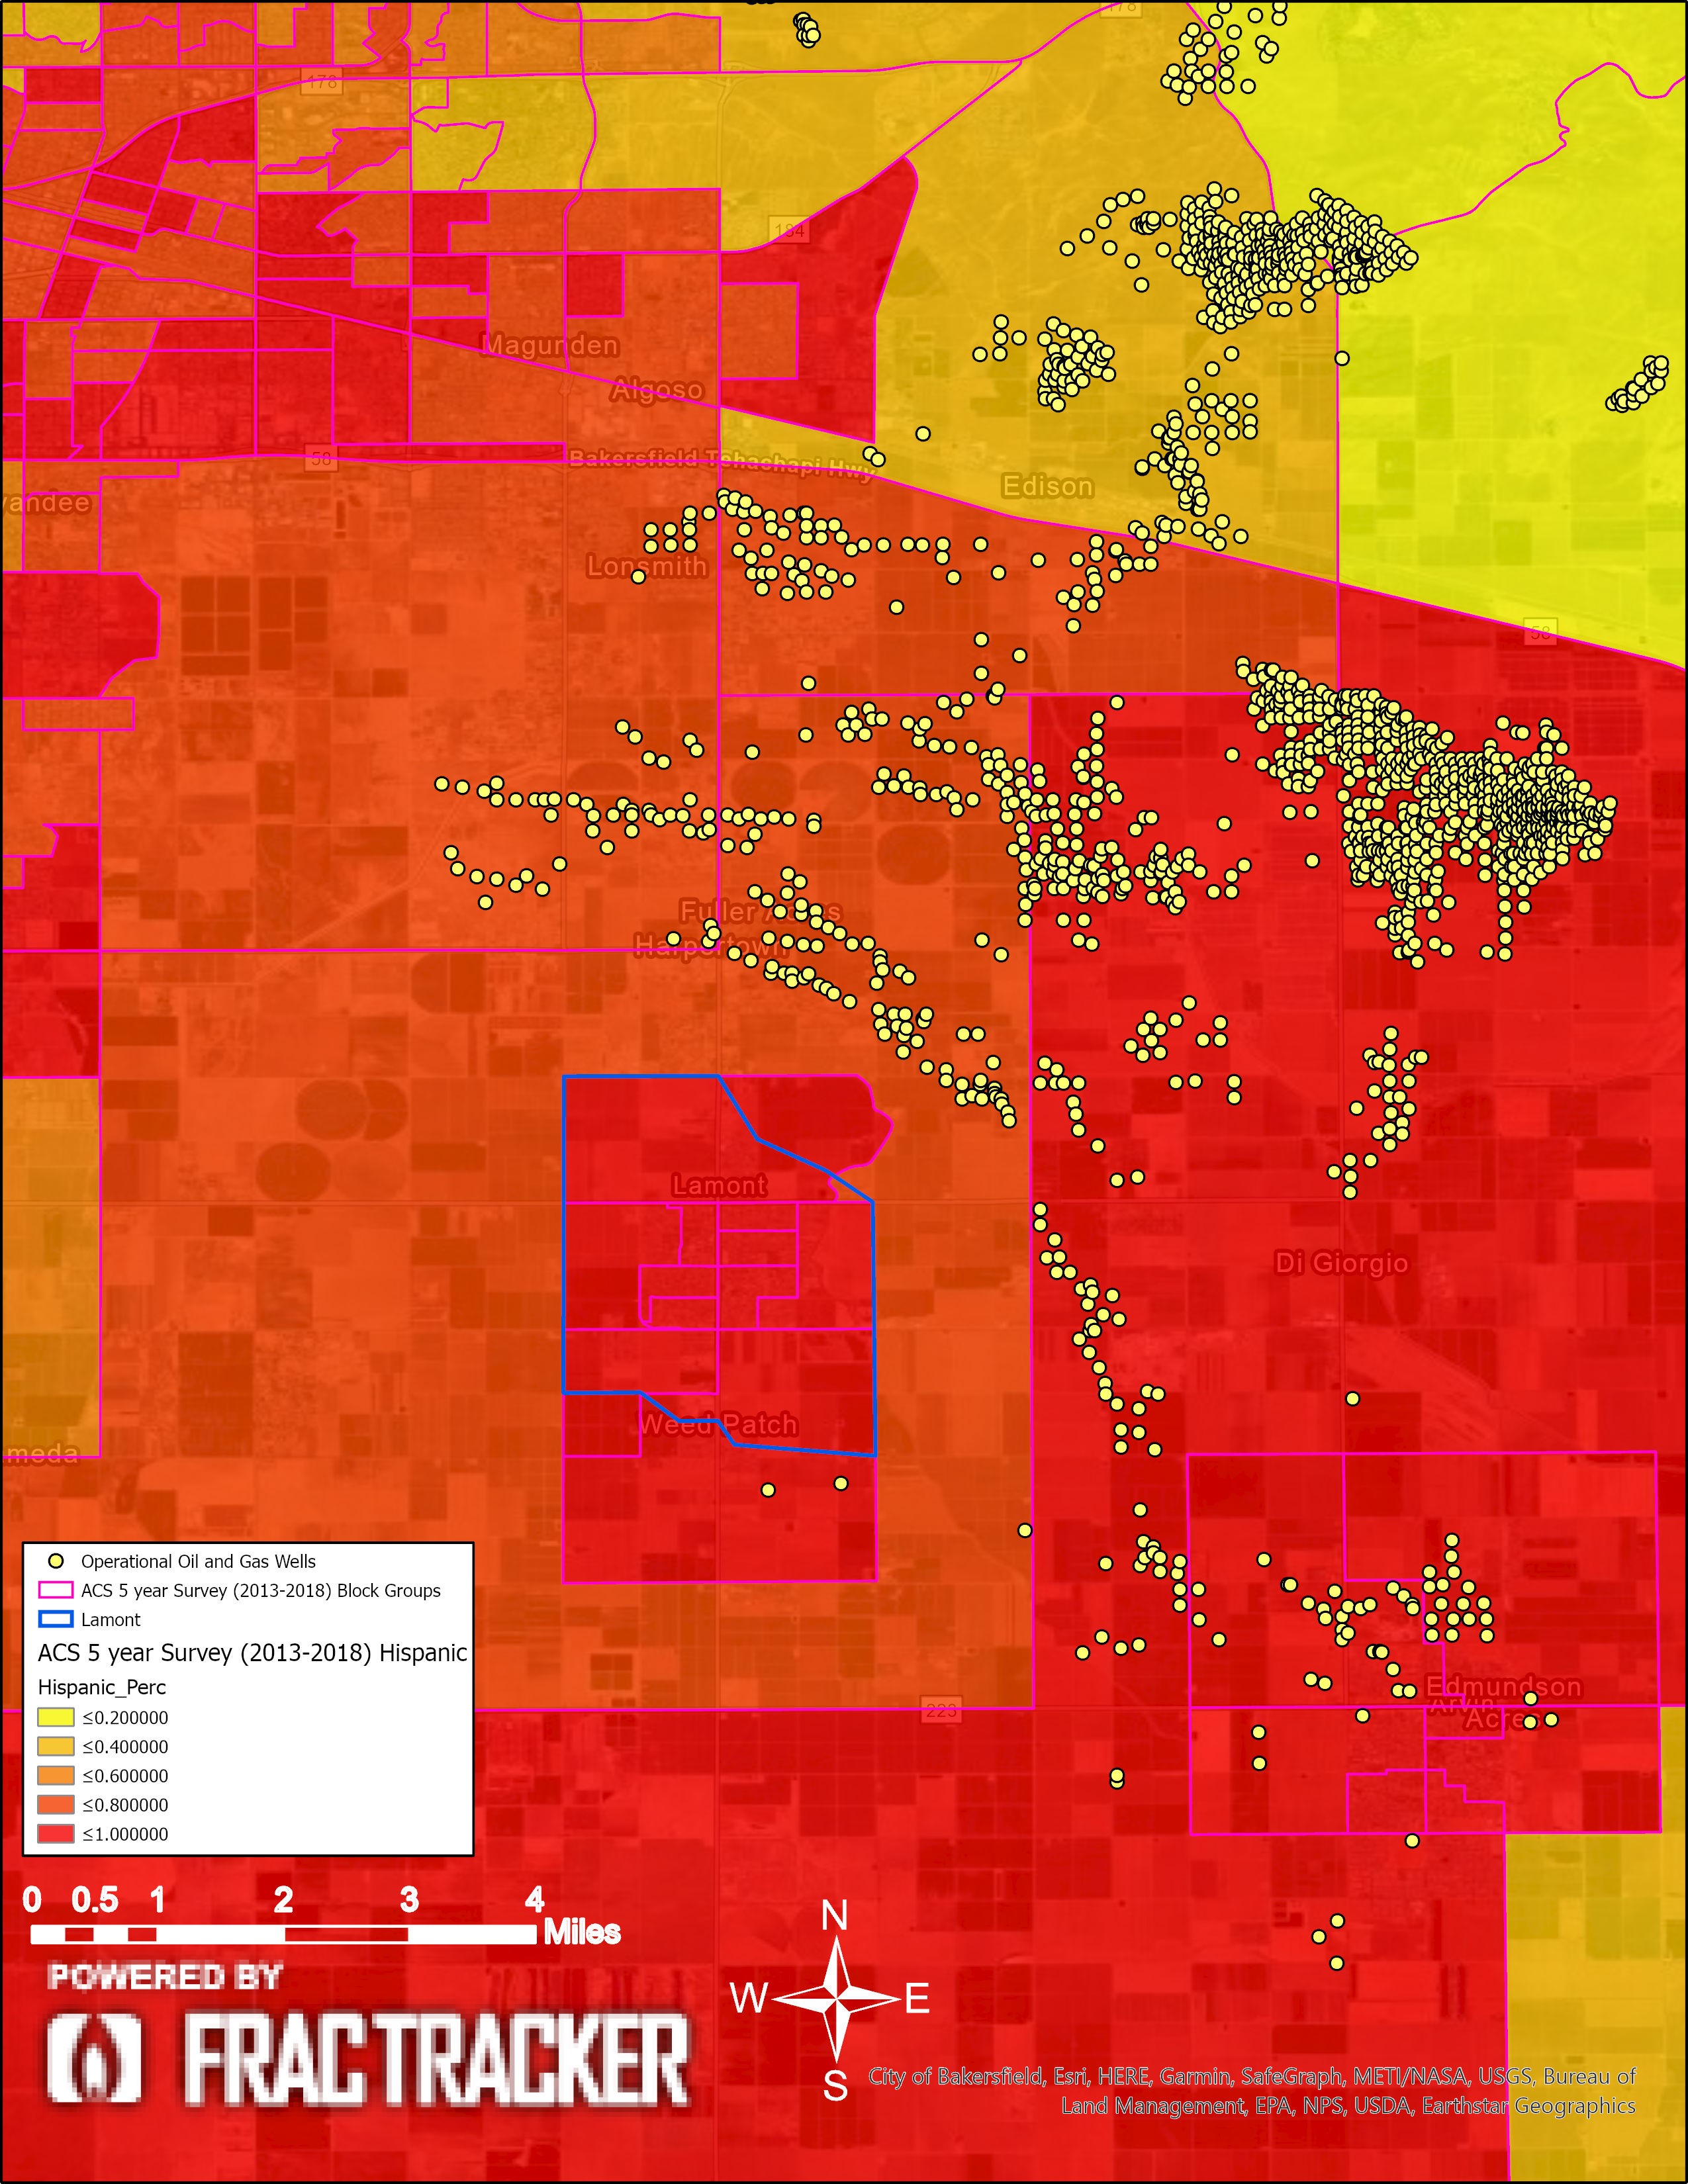
Figure 14. Lamont Hispanic population demographics: This map shows the Hispanic percentage of the population. In these maps, the ACS data is summarized in percentages of one, where, for example, light orange (<.400) refers to areas where 20% – 40% of the populations is Hispanic.
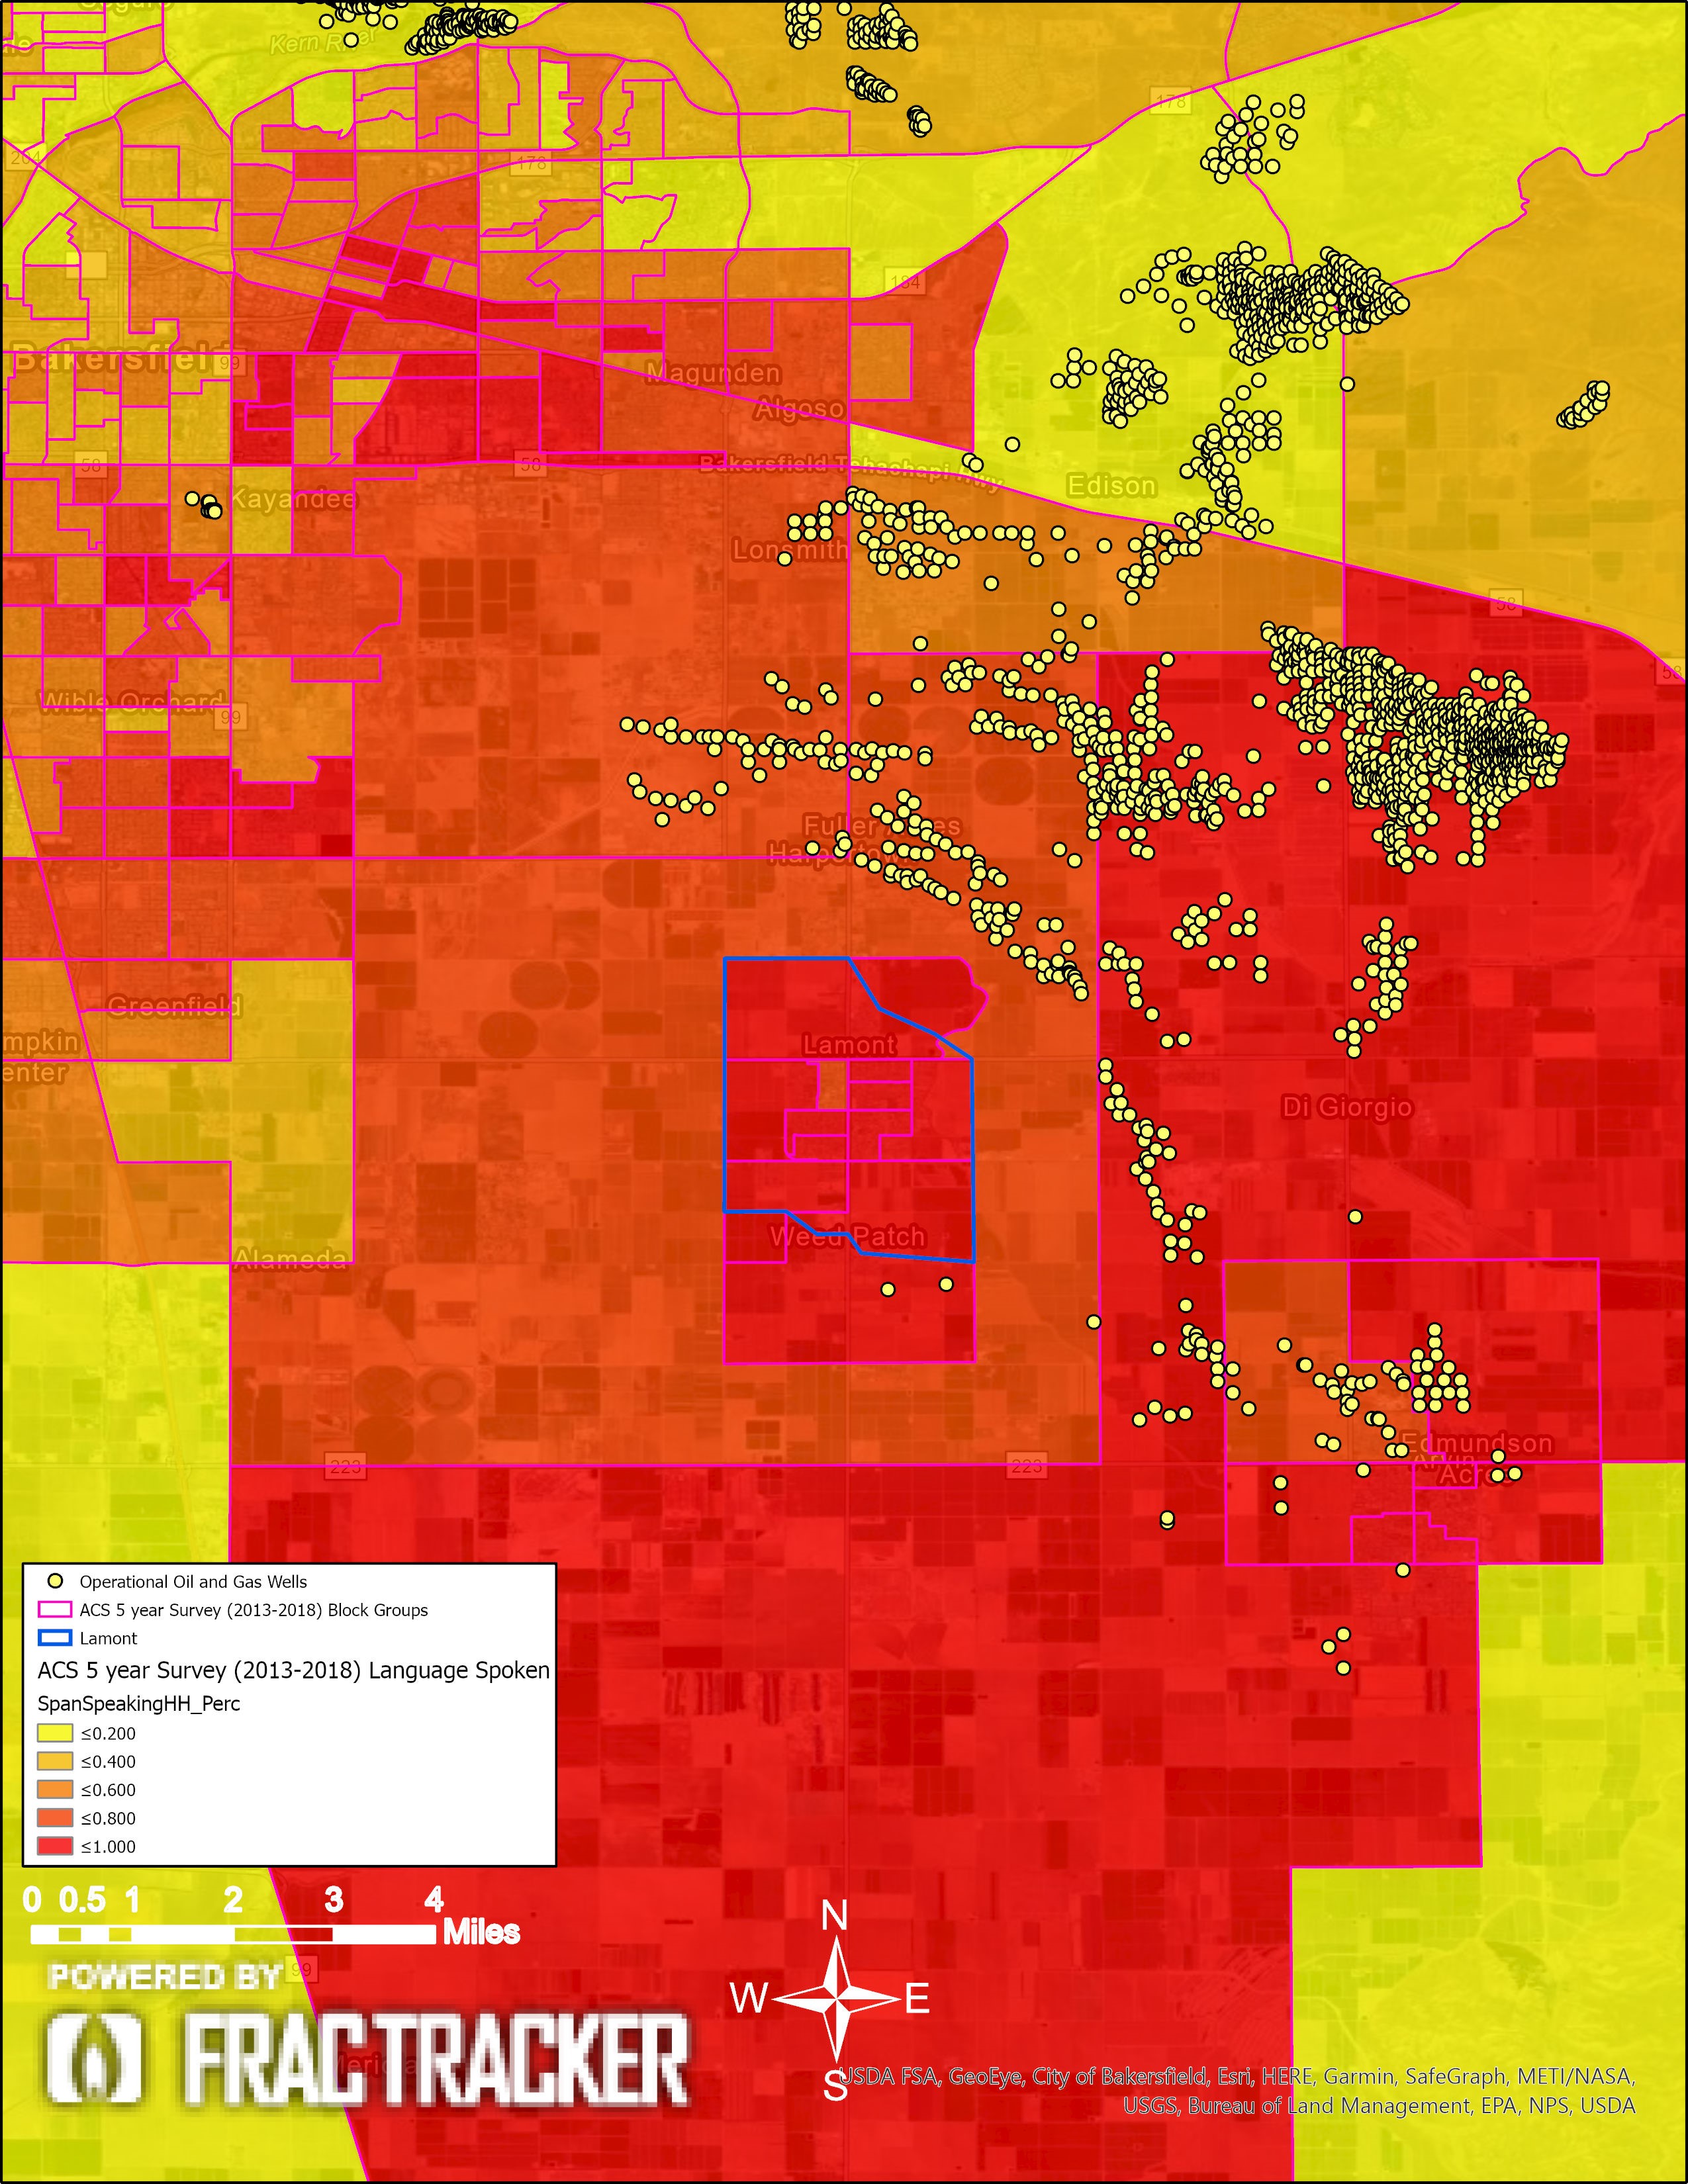
Figure 15. Lamont Spanish-speaking households: This map shows the percentage of the households that speak Spanish as their primary language. In these maps the ACS data is summarized in percentages of one, where, for example, light orange (<.400) refers to areas where 20% – 40% of the households are Spanish speaking.
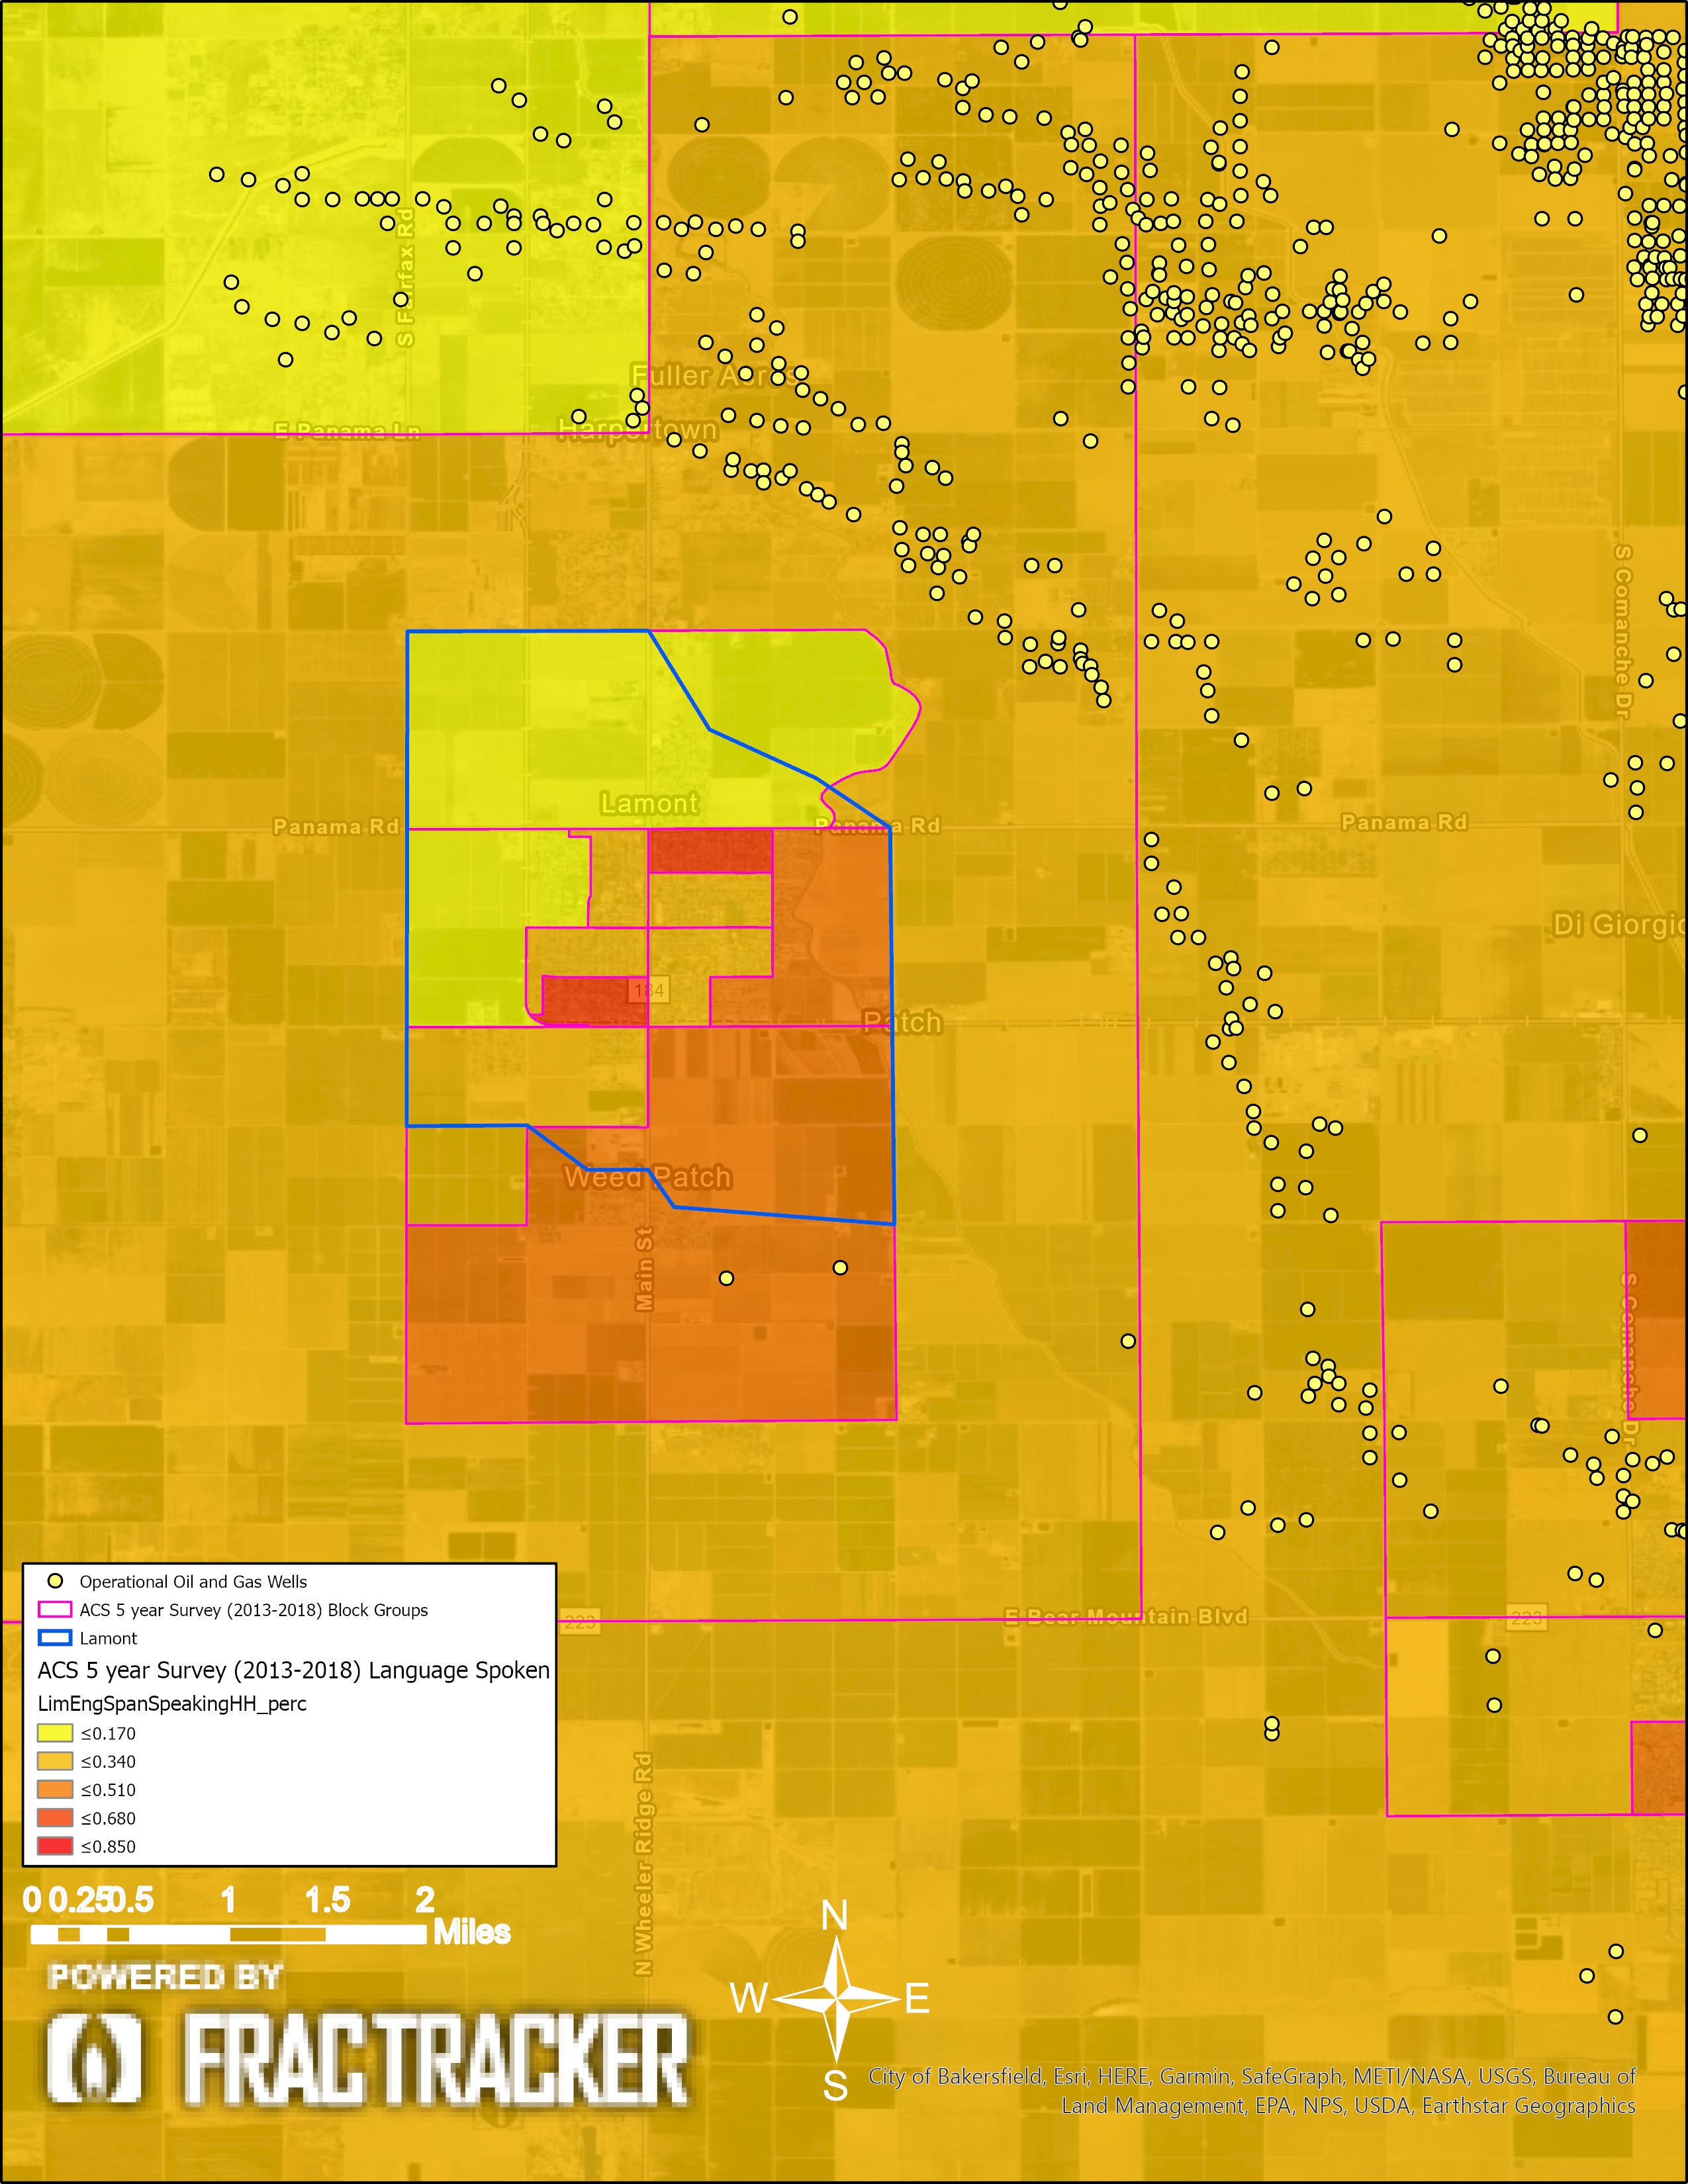
Figure 16. Lamont Limited English Spanish-speaking households: This map shows the percentage of the households that speak Spanish as their primary language, with limited English-speaking proficiency. In these maps, the ACS data is summarized in percentages of one, where, for example, light orange (<.400) refers to areas where 20% – 40% of the households are Spanish speaking and have limited English proficiency.
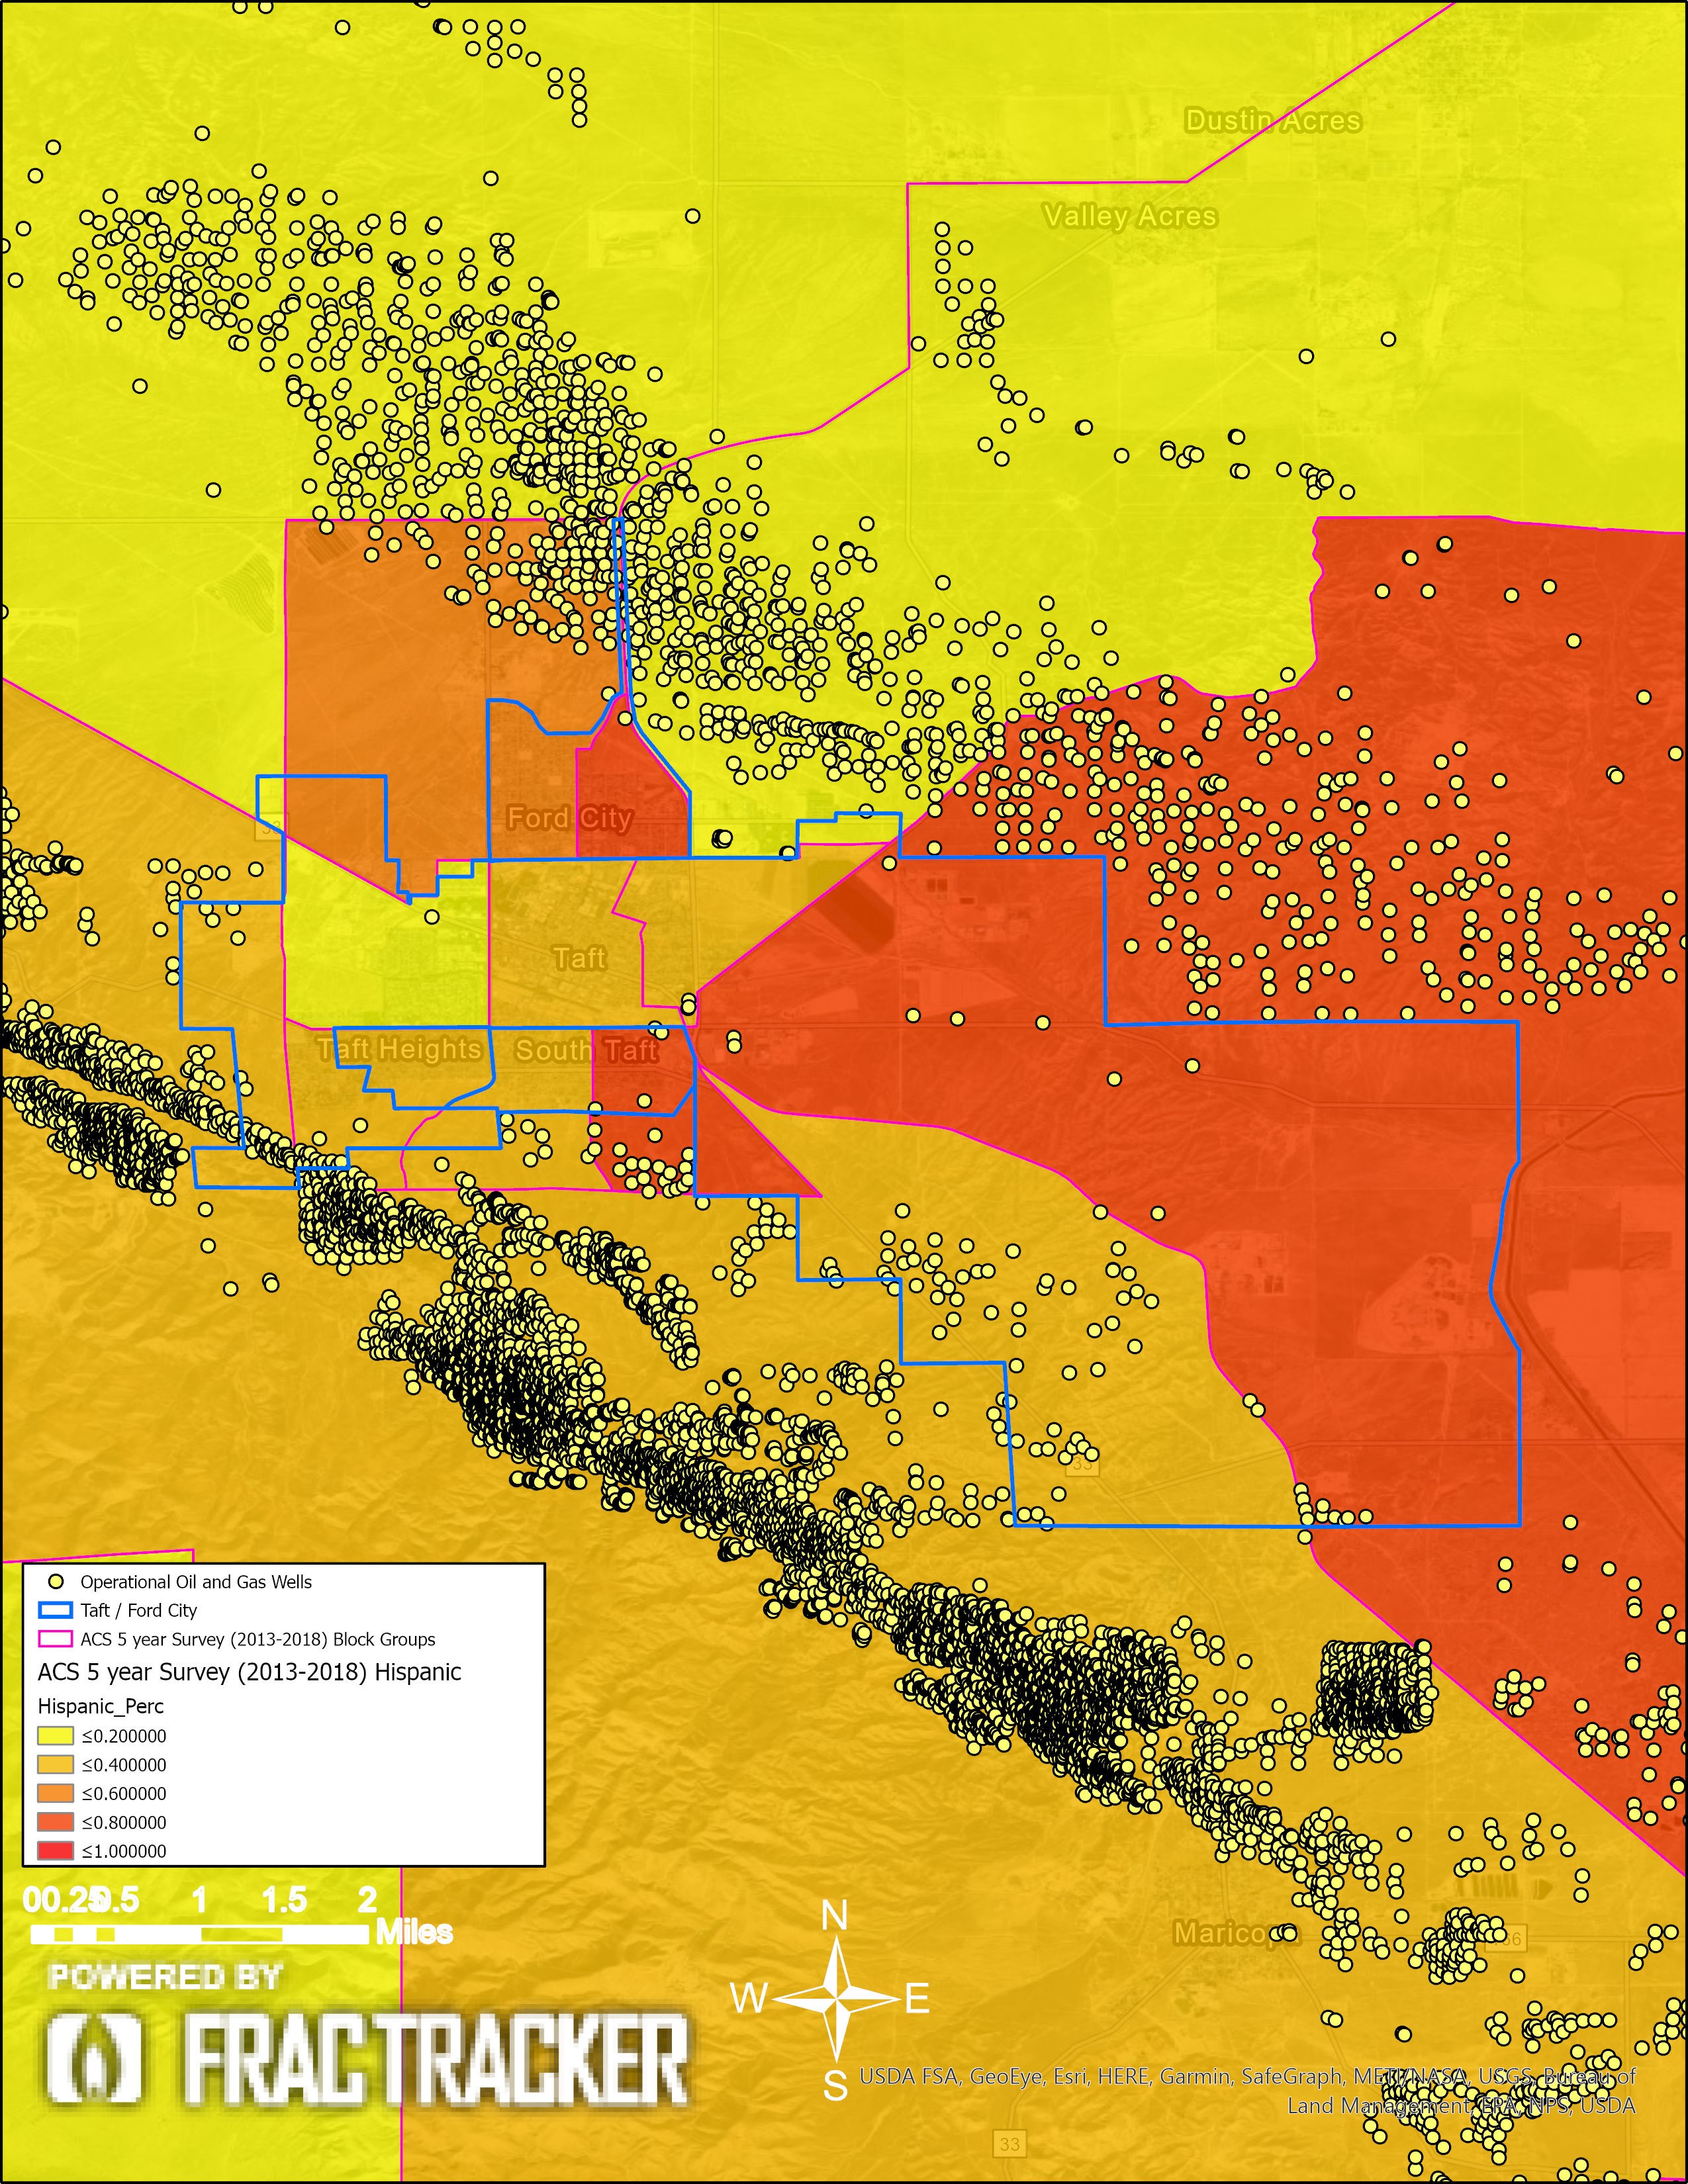
Figure 17. Taft Hispanic population demographics: The map shows the Hispanic percentage of the population. In these maps the American Community Survey data is summarized in percentages of 1, where, for example, light orange (<.400) in the map below refers to areas where 20%-40% of the populations is Hispanic.
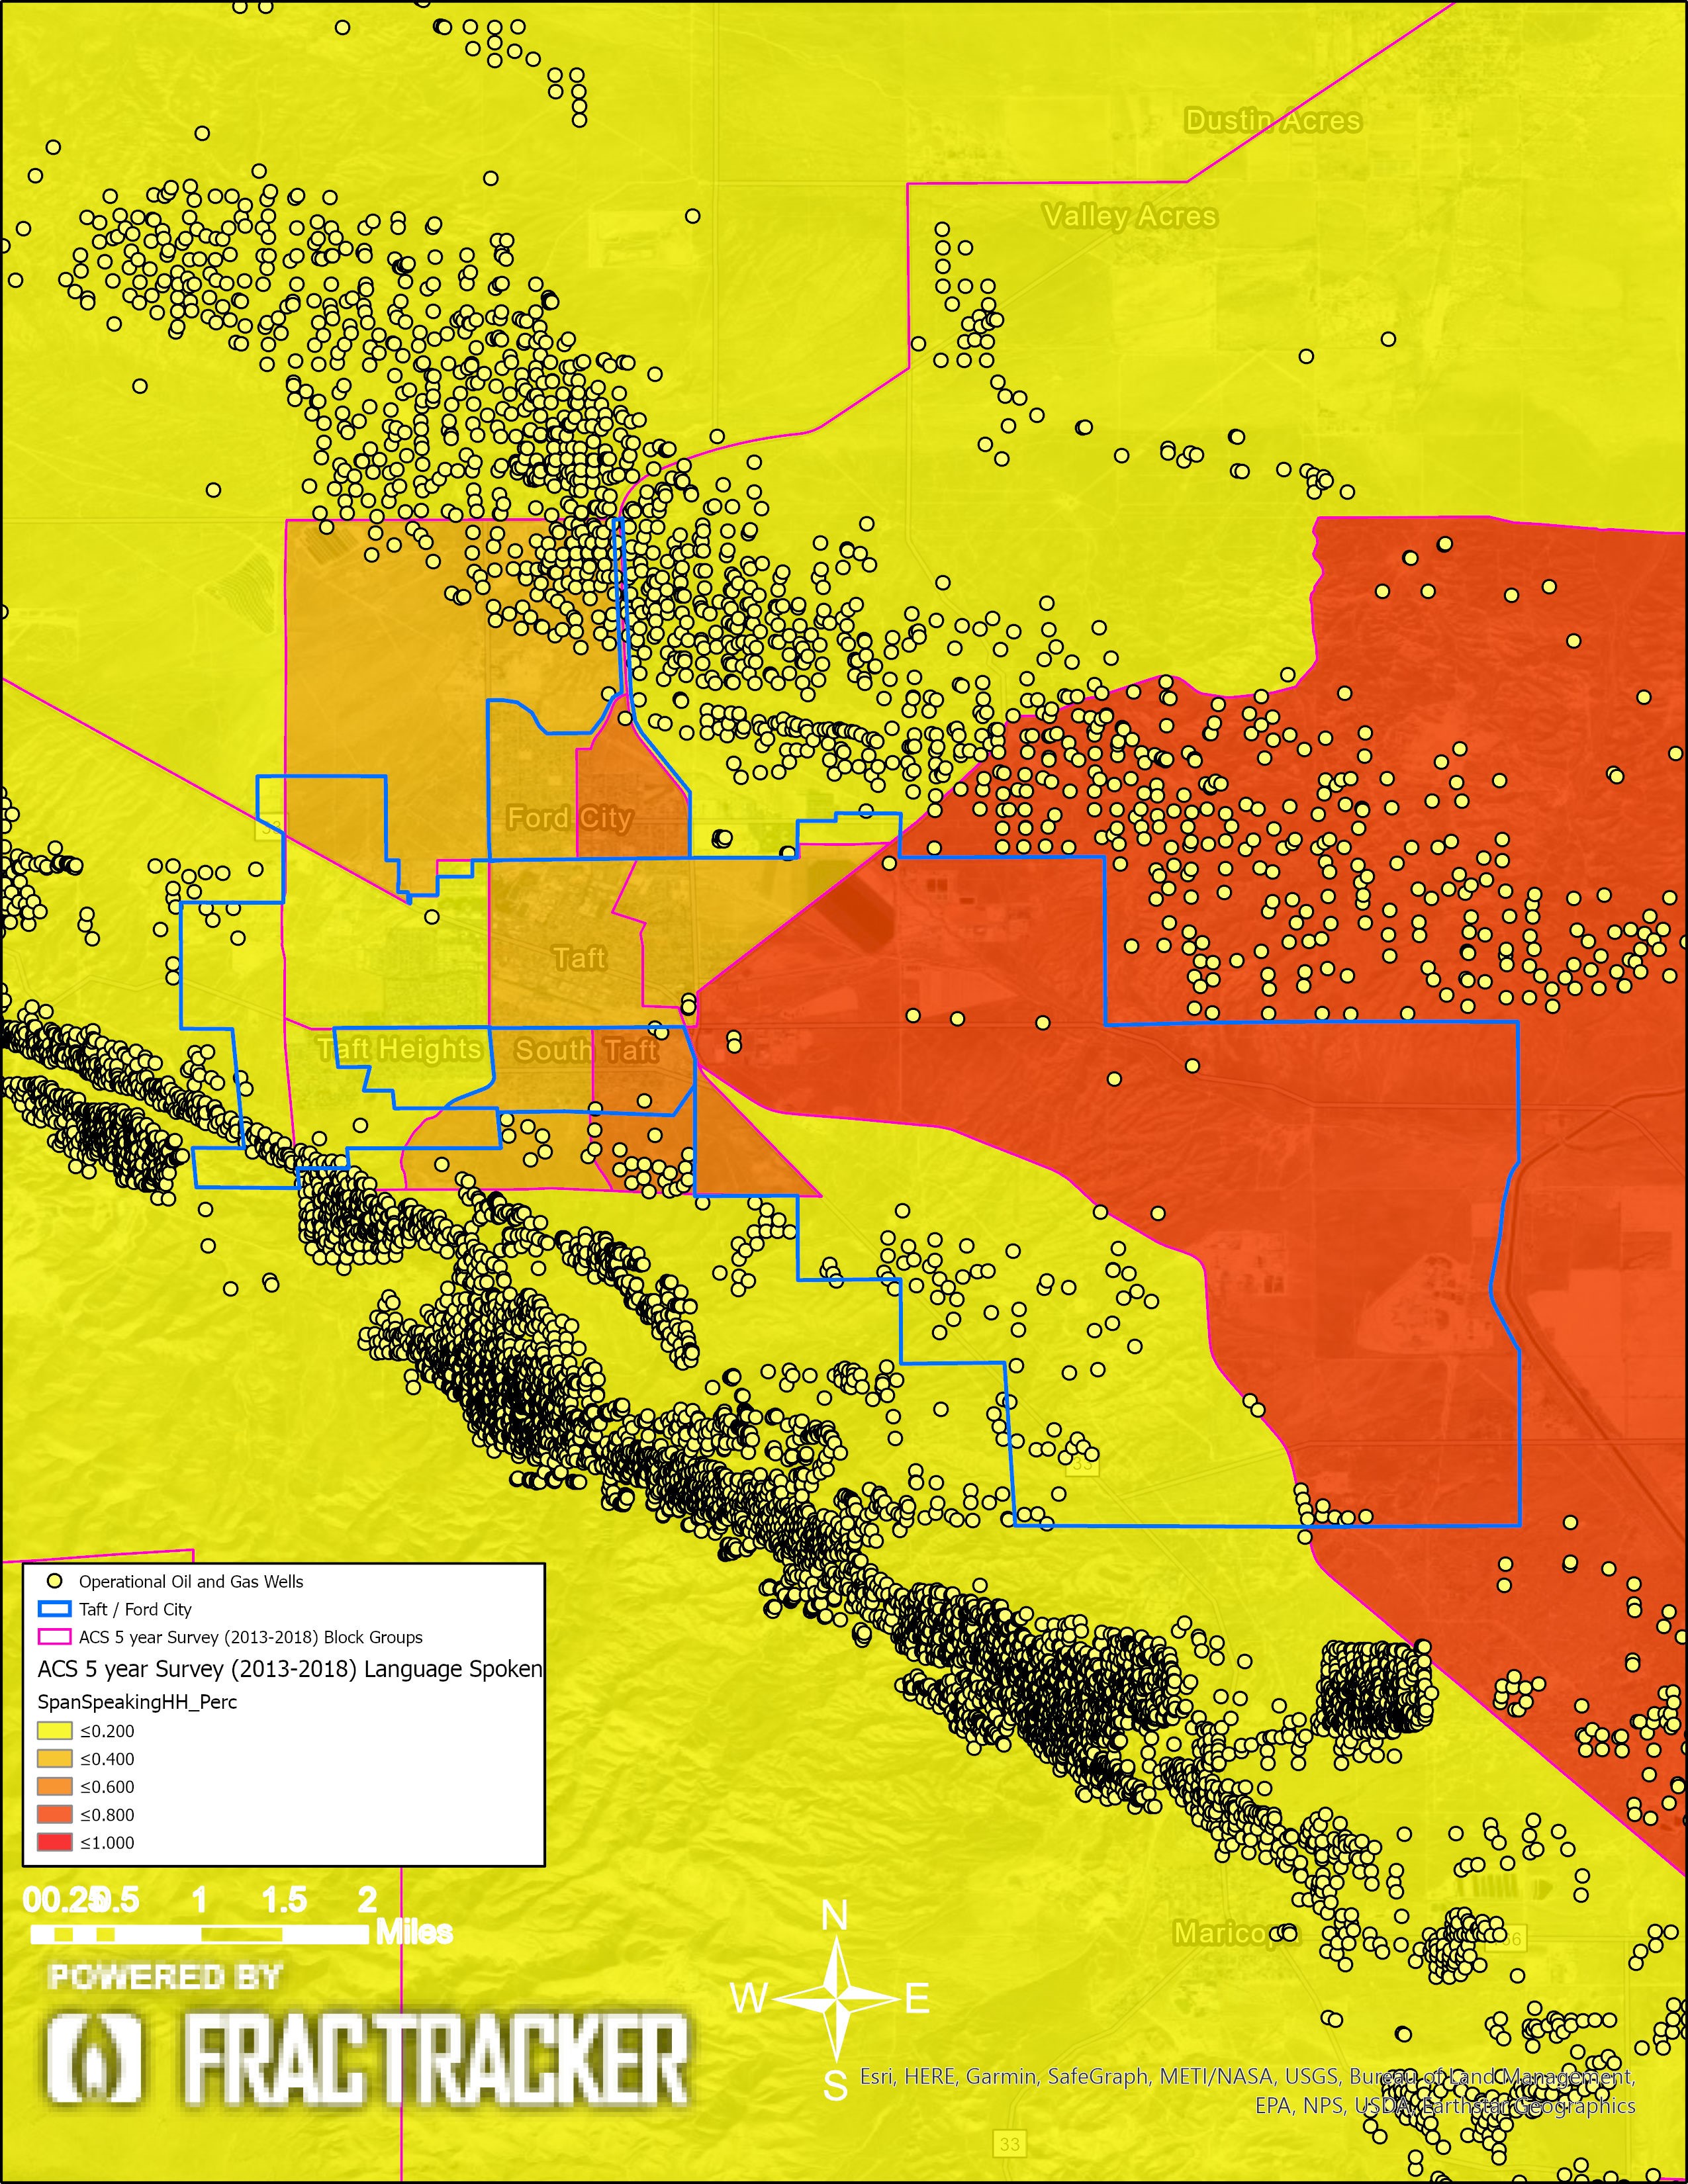
Figure 18. Taft Spanish-speaking households: This map shows the percentage of the households that speak Spanish as their primary language. In these maps, the ACS data is summarized in percentages of one, where, for example, light orange (<.400) refers to areas where 20% – 40% of the households are Spanish speaking.
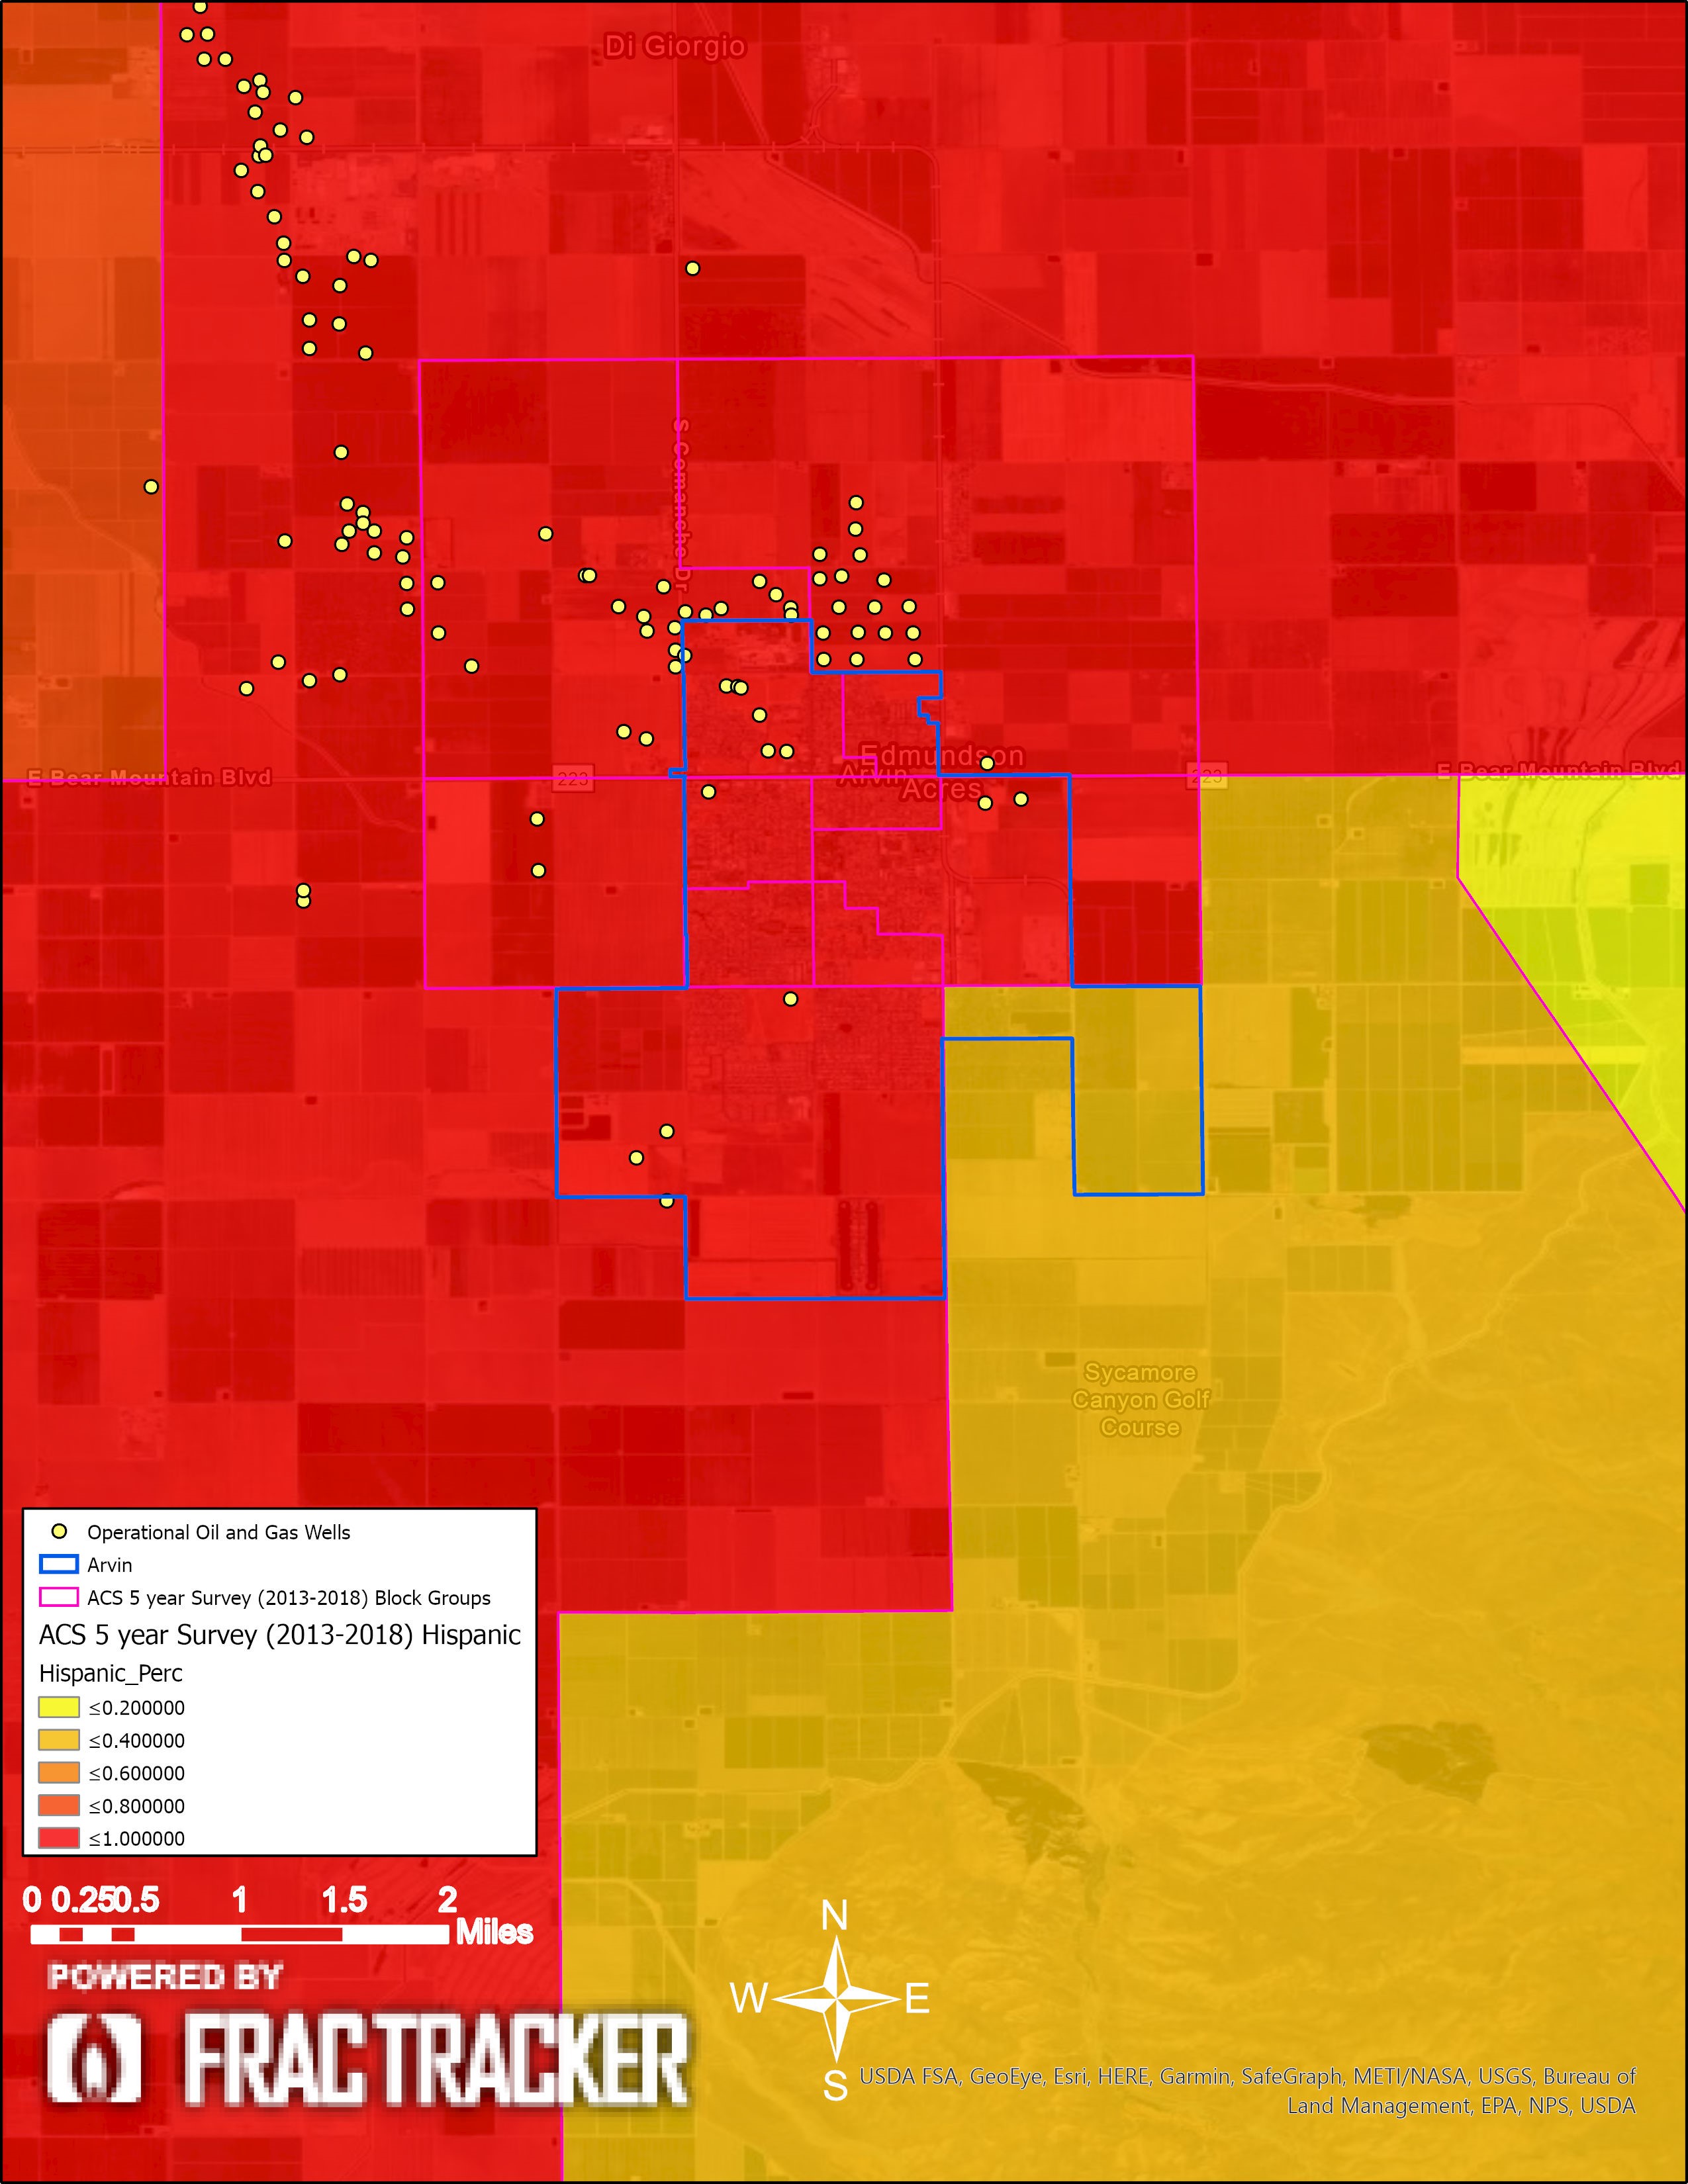
Figure 19. Arvin Hispanic population demographics: This map shows the Hispanic percentage of the population. In these maps, the ACS data is summarized in percentages of one, where, for example, light orange (<.400) refers to areas where 20% – 40% of the populations is Hispanic.
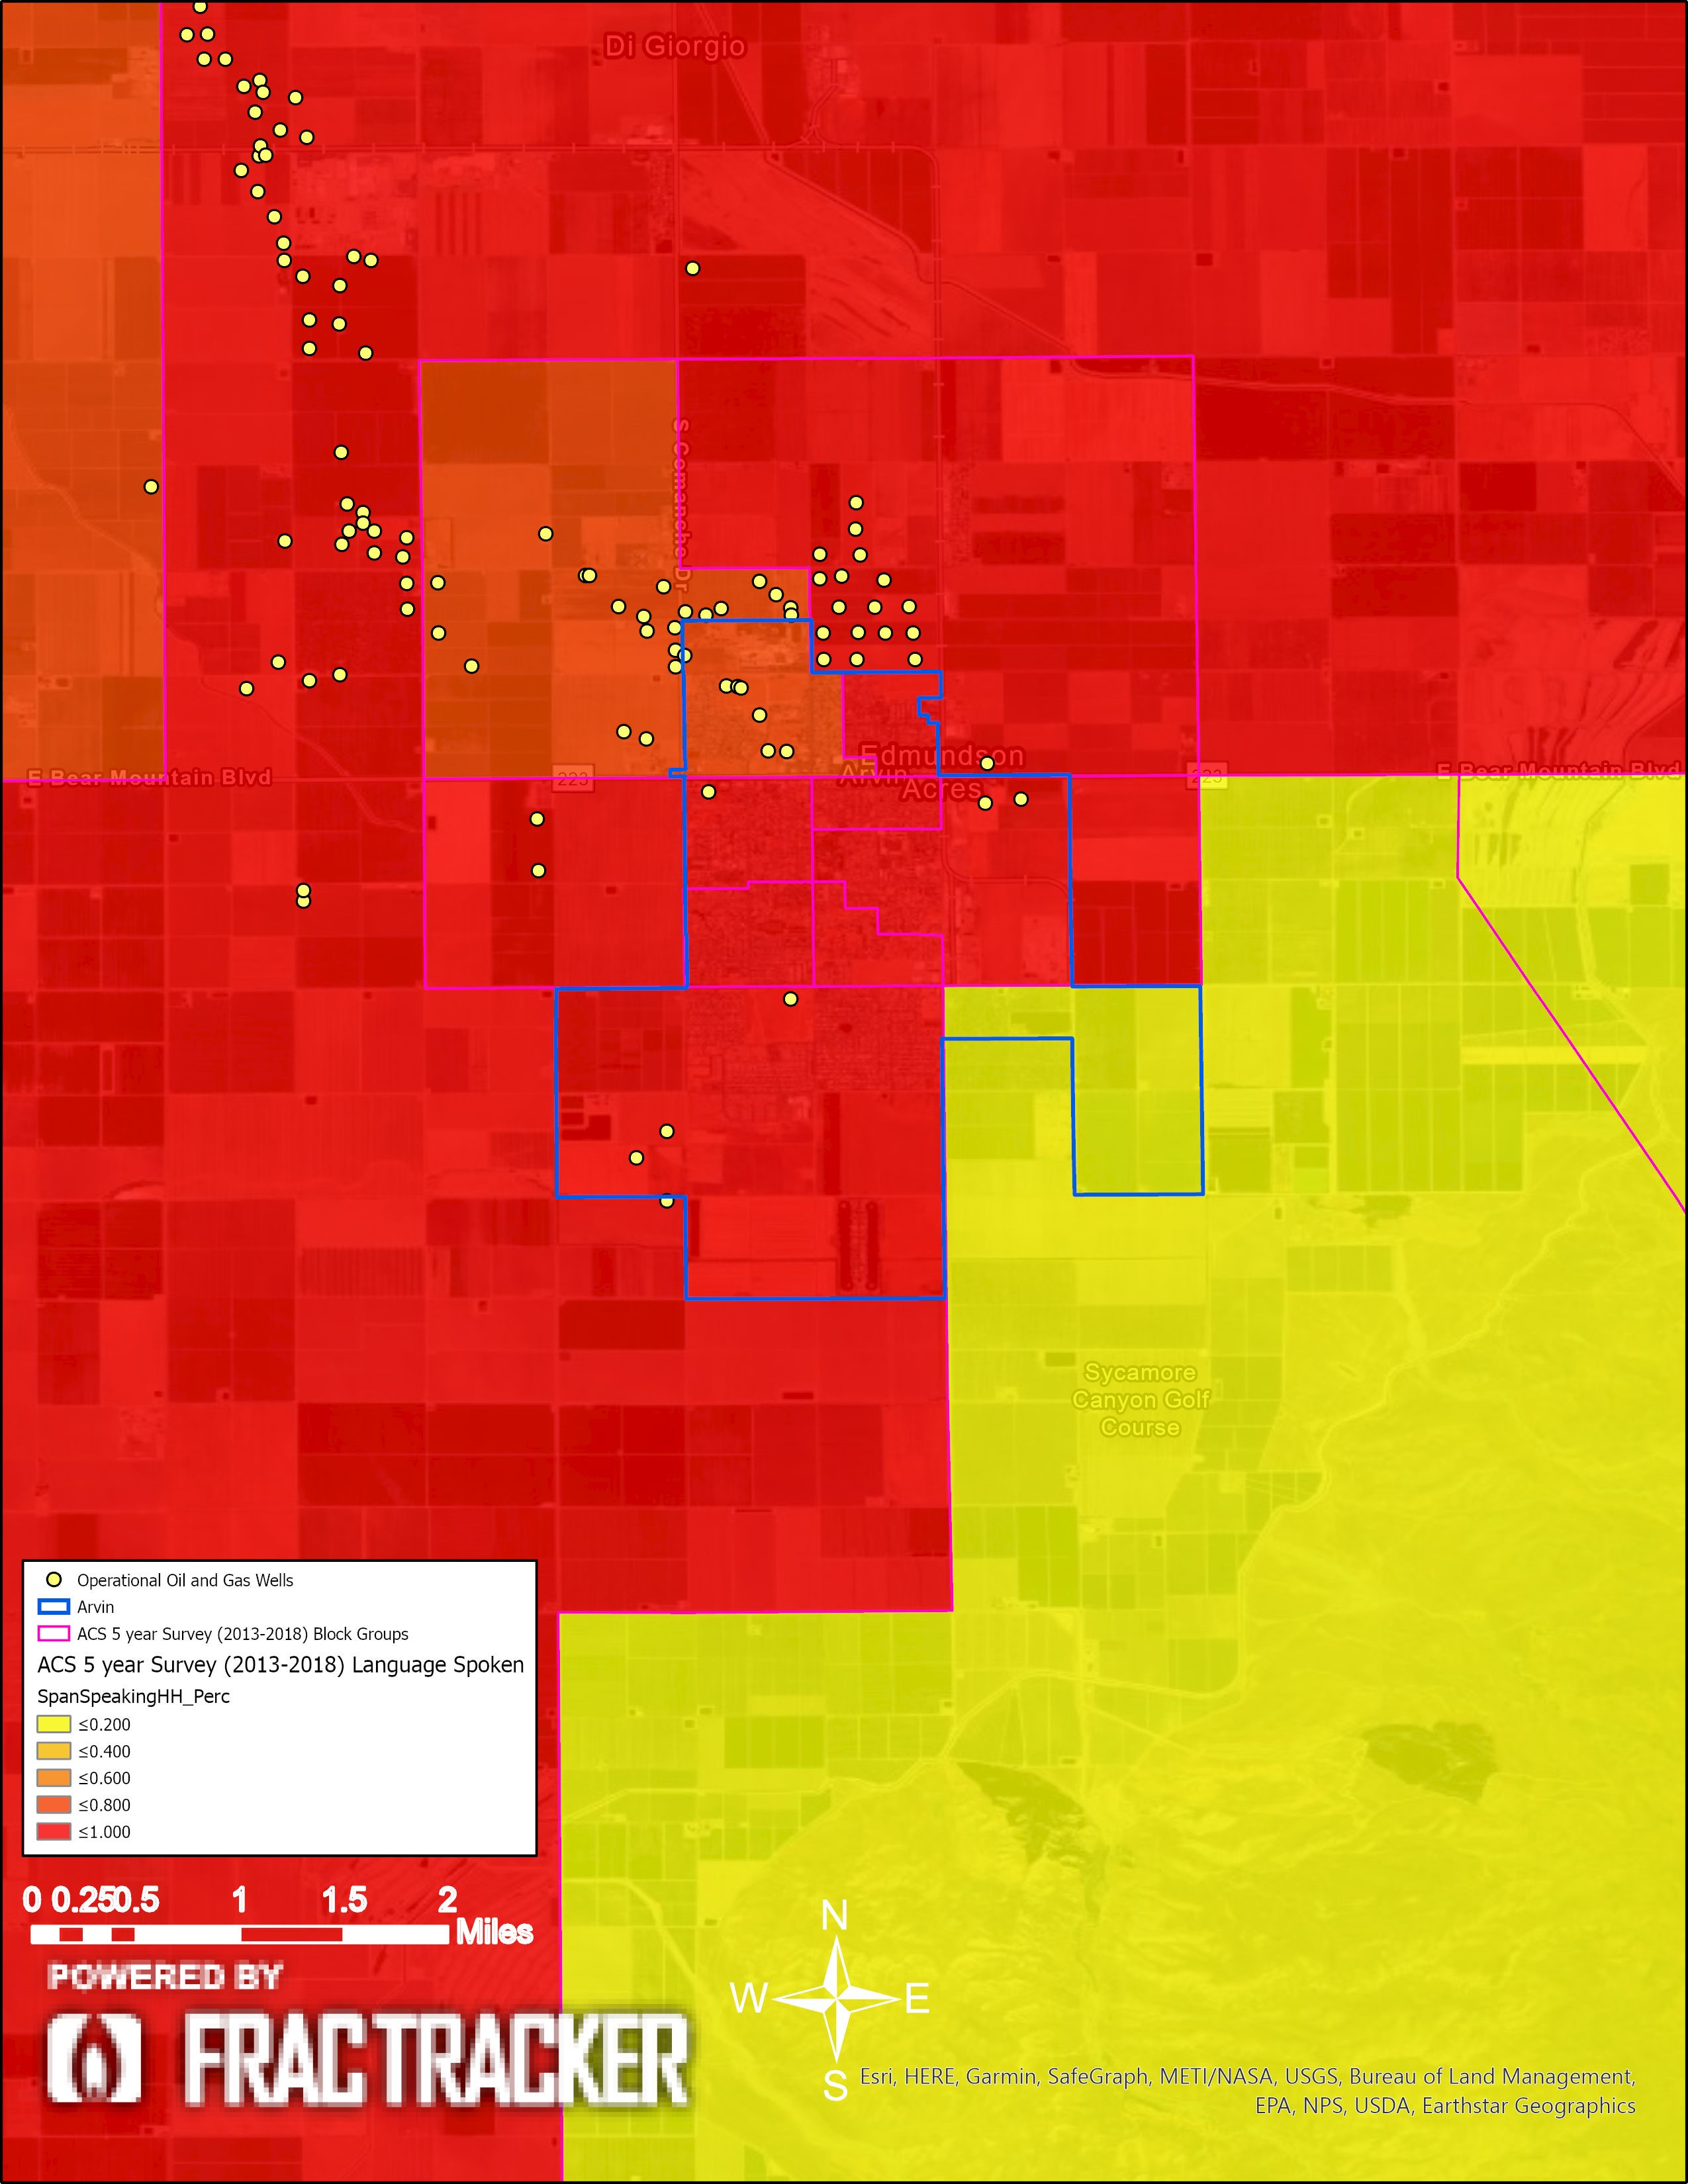
Figure 20. Arvin Spanish-speaking households: This map shows the percentage of the households that speak Spanish as their primary language. In these maps, the ACS data is summarized in percentages of one, where, for example, light orange (<.400) refers to areas where 20% – 40% of the households are Spanish speaking.
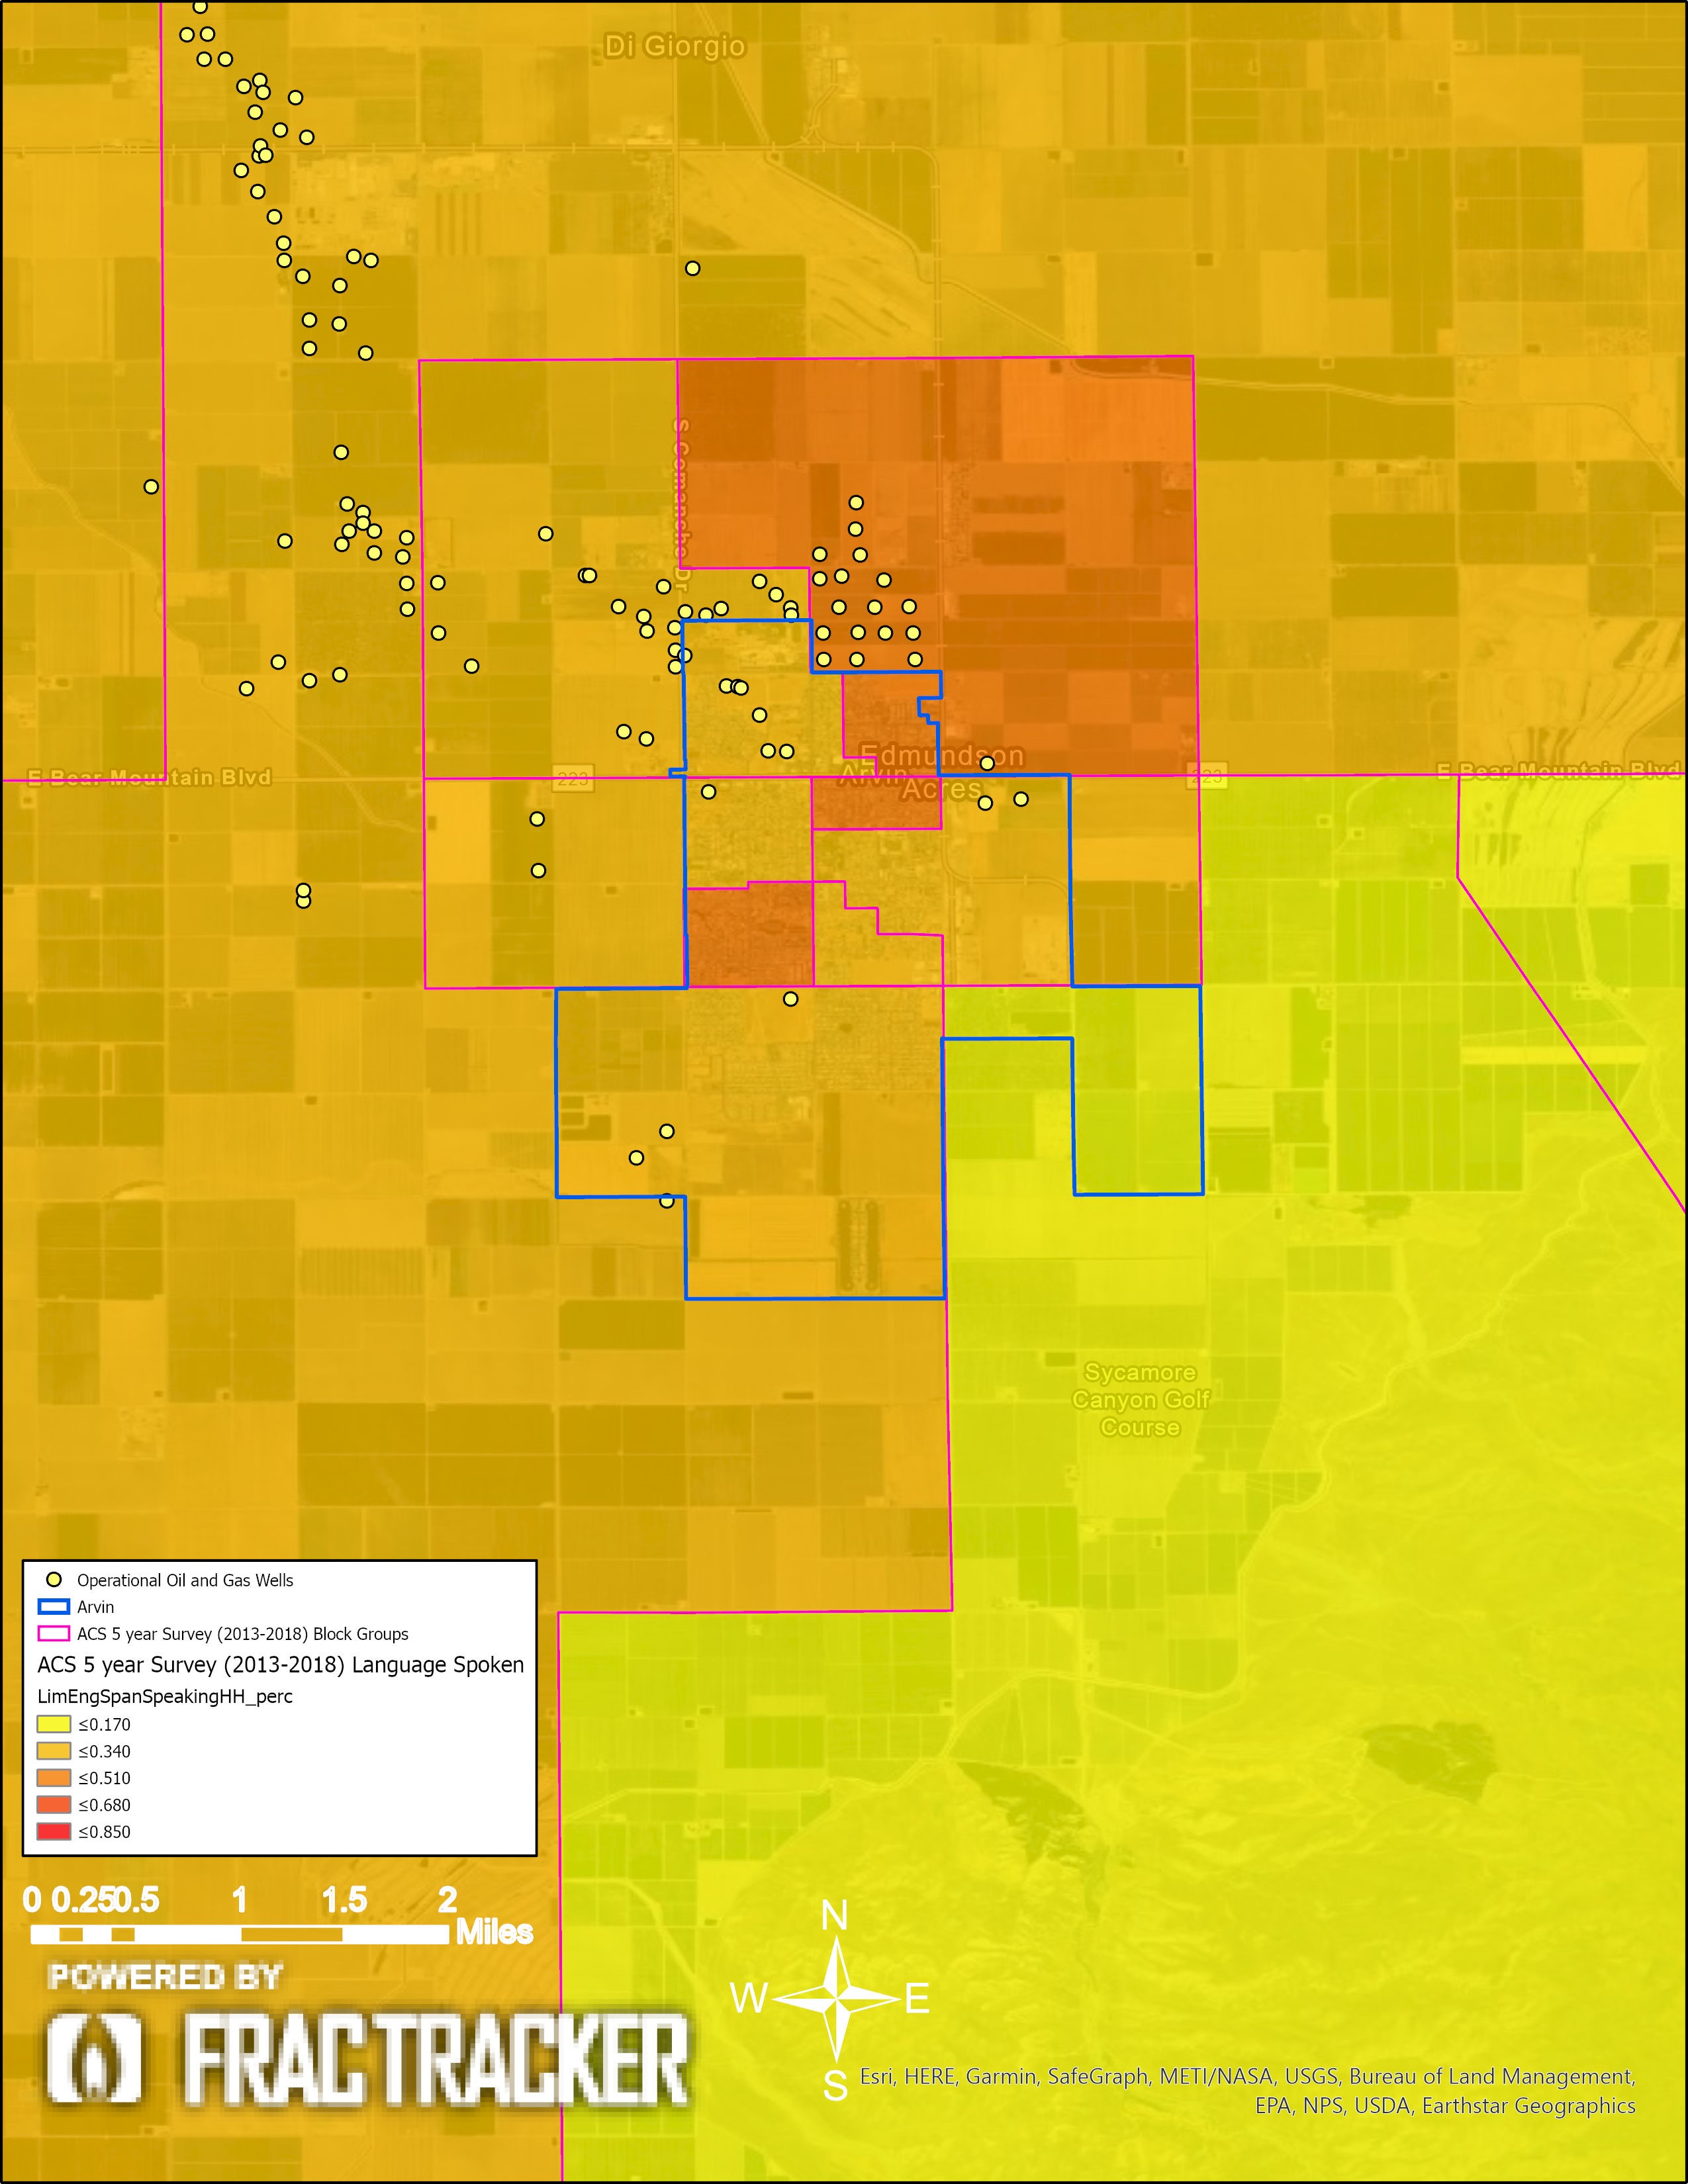
Figure 21. Arvin Limited English Spanish-speaking households: This map shows the percentage of the households that speak Spanish as their primary language, with limited English-speaking proficiency. In these maps, the ACS data is summarized in percentages of one, where, for example, light orange (<.400) refers to areas where 20% – 40% of the households are Spanish speaking, with limited English proficiency.
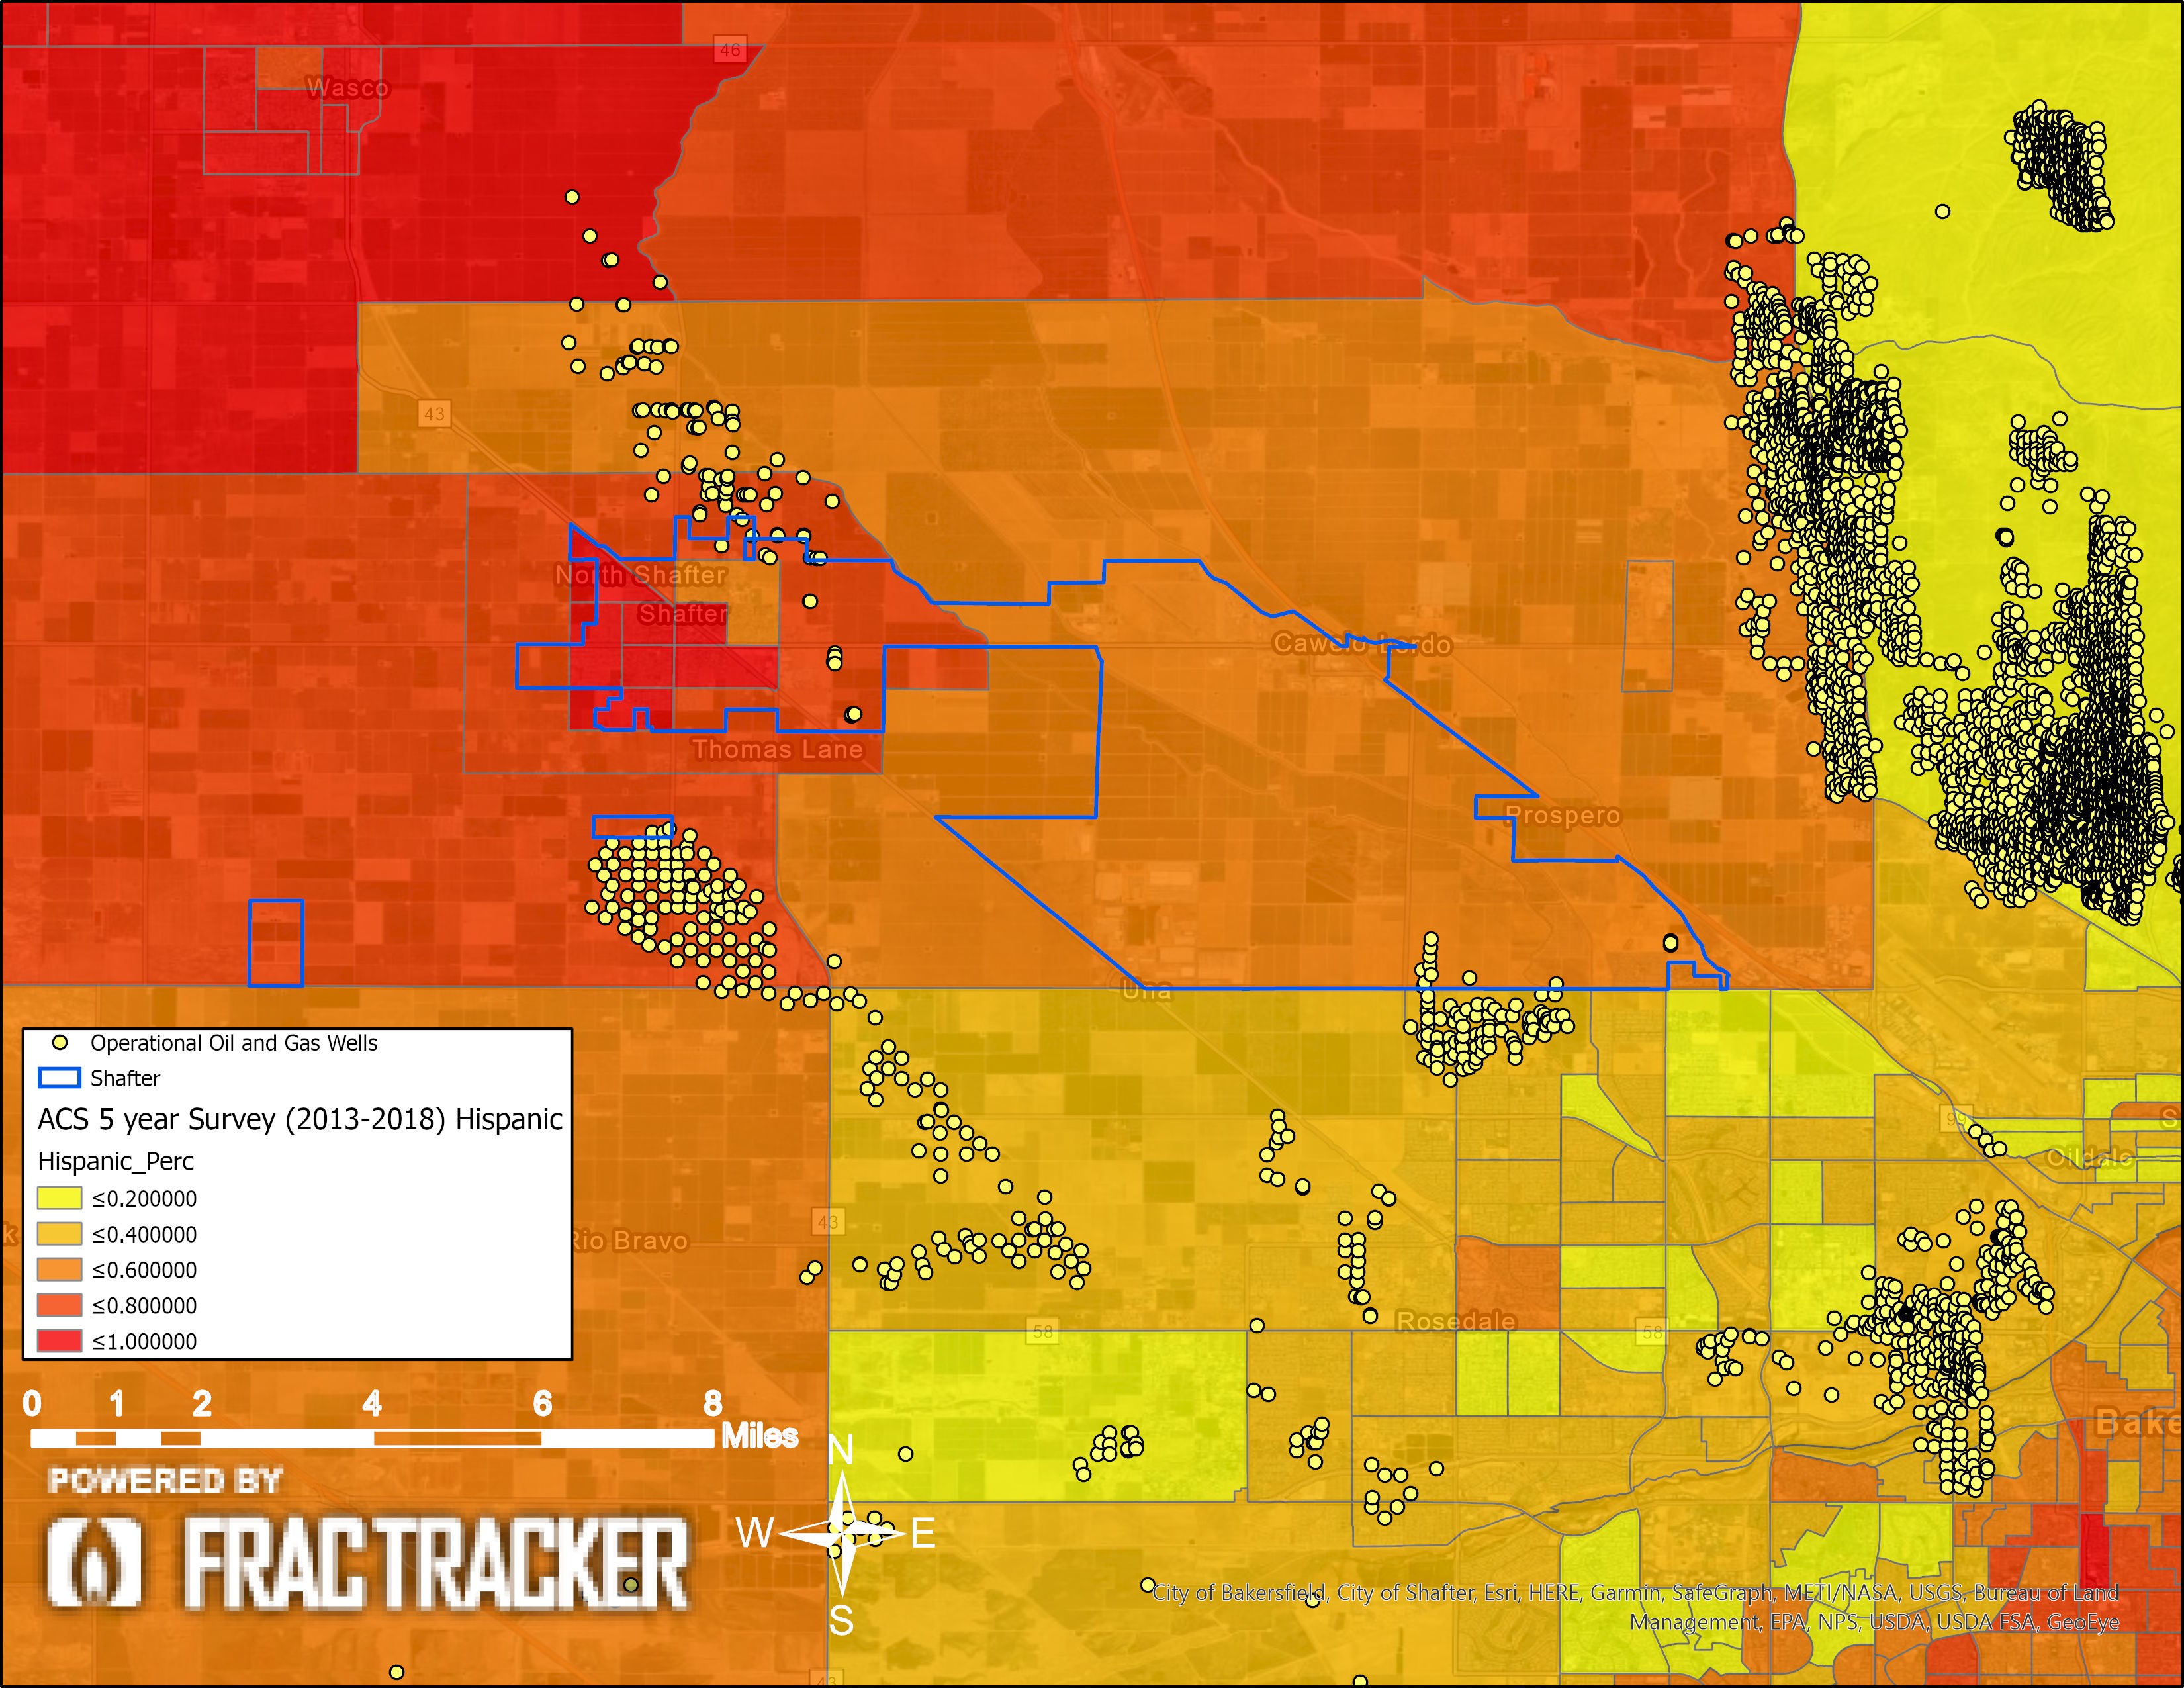
Figure 22. Shafter Hispanic population demographics: This map shows the Hispanic percentage of the population. In these maps, the ACS data is summarized in percentages of one, where, for example, light orange (<.400) refers to areas where 20% – 40% of the populations is Hispanic.
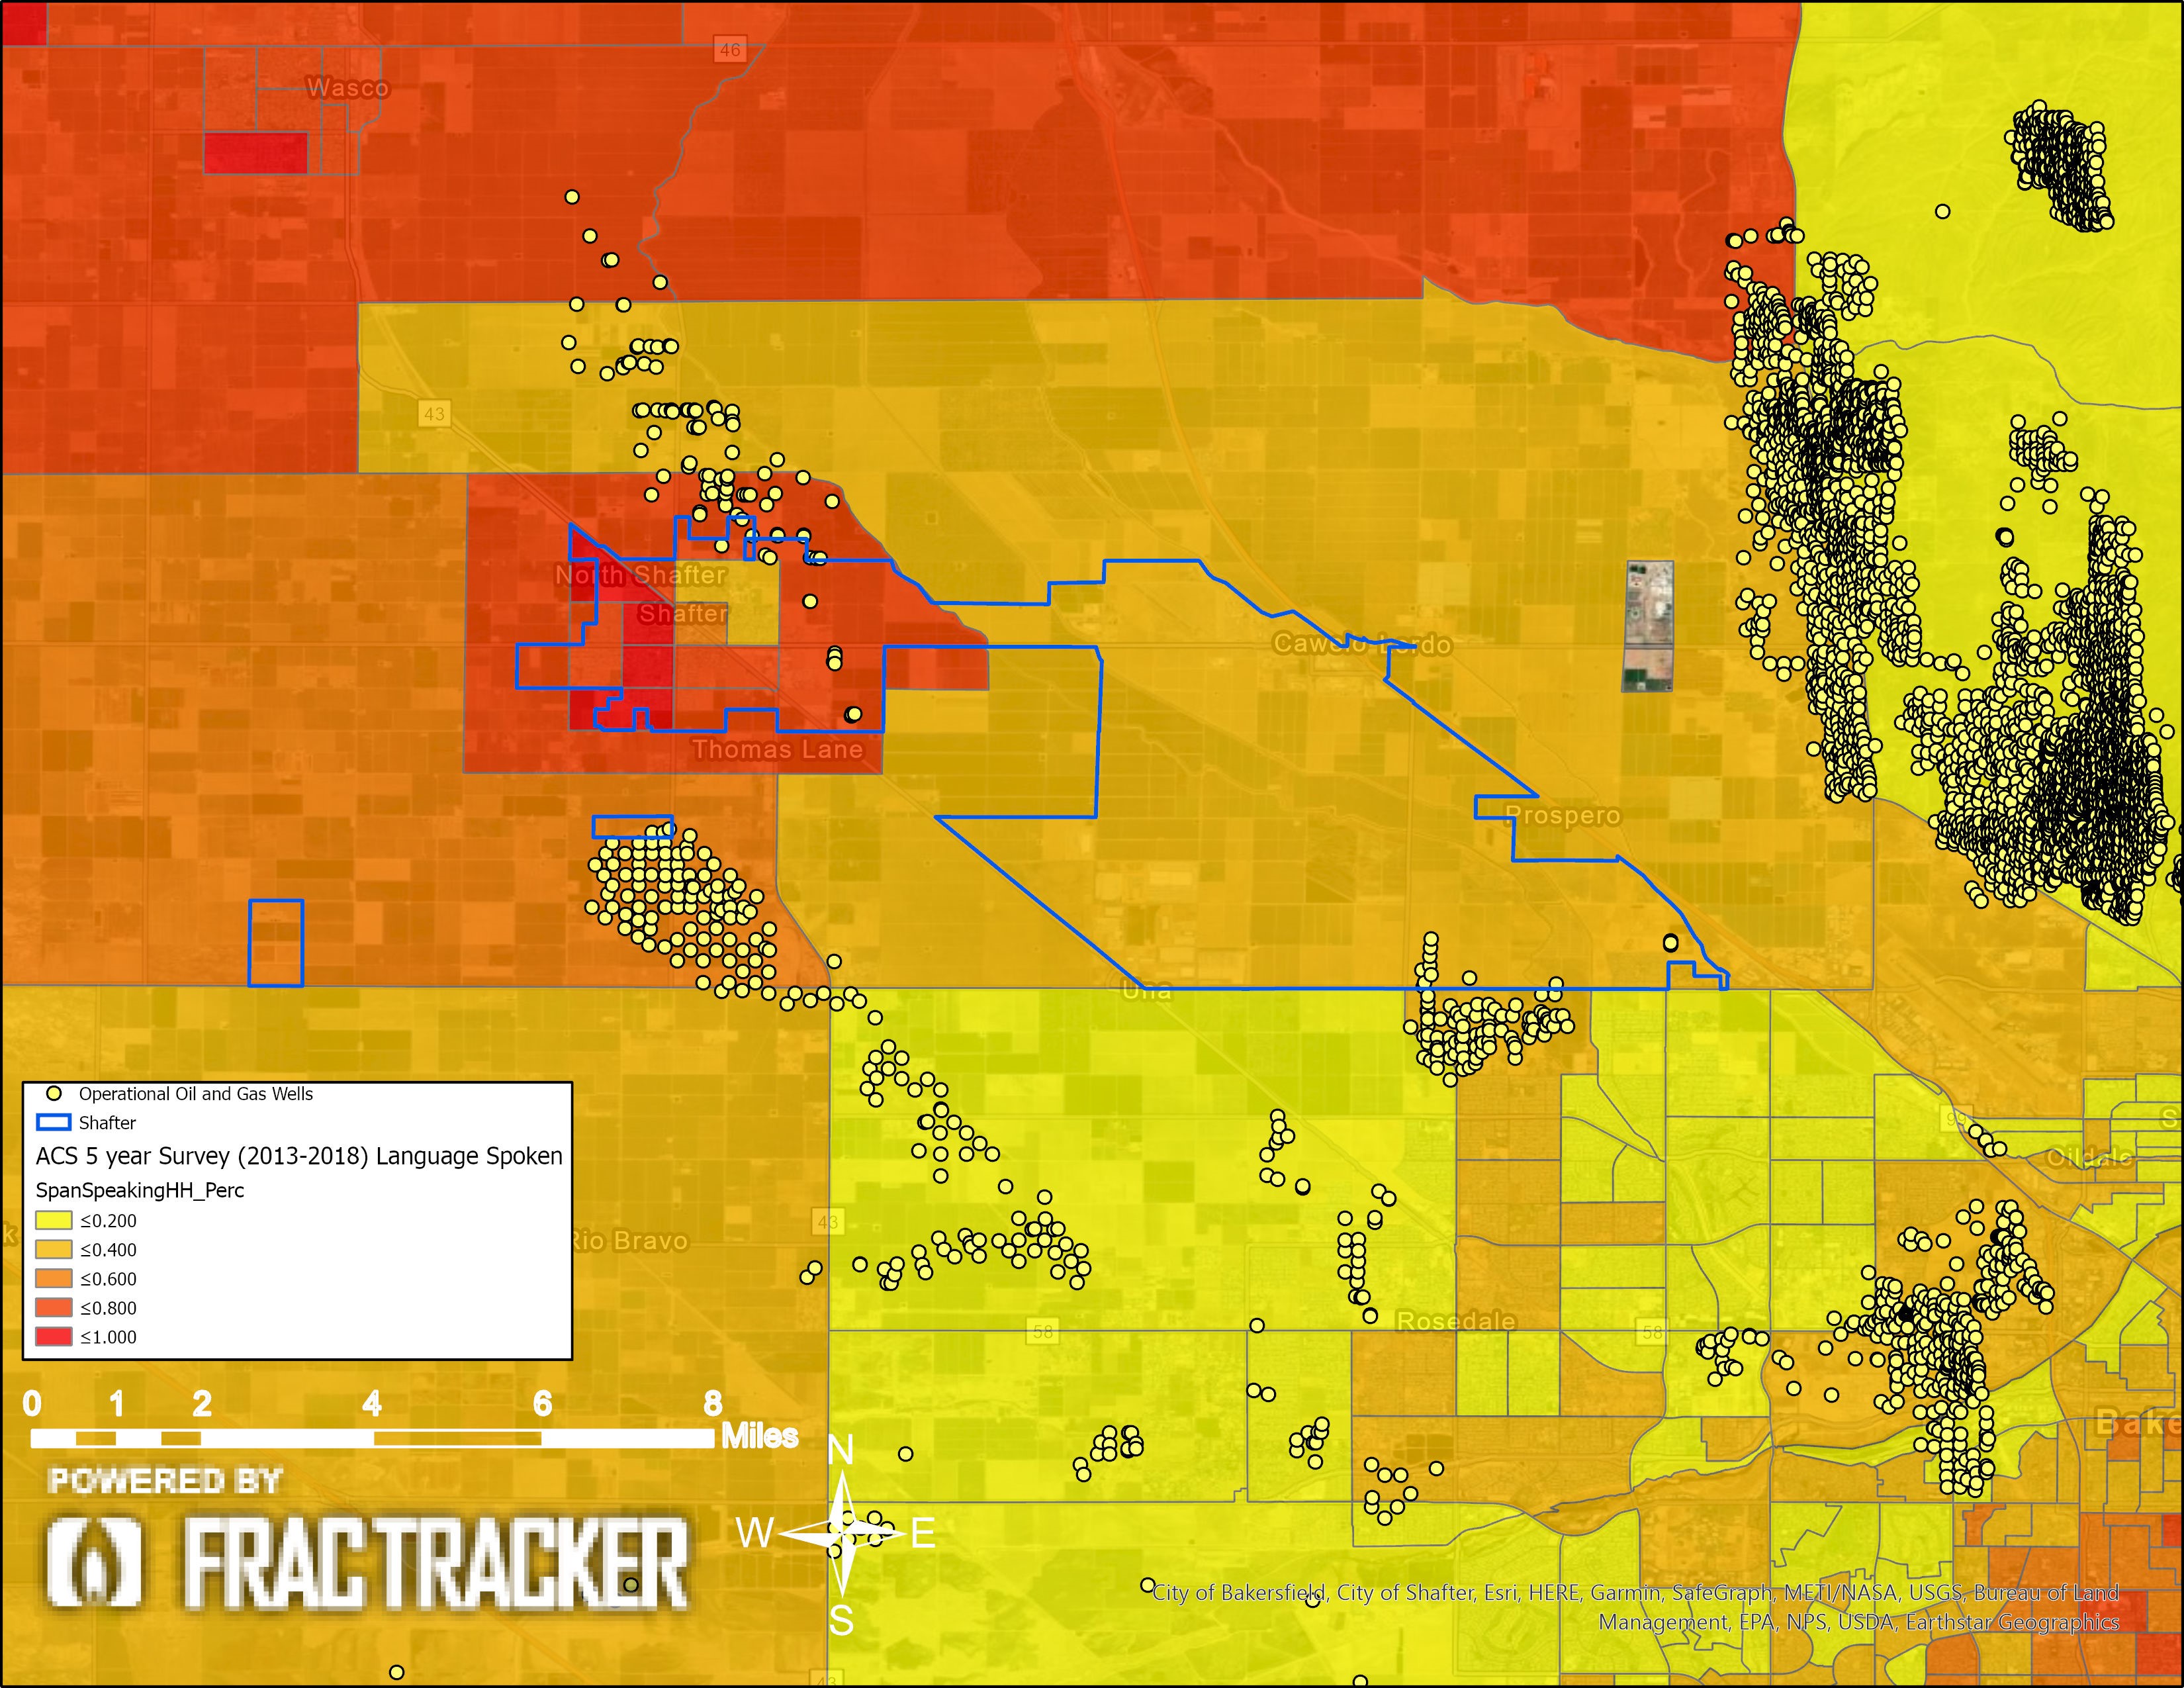
Figure 23. Shafter Spanish-speaking households: This map shows the percentage of the households that speak Spanish as their primary language. In these maps, the ACS data is summarized in percentages of one, where, for example, light orange (<.400) refers to areas where 20% – 40% of the households are Spanish speaking.
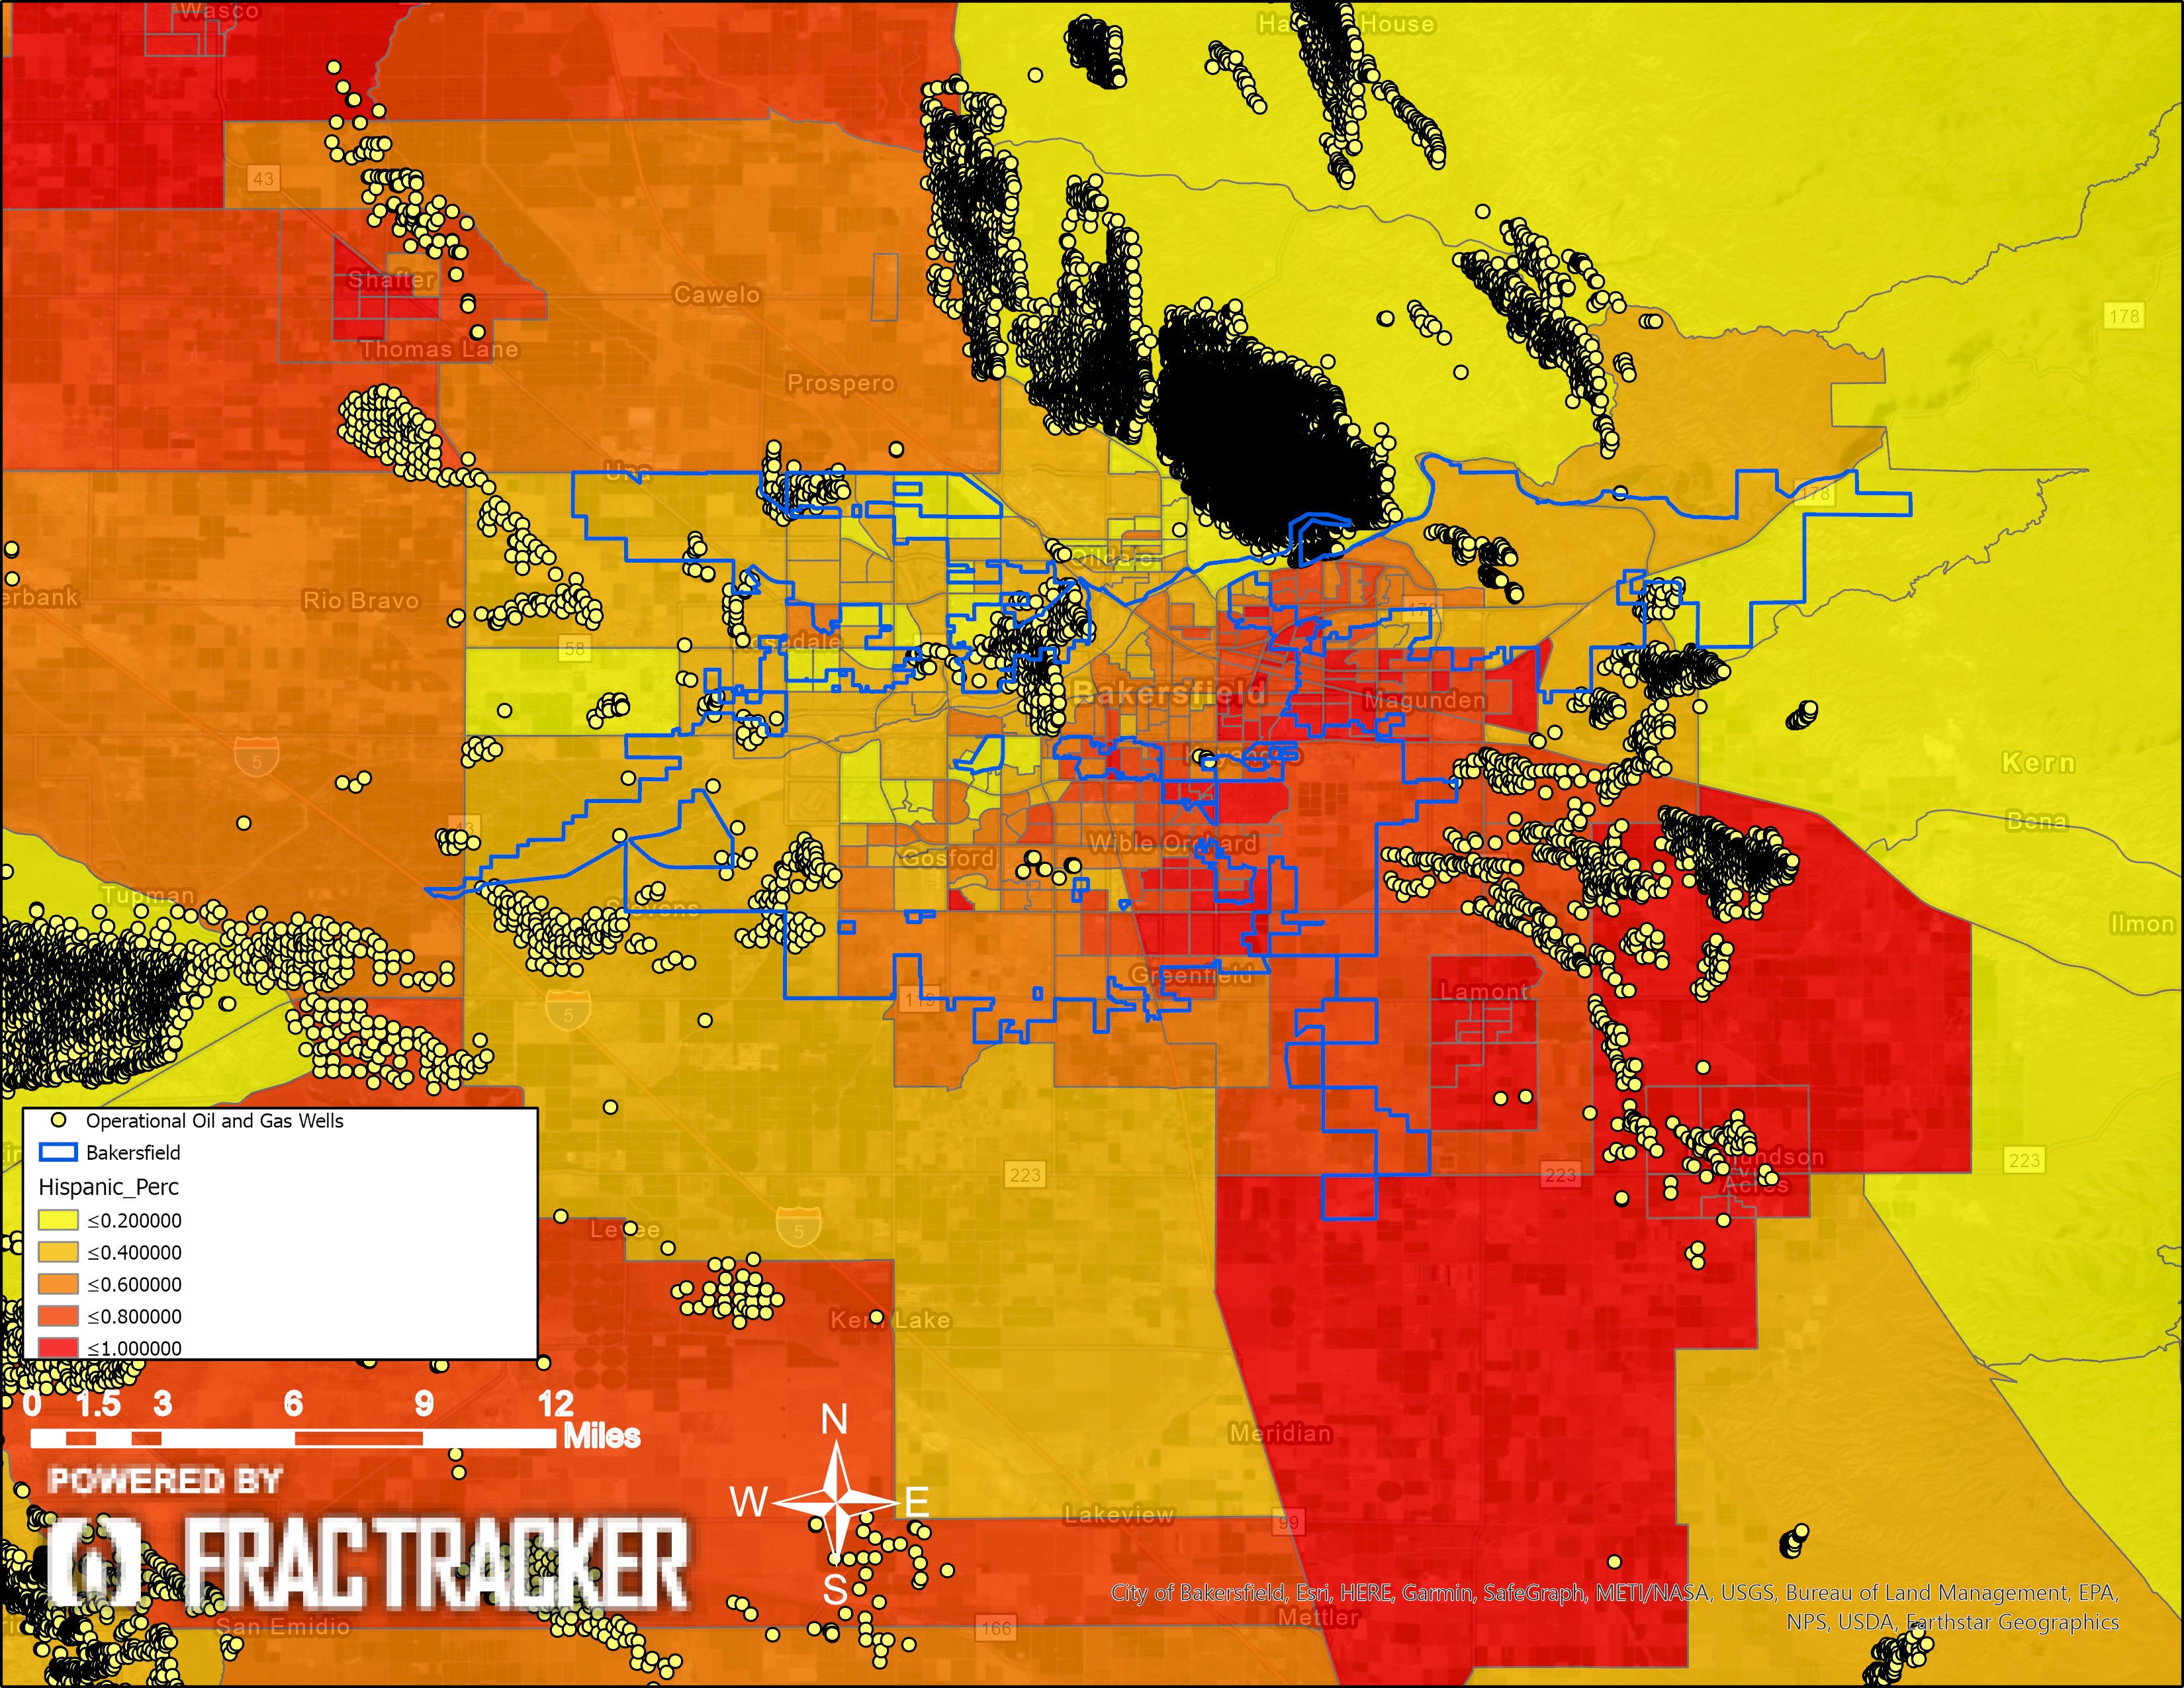
Figure 24. Bakersfield Hispanic population demographics: This map shows the Hispanic percentage of the population. In these maps, the ACS data is summarized in percentages of one, where, for example, light orange (<.400) refers to areas where 20% – 40% of the populations is Hispanic.
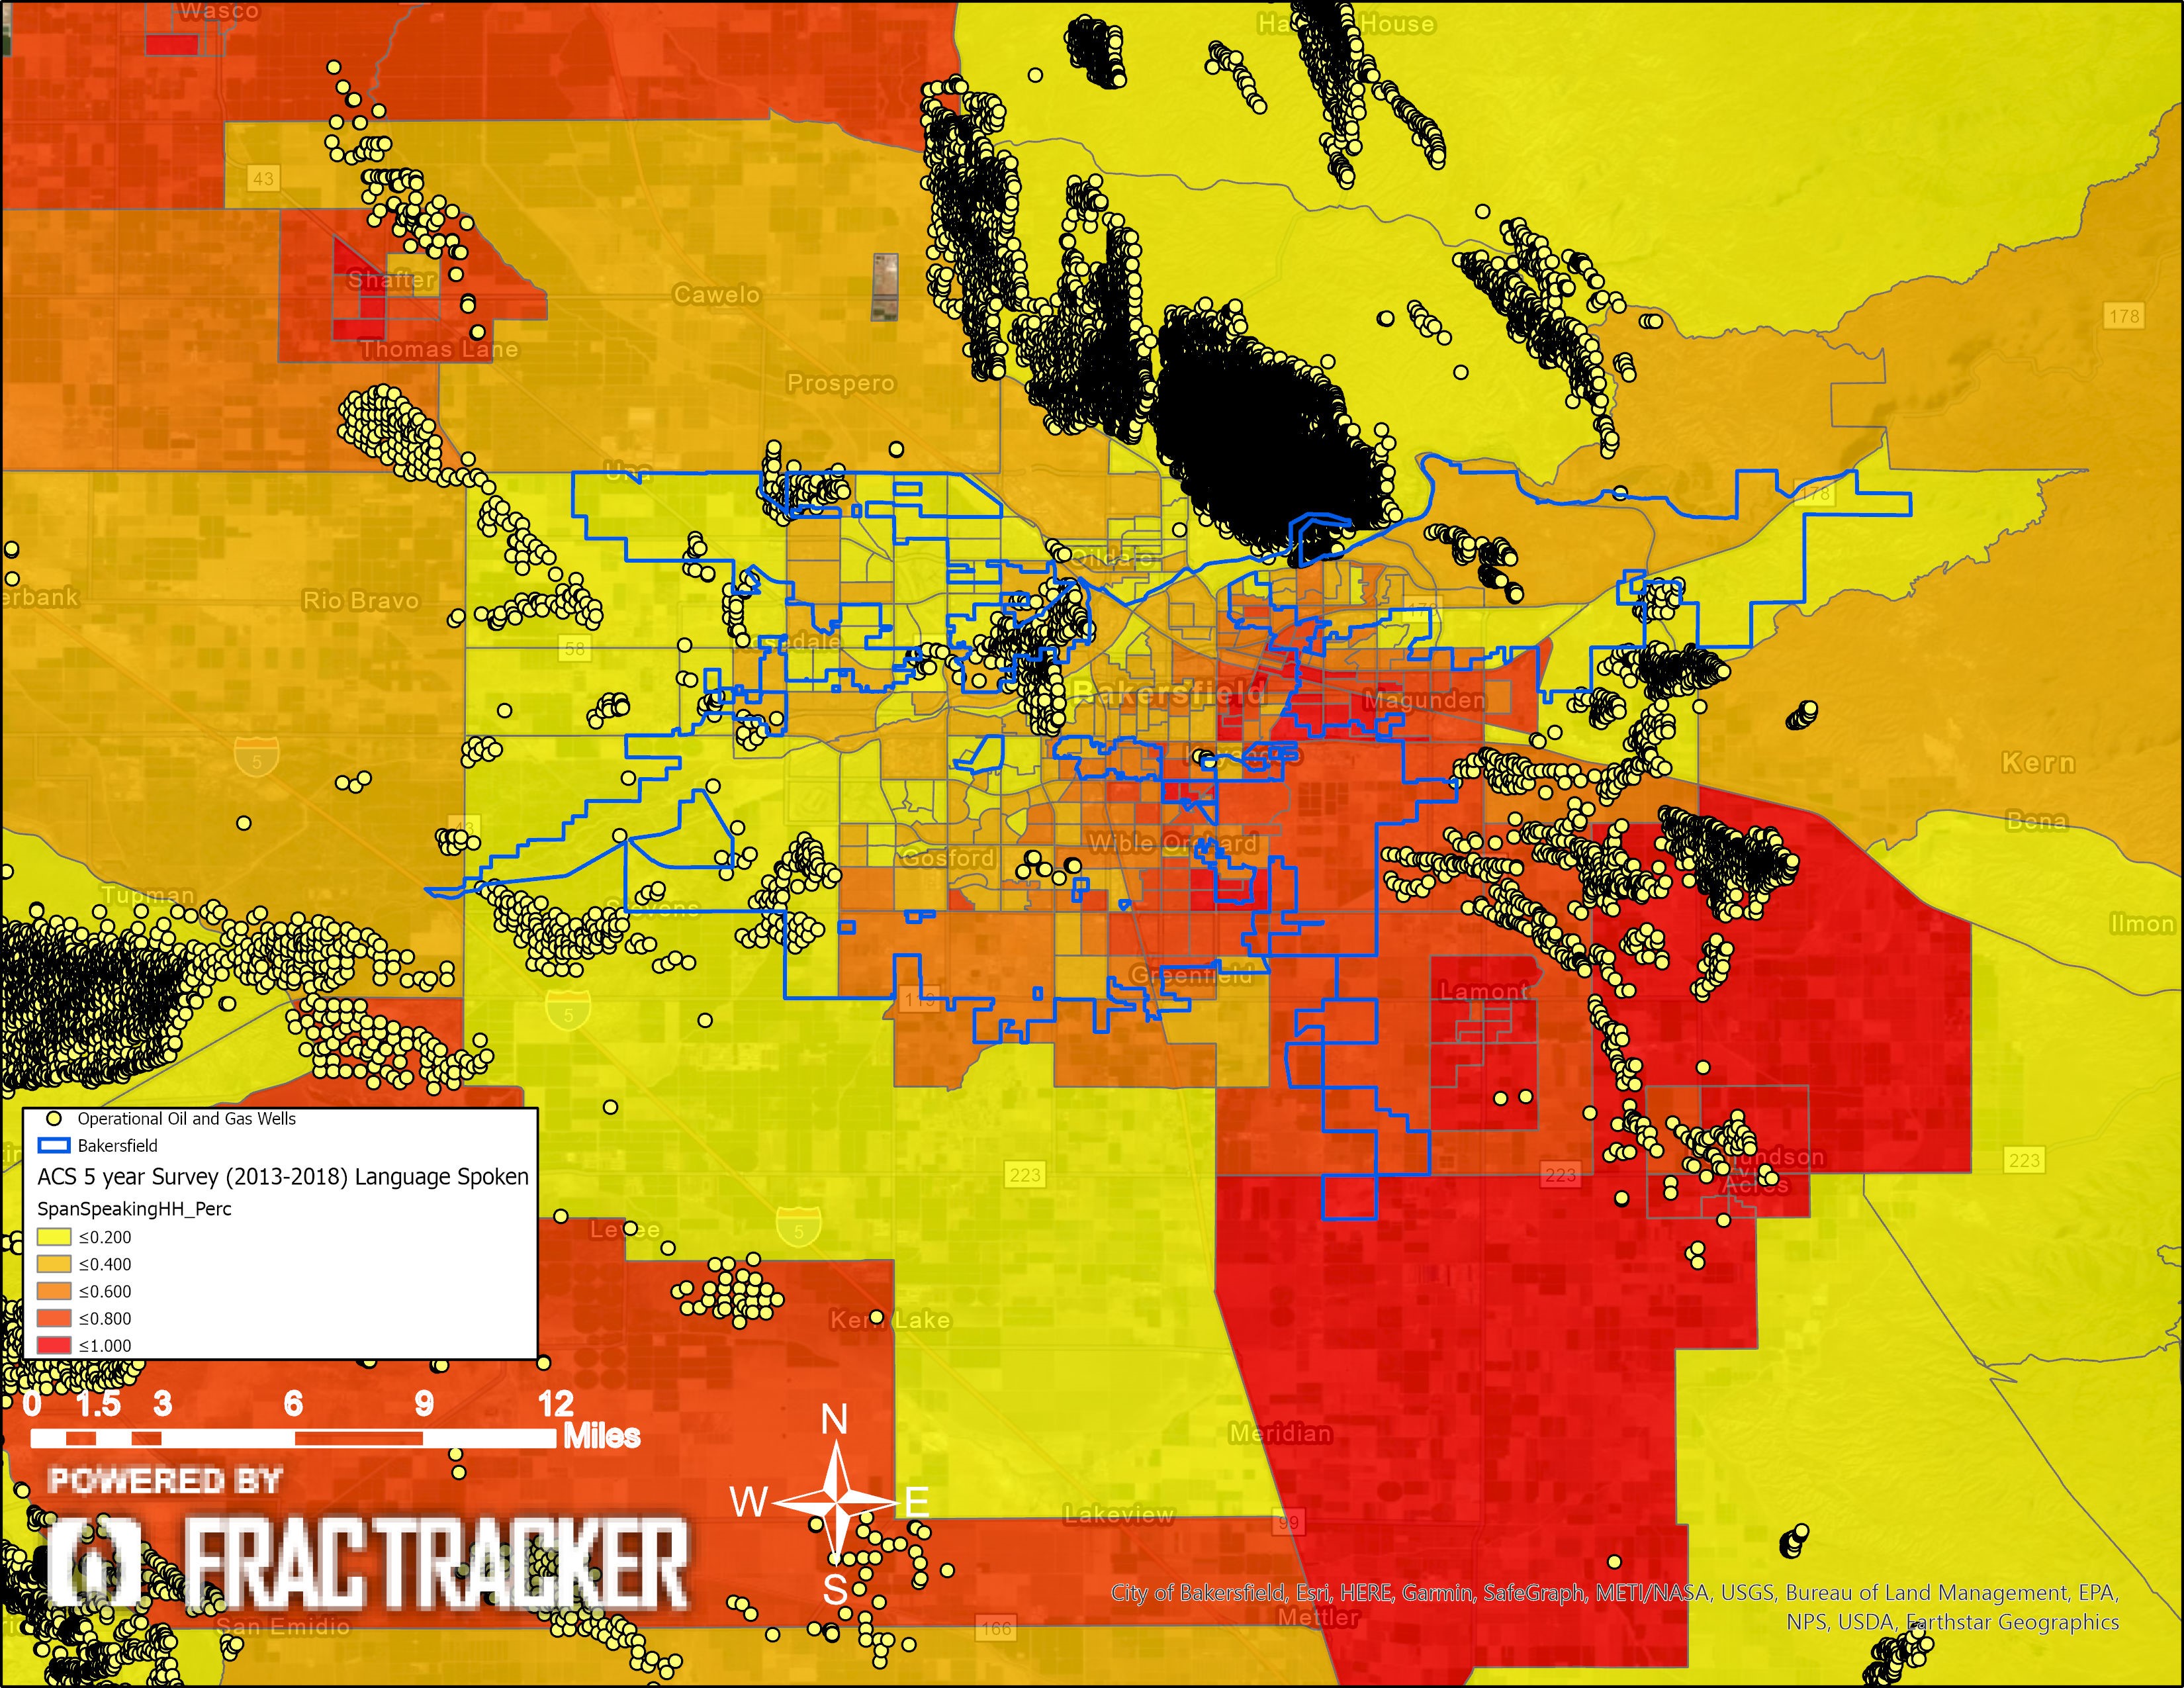
Figure 25. Bakersfield Spanish-speaking households: This map shows the percentage of the households that speak Spanish as their primary language. In these maps, the ACS data is summarized in percentages of one, where, for example, light orange (<.400) refers to areas where 20% – 40% of the households are Spanish speaking.
These maps make it visually clear that the Frontline Communities near oil and gas extraction in Kern County are largely disenfranchised from the democratic process, a direct result of California’s regulatory agencies refusing to provide notices and other important documents and information in Spanish. Additionally, these same communities have limited options, due to economic disparities that make Kern County’s Frontline Communities the poorest in the state of CA. These two factors leveraged against communities prevent them from obtaining self-governance or autonomy over the industrialization occurring in and around their neighborhoods. Furthermore, the demarcations of census boundaries splitting the incorporated and unincorporated cities are essentially gerrymandered to disguise the blatant environmental inequities that exist in Kern County, in direct violation of the California Environmental Quality Act. Kern County must consider these injustices in the development of new environmental impact review requirements for oil and gas operators.
By Kyle Ferrar, Western Program Coordinator, FracTracker Alliance
This report was revised on 12/13/20
The following addendum incorporates additional demographics data that more thoroughly describes Frontline Communities in Kern County. We focus on the Frontline Communities closest to intense oil extraction operations. This analysis prioritizes areas with substantial population density. Remote sensing (satellite imagery) data and direct knowledge of Kern County cities was used to define the sample areas for this analysis. These techniques and methods avoid the type of spatial bias that distorted the results of the environmental justice (EJ) analysis in the 2020 Kern County draft EIR (chapter 7 PDF pp.1292-1305).
The EJ analysis included in the 2020 Kern County Draft EIR uses the spatial bias of US census designated areas to generate false conclusions. The Draft EIR can do this in two ways:
First, the Draft EIR uses census tracts in the place of smaller census designated areas. The draft EIR states the county conducted, “an analysis of Kern County census tract five-year American Community Survey (ACS) demographic and poverty data for the period was conducted … and the five-year data is the most accurate form of ACS data, has the largest sample size, and is the only ACS data that covers tiny populations.” While this is true about the five-year data, the authors chose to analyze using census tracts, which are much too large to cover small populations. It is not clear why the authors would have chosen census tracts, rather than the higher resolution ‘census block groups’ ACS dataset, as both datasets are readily available from the US Census Bureau.
Additionally, the draft EIR limits the sociodemographic analysis to only census tracts that contain PLSS QTR/QTRS’s ranked as Tier 1, so that it does not include neighboring communities in different census tracts in the demographical analysis. As discussed in the draft EIR, Tier 1 areas contain four or more operational wells in a tiny area. The draft EIR explicitly states that Tier 1 Qtr(s) do not contain schools or healthcare facilities. This trend is not limited to just the Qtr/Qtr sections. The census tracts containing the Tier 1 sections contain very few sensitive receptors, like schools and healthcare facilities. This is because census tracts and other census designated areas are drawn specifically to differentiate between urban and rural/industrial areas. Census tracts containing oil fields cover large rural areas, and intentionally avoid areas with any significant population density. This results in donuts and other strange shapes, where communities in much smaller census tracts (by area) are enveloped by large rural census tracts containing oil fields. As shown in the maps below, this eliminates all communities with any real population density from the draft EIR EJ analysis, even though they are the communities nearest to the oil fields.
In the maps below, census tracts are compared to census block groups, to show the difference in size and nature of their spatial distribution. In most cases, census tracts encompassing populated areas are tiny, and limited to the urban boundaries of cities. In the cases of Shafter and Arvin, the residential census tracts are encircled by a different donut-shaped census tract, actually containing most of the operational wells and oil fields. While the census tracts of the Frontline Communities are within very short distances of operational oil and gas wells and major fields at large, most communities are not included in the Kern 2020 draft EIR EJ analysis. With Lost Hills, the city of Lost Hills is within the same census tract as the Lost Hills oil field and several other extensive oil fields. The city of Lost Hills is the closest community to oil extraction operations in the census tract, and the small city contains just over 50% of the total population within this massive census tract. But because of the sheer size of the census tract, demographics of this Frontline Community are diluted by the vast rural area of northwestern Kern County, which is higher income with demographics 10% less Latino.
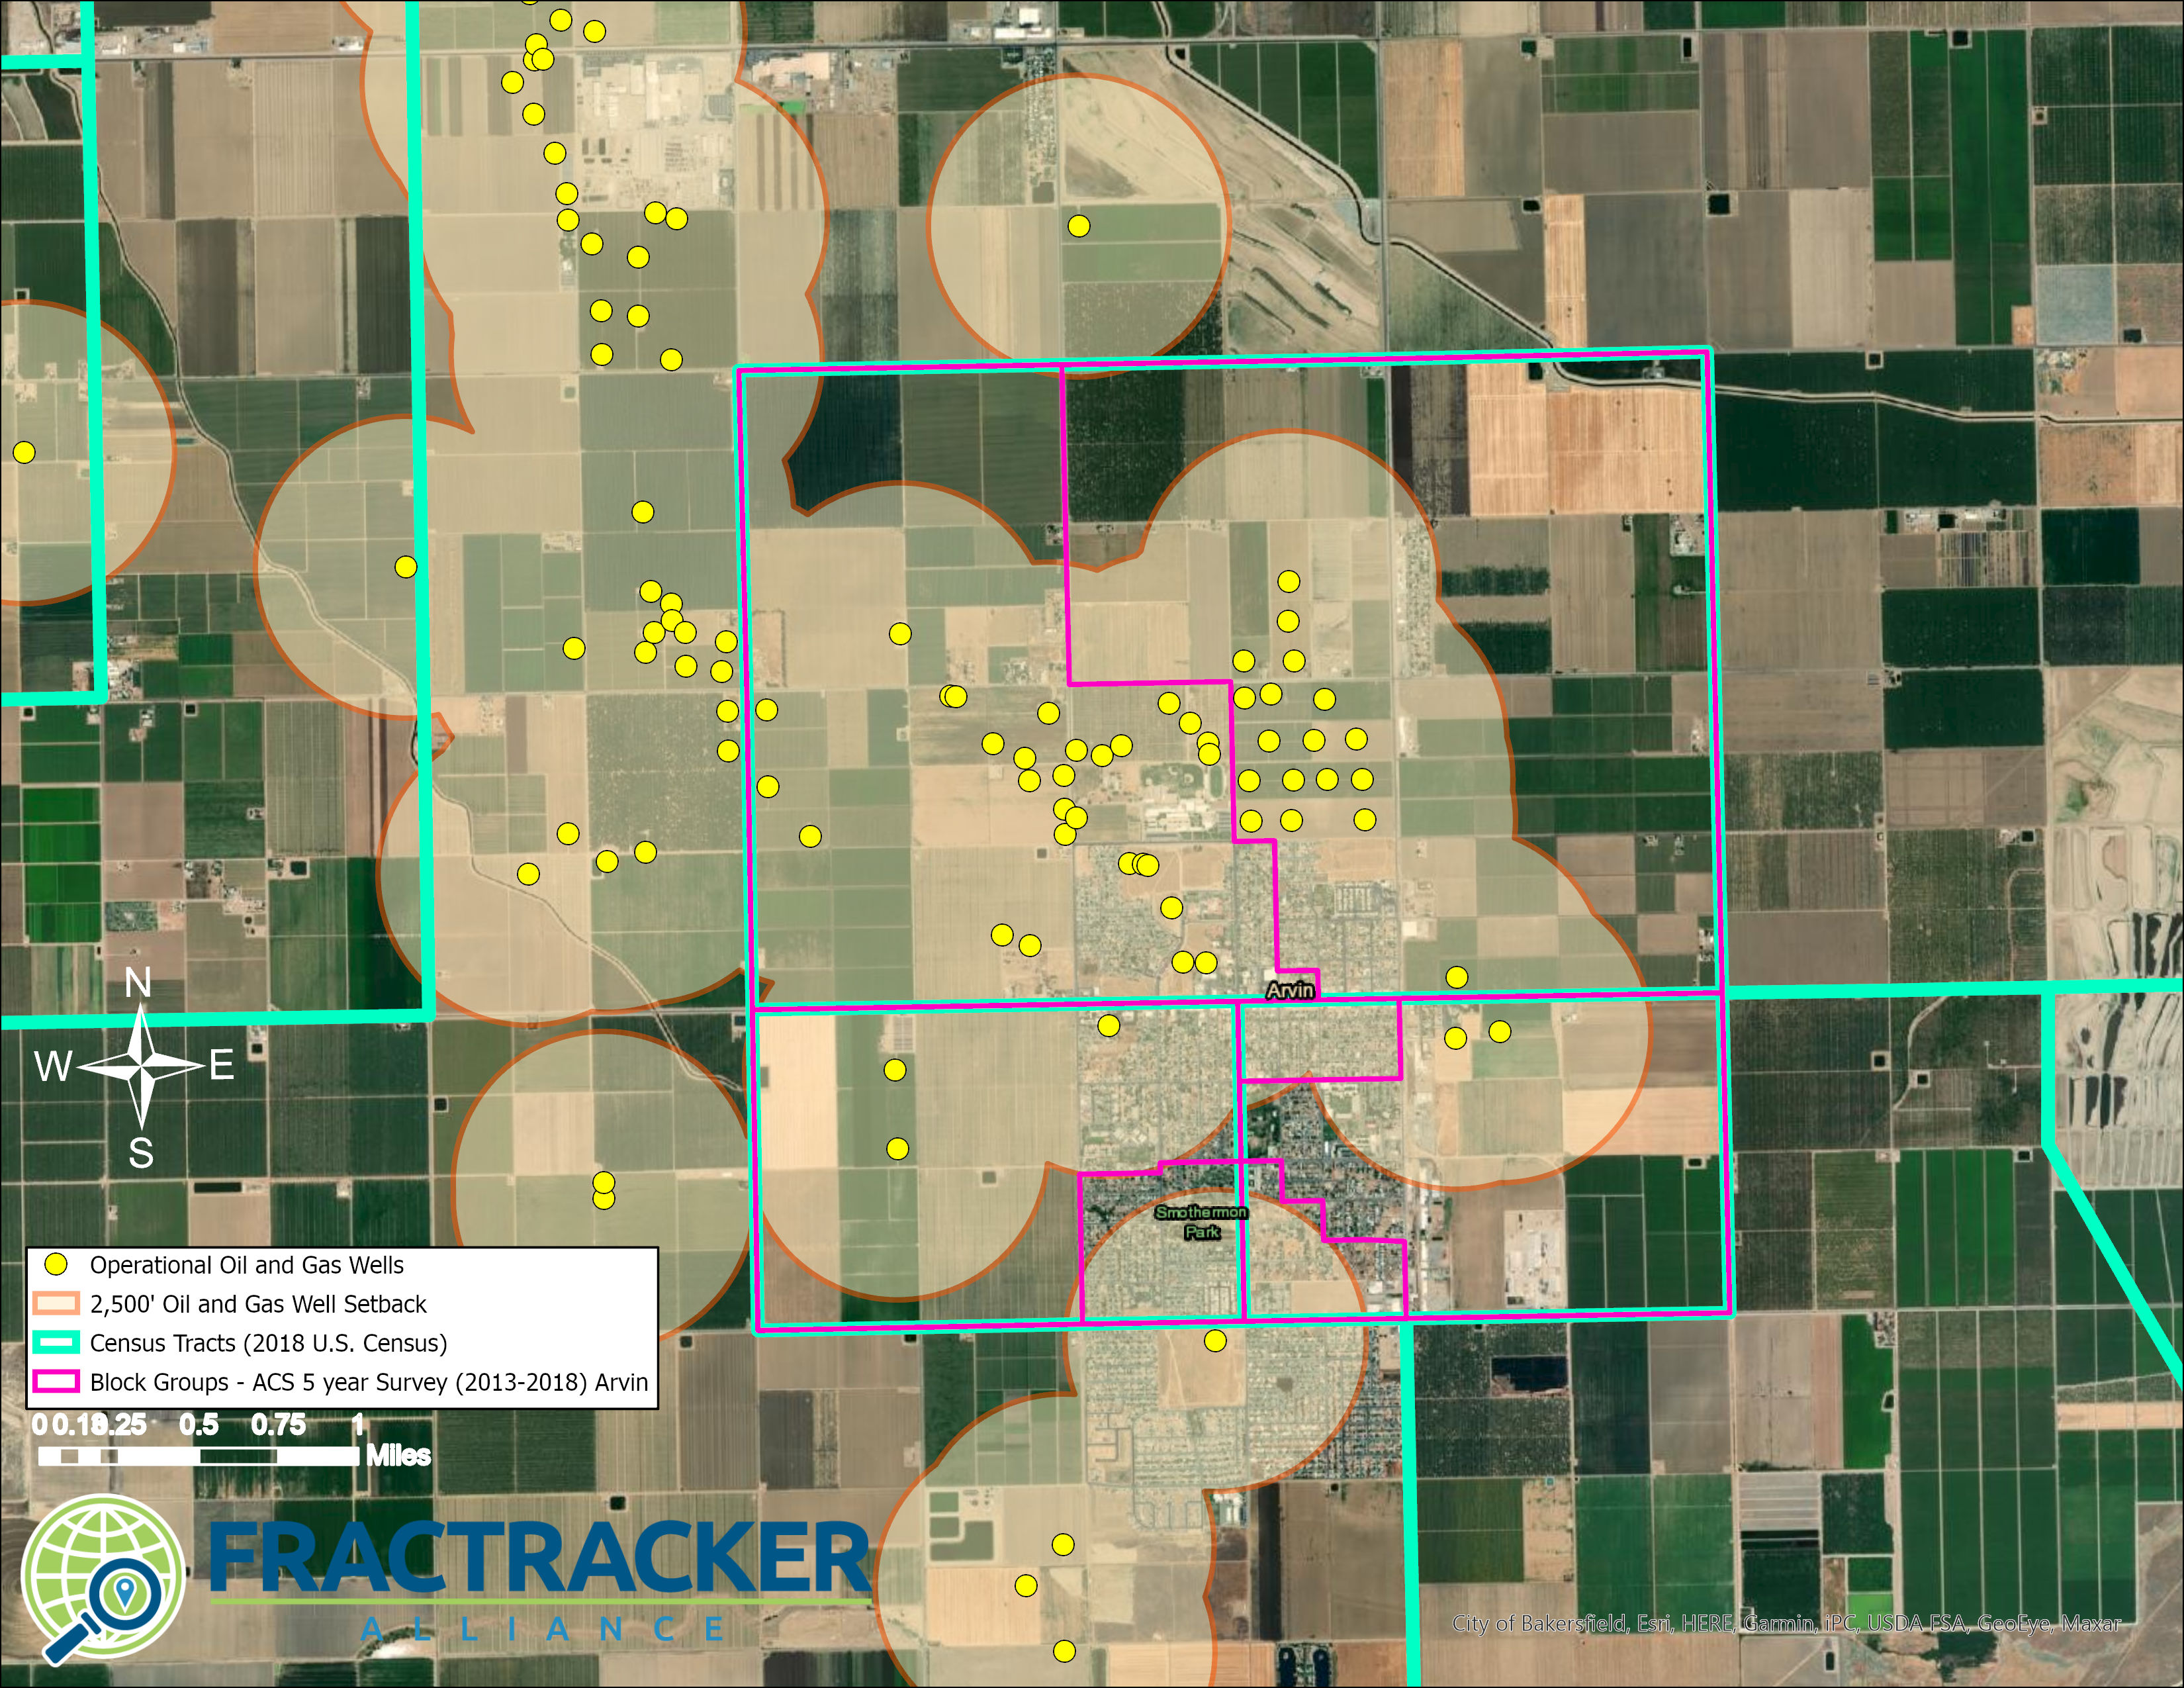 Map A1. Arvin Census Designated Areas. The map shows the city of Arvin and includes both census tracts and census block groups for comparison. It shows operational oil and gas wells in the map, along with 2,500’ buffers. This Frontline Community would be excluded in an analysis that only considers census tracts containing Tier 1 areas negatively impacted by oil and gas extraction operations. The census tracts that make up the majority of the city of Arvin are enveloped on all four sides by one larger census tract that contains most oil and gas wells.
 Map A2. Shafter Census Designated Areas. The map shows the city of Shafter and includes both census tracts and census block groups for comparison. It shows operational oil and gas wells in the map, along with 2,500’ buffers. This Frontline Community would not be included in an analysis that only considers census tracts containing Tier 1 areas negatively impacted by oil and gas extraction operations. The census tract containing the North Shafter oil field forms a donut around the city of Shafter.
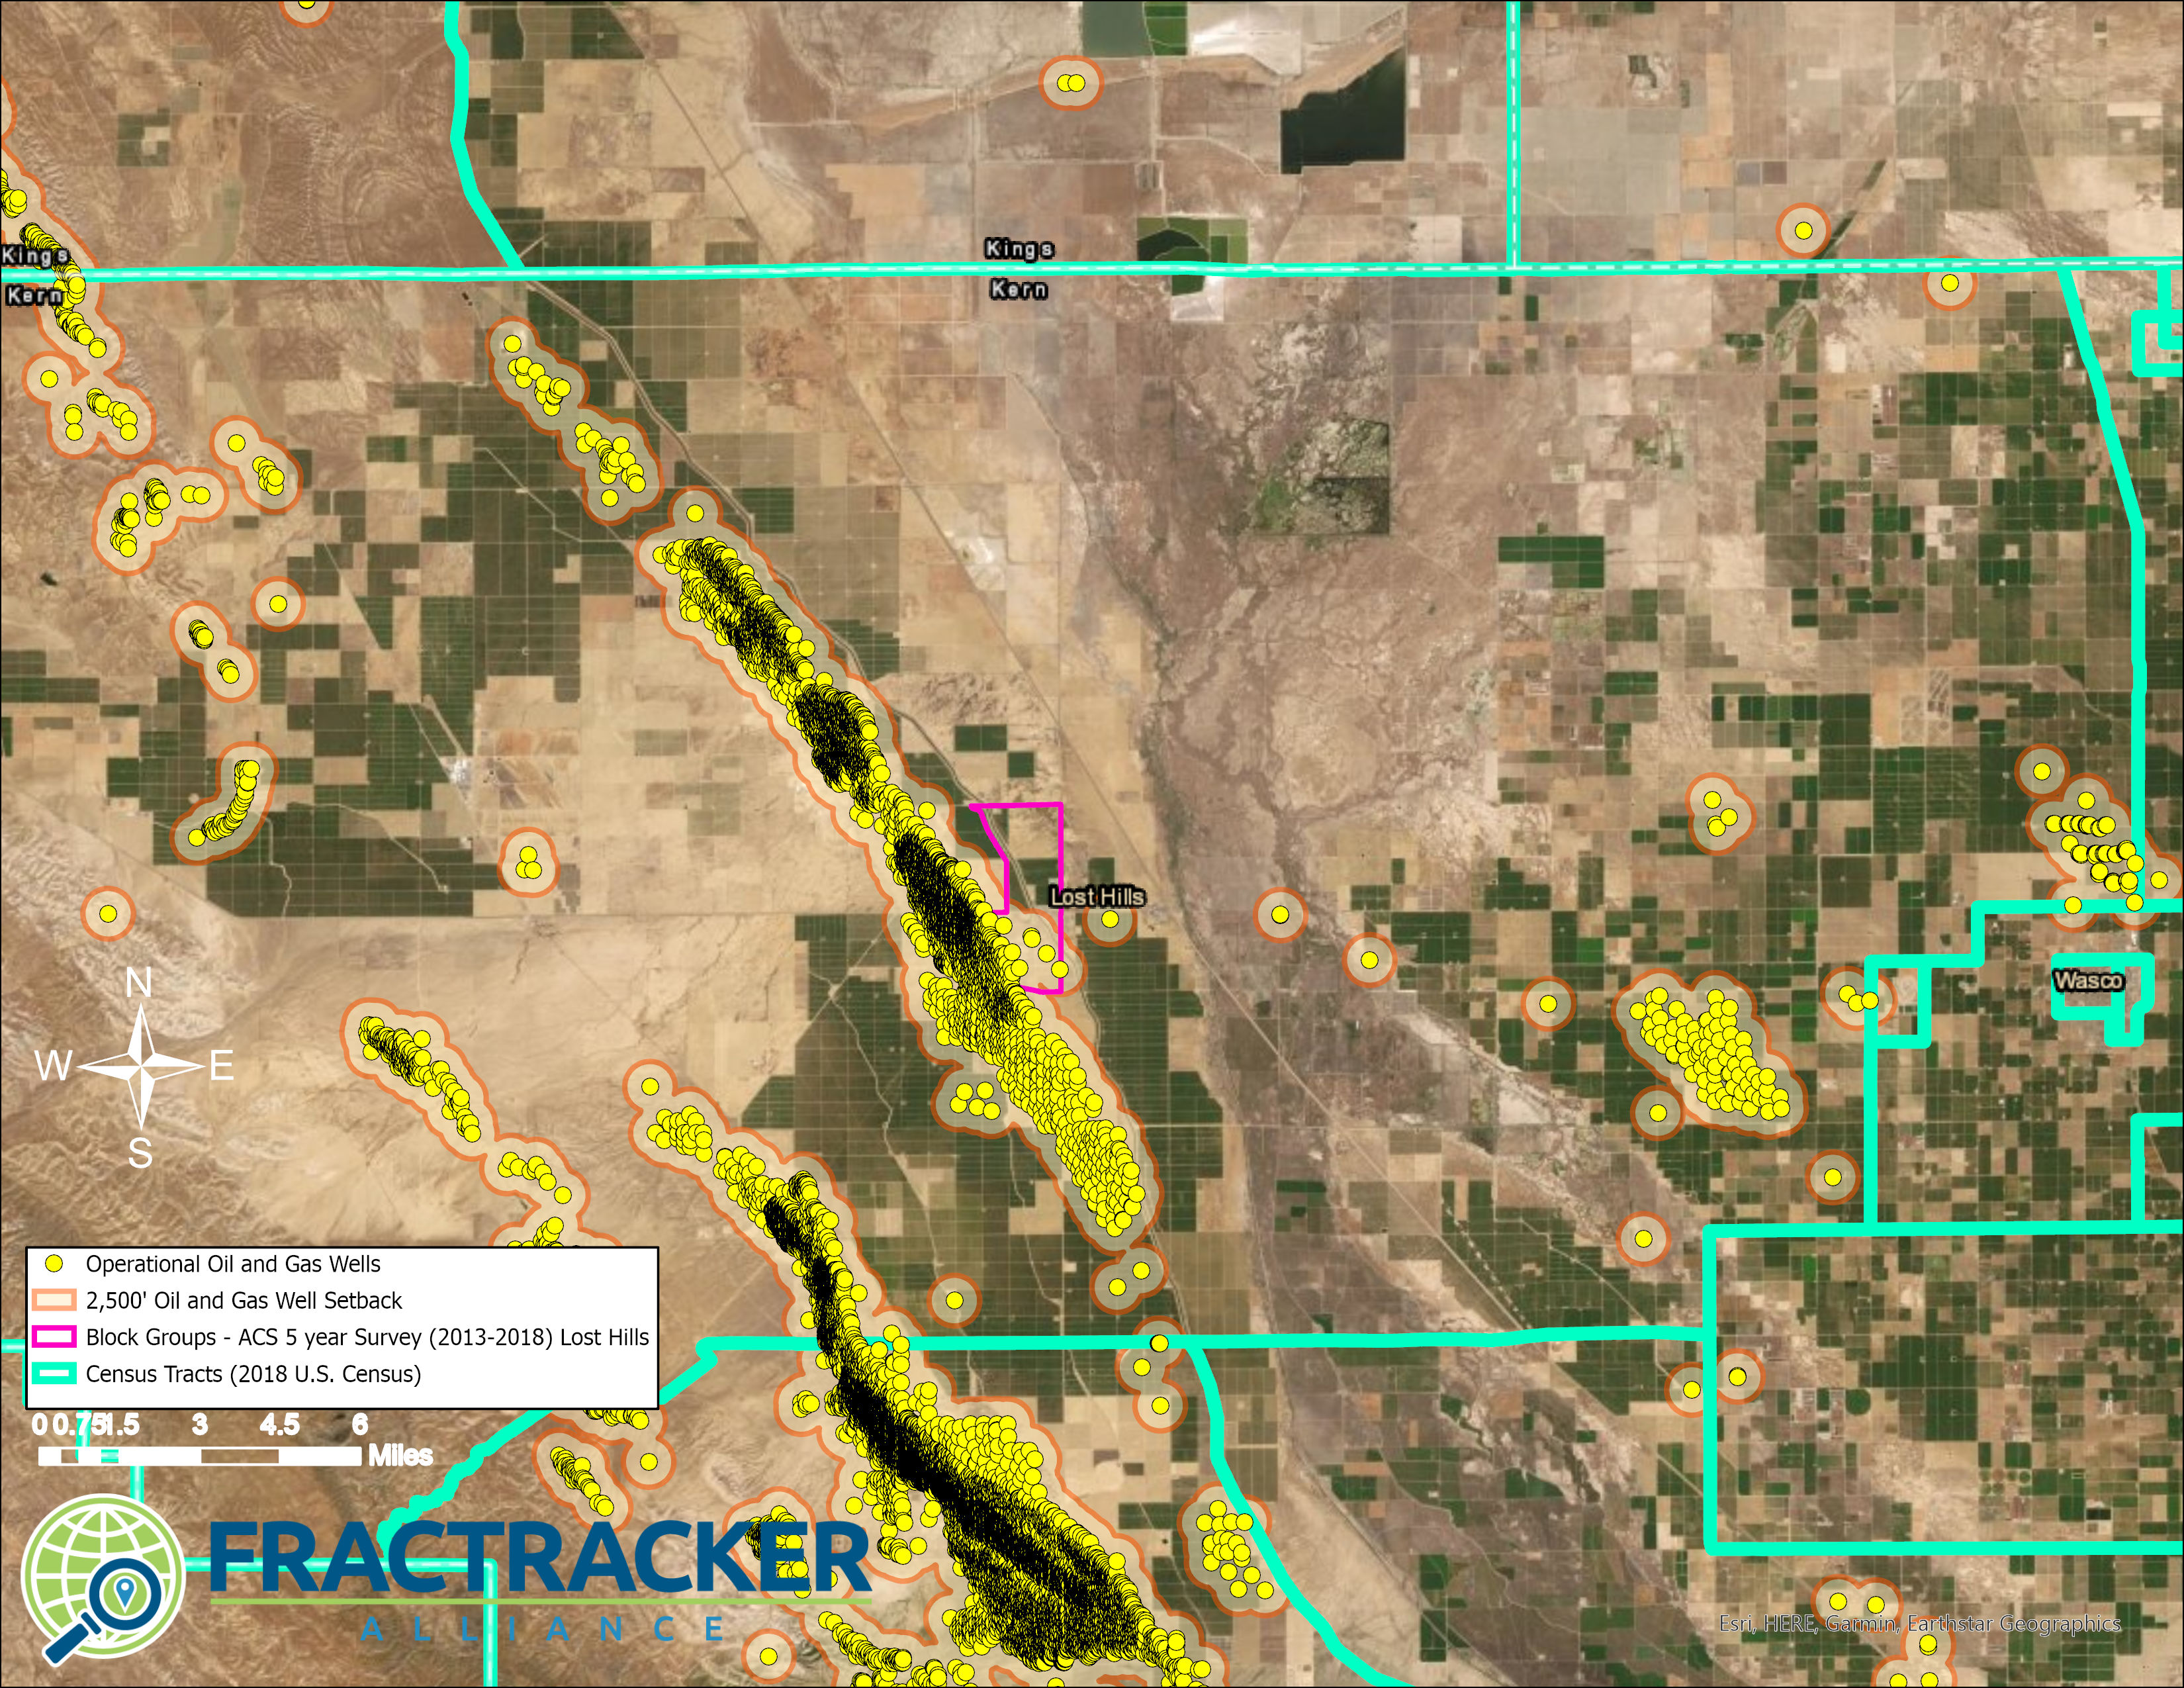 Map A3. Lost Hills Census Designated Areas. The map shows the city of Lost Hills and includes both census tracts and census block groups for comparison. It shows operational oil and gas wells, along with 2,500’ buffers. While the city of Lost Hills may be included in the 2020 Kern draft EIR EJ analysis, the results will not reflect the demographics of the community due to the incredibly large size of the census tract. It does not even entirely fit in the frame of this map!
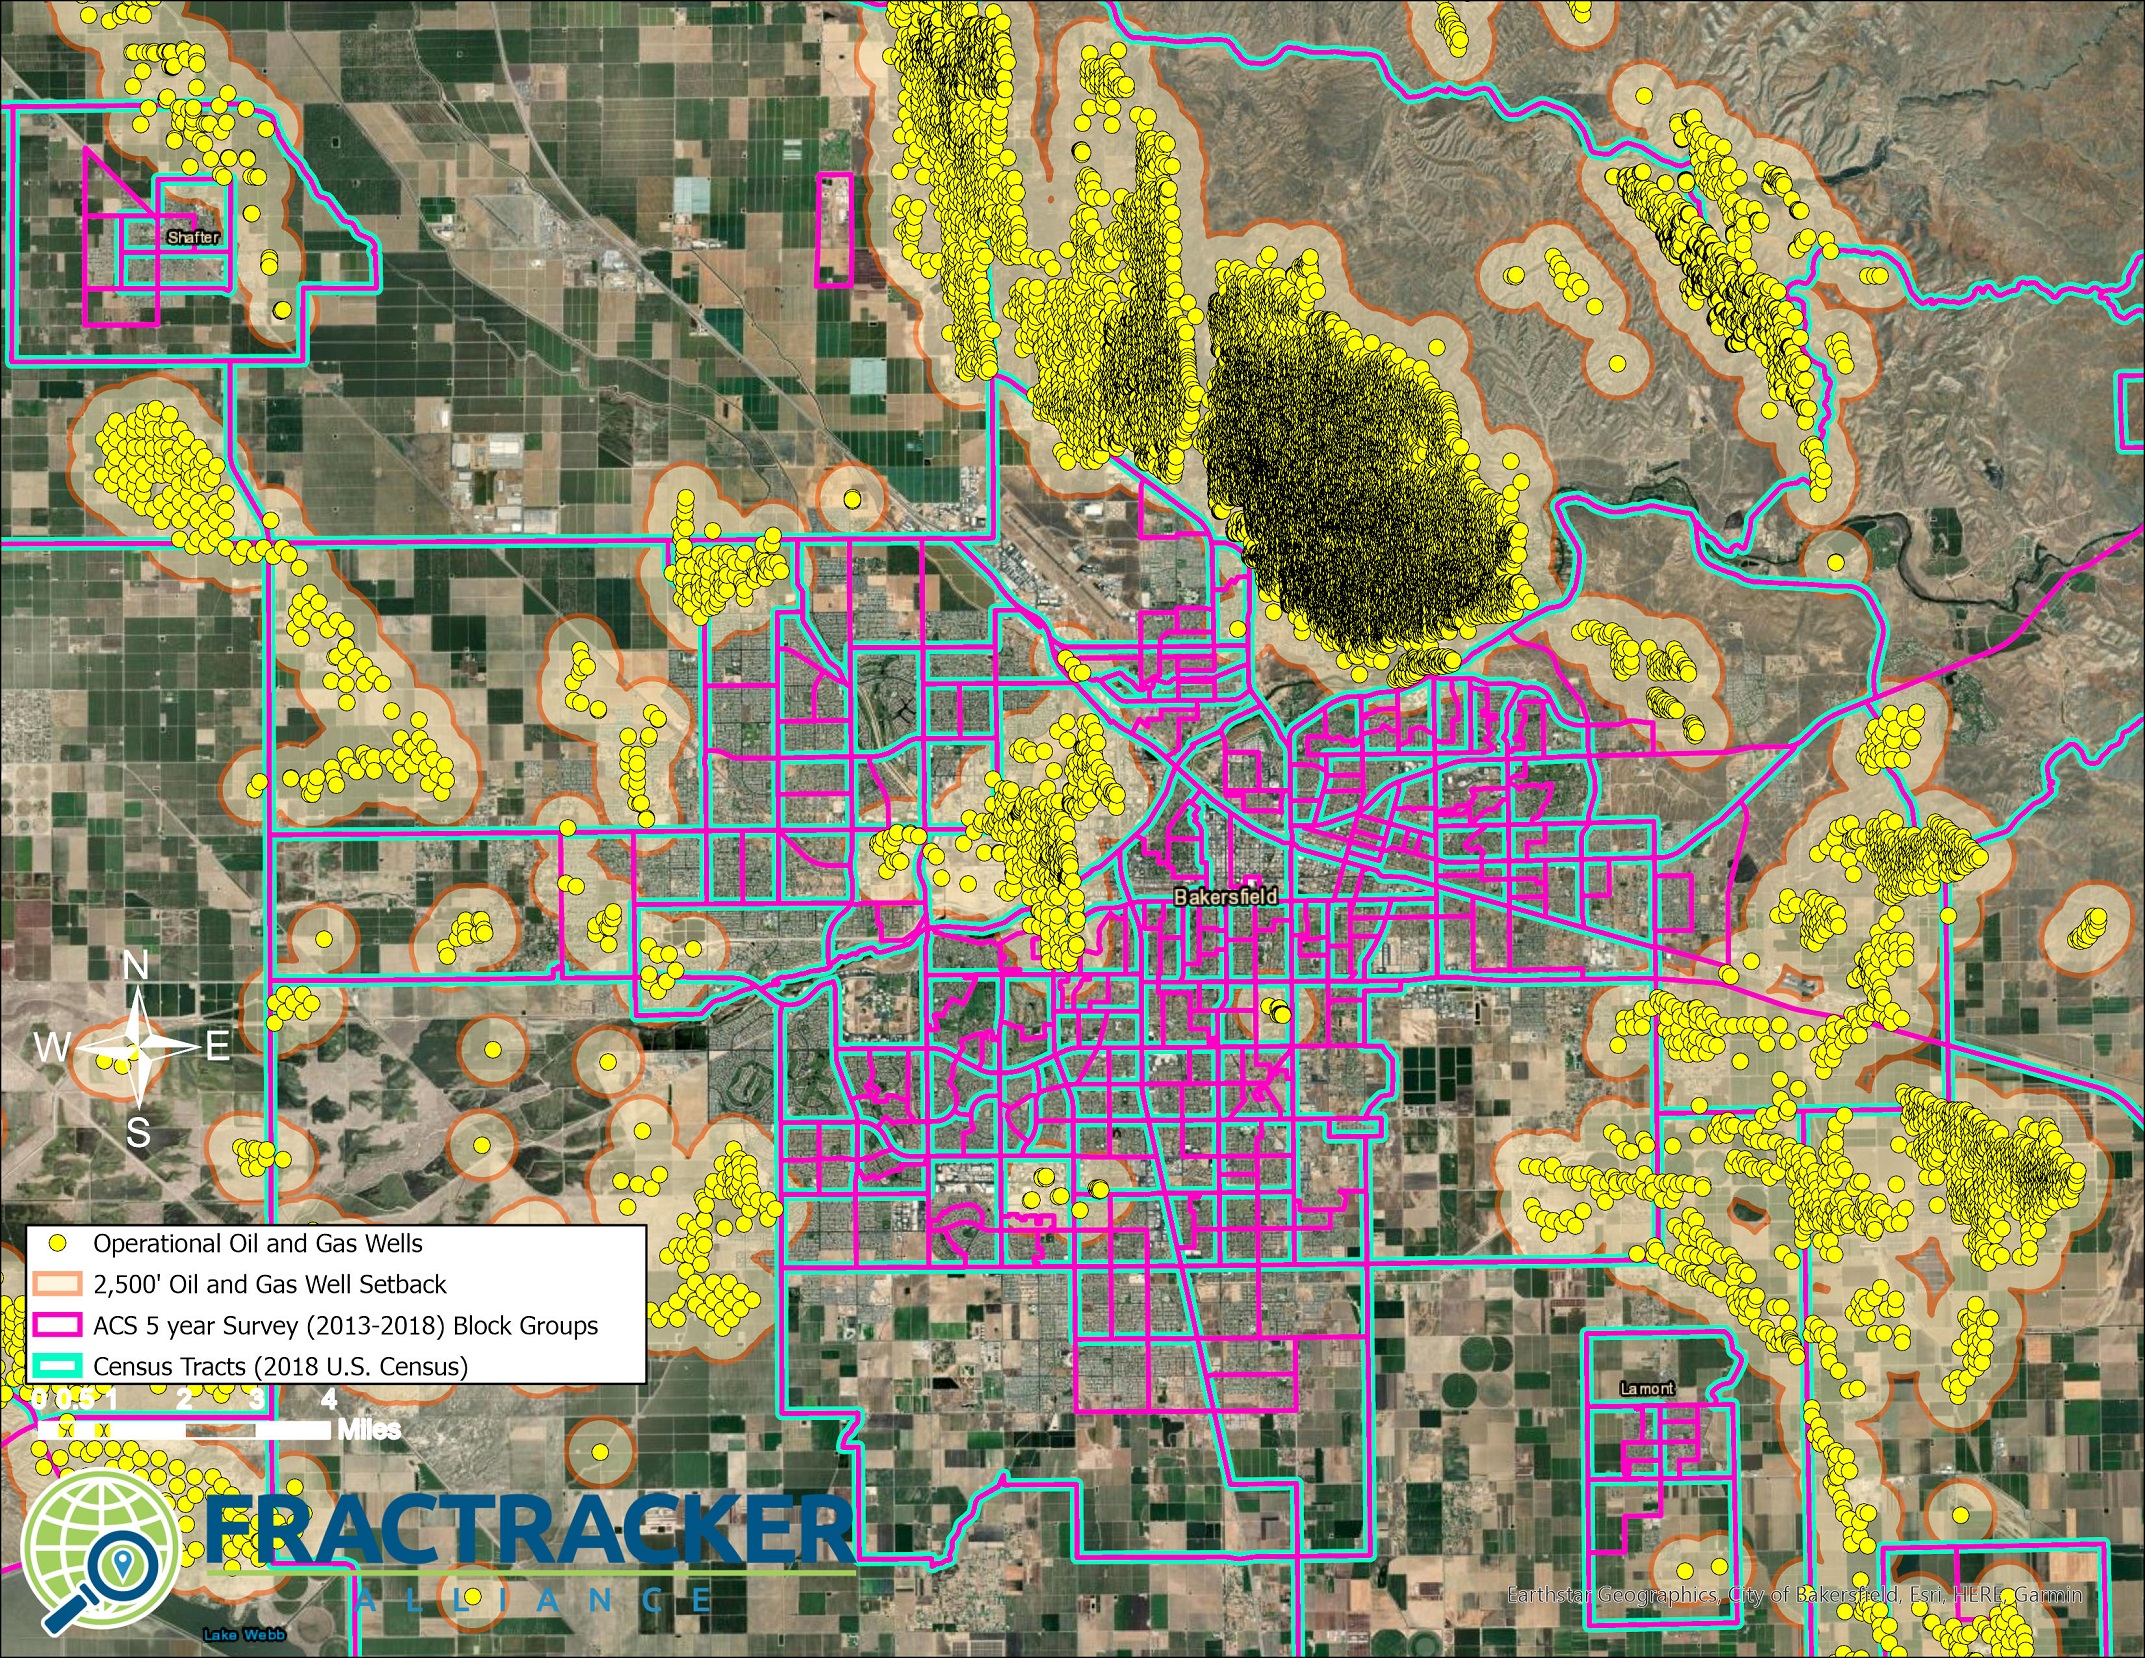 Map A4. Bakersfield Census Designated Areas. The map shows the city of Bakersfield and includes both census tracts and census block groups for comparison. It shows operational oil and gas wells, along with 2,500’ buffers. This Frontline Community would not be included in an analysis that only considers census tracts containing Tier 1 areas negatively impacted by oil and gas extraction operations. The oil and gas wells in the Kern River, Kern Front and other oil fields make up their own unique census tract that also includes extensive areas of rural ‘estate’ zoned lands.
In the initial report below we analyzed the demographics and linguistic isolation of communities who live within 2,500’ of operational oil and gas wells. We found that the urban census block groups closest to Kern’s major oil and gas fields are some of the most linguistically isolated regions in the country. Densely populated block groups near large oil fields in the cities of Lost Hills, Arvin, Lamont and Weepatch suffer from linguistic isolation, where up to 80% of households do not have a proficient english speaker. In the analysis that follows, we focus more on specific Frontline Communities. Generating county-wide statistics using census block groups could result in too much spatial bias. Census designated areas do not have enough uniformity, and those located in and near oil fields are large in area (though would still provide a more accurate picture in comparison to census tracts). Therefore the analyses that follow take a community-centric approach to more accurately describe the demographics of several of Kern’s largest, most populous, Frontline Communities.
The City of Shafter, California, is near over 100 operational wells in the North Shafter oil field, as shown below in the map in Figure 2. Technically, the wells are within a donut-shaped census block group (outlined in blue) that surrounds the limits of the urban census block groups (outlined in pink). Shafter’s population of nearly 20,000 is over 86% Latinx, but the surrounding “donut” with just 2,000 people is about 70% Latinx, much wealthier, and with very low population density. The other neighboring rural census areas housing the rest of the Shafter oil field wells follow this same trend.
An uninformed analysis, such as the Kern County EIR, would conclude that the 2,000 individuals who live within the blue “donut” are at the highest risk, because they share the same census designated area as the wells. Notably, the only population center of this census block group (or census tracts, which follow this same trend) is at the opposite end of the block group, far from the Shafter oil field. Instead, the most at-risk community is the urban community of Shafter with high population density; the census block groups within the pink hole of the donut contain the communities and homes nearest the North Shafter field.
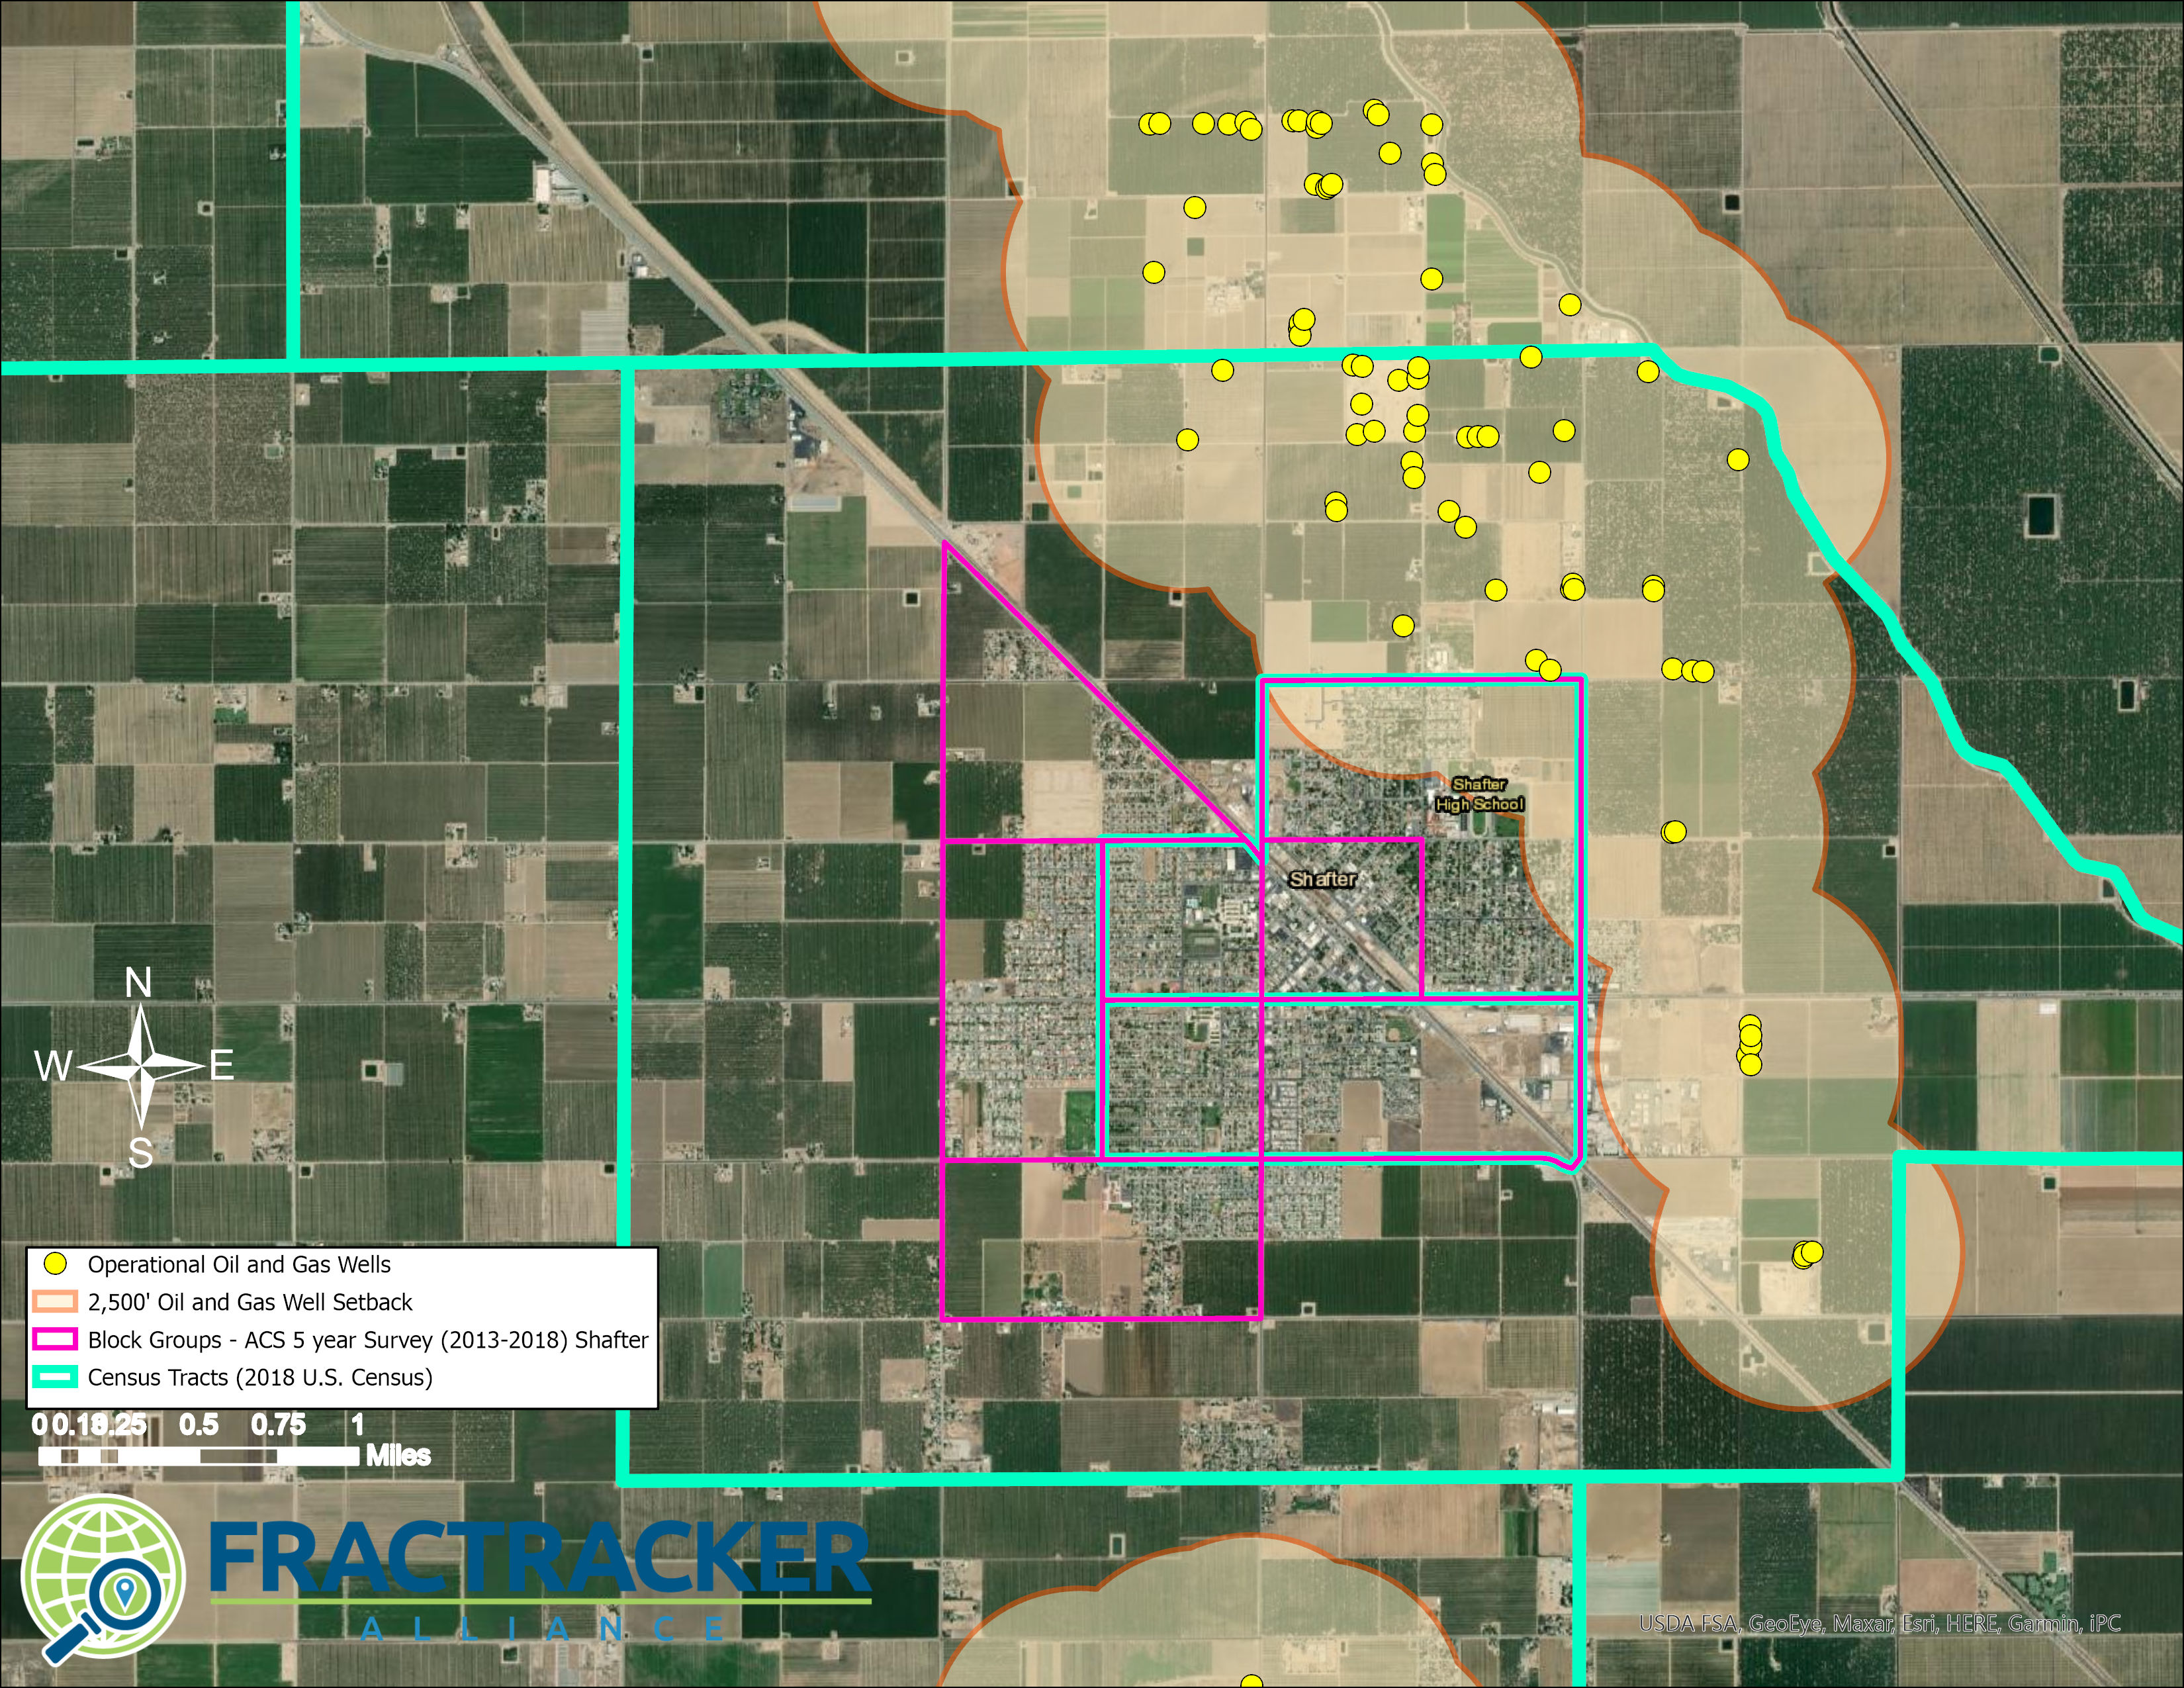 Map A5. The City of Shafter, California is located just to the south of the North Shafter oil field. The map shows the 2,500’ setback distance in tan, as well as the census block groups in both pink and blue. Pink block groups show the urban case populations used to generate the demographic summaries.
The cities of Lost Hills, Arvin, and Taft are all very similar to Shafter. The cities have densely populated urban centers within or directly next to an oil field. In the maps below in Figures 3 readers can see the community of Lost Hills next to the Lost Hills oil field. Lost Hills, like the densely populated cities of Arvin and Taft, are located very close to large scale extraction operations. Census block groups that include the most affected area of Lost Hills, outlined in pink, while surrounding low population density census block groups are shown in blue. Most of the areas outlined in blue are zoned as “estate” and “agriculture” areas. The outlines of the city boundaries are also shown, along with 2,500’ and mile setback distances from currently operational oil and gas wells.
Lost Hills is another situation where a donut-shaped census area distorts the results of low resolution demographics assessments, such as the one conducted by Kern County in their 2020 Draft EIR (PDF pp. 1292-1305). Almost all of the wells within the Lost Hills oil fields are just outside of a 2,500’ setback, but the incredibly high density of extraction operations results in the combined impact of the sum of these wells on degraded air quality. While stringent setback distances from oil and gas wells are a necessary component of environmental justice, a 2,500’ setback on its own is not enough to reduce exposures and risk for the Frontline Community of Lost Hills. For these Frontline Communities, a setback needs to be much larger to reduce exposures. In fact, limiting a public health intervention to a 2,500′ setback requirement alone is not sufficient to address the environmental health inequities in Lost Hills, Shafter, and other similar communities.
Lost Hill’s nearly 2,000 residents are over 99% Latinx, and over 70% of the households make less than $40,000 in annual income (which is substantially less than the annual median income of Kern County households [at $52,479]). The map in Figure A6 shows that the Lost Hills public elementary school is within 2,500’ of the Lost Hills oil field and within two miles of over 2,600 operational wells, besides the 6,000 operational wells in the rest of the field.
The City of Arvin has 8 operational oil and gas wells within the city limits, and another 71 operational wells within 2 miles. Arvin, with nearly 22,000 people, is over 90% Latinx, and over 60% of the households make less than $40,000 in annual income.
Additionally the City of Taft, located directly between the Buena Vista and Midway Sunset Fields, has a demographic profile with a Latinx population at least 10% higher than the rest of southern Kern County.
Lost Hills, Arvin, and Taft are among the most affected communities of Kern County and represent a large proportion of the Kern citizens at risk of exposure to localized air quality degradation from oil and gas extraction.
In these cases, if only census tract well counts are considered, like in the 2020 Kern County draft EIR, these Frontline Communities will be completely disregarded. Census tracts are intentionally drawn to separate urban/residential areas from industrial/estate/agricultural areas. The census areas that contain the oil fields are very large and sparsely populated, while neighboring census areas with dense population centers, such as these small cities, are most impacted by the oil and gas fields.
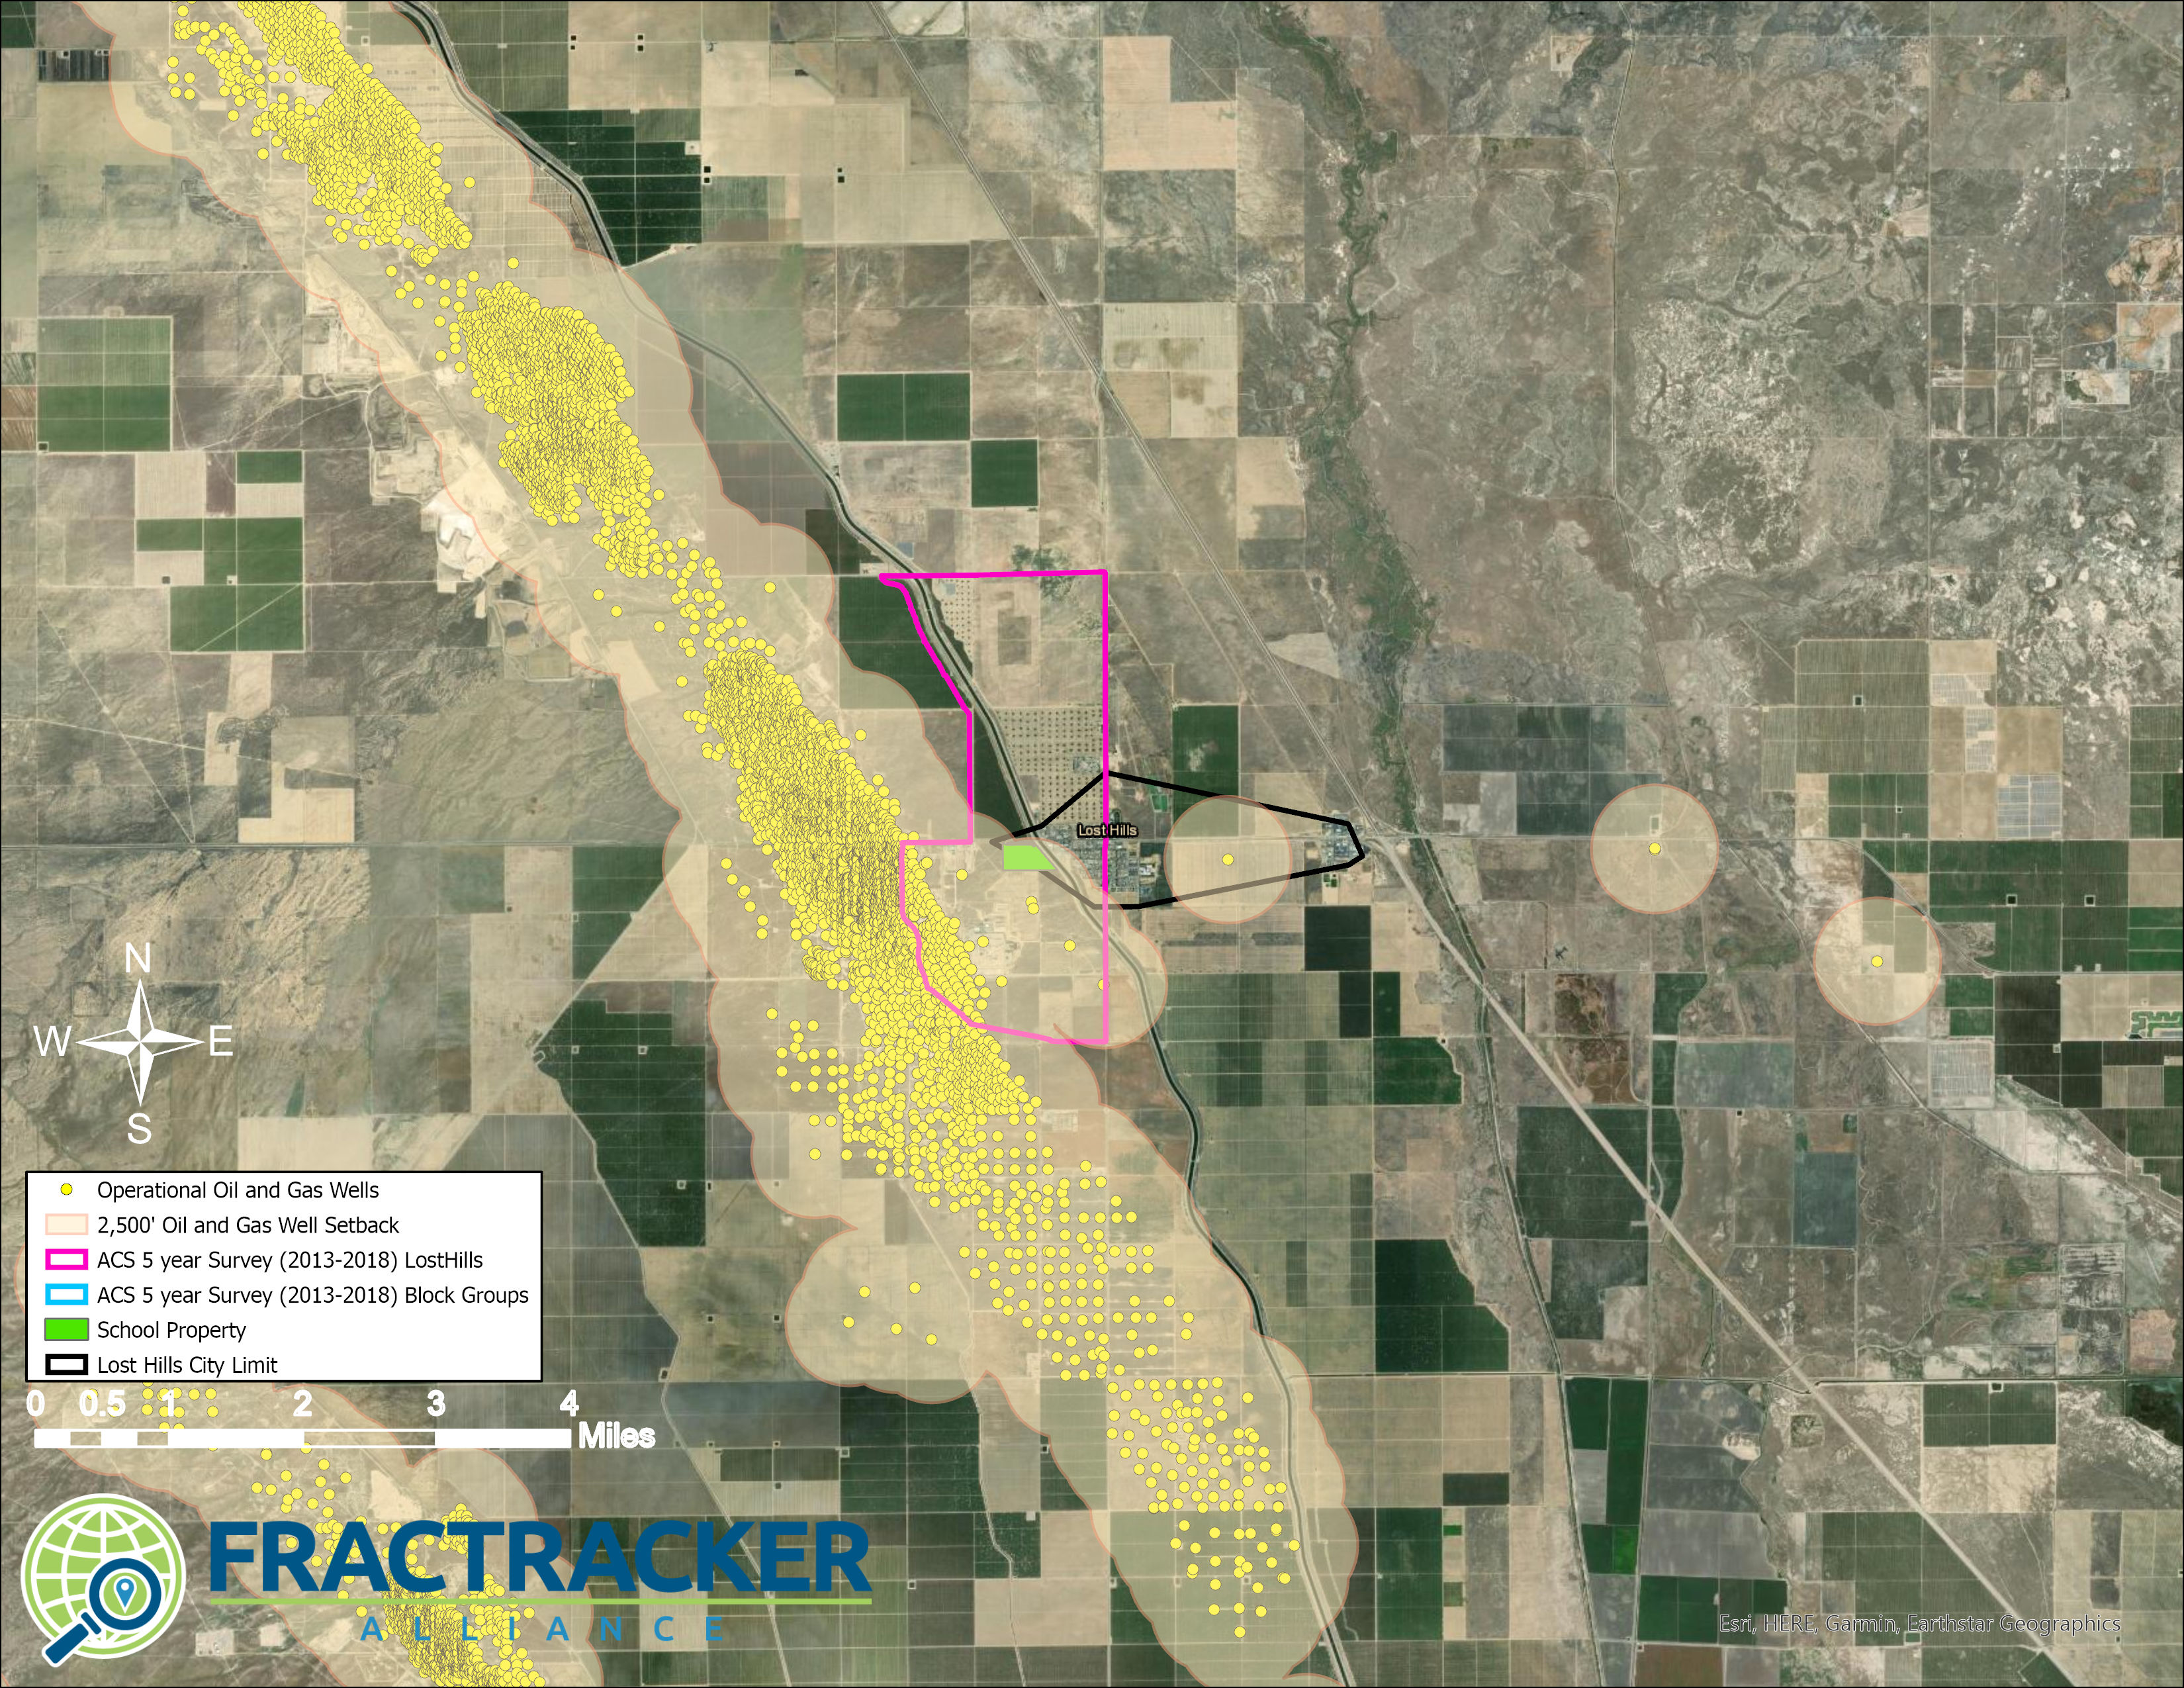 Map A6. The Unincorporated City of Lost Hills in Kern County, California is within 2,500’ of the Lost Hills Oil Field. The map shows the 2,500’ setback distance in tan, and the census block groups in both pink and blue. Pink block groups show the urban case populations used to generate the demographic summaries.
The City of Bakersfield is a unique scenario. It is the largest city in Kern County and as a result suburban developments surround parts of the city. Urban flight has moved much of the wealth into these suburbs. The suburban sprawl has occurred in directions including North toward the Kern River oil field, predominantly on the field’s western flank in Oildale and Seguro. In the map below in Map A7, these areas are located just to the north of the Kern River.
This is a poignant example of the development of cheap land for housing developments in an area where oil and gas operations already existed; an issue that needs to be considered in the development of setbacks and public health interventions and policies. This small population of predominantly white, middle class neighborhoods shares similar risks as the lower-income Communities of Color who account for most Bakersfield’s urban center. Even though these suburban communities are less vulnerable to the oppressive forces of systemic racism, real estate markets will continue to prioritize cheap land for development, moving communities closer to extraction operations.
Regardless of the implications of urban sprawl and suburban development,it is important to not disregard environmental risks for all communities. The demographics of the at-risk areas of the city of Bakersfield are predominantly Non-white (31%) and Latinx (60%), particularly as compared to the city’s suburbs (15% Non-white and 26% Latinx). About 33,000 people live in the city’s northern suburbs, and another 470,000 live in Bakersfield’s urban city center just to the south of the Kern River oil field. The urban population of Bakersfield is exposed to the local and regional negative air quality impacts of the Kern River and numerous other surrounding oil fields making it a disparately impacted community.
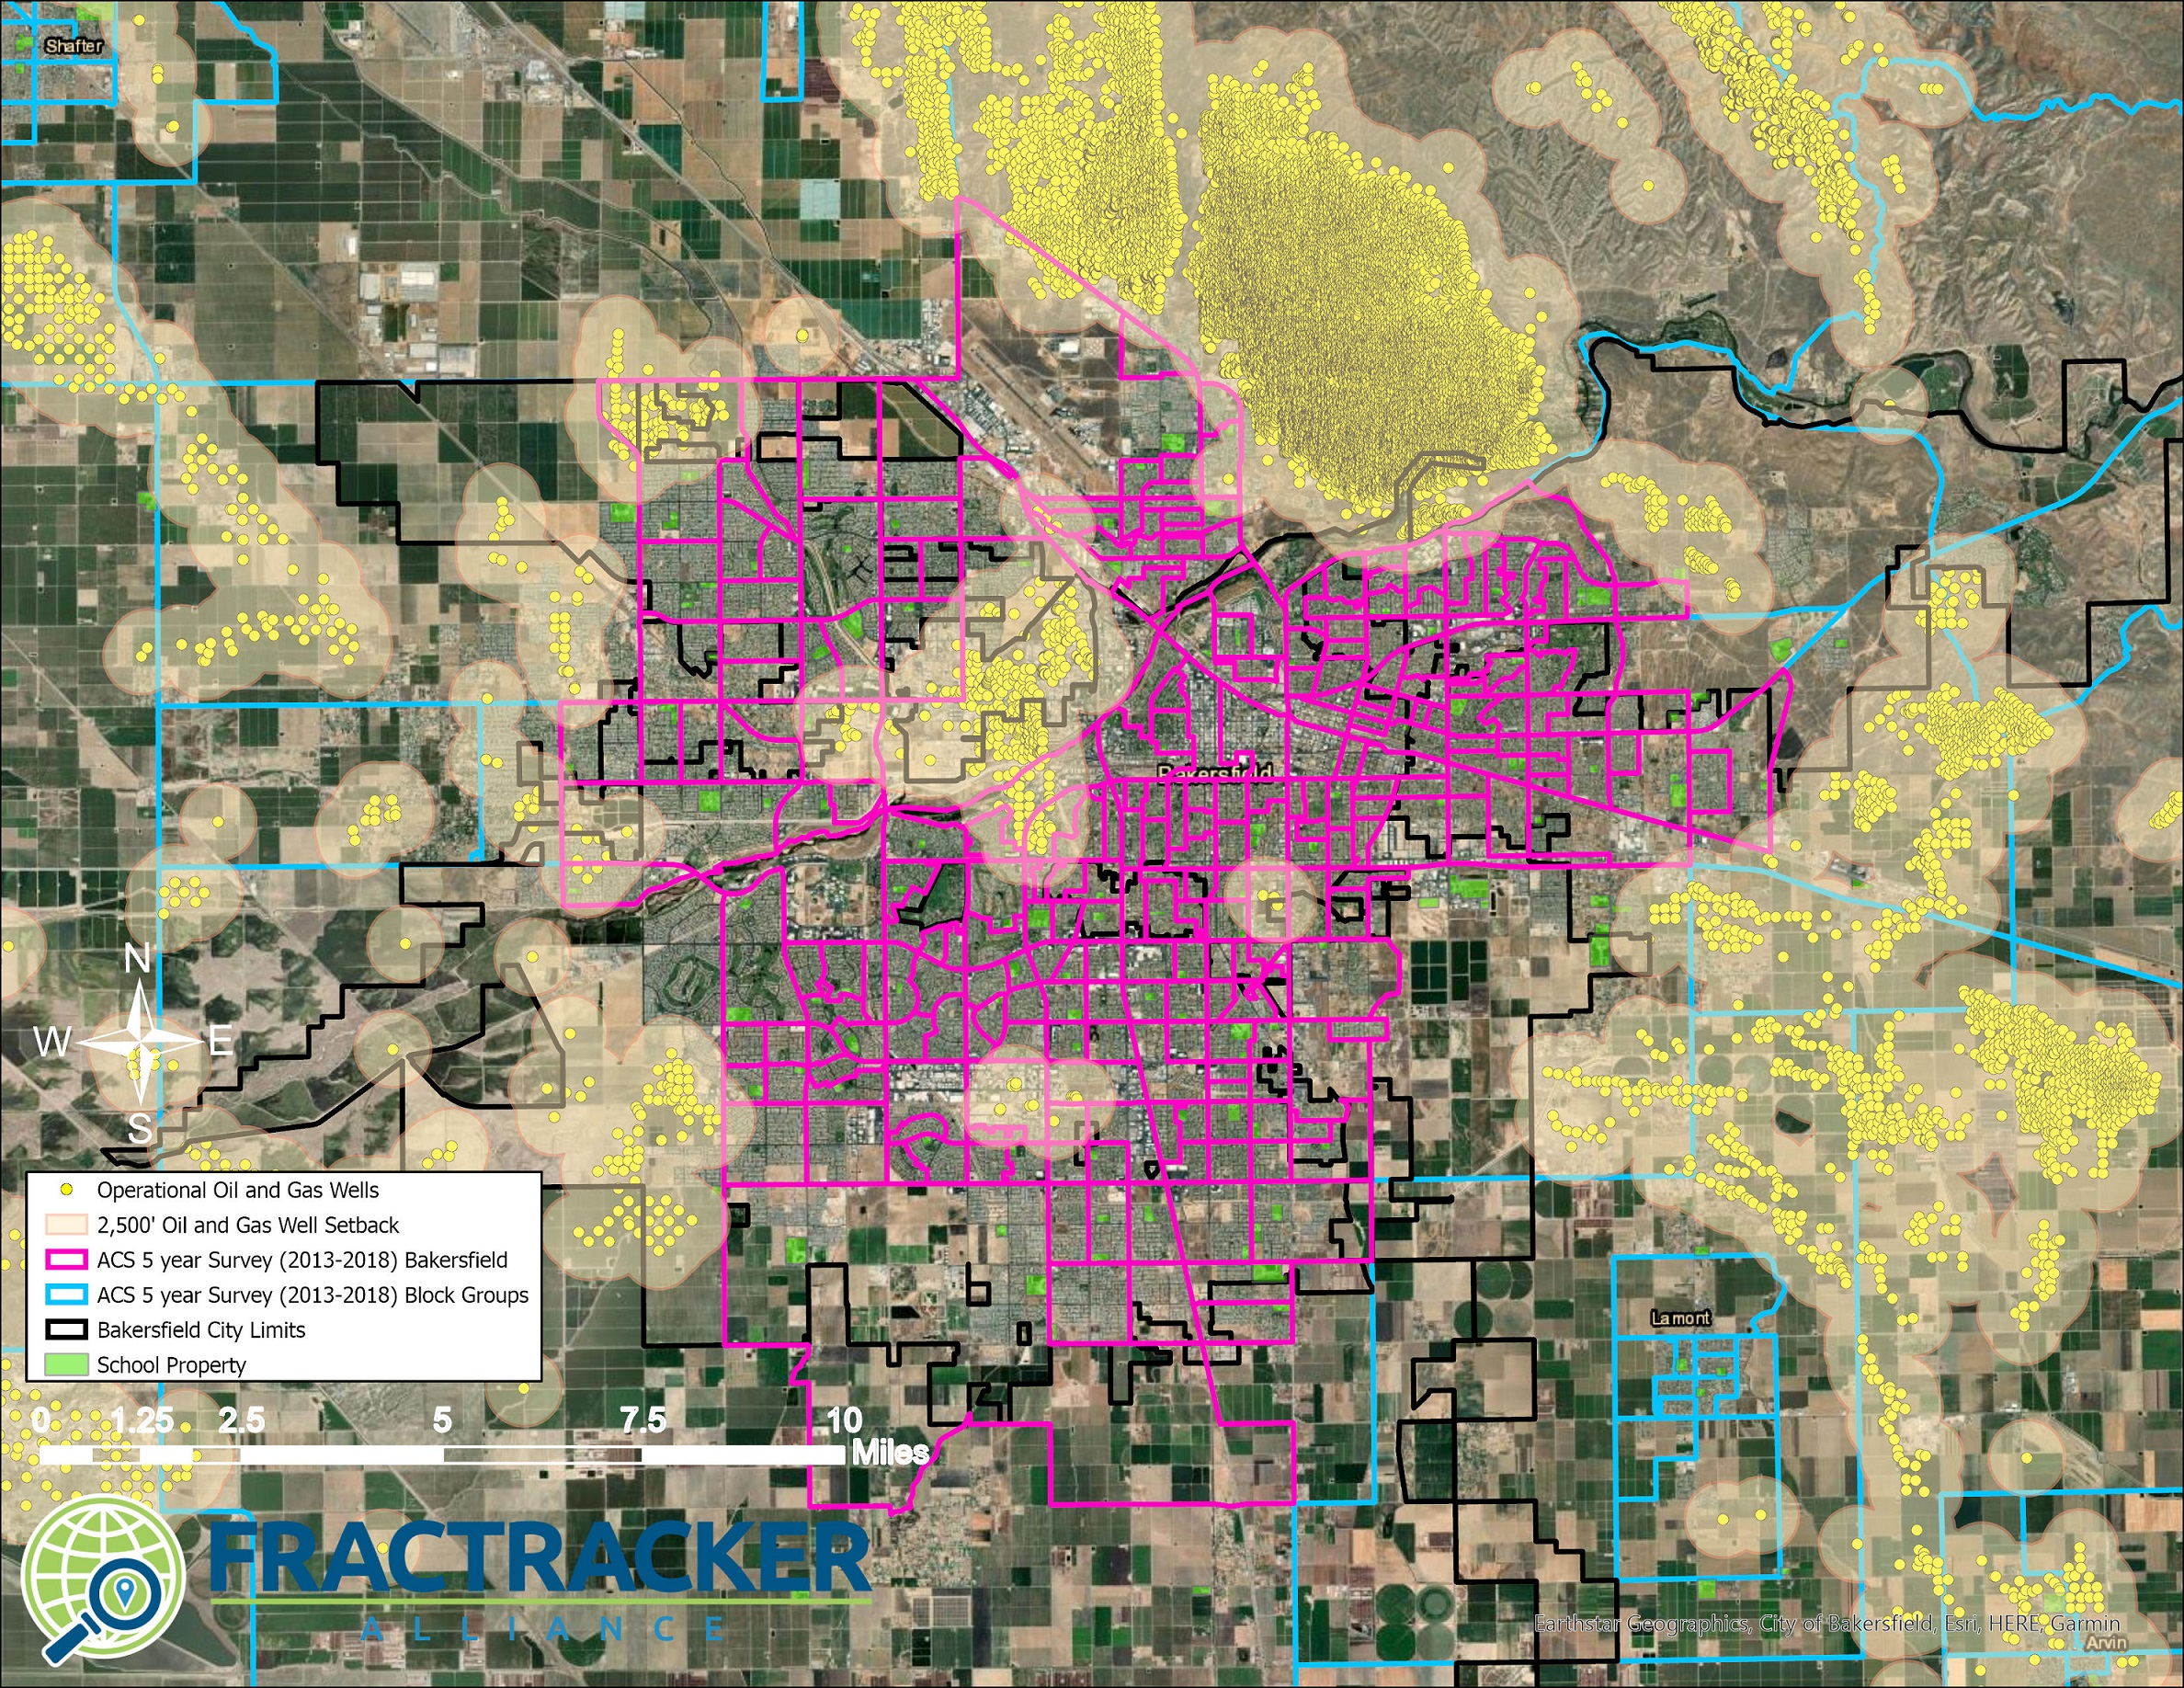 Map A7. Map of the city of Bakersfield in Kern County, California between several major oil fields including the Kern Front oil field. The map shows the 2,500’ setback distance in tan, and the census block groups in both pink and blue. Pink block groups show the urban case populations used to generate the demographic summaries.
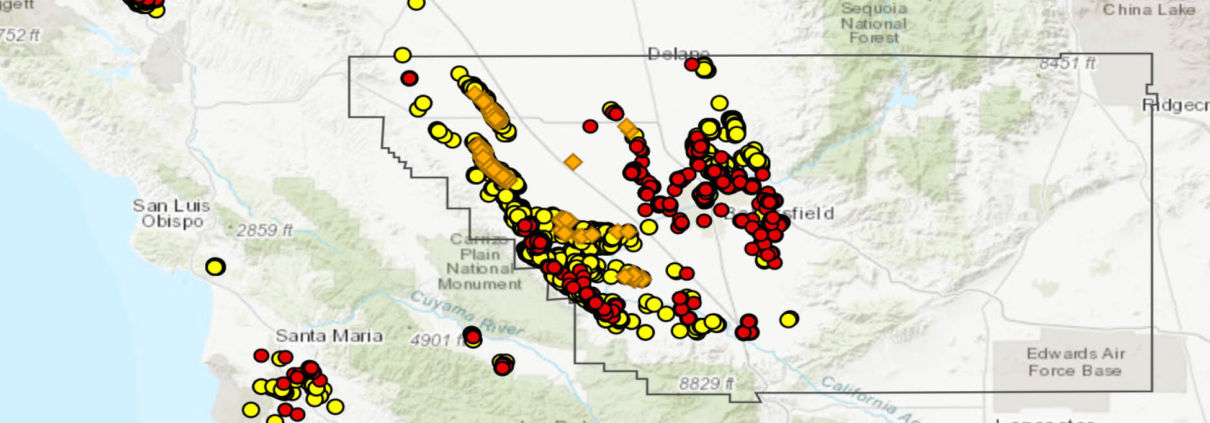
Kern County, California has approved at least 18,356 illegal permits to drill new and rework existing oil and gas wells from 2015 – 2019 (data downloaded May 18, 2020). In a monumental decision in February of 2020, a California court ruled that a Kern County oil and gas ordinance paid for and drafted by the oil industry violated the state’s foundational environmental law. Kern County has failed to consider the environmental harms resulting from oil and gas drilling, such as water supply and air quality problems, farmland degradation, and increased noise, and communities have had enough.
Starting in 2015, Kern County used a local ordinance to fast-track the drilling of up to 72,000 new oil and gas wells over the next 25 years. The court’s recent decision allows the existing 18,356 permits to remain valid, but blocked the county from issuing any more permits after the end of April, 2020. This is an important victory for Kern County communities, but the existing permits present a public health threat that regulators have never adequately addressed.
To better understand the impacts of these illegal permits, and identify the communities most impacted, FracTracker Alliance has conducted an environmental justice spatial analysis based on the location of the permits. A map of the permits is found below in Figure 1. shows that there are 18,356 “Drilling” and “Rework” permits issued in Kern County since 2015, as well as the 1,304 permits located within 2,500’ of a sensitive receptor, including hospitals, schools, daycares, and homes.
Figure 1. Map of California Geologic Energy Management Division (CalGEM), formerly the California Division of Oil, Gas, and Geothermal Resources (DOGGR), approved drilling and rework permits, 2015-2019.
View map fullscreen | How FracTracker maps work
The ordinance, written by oil industry consultants, sidestepped state requirements for environmental reviews or public notices, as required by the California Environmental Quality Act (CEQA). It was used as a blanket environmental impact report (EIR), so that the threats of specific projects need not be considered.
To pass the ordinance, the county used a flawed study to hide the immense harm caused by oil and gas drilling and extraction. The appellate court that ruled against the ordinance stated it was passed “despite its significant, adverse environmental impacts.” As a result, the county allowed wells to be constructed next to people’s homes, schools, daycares, and healthcare facilities.
FracTracker aggregated, cleaned, and compiled California Geologic Energy Management Division’s (CalGEM) datasets of well permits. A breakdown of the statewide counts of permit types is shown below in Table 1. The table shows that in 2019, permits to drill new oil and gas wells made up about 34% of total permits. Over the course of the last five years, statewide permits have been distributed pretty equally between drilling wells, reworking wells to increase production (including re-drilling activities like deepening and sidetracking wells), and plugging and abandoning wells.
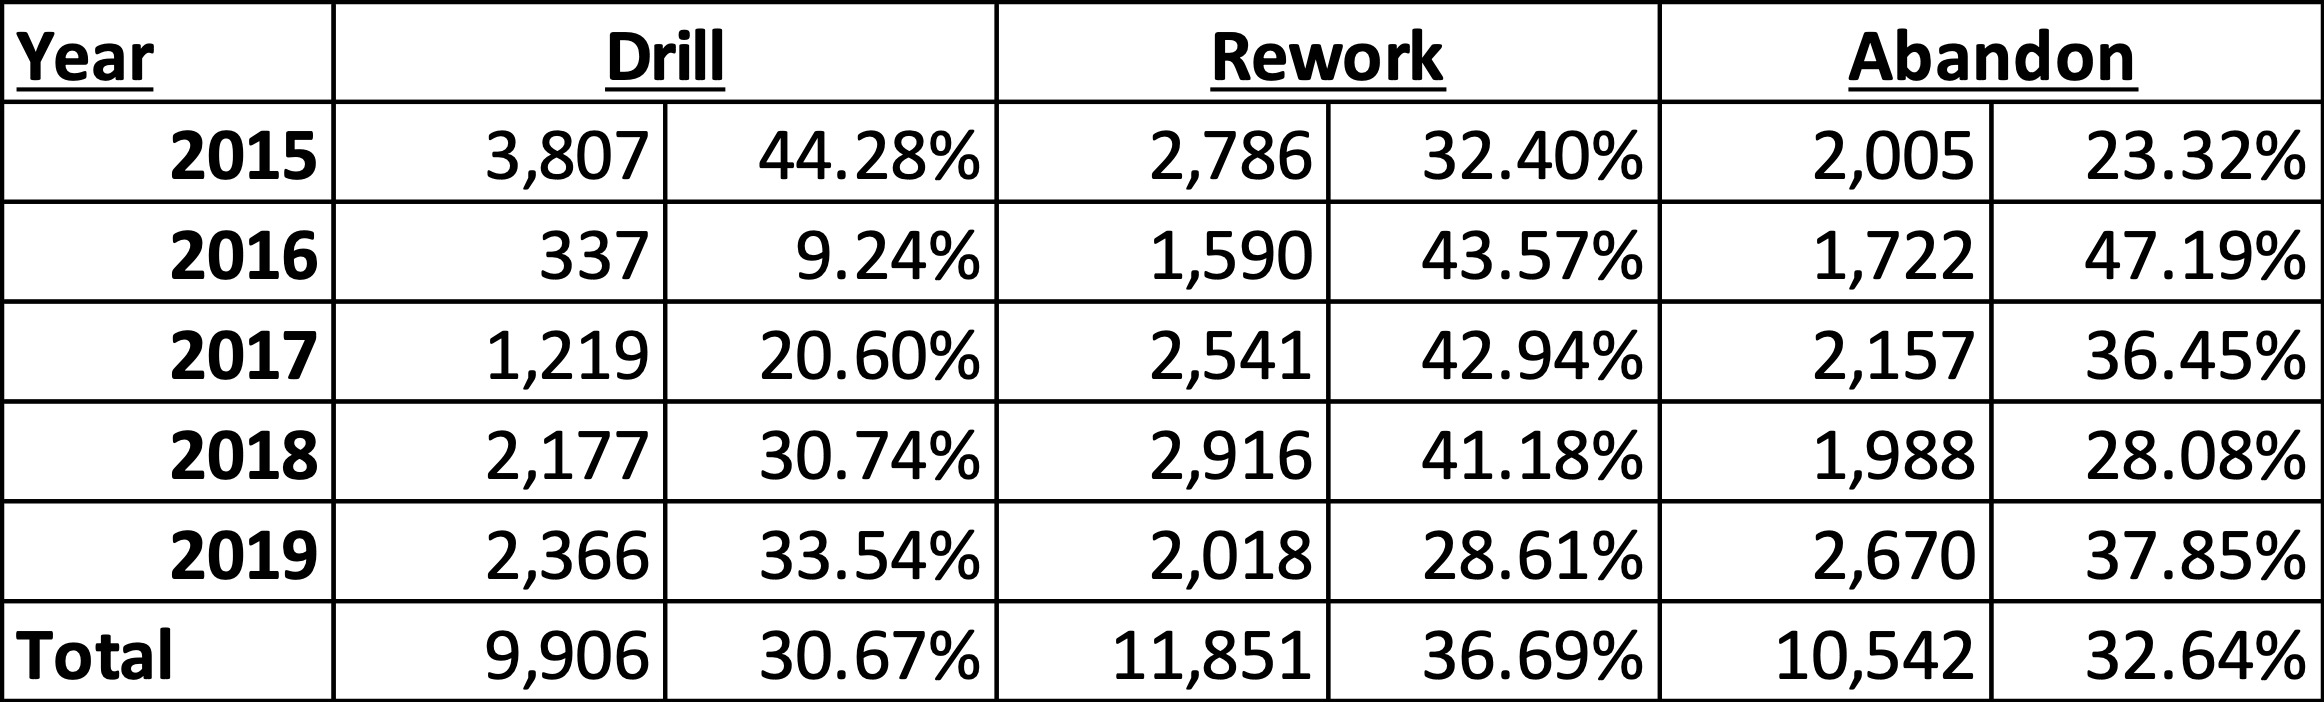
Table 1. Breakdown of permit types issued by California Geologic Energy Management Division (CalGEM), formerly the California Division of Oil, Gas, and Geothermal Resources (DOGGR), 2015-2019.
The illegal Kern County ordinance took effect in 2015, and permit counts for Kern County are shown in Table 2 and Figure 2 below. Note the permit count increase from 2014 to 2015 in the graph in Figure 2. The data shows that Kern County permitting counts increased in 2015 with the passage of the illegal ordinance. In 2016, a new statewide rule (State Bill 4) took effect regulating hydraulic fracturing. Since most oil and gas drilling in California was using hydraulic fracturing, permit numbers statewide, including in Kern, fell drastically. Since 2016, permitting rates have been climbing back up to pre-2016 levels. As of May 18, 2020, Kern County has already approved 1,310 new drilling permits, putting Kern County on track to meet or exceed 2015 permit numbers.
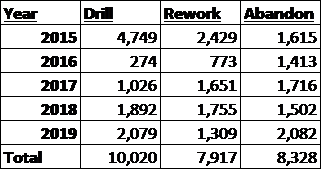
Table 2. Breakdown of permit types issued by California Geologic Energy Management Division (CalGEM) in Kern County alone, 2015-2019.
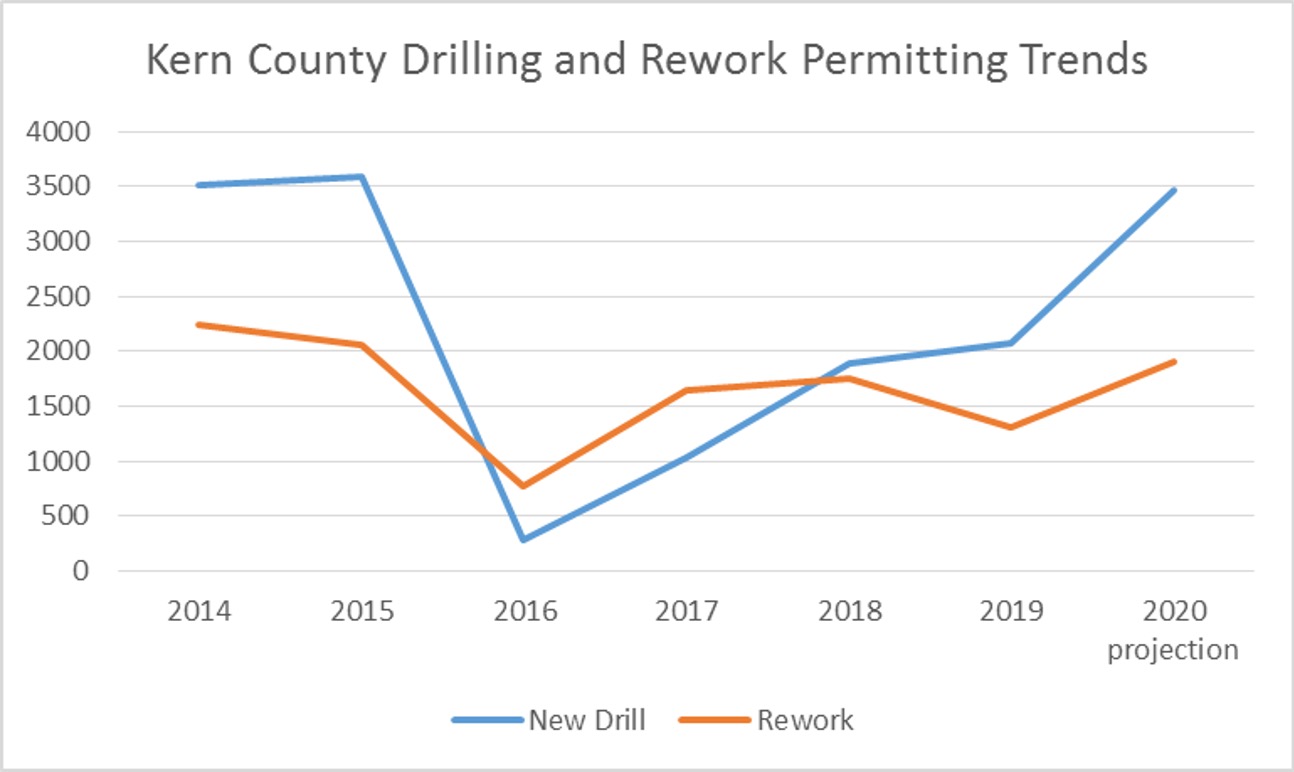
Figure 2. Time Series of drilling permits issued by Kern County, California, 2014 to present.
Kern County is the most heavily drilled county in the United States, and from 2015 to 2019 well permits were issued in Kern at elevated numbers as compared to the rest of the state. From the implementation of the ordinance (2014 to 2015), the proportion of drilling permits issued by Kern County increased from 82% to 94% of the state total. In Figure 3 below, the time series shows that Kern County makes up the majority of permits issued to drill new wells in California, and the proportion of wells drilled in Kern County has been higher from 2015 to 2019 than it had been prior. Not only did the ordinance allow permits to be drilled without any consideration for the community and public health impacts of Frontline Communities, but the actual numbers and proportions of wells drilled in Kern County increased as well. We have mapped these permits in Figure 3 below to show exactly where they are located.
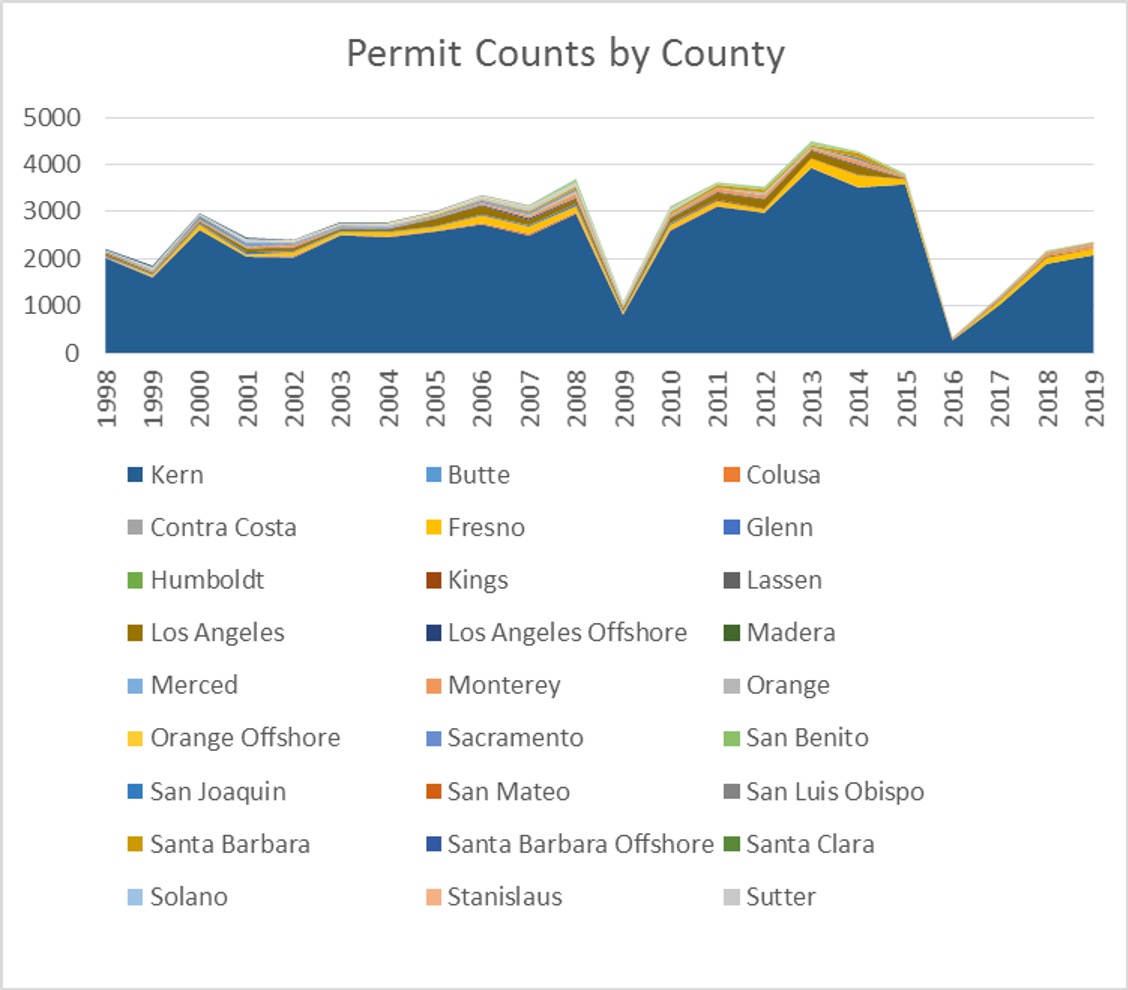
Figure 3. Time series of permits issued to drill new wells in California from 1998 to 2019. The contribution of individual counties is shown with different colors, the area under the trend line representing the cumulative total.
The locations of well permits were mapped using GIS software and overlaid with indicators of social and environmental justice. The layers of Environmental Justice (EJ) mapping data were derived from CalEnviroScreen 3.0 census tract data, assigned to the block level, and 2015 American Community Survey demographical data, also summarized at the census block data.
One of the major failings of the Kern County ordinance was the lack of risk communication with Frontline Communities. Not only were communities not informed of proposed drilling projects, all communications from Kern County and CalGem have been posted solely in English. Any attempts at communication of impacts and notices have excluded non-English speakers. Providing notices and information in non-English languages, at the very least in Spanish, needs to be a top priority for any regulatory body in California. The current permitting policy leverages systematic racism to preclude communities from participating in the decision-making processes that directly affect their families’ health.
As shown below in map in Figure 4, the majority of Kern County ranks high in “linguistic isolation” according to CalEnviroScreen 3.0. Our analysis shows that 11,244 permits were issued in block groups that CalEnviroscreen 3.0 has ranked in the top 60th percentile for linguistic isolation. A total 16,143 permits were issued in block groups that are 40% or more Hispanic, and that number increases to 18,000 (98.1%) permits if you include the permits issued in the Midway-Sunset Field, located on the border of one of Kern’s largest, and predominantly “Hispanic,” census block groups.
View map fullscreen | How FracTracker maps work
Figure 4. Map of Oil and Gas Permits with Kern County “Hispanic” Demographics and Language Disparities. The shades of yellow to red census blocks represent the 60th percentile and above linguistic isolation. Hatched census tracts are census blocks with demographical profiles over 40% Hispanic.
Within Kern County, these permits were approved mostly in low income areas, and areas with pre-existing environmental degradation. In the map in Figure 5, below, permit locations were overlaid with CalEnviroScreen 3.0 rankings for existing environmental degradation and median income data from the American Community Survey (2015) to visually show the disparity.
Our analysis shows that 17,978 0f the 18,356 total drilling and reworking permits were issued in census block groups where the median income was at least 20% lower than that of Kern County (Kern median income = $51,579). Additionally, these areas are more impacted by existing sources of pollution. In fact, 18,298 (99.7%) permits were issued in census blocks designated as the above the 60th percentile of those suffering from existing pollution burden by CalEnviroScreen 3.0.
View map fullscreen | How FracTracker maps work
Figure 5. Map of oil and gas permits with Kern County environmental justice areas. Shown in shades of blue are the block groups with median incomes less than 80% of that of the Kern County ($51,579). The hatched areas are above the 60th percentile for CalEnviroScreen pollution burden.
Our results find that from 2015-2019, very few well permits were issued in census blocks that are predominantly white, with median incomes above the median, and low rankings of linguistic isolation. The policies enacted by Kern County to fast track permits were instituted in predominantly poor, linguistically isolated, Hispanic communities already suffering from existing environmental degradation. Through systematic racism, these areas have become Kern County’s “sacrifice zones.” Moving forward, we are pressuring Kern County to adopt a permitting approach that considers the health of Frontline Communities.
Unfortunately, since the court’s decision, well permitting in Kern County has not only continued, but actually accelerated. While the appellate court ordered permitting to stop for one month, the gap was quickly filled. Between March 28 and May 18, 2020; CalGEM approved 733 permits to drill new wells and rework existing wells in Kern County. In addition, CalGEM approved 38 new fracking permits in 2020 since March 28th, all in Kern County (regulated separately under State Bill 4), increasing the environmental burden on Kern communities further. Like Kern County, CalGEM’s permitting process also deserves scrutiny, as state permitting requirements are lax.
These irresponsible policies have had a direct impact on the health of Central Valley communities. Environmental monitoring has shown time and again that emissions from oil and gas wells include a cocktail of air toxics and carcinogens, and that living near oil and gas activity has been shown to be associated with numerous health impacts such as low birth weight, cancer, skin problems, asthma, and depression, The exclusion of Spanish-speaking residents from notifications and information on decisions that affect their health is an even further condemnation of the systematic and outright racism of Kern County’s permitting approach.
There is more work to be done, but the elimination of Kern County’s fast-tracking ordinance is a major win for public health and democracy.
FracTracker Alliance would like to congratulate the organizations responsible for this legislative victory and thank them for all their hard work. They include Committee for a Better Arvin, Committee for a Better Shafter, and Greenfield Walking Group, represented by the Center on Race, Poverty & the Environment, together with the Center for Biological Diversity, and Sierra Club, who was represented by Earthjustice.
By Kyle Ferrar, MPH, Western Program Coordinator, FracTracker Alliance
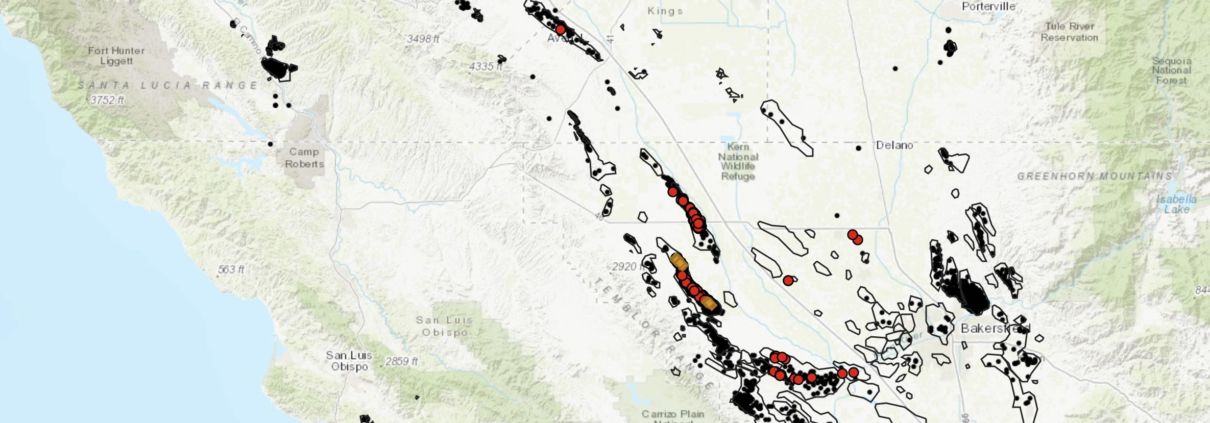
California is once again a fracked state. The moratorium on well stimulations (hydraulic fracturing and acidizing) that lasted since June 26, 2019 has now come to an end. As of April 3rd, 2020, California’s oil and gas regulatory body, California Geological Energy Management Division (CalGEM), approved 24 new permits to frack new wells. The wells were permitted to the operator Aera Energy. Well types to be fracked include 22 oil and gas production wells and 2 water flood wells; 18 of which are in the South Belridge Field and 6 North Belridge Field. Locations of the wells are shown in the map in Figure 1, and are mapped with the rest of 2020’s approved well drilling and rework permits in Consumer Watchdog’s updated release on NewsomWellWatch.com. Please read our press release with Consumer Watchdog here!
Figure 1. Map of New Fracking Permits in California
View map fullscreen | How FracTracker maps work
Fortunately, these 24 approved well stimulation permits are not located in close proximity to communities that would be directly impacted by the negative contributions to air quality and potential groundwater quality degradation that result from drilling and stimulating oil and gas wells. Regardless of where oil and gas wells and stimulations are permitted in relation to Frontline Communities, these wells will still degrade the regional air quality of the San Joaquin Valley. The San Joaquin Valley has the worst air quality in the country. According to the U.S. EPA, oil and gas production is a main contributor of volatile organic compounds (VOC’s) and NOX in the Valley. In addition to VOC’s being carcinogens, these pollutants are precursors to the ozone and smog that cause health impacts such as asthma, chronic obstructive pulmonary disease (COPD), cardiovascular disease, and negative birth outcomes.
Additionally, the dolomite formations where these 24 stimulations were permitted have also experienced the same type of oil seeps and spills (known as surface expressions) as the Cymric Field just to the south. Readers may remember the operator Chevron spilling 1.3 million gallons of oil and wastewater in an uncontrollable seep resulting from high pressure injection wells.
Whereas Governor Newsom may have put a halt to unpermitted high-pressure injections, regulators have just approved permits for 24 new fracking operations, a.k.a well stimulations. The irony here is that risks inherent in the fracking process in California include the same risks associated with high pressure steam injection operations. Both techniques elevate the downhole pressure of a well to the point that the formation “source” rock is fractured. These techniques increase the likelihood of downhole communication with other surrounding wells, both active and plugged. Downhole communication events between wells, in this case known as “frack hits” are a major cause of well casing failures and blowouts, which in turn are the primary cause of surface expressions. Simply put, high pressure injections in over-developed oil fields result in spills, and in this case, these 24 permitted stimulations are within 1,500’ of over 7,000 existing wells, a distance specifically identified by CalGEM as a high-risk zone for downhole communication between wells.
So how did these wells get approved? Here’s the story, as told by CalGEM:
In November, CalGEM requested a third-party scientific review of pending well stimulation permit applications to ensure the state’s technical standards for public health, safety and environmental protection are met prior to approval of each permit. To ensure the proposed permits comply with California law, including the state’s technical standards to protect public health, safety, and environmental protection, the Department of Conservation asked experts at the Lawrence Livermore National Laboratory (LLNL) to assess CalGEM’s permit review process. LLNL also evaluated the completeness of operators’ application materials and CalGEM’s engineering and geologic analyses.
The independent scientific review is one of Governor Newsom’s initiatives to ensure oil and gas regulations protect public health, safety, and environmental protection. This review, which assesses the completeness of each proposed hydraulic fracturing permit, is taking place as an interim measure while a broader audit is completed of CalGEM’s permitting process for well stimulation. That audit is being completed by the Department of Finance Office of Audits and Evaluation (OSAE) and will be completed and shared publicly later this year. LLNL experts are continuing evaluation on a permit-by-permit basis and conducting a rigorous technical review to verify geological claims made by well operators in the application process. Permit by permit review will continue until the Department of Finance Audit is complete later this year.
LLNL’s scientific review of the permit applications and process found that the permitting process met statutory and regulatory requirements. LLNL found, however, that CalGEM could improve its evaluation of the technical models used in the permit approval process. As a result, CalGEM now requires all operators to provide an Axial Dimensional Stimulation Area (ADSA) Narrative Report for each oilfield and fracture interval which must be validated by LLNL and conform to the new CalGEM permitting process. This will improve CalGEM’s ability to independently validate applicants’ fracture modeling.
While this sounds like a methodological approach to the permitting process, it is still flawed in several ways. First and foremost, there is still no process for community input, let alone community decision-making. Community stakeholders are not engaged at in point in this process. Furthermore the contribution of oil and gas extraction operations to the degradation of environmental quality is already well established. In the case of these 24 fracking permits, they will contribute to the further degradation of regional air quality and continue the legacy of groundwater contamination within the sacrifice zone surrounding the Belridge fields.
While we are critical of Governor Newsom’s climate-changing oil extraction policies, FracTracker would like to recognize the leadership Governor Newsom has shown instituting responsible policies to keep Californians as safe as possible and protected from the threat of COVID-19. While there can still be more done to provide relief for the most financially vulnerable, such as instituting a rent moratorium for those that do not own their own homes, California leads as an example for the public health interventions that need to be instituted nation-wide. The Governors inclusion of undocumented citizens in the state’s economic stimulus program is a first step, and FracTracker Alliance fully supports increasing the amount to at least match the $1,200 provided to the rest of Californians.
Regardless, the threat of COVID-19 cannot be addressed in a vacuum. Threats of infection are magnified for Frontline Communities. Living near oil and gas operations exposes communities to a cocktail of volatile organic compounds that suppress the immune system, increasing the risk of contracting viral lung infections. Frontline Communities are therefore particularly vulnerable to the threat of COVID-19. California and Governor Newsom need to consider the public health implications of permitting new fracking and new oil and gas wells, particularly those permits within 2,500’ of hospitals, schools, and other sensitive sites, above all during an existing pandemic.
By Kyle Ferrar, MPH, Western Program Coordinator, FracTracker Alliance
![]()
216 Franklin St, Suite 400, Johnstown, PA 15901
Phone: +1 (717) 303-0403 | info@fractracker.org
FracTracker Alliance is a 501(c)3 non-profit: Tax identification number: 80-0844297