CalGEM Permit Review Q4 2022: Oil Permit Approvals Show Steep Rise Within Protective Buffer Zones
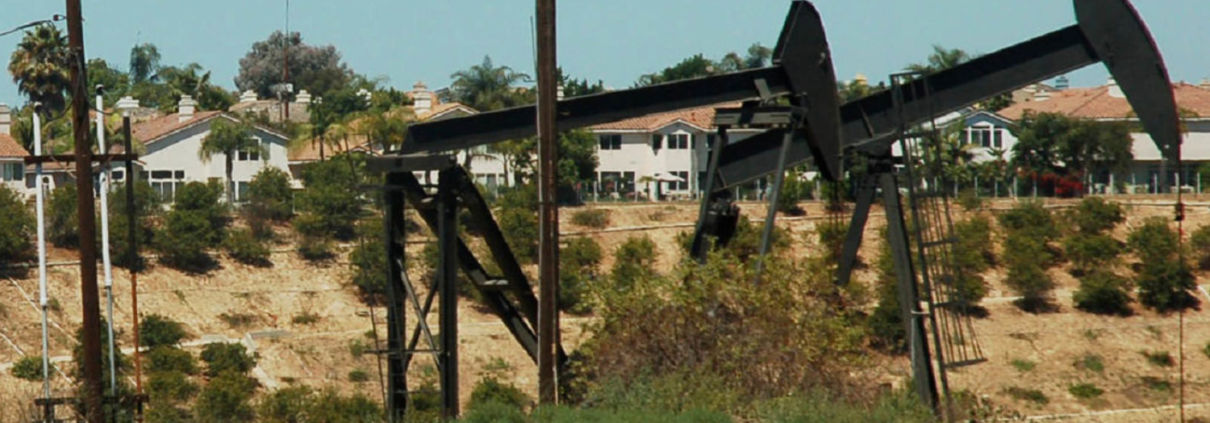
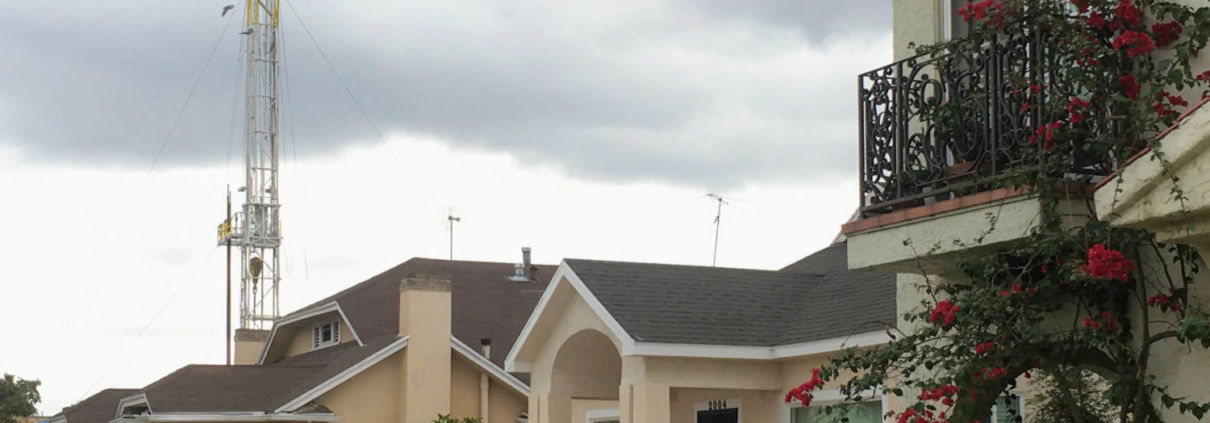
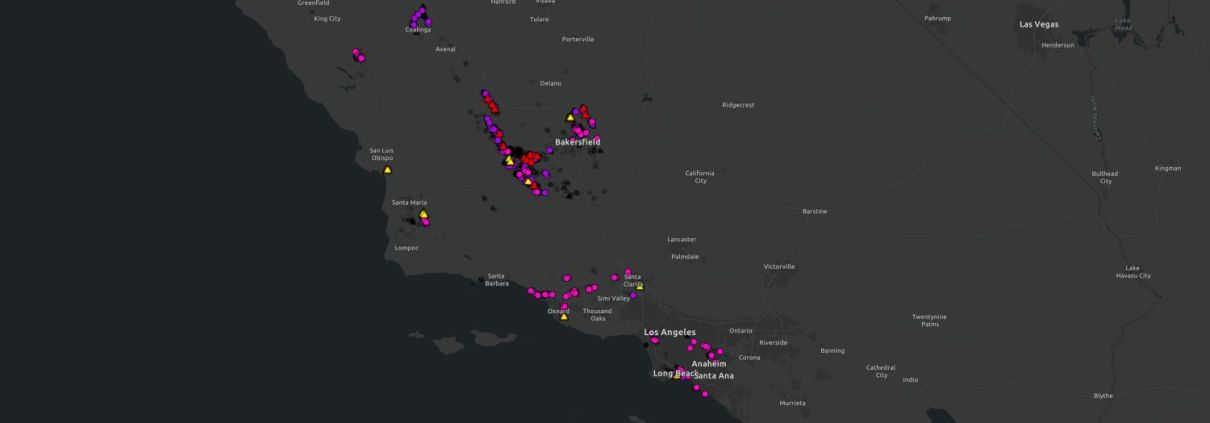
During the fourth quarter of 2022, California regulator CalGEM issued oil and gas operators 222 new drilling permits, an increase of over 750% compared to the fourth quarter of 2021. Of those, nearly half (100; 47%) were for wells located within the 3,200’ public health setback zone.