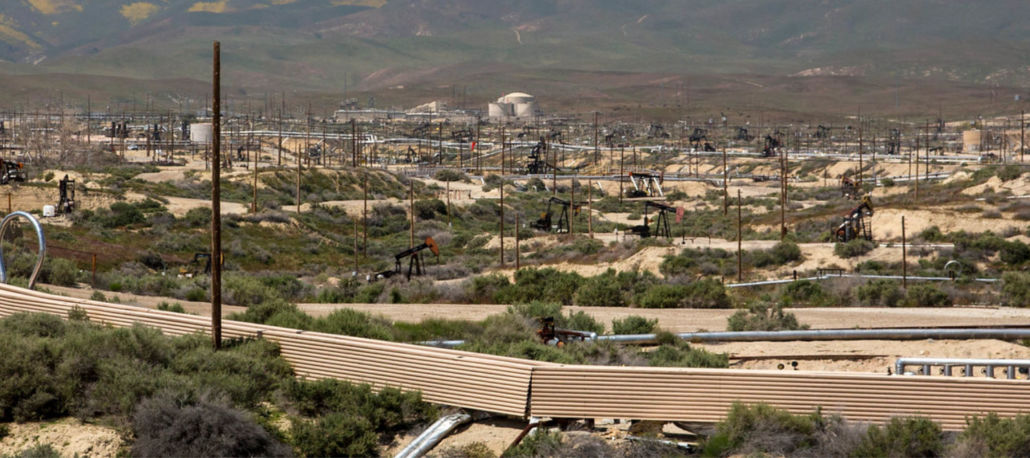
 https://www.fractracker.org/a5ej20sjfwe/wp-content/uploads/2021/07/California-oil-fields-feature.jpg
667
1500
Kyle Ferrar, MPH
https://www.fractracker.org/a5ej20sjfwe/wp-content/uploads/2025/09/2025-Wordmark-Logo.png
Kyle Ferrar, MPH2025-08-26 17:36:222025-08-27 21:56:28California’s New Oil Wells Average 13.5 Barrels/Day — Far Below State Projections
https://www.fractracker.org/a5ej20sjfwe/wp-content/uploads/2021/07/California-oil-fields-feature.jpg
667
1500
Kyle Ferrar, MPH
https://www.fractracker.org/a5ej20sjfwe/wp-content/uploads/2025/09/2025-Wordmark-Logo.png
Kyle Ferrar, MPH2025-08-26 17:36:222025-08-27 21:56:28California’s New Oil Wells Average 13.5 Barrels/Day — Far Below State ProjectionsImplications of a 3,200-Foot Setback in California
Overview
FracTracker completed a geospatial analysis of the projected impact of a 3,200-foot public health setback from oil and gas extraction operations, as defined by the CalGEM draft rule. We outline the most significant results of this analysis below, followed by a more thorough discussion with maps, tables, and then methods.
Well Counts:
Of the 103,890 wells listed as unplugged/operational (active/idle/new) in the CalGEM “AllWells” dataset, 28,367 (27.3%) wells are within 3,200 feet of a sensitive receptor. The status of the wells include:
- 14,665 active oil and gas wells (24.3%)
- 11,942 idle oil and gas wells (31.0%)
- 744 new oil and gas wells (15.2%)
Permit Counts:
For the timespan January 1, 2021—December 31, 2021:
- Of the 542 new drilling permits issued by CalGEM, 120 (21%) were within the 3,200’ setback zone
- Of the 1,519 rework permits issued by CalGEM, 375 (7%) were within the 3,200’ setback zone, including permits for deepening and sidetrack operations
- Of the 3,464 well abandonment (plugging) permits issued by CalGEM, 603 (14%) were within the 3,200’ setback zone
New Drilling:
For the two-year time period of January 1, 2020—December 31, 2021, of the 1,110 new wells drilled, 123 (11.1%) were within the 3,200’ setback zone.
Production:
According to CalGEM, wells within the 3,200-foot setback zone produced:
- In 2019, 36,818,994 bbls of oil/condensate; 23.54% of the total 156,402,018 bbls
- In 2020, 33,789,523 bbls of oil/condensate; 23.86% of the total 141,638,219 bbls.
Demographics:
According to US Census Bureau 5-year (2014-2019) American Community Survey Census Block level data:
- 2,763,383 Californians live within 3,200 feet of an operational oil and gas well
- Non-white (including Hispanic or Latino) Californians account for 69% of total
- Children under 5 years of age account for 5.9% of total
- Children under 18 years of age account for 21.4% of total
Introduction
Californians living near oil and gas extraction operations and the associated industrial build-out are at increased risk of a variety of negative health effects, with pregnant mothers particularly vulnerable to negative birth outcomes and severe birth defects.
California researchers have shown exposure to harmful air pollutants is associated with living near oil and gas drilling and extraction (exploration and production) operations1. These exposures put Frontline communities at risk of a variety of negative health impacts, and particularly threaten healthy pregnancies. Pregnant individuals living near oil and gas drilling face an increased risk of negative birth outcomes, such as low birth weight and pre-term birth2,3. Babies born to mothers in these areas also are at an elevated risk of serious birth defects, including congenital heart defects and neural tube defects4,5.
California is the only major oil production state without a public health setback to protect communities and individuals from exposure to harmful emissions and other forms of environmental degradation originating from oil and gas drilling and extraction operations. The proposed 3,200-foot setback draft regulation is a vital public health intervention that begins to address the environmental health disparities experienced by Frontline communities. Separating communities from industrial oil and gas extraction operations will reduce Frontline exposures to localized air pollution, including toxic and carcinogenic volatile organic compounds (VOCs), such as BTEX chemicals and other polycyclic aromatic hydrocarbons (PAHs).
While the set of rules proposed by Governor Newsom and the California department of Geological Energy Management (CalGEM) do not address existing extraction sites, it is important to understand how much oil production is currently derived from the areas within the setback zone—as well as the population counts and demographic profiles of the communities living within this zone. Insight into the reduction of future production is inferred by determining the proportions of new drilling permits issued within the setback zone. Using the locations of both existing extraction sites and new drilling permits, this assessment also reviews the implications of loopholes included in the proposed rule, in § 1765. Setback Exclusion Area. Section B. Methods used in this analysis are found at the end of this report.
Well Counts, Permits, and Production
A breakdown by county of operational well counts, permits, and production numbers are listed in Table 1 below. This provides a basic overview of the regions with the most wells, closest to communities and population density. Statewide well counts, production figures, and permit count totals are listed above, in the Overview section. For specific locations, an interactive map of existing wells and new permits issued within the setback distance is shown in the map below in Figure 1. The interactive web map version allows users to navigate the extent of the proposed 3,200’ setback boundary, and to investigate the presence of existing operational oil and gas wells, as well as new drilling activity and CalGEM approved permits.
Table 1. County well count, permitting, and production summaries. Well counts, permit counts, and production volumes (2019 and 2020) were summed by county for wells/permits within 3,200’ of a sensitive receptor. Permit counts combine the years 2020 and 2021. The percentages of each category within the 3,200’ setback are included in parentheses.
Click to expand Table 1
| County | Operational Wells | 2019 Oil/Condensate Bbls | 2020 Oil/Condensate Bbls | New Drilling Permits 2020-2021 | Rework Permits 2020-2021 | |||||
|---|---|---|---|---|---|---|---|---|---|---|
| Percentage | Count | Percentage | Count | Percentage | Count | Percentage | Count | Percentage | Count | |
| Kern | 16.00% | 12,288 | 14.10% | 15,524,131 | 15.10% | 14,995,204 | 10.10% | 236 | 15.50% | 318 |
| Los Angeles | 94.40% | 6,615 | 90.90% | 10,655,679 | 88.90% | 9,282,322 | 97.40% | 38 | 92.40% | 159 |
| Ventura | 49.00% | 1,981 | 44.10% | 2,806,139 | 41.60% | 2,519,757 | 0 | 59.80% | 73 | |
| Orange | 94.10% | 1,712 | 98.50% | 2,517,858 | 99.10% | 2,308,839 | 100% | 5 | 93.20% | 41 |
| Santa Barbara | 57.40% | 1,442 | 59.20% | 1,729,593 | 51.60% | 1,329,020 | 0 | 25.70% | 59 | |
| Los Angeles (OS) | 36.30% | 509 | 37.90% | 2,226,649 | 36.70% | 2,211,905 | 100% | 4 | 26.40% | 24 |
| Monterey | 26.60% | 405 | 10.90% | 911,167 | 9.40% | 695,969 | 57.10% | 16 | 64.40% | 38 |
| Fresno | 7.20% | 341 | 2.10% | 130,509 | 2.20% | 123,596 | 3.80% | 4 | 3.70% | 3 |
| San Luis Obispo | 59.00% | 297 | 70.00% | 361,449 | 73.40% | 371,057 | 70.60% | 12 | 71.40% | 10 |
| Sutter | 66.40% | 271 | 0 | 0 | 0 | 83.90% | 26 | |||
| Glenn | 80.60% | 245 | 0 | 0 | 66.70% | 4 | 100% | 2 | ||
| San Joaquin | 93.80% | 227 | 0 | 0 | 0 | 0 | ||||
| Colusa | 59.90% | 212 | 0 | 0 | 100% | 3 | 86.40% | 19 | ||
| Sacramento | 74.80% | 154 | 91.00% | 7,961 | 89.50% | 7,345 | 0 | 63.60% | 7 | |
| Solano | 59.70% | 129 | 49.50% | 866 | 56.30% | 801 | 0 | 45.50% | 5 | |
| Tehama | 71.70% | 109 | 0 | 0 | 0 | 0 | ||||
| Tulare | 98.00% | 98 | 100% | 35,380 | 100% | 29,179 | 0 | 0 | ||
| San Bernardino | 89.30% | 67 | 100% | 8,791 | 100% | 7,067 | 0 | 0 | ||
| Kings | 13.40% | 53 | 25.90% | 31,343 | 24.10% | 28,952 | 0 | 0 | ||
| Ventura (OS) | 88.90% | 48 | 96.00% | 1,013 | 79.70% | 451 | 0 | 0 | ||
| Contra Costa | 91.80% | 45 | 100% | 58,078 | 100% | 52,445 | 0 | 42.90% | 3 | |
| Humboldt | 65.50% | 36 | 0 | 0 | 0 | 0 | ||||
| San Mateo | 100% | 36 | 100% | 46 | 100% | 43 | 0 | 0 | ||
| Madera | 25.60% | 10 | 0 | 0 | 0 | 0 | ||||
| San Diego | 93.50% | 29 | 0 | 0 | 0 | 0 | ||||
| Butte | 96.30% | 26 | 0 | 0 | 0 | 100% | 8 | |||
| Yolo | 35.70% | 25 | 0 | 0 | 0 | 100% | 1 | |||
| Riverside | 82.10% | 23 | 0 | 0 | 0 | 0 | ||||
| Alameda | 100% | 10 | 100% | 7,038 | 100% | 3,388 | 0 | 0 | ||
| San Benito | 19.20% | 10 | 5.40% | 788 | 8.90% | 927 | 0 | 0 | ||
| Santa Clara | 35.70% | 10 | 0 | 0 | 0 | 0 | ||||
| Imperial | 53.80% | 7 | 0 | 0 | 0 | 0 | ||||
| Santa Barbara (OS) | 8.80% | 5 | 0 | 0 | 0 | 0 | ||||
| Napa | 66.70% | 4 | 0 | 0 | 0 | 0 | ||||
| Stanislaus | 57.10% | 4 | 0 | 0 | 0 | 0 | ||||
| Merced | 100% | 3 | 0 | 0 | 0 | 0 | ||||
| Lake | 100% | 1 | 0 | 0 | 0 | 0 | ||||
| Lassen | 100% | 1 | 0 | 0 | 0 | 0 | ||||
| Siskiyou | 100% | 1 | 0 | 0 | 0 | 0 |
California 3,200′ Setbacks Analysis of CalGEM Wells, Permits, and Drilling
Figure 1. Map of wells and permits within the 3,200-foot setback zone. The map shows the locations of existing operational (active/idle/new) oil and gas wells, and the locations of approved drilling permits (2020-2021) found within the proposed 3,200-foot setback. View the map “Legend” and “About” tabs below by clicking the icon (the three horizontal lines) in the top left corner to learn more. Research methods and data sources are listed at the end of this article.
View Full Size Map | Updated 3/28/2022 | Map Tutorial
Counties with the highest counts of operational wells within the 3,200’ setback were also consistently the same counties with the largest volumes of production of oil/condensates from within the setback zone. These include Kern, Los Angeles, Ventura, Orange, and Santa Barbara Counties, in that order. The top five overall producing counties are Kern, Los Angeles, Monterey, Ventura, and Fresno, in that order. This shows that Orange and Santa Barbara Counties have disproportionate amounts of production from within the 3,200’ setback zone.
Kern is also the county with the most new drilling and rework permits issued within the setback zone. While Kern was issued nearly as many new drilling permits as rework permits in total, rework permits in the setback zone outnumbered new drilling permits by 31%. Los Angeles, Ventura, Orange, and Santa Barbara Counties similarly issued a larger majority of rework permits in the setback zone.
This trend speaks to operators keeping aging wells in Frontline communities operating at minimum capacities to avoid the closure costs of plugging and remediation, where they remain a source of exposure to uncontrolled emissions. Plugging and site remediation costs are typically much more expensive for wells located in neighborhoods and near homes.
In total, 23.6% of new drilling permits and 27.8% of rework permits were issued within the boundaries of the proposed setback. A lesser percentage of well plugging and abandonment permits (19.6%) were issued for areas located within the setback distance.
New Well Drilling and Well Plugging
In addition to permits issued by CalGEM, data on the actual counts of new wells drilled (spudded) were also assessed. During the two-year period between January 1, 2020, and December 31, 2021, California operators drilled 1,110 new wells; of those, 123 (11.1%) were located within the 3,200’ setback zone. The majority of wells drilled in the setback zone were located in Kern County (102), with the rest in Monterey (10), Los Angeles (5), San Luis Obispo (5), and Fresno (1) Counties. The locations of these drilled wells are shown in the map in Figure 1.
Census Demographics and Environmental Justice
Table 2 below reports the population estimate and census demographics for the areas within 3,200 feet of an operational oil and gas well. FracTracker used United States Census Bureau 5-year (2014-2019) American Community Survey census block group data to summarize population counts and ethnicities of the populations living within the 3,200’ setback.
This assessment specifically summarized the total population counts of non-white individuals, to focus on the disparate impacts for People and Communities of Color. Non-white Californians are more likely to have oil and gas wells drilled in their communities or near the schools they attend as children. These same communities make up a disproportionate percentage of the population living within 3,200’ of an operational oil and gas well. Statewide, People of Color account for 69% of the population living within the proposed setback, compared to under 63% for the entire state.
Two categories of age-related population counts (children under age 5 and individuals under age 18) were also included in this short environmental justice overview. Children are a vulnerable cohort of the population, particularly sensitive to environmental degradation that can affect development. Exposure to air pollutants at a young age is associated with the development of asthma, particularly in children6. The data shows Frontline communities in Stanislaus and Kings Counties have higher populations of children living near operational oil and gas wells. The particular risks to children in these communities should be addressed.
Table 2. California population counts and demographics for areas within 3,200 feet of an operational oil and gas well. This analysis used data from the US Census Bureau’s American Community Survey 5-year (2014-2019) to determine the counts of Californians living within the 3,200’ setback zone of an operational oil and gas well. Population counts and specific demographics are summed at the county level.
Click to expand Table 2
| County | Total Population Count | Non-white population incl. Hispanic or Latino | Population under 5 years of age | Population under 18 years of age | |||
|---|---|---|---|---|---|---|---|
| Pop. Count | (%) | Pop. Count | (%) | Pop. Count | (%) | ||
| Los Angeles | 1,893,442 | 1,446,649 | 76.40% | 111,522 | 5.90% | 397,272 | 21.00% |
| Orange | 425,753 | 197,904 | 46.50% | 22,963 | 5.40% | 85,761 | 20.10% |
| Kern | 123,922 | 71,709 | 57.90% | 9,479 | 7.60% | 35,922 | 29.00% |
| San Diego | 114,470 | 66,759 | 58.30% | 6,344 | 5.50% | 23,274 | 20.30% |
| Ventura | 60,896 | 32,942 | 54.10% | 3,618 | 5.90% | 13,240 | 21.70% |
| Riverside | 38,563 | 25,593 | 66.40% | 2,932 | 7.60% | 9,686 | 25.10% |
| San Bernardino | 31,419 | 22,446 | 71.40% | 1,977 | 6.30% | 7,734 | 24.60% |
| Santa Barbara | 31,323 | 18,725 | 59.80% | 2,357 | 7.50% | 7,370 | 23.50% |
| San Joaquin | 9,738 | 7,532 | 77.30% | 534 | 5.50% | 2,458 | 25.20% |
| Contra Costa | 8,829 | 5,180 | 58.70% | 625 | 7.10% | 2,369 | 26.80% |
| Fresno | 5,248 | 2,970 | 56.60% | 384 | 7.30% | 1,348 | 25.70% |
| Solano | 4,035 | 1,314 | 32.60% | 112 | 2.80% | 660 | 16.30% |
| Stanislaus | 2,082 | 977 | 46.90% | 246 | 11.80% | 732 | 35.20% |
| Colusa | 2,035 | 1,475 | 72.50% | 162 | 8.00% | 590 | 29.00% |
| Alameda | 1,591 | 614 | 38.60% | 50 | 3.20% | 354 | 22.20% |
| Glenn | 1,222 | 330 | 27.00% | 71 | 5.90% | 294 | 24.00% |
| Tulare | 1,154 | 805 | 69.70% | 67 | 5.80% | 307 | 26.60% |
| Yolo | 1,049 | 479 | 45.60% | 76 | 7.30% | 292 | 27.80% |
| Sutter | 954 | 280 | 29.30% | 47 | 4.90% | 240 | 25.20% |
| Kings | 924 | 880 | 95.20% | 94 | 10.20% | 361 | 39.00% |
| Tehama | 885 | 316 | 35.70% | 23 | 2.60% | 177 | 20.00% |
| San Benito | 753 | 644 | 85.50% | 64 | 8.40% | 173 | 23.00% |
| Sacramento | 608 | 235 | 38.60% | 17 | 2.90% | 92 | 15.20% |
| Lake | 463 | 216 | 46.70% | 50 | 10.80% | 185 | 39.90% |
| Santa Clara | 462 | 66 | 14.30% | 16 | 3.40% | 107 | 23.20% |
| San Mateo | 420 | 246 | 58.60% | 19 | 4.60% | 103 | 24.50% |
| San Luis Obispo | 329 | 42 | 12.80% | 12 | 3.60% | 64 | 19.40% |
| Humboldt | 279 | 22 | 8.00% | 7 | 2.60% | 43 | 15.50% |
| Merced | 209 | 123 | 59.00% | 14 | 6.90% | 60 | 28.60% |
| Madera | 125 | 67 | 53.60% | 8 | 6.40% | 30 | 24.10% |
| Napa | 54 | 9 | 15.90% | 2 | 4.30% | 10 | 18.40% |
| Imperial | 46 | 37 | 80.40% | 4 | 8.70% | 8 | 18.30% |
| Monterey | 41 | 16 | 39.30% | 3 | 7.20% | 10 | 25.60% |
| Butte | 34 | 10 | 30.50% | 2 | 4.60% | 5 | 13.90% |
| Santa Cruz | 15 | 3 | 21.00% | 0 | 1.60% | 2 | 15.90% |
| Siskiyou | 9 | 2 | 19.00% | 0 | 3.60% | 1 | 14.60% |
| Lassen | 2 | 0 | 17.00% | 0 | 7.40% | 0 | 15.20% |
Of note, FracTracker Alliance’s previous People and Production report more accurately describes the economic and ethnographic disparities associated with living near oil and gas drilling, and geographically characterizes the Frontline communities without the limitations of defined setback distances. The results of that report do not suffer from edge effects or the pitfalls of assuming uniform population distributions.
Loopholes
Of particular concern is a potential caveat in section (a) of the draft rule under subheading § 1765. Setback Exclusion Area, which states:
“(a) After [EFFECTIVE DATE], CalGEM will not approve any Notice of Intention to drill a new well with a new surface location within the setback exclusion area, except a well, such as an intercept well or a pressure relief well, that must be drilled to alleviate an immediate threat to public health and safety or the environment.”
The draft rule then defines a new well as “a new boring that involves installation of surface casing where none existed previously.” This language allows for well re-drills, such as permits to “deepen” and “sidetrack” well bores from below the surface casing.
This would allow for major expansions of existing wells, including increases of production volumes and uncontrolled emissions from within the setback zone, under the guise of “rework” permits. These activities do not require new API identifiers or new surface casings, but would allow for directional or horizontal drilling, potentially with high counts of laterals similar to what is being practiced in the Marcellus and other shale plays. This leaves the door open for major industrial activity and drilling expansion from within the setback zone, and even incentivizes these alternative methods of extraction that are typically more hazardous for regional air quality, public health, and climate health. Preventing this type of activity may involve expanding the rule to prevent certain types of rework permits for existing sites.
The Take Away
California oil and gas production has been declining steadily since the state’s “peak oil” phase, which climaxed in 1985. The production decline rate has remained steady at about seven percent per year, with small fluctuations caused by factors such as the Covid-19 pandemic and changes in the price of crude. Control of production figures in California has been dominated by the market price of oil, rather than environmental policy or public health protections. Overall, oil production data spanning through 2021 shows California continues to consistently produce crude oil as a major extraction state.
Similarly, since Gov. Newsom took office, the number of new drilling permits issued is comparable to the number issued under his oil-friendly predecessor, Governor Brown. The consistent production decline has not impacted permitting rates—or vice versa—as permitting rates for drilling new oil and gas wells have remained consistent, and have even increased since 2016. Additionally, jurisdictions including Kern County have issued over-the-counter permits for oil and gas projects, disregarding environmental justice and public health concerns. The Newsom Administration has yet to address these issues with permitting policies.
Moving forward, CalGEM should require a legally adequate California Environmental Quality Act (CEQA) review for all permits that pose significant environmental impacts. This includes rework permits that keep existing oil and gas wells operational. Because reworking and re-drilling permits sustain harms to Frontline communities who have lived with the toxic contaminants of oil and gas extraction in their neighborhoods for decades—as well as perpetuating harm to the environment—CalGEM should be applying greater scrutiny to these permits, as well as new drilling permits.
Holding oil and gas operators accountable to the legal requirements of CEQA for all permit types is a baseline protection that should be afforded to all Californians.
Newsom must do more. He should halt all new oil and gas permits and immediately address existing sources of pollution. Rework permits extend the life of existing wells and add to pollution already affecting Frontline communities. Ceasing the issuance of rework permits—particularly those close to homes, schools, and other sensitive receptors, should be a top priority. This process can begin by closing the loophole in CalGEM’s draft setbacks rule, identified above, which permits these activities in CalGEM’s draft setbacks rulemaking. Finally, Newsom must tackle California’s looming idle well crisis. CalGEM data lists over 40,000 wells in California that remain idle and unplugged, 31% of which are within the 3,200-foot setback. Another 20,000 active oil and gas wells are marginally producing, each extracting less than 10 bbls of crude per month. These wells should be plugged, and the drill sites remediated immediately.
Methods
FracTracker conducted this analysis using CalGEM datasets of oil and gas well, permit, and drilling locations to determine the potential impact of the proposed public health rule, and specifically focused on the adoption of a 3,200’ setback, as defined in the draft rule.
Wells within the setback zone were identified using geospatial analysis tools available in ESRI ArcGIS Pro Ver. 2.7.0, with data projected in NAD83 California Teale Albers. Wells were identified by their proximity to sensitive receptors, as defined in the draft rule. CalGEM permits issued within the setback zone were identified in the same way. Crude oil and condensate production volumes were summed for wells within the setback zone. Population counts and demographics for areas within 3,200’ of wells within the setback zones were also summarized.
The identification of wells within the setback zone was completed by first creating 3,200’ buffers around operational oil and gas wells, issued permits, and drilled wells. These areas were prioritized for identifying sensitive receptors within 3,200’ of operational wells, permits, and new drilled wells.
This assessment used CalGEM’s AllWells dataset (updated 11/05/21) to map the locations of operational oil and gas wells and permits. The AllWells dataset was filtered by ‘Well Status’ to include only active, idle (including abeyance), and new wells, which included 103,979 entries with unique API identifiers.
A dataset of permits issued by CalGEM from January 1, 2020—December 31, 2021 was compiled from the agency’s weekly summary reports of well permits issued. The dataset was filtered to remove well plugging permits. Counts of sidetrack and well deepening permits were combined with counts of well rework permits to simplify the analysis.
The locations of CalGEM permitted wells that were drilled/spudded from January 1, 2020—December 31, 2021 were obtained via a public records act request to the California Department of Conservation (DOC).
The datasets of sensitive receptors included in the analysis were downloaded from various California state agencies, or amended from larger national GIS datasets. Locations of healthcare facilities were downloaded from the California Department of Health and Human Services, including the locations of residential elderly care facilities, nursing homes, and licensed childcare services (downloaded 9/5/21). Property lines for California schools were downloaded from the California school campus database (downloaded 9/5/21). The dataset of prison property boundaries for California detention centers was downloaded from California Office of Emergency Services (downloaded 9/5/21). Point locations for playgrounds in cities and outlines of publicly accessible state parks were downloaded from the California Department of Parks and Recreation (downloaded 9/5/21).
The outlines of occupied dwellings and commercial businesses open to the public were generated by screening Microsoft’s OpenStreetMap building footprint dataset. Building footprints located within the 3,200’ buffer of operational wells were manually screened for identifiers of habitation. Shapefiles of county and city level zoning boundaries were overlaid on the working maps to assist with this tedious process. Building footprints in industrial zoned parcels were screened for commercial businesses, using Google business profiles. In cases where the nature of a building was inconclusive, the building footprint was conserved if outside of an oil and gas field. Inconclusive buildings located inside CalGEM’s oilfield boundaries were assumed to not be livable spaces. This analysis therefore provides an upper bound estimate for the projected impact of the proposed setback rule.
The analyses of oil production data utilized CalGEM’s annual production and injection summary reports for 2019 and 2020, reporting barrels of oil/condensate. Reported production volumes were summed for the wells identified as located within the 3,200’ setback zone.
Block group level U.S. Census data from the 5-year American Community Survey (2014-2019) was used to estimate counts of Californians living within 3,200’ of operational oil and gas wells. The category “Non-white including Hispanic or Latino” was calculated by subtracting [B03002_003 – Not Hispanic or Latino: White Alone] from [B03002_001 – Total Population].
Census block groups were clipped using the buffered datasets of operational oil and gas wells identified as located within the 3,200’ setback zone. Census demographics and total population counts were adjusted by the proportion of the block group located within 3,200’ of the operational well, (Areal adjustment percentage = Area of block group within 3,200’ of an operational well / Total area of block group). A uniform population distribution within the census blocks was assumed, in order to determine the population counts of the area of each block group within 3,200’ of an operational well.
All datasets used for this analysis can be found and downloaded from the Box folder, here.
References & Where to Learn More
- Gonzalez, D. J.X., Francis, C. K., Shaw, G. M., Cullen, M. R., Baiocchi, M., & Burke, M. (2022). Upstream oil and gas production and ambient air pollution in California. Science of The Total Environment, 806(1).
- Gonzalez, D. J.X., Sherris, A. R., Yang, W., Stevenson, D. K., Padula, A. M., Michael Baiocchi, Burke, M., Cullen, M. R., & Shaw, G. M. (2020). Oil and gas production and spontaneous preterm birth in the San Joaquin Valley, CA A case–control study. Environmental Epidemiology, 4(4).
- Tran, K. V., Casey, J. A., Cushing, L. J., & Morello-Frosch, R. (2020). Residential Proximity to Oil and Gas Development and Birth Outcomes in California: A Retrospective Cohort Study of 2006–2015 Births. Environmental Health Perspectives, 128(6).
- McKenzie, L. M., Allshouse, W., & Daniels, S. (2019). Congenital heart defects and intensity of oil and gas well site activities in early pregnancy. Environmental International, 132.
- McKenzie, L. M., Guo, R., Witter, R. Z., Savitz, D. A., Newman, L. S., & Adgate, J. L. (n.d.). Birth Outcomes and Maternal Residential Proximity to Natural Gas Development in Rural Colorado. Environment Health Perspectives, 122(4).
- Gehring, U., Wijga, A. H., Koppelman, G. H., Vonk, J. M., Smit, H. A., & Brunekreef, B. (2020). Air pollution and the development of asthma from birth until young adulthood. European Respiratory Journal, 56.
Topics in This Article:
Join the Conversation
Stay Informed
Support Our Work
FracTracker Alliance helps communicate the risks of oil and gas and petrochemical development to advance just energy alternatives that protect public health, natural resources, and the climate.
By contributing to FracTracker, you are helping to make tangible changes, such as decreasing the number of oil and gas wells in the US, protecting the public from toxic and radioactive chemicals, and stopping petrochemical expansion into vulnerable communities.
Your donations help fund the sourcing and analysis of new data so that we can keep you informed and continually update our resources.
Please donate to FracTracker today as a way to advocate for clean water, clean air, and healthy communities.
What You Should Read Next
https://www.fractracker.org/a5ej20sjfwe/wp-content/uploads/2021/07/California-oil-fields-feature.jpg
667
1500
Kyle Ferrar, MPH
https://www.fractracker.org/a5ej20sjfwe/wp-content/uploads/2025/09/2025-Wordmark-Logo.png
Kyle Ferrar, MPH2025-08-26 17:36:222025-08-27 21:56:28California’s New Oil Wells Average 13.5 Barrels/Day — Far Below State Projections https://www.fractracker.org/a5ej20sjfwe/wp-content/uploads/2021/02/Los-Angeles-skyline-feature-scaled.jpg
667
1500
Kyle Ferrar, MPH
https://www.fractracker.org/a5ej20sjfwe/wp-content/uploads/2025/09/2025-Wordmark-Logo.png
Kyle Ferrar, MPH2025-03-27 15:37:102025-04-01 12:55:42Environmental Justice Analysis of Oil Extraction in Los Angeles Communities
https://www.fractracker.org/a5ej20sjfwe/wp-content/uploads/2021/02/Los-Angeles-skyline-feature-scaled.jpg
667
1500
Kyle Ferrar, MPH
https://www.fractracker.org/a5ej20sjfwe/wp-content/uploads/2025/09/2025-Wordmark-Logo.png
Kyle Ferrar, MPH2025-03-27 15:37:102025-04-01 12:55:42Environmental Justice Analysis of Oil Extraction in Los Angeles Communities https://www.fractracker.org/a5ej20sjfwe/wp-content/uploads/2025/02/1400669_062416-kabc-cuffe-erskine1-imgcrtr.jpg
720
1280
FracTracker Alliance
https://www.fractracker.org/a5ej20sjfwe/wp-content/uploads/2025/09/2025-Wordmark-Logo.png
FracTracker Alliance2025-01-31 12:07:132025-02-06 14:11:38Can California Energy Policy Move Past its Contradictions?
https://www.fractracker.org/a5ej20sjfwe/wp-content/uploads/2025/02/1400669_062416-kabc-cuffe-erskine1-imgcrtr.jpg
720
1280
FracTracker Alliance
https://www.fractracker.org/a5ej20sjfwe/wp-content/uploads/2025/09/2025-Wordmark-Logo.png
FracTracker Alliance2025-01-31 12:07:132025-02-06 14:11:38Can California Energy Policy Move Past its Contradictions? https://www.fractracker.org/a5ej20sjfwe/wp-content/uploads/2019/03/IdleWellsHathaway_resize.jpg
400
900
Kyle Ferrar, MPH
https://www.fractracker.org/a5ej20sjfwe/wp-content/uploads/2025/09/2025-Wordmark-Logo.png
Kyle Ferrar, MPH2024-05-02 10:32:552024-05-02 12:43:28California Must Improve Management of Idle Wells
https://www.fractracker.org/a5ej20sjfwe/wp-content/uploads/2019/03/IdleWellsHathaway_resize.jpg
400
900
Kyle Ferrar, MPH
https://www.fractracker.org/a5ej20sjfwe/wp-content/uploads/2025/09/2025-Wordmark-Logo.png
Kyle Ferrar, MPH2024-05-02 10:32:552024-05-02 12:43:28California Must Improve Management of Idle Wells https://www.fractracker.org/a5ej20sjfwe/wp-content/uploads/2020/04/California-well-pad.jpg
666
1500
FracTracker Alliance
https://www.fractracker.org/a5ej20sjfwe/wp-content/uploads/2025/09/2025-Wordmark-Logo.png
FracTracker Alliance2024-03-07 17:01:582024-03-12 09:55:39Chevron’s $2.3 Billion Asset Adjustment Raises Questions Amidst Regulatory Changes in California
https://www.fractracker.org/a5ej20sjfwe/wp-content/uploads/2020/04/California-well-pad.jpg
666
1500
FracTracker Alliance
https://www.fractracker.org/a5ej20sjfwe/wp-content/uploads/2025/09/2025-Wordmark-Logo.png
FracTracker Alliance2024-03-07 17:01:582024-03-12 09:55:39Chevron’s $2.3 Billion Asset Adjustment Raises Questions Amidst Regulatory Changes in California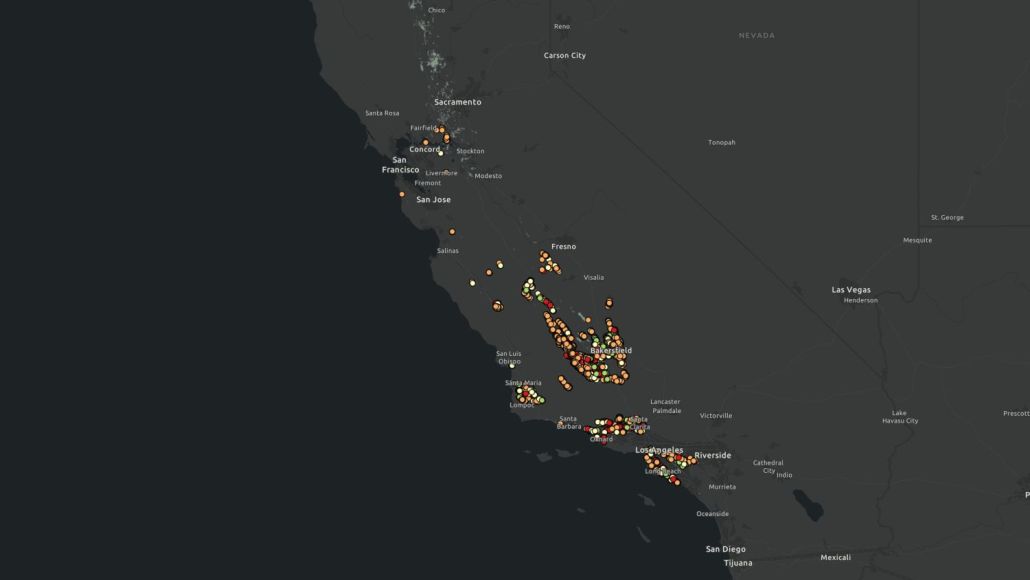 FracTracker Alliance, 2024
https://www.fractracker.org/a5ej20sjfwe/wp-content/uploads/2024/01/California-Daily-Oil-Production-2024.jpg
844
1500
Kyle Ferrar, MPH
https://www.fractracker.org/a5ej20sjfwe/wp-content/uploads/2025/09/2025-Wordmark-Logo.png
Kyle Ferrar, MPH2024-01-30 05:00:012024-02-05 13:46:42Index of Oil and Gas Operator Health in California Shows Risks to State Economy and Taxpayers
FracTracker Alliance, 2024
https://www.fractracker.org/a5ej20sjfwe/wp-content/uploads/2024/01/California-Daily-Oil-Production-2024.jpg
844
1500
Kyle Ferrar, MPH
https://www.fractracker.org/a5ej20sjfwe/wp-content/uploads/2025/09/2025-Wordmark-Logo.png
Kyle Ferrar, MPH2024-01-30 05:00:012024-02-05 13:46:42Index of Oil and Gas Operator Health in California Shows Risks to State Economy and Taxpayers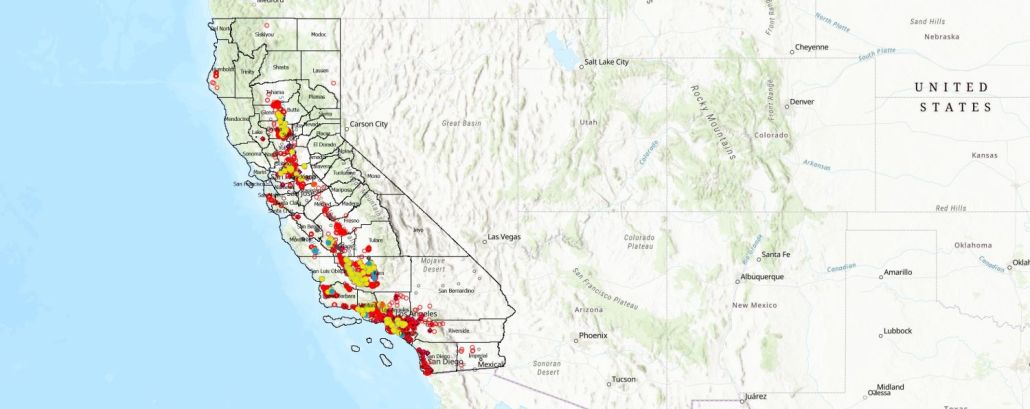 https://www.fractracker.org/a5ej20sjfwe/wp-content/uploads/2023/10/Wells-Within-3200-Feet-of-Schools-Childcare-CA.jpg
595
1500
Kyle Ferrar, MPH
https://www.fractracker.org/a5ej20sjfwe/wp-content/uploads/2025/09/2025-Wordmark-Logo.png
Kyle Ferrar, MPH2023-10-04 16:38:472023-10-04 21:19:54Oil and Gas Activity Within California Public Health Protection Zones
https://www.fractracker.org/a5ej20sjfwe/wp-content/uploads/2023/10/Wells-Within-3200-Feet-of-Schools-Childcare-CA.jpg
595
1500
Kyle Ferrar, MPH
https://www.fractracker.org/a5ej20sjfwe/wp-content/uploads/2025/09/2025-Wordmark-Logo.png
Kyle Ferrar, MPH2023-10-04 16:38:472023-10-04 21:19:54Oil and Gas Activity Within California Public Health Protection Zones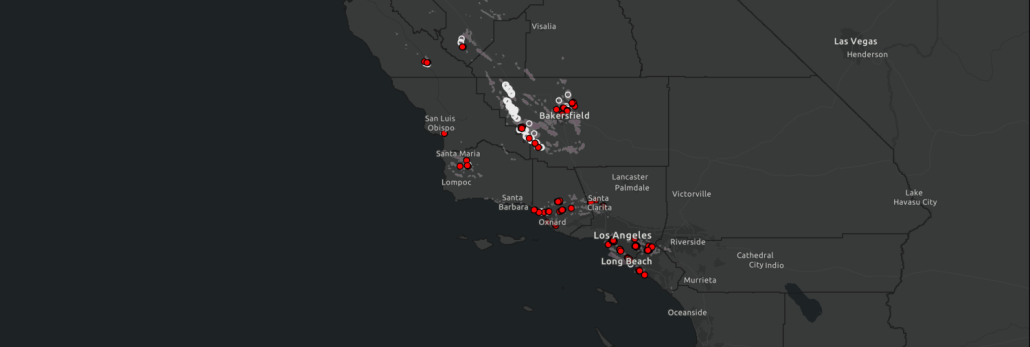 https://www.fractracker.org/a5ej20sjfwe/wp-content/uploads/2023/04/Rework-Permits-Feature-Image.png
506
1500
Kyle Ferrar, MPH
https://www.fractracker.org/a5ej20sjfwe/wp-content/uploads/2025/09/2025-Wordmark-Logo.png
Kyle Ferrar, MPH2023-04-14 11:36:392023-04-28 16:05:23CalGEM Permit Review Q1 2023: Well Rework Permits Increase by 76% in California
https://www.fractracker.org/a5ej20sjfwe/wp-content/uploads/2023/04/Rework-Permits-Feature-Image.png
506
1500
Kyle Ferrar, MPH
https://www.fractracker.org/a5ej20sjfwe/wp-content/uploads/2025/09/2025-Wordmark-Logo.png
Kyle Ferrar, MPH2023-04-14 11:36:392023-04-28 16:05:23CalGEM Permit Review Q1 2023: Well Rework Permits Increase by 76% in California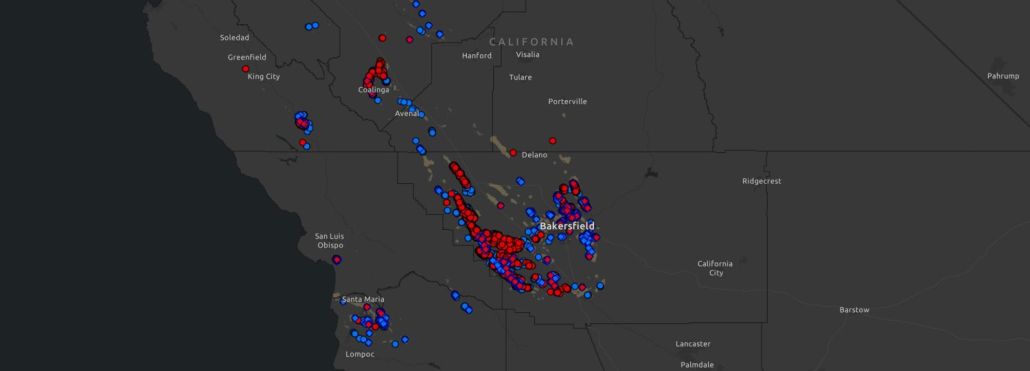 https://www.fractracker.org/a5ej20sjfwe/wp-content/uploads/2023/01/California-Rework-Permits-2023.jpg
541
1500
Kyle Ferrar, MPH
https://www.fractracker.org/a5ej20sjfwe/wp-content/uploads/2025/09/2025-Wordmark-Logo.png
Kyle Ferrar, MPH2023-01-24 09:01:352023-01-24 13:21:55Assessment of Rework Permits on Oil Production from Operational Wells Within the 3,200-Foot Public Health Protection Zone
https://www.fractracker.org/a5ej20sjfwe/wp-content/uploads/2023/01/California-Rework-Permits-2023.jpg
541
1500
Kyle Ferrar, MPH
https://www.fractracker.org/a5ej20sjfwe/wp-content/uploads/2025/09/2025-Wordmark-Logo.png
Kyle Ferrar, MPH2023-01-24 09:01:352023-01-24 13:21:55Assessment of Rework Permits on Oil Production from Operational Wells Within the 3,200-Foot Public Health Protection Zone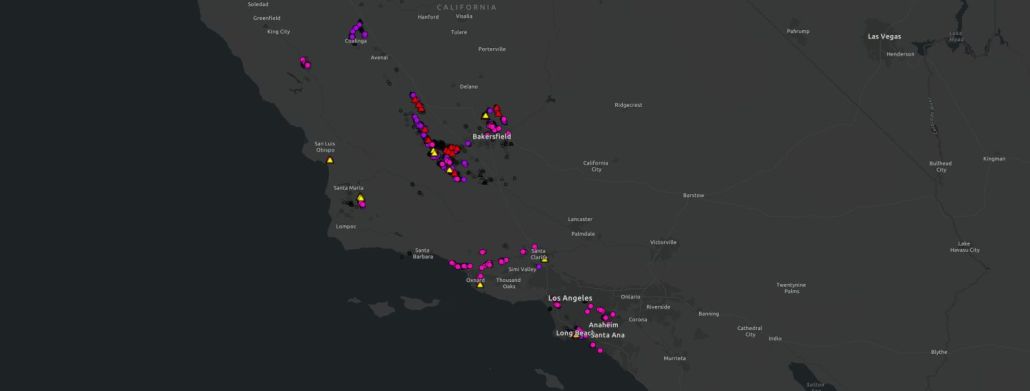 https://www.fractracker.org/a5ej20sjfwe/wp-content/uploads/2023/01/CalGEM-Q4-2022-Permit-Review.jpg
570
1500
Kyle Ferrar, MPH
https://www.fractracker.org/a5ej20sjfwe/wp-content/uploads/2025/09/2025-Wordmark-Logo.png
Kyle Ferrar, MPH2023-01-18 18:01:532023-01-18 18:03:23CalGEM Permit Review Q4 2022: Oil Permit Approvals Show Steep Rise Within Protective Buffer Zones
https://www.fractracker.org/a5ej20sjfwe/wp-content/uploads/2023/01/CalGEM-Q4-2022-Permit-Review.jpg
570
1500
Kyle Ferrar, MPH
https://www.fractracker.org/a5ej20sjfwe/wp-content/uploads/2025/09/2025-Wordmark-Logo.png
Kyle Ferrar, MPH2023-01-18 18:01:532023-01-18 18:03:23CalGEM Permit Review Q4 2022: Oil Permit Approvals Show Steep Rise Within Protective Buffer Zones https://www.fractracker.org/a5ej20sjfwe/wp-content/uploads/2022/08/MOV_8837_Moment-e1663254387862.jpg
284
640
Kyle Ferrar, MPH
https://www.fractracker.org/a5ej20sjfwe/wp-content/uploads/2025/09/2025-Wordmark-Logo.png
Kyle Ferrar, MPH2022-08-22 09:52:582026-04-28 14:45:28FracTracker Finds Widespread Hydrocarbon Emissions from Active & Idle Oil and Gas Wells and Infrastructure in California
https://www.fractracker.org/a5ej20sjfwe/wp-content/uploads/2022/08/MOV_8837_Moment-e1663254387862.jpg
284
640
Kyle Ferrar, MPH
https://www.fractracker.org/a5ej20sjfwe/wp-content/uploads/2025/09/2025-Wordmark-Logo.png
Kyle Ferrar, MPH2022-08-22 09:52:582026-04-28 14:45:28FracTracker Finds Widespread Hydrocarbon Emissions from Active & Idle Oil and Gas Wells and Infrastructure in California https://www.fractracker.org/a5ej20sjfwe/wp-content/uploads/2022/07/kyle-ferrar-e1663254307641.jpg
636
1430
Kyle Ferrar, MPH
https://www.fractracker.org/a5ej20sjfwe/wp-content/uploads/2025/09/2025-Wordmark-Logo.png
Kyle Ferrar, MPH2022-07-29 19:04:322022-09-15 11:05:17California Regulators Approve More Oil Well Permits Amid a Crisis of Leaking Oil Wells that Should be Plugged
https://www.fractracker.org/a5ej20sjfwe/wp-content/uploads/2022/07/kyle-ferrar-e1663254307641.jpg
636
1430
Kyle Ferrar, MPH
https://www.fractracker.org/a5ej20sjfwe/wp-content/uploads/2025/09/2025-Wordmark-Logo.png
Kyle Ferrar, MPH2022-07-29 19:04:322022-09-15 11:05:17California Regulators Approve More Oil Well Permits Amid a Crisis of Leaking Oil Wells that Should be Plugged https://www.fractracker.org/a5ej20sjfwe/wp-content/uploads/2022/03/KFerrar-feature-CAsetbacks2022.jpg
878
1500
Kyle Ferrar, MPH
https://www.fractracker.org/a5ej20sjfwe/wp-content/uploads/2025/09/2025-Wordmark-Logo.png
Kyle Ferrar, MPH2022-04-06 12:01:332023-08-24 19:08:53Implications of a 3,200-foot Setback in California
https://www.fractracker.org/a5ej20sjfwe/wp-content/uploads/2022/03/KFerrar-feature-CAsetbacks2022.jpg
878
1500
Kyle Ferrar, MPH
https://www.fractracker.org/a5ej20sjfwe/wp-content/uploads/2025/09/2025-Wordmark-Logo.png
Kyle Ferrar, MPH2022-04-06 12:01:332023-08-24 19:08:53Implications of a 3,200-foot Setback in California https://www.fractracker.org/a5ej20sjfwe/wp-content/uploads/2022/03/BLenker_infrastructure-oilrig-southLA-CA_Oct20173.jpg
795
1500
Kyle Ferrar, MPH
https://www.fractracker.org/a5ej20sjfwe/wp-content/uploads/2025/09/2025-Wordmark-Logo.png
Kyle Ferrar, MPH2022-03-15 16:32:032022-03-15 18:00:00New Trends in Drilling Permit Approvals Take Shape in CA
https://www.fractracker.org/a5ej20sjfwe/wp-content/uploads/2022/03/BLenker_infrastructure-oilrig-southLA-CA_Oct20173.jpg
795
1500
Kyle Ferrar, MPH
https://www.fractracker.org/a5ej20sjfwe/wp-content/uploads/2025/09/2025-Wordmark-Logo.png
Kyle Ferrar, MPH2022-03-15 16:32:032022-03-15 18:00:00New Trends in Drilling Permit Approvals Take Shape in CA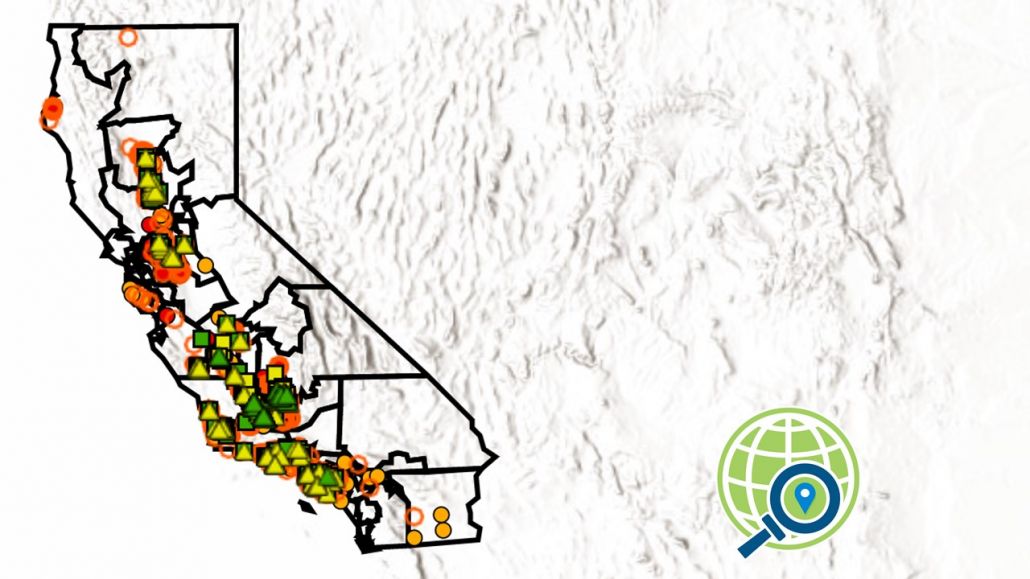 https://www.fractracker.org/a5ej20sjfwe/wp-content/uploads/2022/03/KFerrar-CAlegislative-analysis_March2022.jpg
720
1280
Kyle Ferrar, MPH
https://www.fractracker.org/a5ej20sjfwe/wp-content/uploads/2025/09/2025-Wordmark-Logo.png
Kyle Ferrar, MPH2022-03-14 15:18:402022-03-14 15:18:40Oil and Gas Drilling in California Legislative Districts
https://www.fractracker.org/a5ej20sjfwe/wp-content/uploads/2022/03/KFerrar-CAlegislative-analysis_March2022.jpg
720
1280
Kyle Ferrar, MPH
https://www.fractracker.org/a5ej20sjfwe/wp-content/uploads/2025/09/2025-Wordmark-Logo.png
Kyle Ferrar, MPH2022-03-14 15:18:402022-03-14 15:18:40Oil and Gas Drilling in California Legislative Districts https://www.fractracker.org/a5ej20sjfwe/wp-content/uploads/2021/09/NRDC-Urban-Drilling-feature.jpg
667
1500
Kyle Ferrar, MPH
https://www.fractracker.org/a5ej20sjfwe/wp-content/uploads/2025/09/2025-Wordmark-Logo.png
Kyle Ferrar, MPH2021-09-14 14:26:442026-04-28 14:29:26It’s Time to Stop Urban Oil Drilling in Los Angeles
https://www.fractracker.org/a5ej20sjfwe/wp-content/uploads/2021/09/NRDC-Urban-Drilling-feature.jpg
667
1500
Kyle Ferrar, MPH
https://www.fractracker.org/a5ej20sjfwe/wp-content/uploads/2025/09/2025-Wordmark-Logo.png
Kyle Ferrar, MPH2021-09-14 14:26:442026-04-28 14:29:26It’s Time to Stop Urban Oil Drilling in Los Angeles https://www.fractracker.org/a5ej20sjfwe/wp-content/uploads/2021/09/National-Prison-Strike-poster-feature.jpg
667
1500
Kyle Ferrar, MPH
https://www.fractracker.org/a5ej20sjfwe/wp-content/uploads/2025/09/2025-Wordmark-Logo.png
Kyle Ferrar, MPH2021-09-09 08:00:082021-09-08 17:30:46California Prisons are Within 2,500’ of Oil and Gas Extraction
https://www.fractracker.org/a5ej20sjfwe/wp-content/uploads/2021/09/National-Prison-Strike-poster-feature.jpg
667
1500
Kyle Ferrar, MPH
https://www.fractracker.org/a5ej20sjfwe/wp-content/uploads/2025/09/2025-Wordmark-Logo.png
Kyle Ferrar, MPH2021-09-09 08:00:082021-09-08 17:30:46California Prisons are Within 2,500’ of Oil and Gas Extraction https://www.fractracker.org/a5ej20sjfwe/wp-content/uploads/2021/08/BLenker_infrastructure-oilrig-southLA-CA_Oct2017-feature.jpg
667
1500
Kyle Ferrar, MPH
https://www.fractracker.org/a5ej20sjfwe/wp-content/uploads/2025/09/2025-Wordmark-Logo.png
Kyle Ferrar, MPH2021-08-05 16:38:392021-08-05 16:38:39New Neighborhood Drilling Permits Issued While California Fails to Act on Public Health Rules
https://www.fractracker.org/a5ej20sjfwe/wp-content/uploads/2021/08/BLenker_infrastructure-oilrig-southLA-CA_Oct2017-feature.jpg
667
1500
Kyle Ferrar, MPH
https://www.fractracker.org/a5ej20sjfwe/wp-content/uploads/2025/09/2025-Wordmark-Logo.png
Kyle Ferrar, MPH2021-08-05 16:38:392021-08-05 16:38:39New Neighborhood Drilling Permits Issued While California Fails to Act on Public Health Rules https://www.fractracker.org/a5ej20sjfwe/wp-content/uploads/2021/07/California-oil-drilling-feature.jpg
400
900
Kyle Ferrar, MPH
https://www.fractracker.org/a5ej20sjfwe/wp-content/uploads/2025/09/2025-Wordmark-Logo.png
Kyle Ferrar, MPH2021-07-26 13:56:312021-07-26 14:03:09California Oil & Gas Drilling Permits Drop in Response to Decreased Permit Applications to CalGEM
https://www.fractracker.org/a5ej20sjfwe/wp-content/uploads/2021/07/California-oil-fields-feature.jpg
667
1500
Kyle Ferrar, MPH
https://www.fractracker.org/a5ej20sjfwe/wp-content/uploads/2025/09/2025-Wordmark-Logo.png
Kyle Ferrar, MPH2021-07-20 16:32:222021-07-20 17:36:11California Denies Well Stimulation Permits
https://www.fractracker.org/a5ej20sjfwe/wp-content/uploads/2021/07/California-oil-drilling-feature.jpg
400
900
Kyle Ferrar, MPH
https://www.fractracker.org/a5ej20sjfwe/wp-content/uploads/2025/09/2025-Wordmark-Logo.png
Kyle Ferrar, MPH2021-07-26 13:56:312021-07-26 14:03:09California Oil & Gas Drilling Permits Drop in Response to Decreased Permit Applications to CalGEM
https://www.fractracker.org/a5ej20sjfwe/wp-content/uploads/2021/07/California-oil-fields-feature.jpg
667
1500
Kyle Ferrar, MPH
https://www.fractracker.org/a5ej20sjfwe/wp-content/uploads/2025/09/2025-Wordmark-Logo.png
Kyle Ferrar, MPH2021-07-20 16:32:222021-07-20 17:36:11California Denies Well Stimulation Permits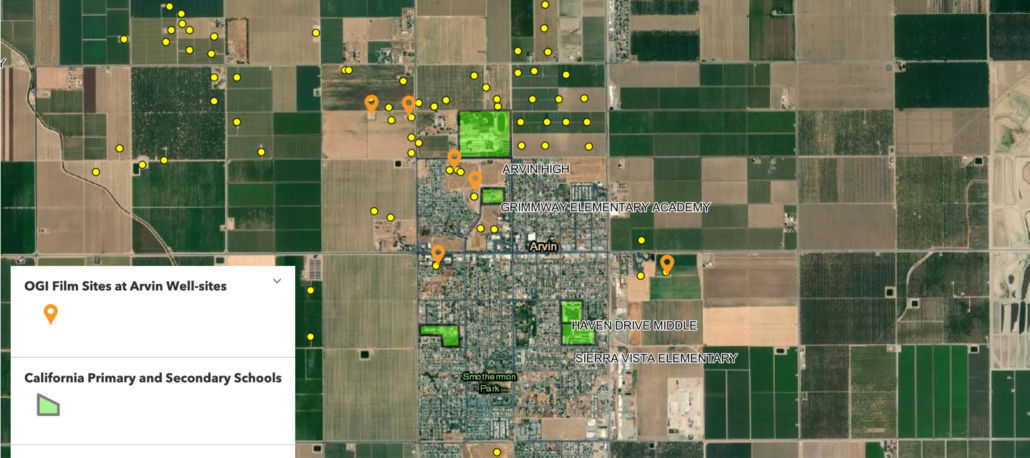 https://www.fractracker.org/a5ej20sjfwe/wp-content/uploads/2021/03/Arvin-CA-well-sites-and-schools-feature-scaled.jpg
667
1500
Kyle Ferrar, MPH
https://www.fractracker.org/a5ej20sjfwe/wp-content/uploads/2025/09/2025-Wordmark-Logo.png
Kyle Ferrar, MPH2021-03-04 15:29:422021-04-15 15:14:45Kern County’s Drafted EIR Will Increase the Burden for Frontline Communities
https://www.fractracker.org/a5ej20sjfwe/wp-content/uploads/2021/02/Los-Angeles-skyline-feature-scaled.jpg
667
1500
Kyle Ferrar, MPH
https://www.fractracker.org/a5ej20sjfwe/wp-content/uploads/2025/09/2025-Wordmark-Logo.png
Kyle Ferrar, MPH2021-02-23 14:42:162021-04-15 14:08:42California Oil & Gas Setbacks Recommendations Memo
https://www.fractracker.org/a5ej20sjfwe/wp-content/uploads/2021/03/Arvin-CA-well-sites-and-schools-feature-scaled.jpg
667
1500
Kyle Ferrar, MPH
https://www.fractracker.org/a5ej20sjfwe/wp-content/uploads/2025/09/2025-Wordmark-Logo.png
Kyle Ferrar, MPH2021-03-04 15:29:422021-04-15 15:14:45Kern County’s Drafted EIR Will Increase the Burden for Frontline Communities
https://www.fractracker.org/a5ej20sjfwe/wp-content/uploads/2021/02/Los-Angeles-skyline-feature-scaled.jpg
667
1500
Kyle Ferrar, MPH
https://www.fractracker.org/a5ej20sjfwe/wp-content/uploads/2025/09/2025-Wordmark-Logo.png
Kyle Ferrar, MPH2021-02-23 14:42:162021-04-15 14:08:42California Oil & Gas Setbacks Recommendations Memo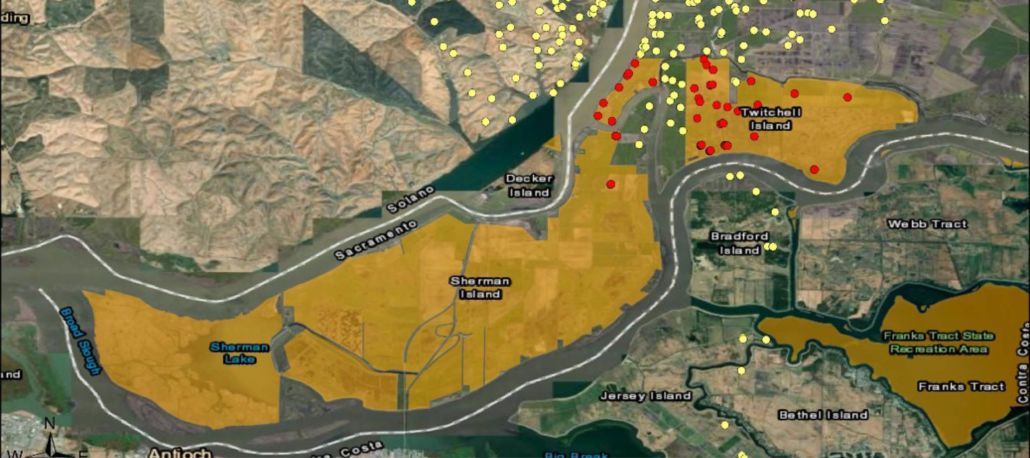 https://www.fractracker.org/a5ej20sjfwe/wp-content/uploads/2021/02/Figure-2.-There-are-50-operational-oil-and-gas-wells-permitted-on-California-state-lands-in-the-Sacramento-River-Delta-feature-scaled.jpg
667
1500
Kyle Ferrar, MPH
https://www.fractracker.org/a5ej20sjfwe/wp-content/uploads/2025/09/2025-Wordmark-Logo.png
Kyle Ferrar, MPH2021-02-12 17:42:002021-04-15 14:08:43Oil and Gas Wells on California State Lands
https://www.fractracker.org/a5ej20sjfwe/wp-content/uploads/2021/02/Figure-2.-There-are-50-operational-oil-and-gas-wells-permitted-on-California-state-lands-in-the-Sacramento-River-Delta-feature-scaled.jpg
667
1500
Kyle Ferrar, MPH
https://www.fractracker.org/a5ej20sjfwe/wp-content/uploads/2025/09/2025-Wordmark-Logo.png
Kyle Ferrar, MPH2021-02-12 17:42:002021-04-15 14:08:43Oil and Gas Wells on California State Lands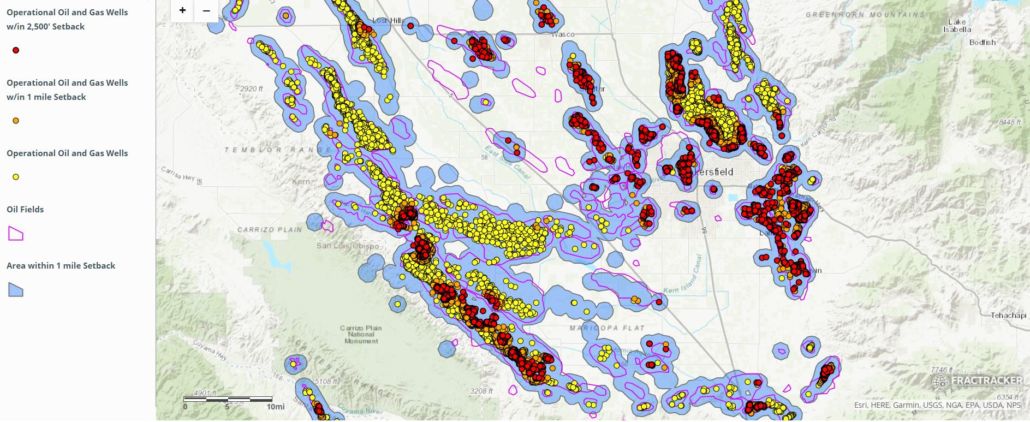 https://www.fractracker.org/a5ej20sjfwe/wp-content/uploads/2020/12/CASetbacksMappic.jpg
614
1500
Kyle Ferrar, MPH
https://www.fractracker.org/a5ej20sjfwe/wp-content/uploads/2025/09/2025-Wordmark-Logo.png
Kyle Ferrar, MPH2020-12-17 13:45:242021-04-15 14:16:02People and Production: Reducing Risk in California Extraction
https://www.fractracker.org/a5ej20sjfwe/wp-content/uploads/2020/12/CASetbacksMappic.jpg
614
1500
Kyle Ferrar, MPH
https://www.fractracker.org/a5ej20sjfwe/wp-content/uploads/2025/09/2025-Wordmark-Logo.png
Kyle Ferrar, MPH2020-12-17 13:45:242021-04-15 14:16:02People and Production: Reducing Risk in California Extraction https://www.fractracker.org/a5ej20sjfwe/wp-content/uploads/2019/08/EQT-Tioga-Wide-7.gif
300
800
Kyle Ferrar, MPH
https://www.fractracker.org/a5ej20sjfwe/wp-content/uploads/2025/09/2025-Wordmark-Logo.png
Kyle Ferrar, MPH2020-11-18 12:40:132021-04-15 14:16:04Documenting emissions from new oil and gas wells in California
https://www.fractracker.org/a5ej20sjfwe/wp-content/uploads/2019/08/EQT-Tioga-Wide-7.gif
300
800
Kyle Ferrar, MPH
https://www.fractracker.org/a5ej20sjfwe/wp-content/uploads/2025/09/2025-Wordmark-Logo.png
Kyle Ferrar, MPH2020-11-18 12:40:132021-04-15 14:16:04Documenting emissions from new oil and gas wells in California https://www.fractracker.org/a5ej20sjfwe/wp-content/uploads/2020/09/Pump_Jack_at_the_Lost_Hills_Oil_Field_In_Central_California-feature.jpg
833
1875
Kyle Ferrar, MPH
https://www.fractracker.org/a5ej20sjfwe/wp-content/uploads/2025/09/2025-Wordmark-Logo.png
Kyle Ferrar, MPH2020-09-16 19:45:072021-04-15 14:16:08Recommendations for an EIR to prioritize Kern County Frontline Communities
https://www.fractracker.org/a5ej20sjfwe/wp-content/uploads/2020/09/Pump_Jack_at_the_Lost_Hills_Oil_Field_In_Central_California-feature.jpg
833
1875
Kyle Ferrar, MPH
https://www.fractracker.org/a5ej20sjfwe/wp-content/uploads/2025/09/2025-Wordmark-Logo.png
Kyle Ferrar, MPH2020-09-16 19:45:072021-04-15 14:16:08Recommendations for an EIR to prioritize Kern County Frontline Communities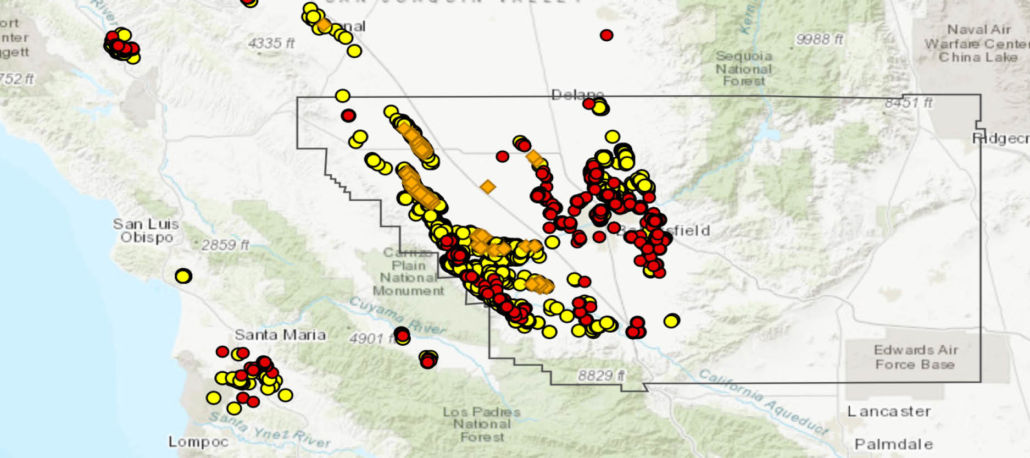 https://www.fractracker.org/a5ej20sjfwe/wp-content/uploads/2020/06/CalGEM-Drilling-and-Rework-Permits-2015-2020-feature.jpg
833
1875
Kyle Ferrar, MPH
https://www.fractracker.org/a5ej20sjfwe/wp-content/uploads/2025/09/2025-Wordmark-Logo.png
Kyle Ferrar, MPH2020-06-08 08:44:542021-04-15 14:16:46Systematic Racism in Kern County Oil and Gas Permitting Ordinance
https://www.fractracker.org/a5ej20sjfwe/wp-content/uploads/2020/06/CalGEM-Drilling-and-Rework-Permits-2015-2020-feature.jpg
833
1875
Kyle Ferrar, MPH
https://www.fractracker.org/a5ej20sjfwe/wp-content/uploads/2025/09/2025-Wordmark-Logo.png
Kyle Ferrar, MPH2020-06-08 08:44:542021-04-15 14:16:46Systematic Racism in Kern County Oil and Gas Permitting Ordinance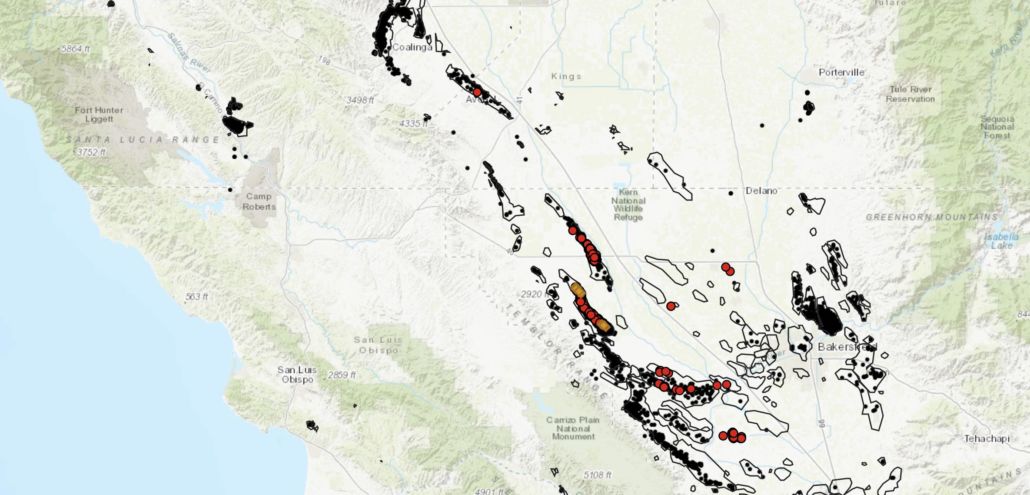 https://www.fractracker.org/a5ej20sjfwe/wp-content/uploads/2020/04/Map-of-New-2020-Fracking-Permits-in-California.jpg
720
1500
Kyle Ferrar, MPH
https://www.fractracker.org/a5ej20sjfwe/wp-content/uploads/2025/09/2025-Wordmark-Logo.png
Kyle Ferrar, MPH2020-05-07 12:48:132021-04-15 14:16:49California, Back in Frack
https://www.fractracker.org/a5ej20sjfwe/wp-content/uploads/2020/04/California-well-pad.jpg
666
1500
Kyle Ferrar, MPH
https://www.fractracker.org/a5ej20sjfwe/wp-content/uploads/2025/09/2025-Wordmark-Logo.png
Kyle Ferrar, MPH2020-04-02 10:20:422021-04-15 14:16:50California Setback Analyses Summary
https://www.fractracker.org/a5ej20sjfwe/wp-content/uploads/2020/04/Map-of-New-2020-Fracking-Permits-in-California.jpg
720
1500
Kyle Ferrar, MPH
https://www.fractracker.org/a5ej20sjfwe/wp-content/uploads/2025/09/2025-Wordmark-Logo.png
Kyle Ferrar, MPH2020-05-07 12:48:132021-04-15 14:16:49California, Back in Frack
https://www.fractracker.org/a5ej20sjfwe/wp-content/uploads/2020/04/California-well-pad.jpg
666
1500
Kyle Ferrar, MPH
https://www.fractracker.org/a5ej20sjfwe/wp-content/uploads/2025/09/2025-Wordmark-Logo.png
Kyle Ferrar, MPH2020-04-02 10:20:422021-04-15 14:16:50California Setback Analyses Summary https://www.fractracker.org/a5ej20sjfwe/wp-content/uploads/2020/02/National-map-feature-3.png
400
900
Erica Jackson
https://www.fractracker.org/a5ej20sjfwe/wp-content/uploads/2025/09/2025-Wordmark-Logo.png
Erica Jackson2020-02-28 17:35:142022-05-02 15:21:42National Energy and Petrochemical Map
https://www.fractracker.org/a5ej20sjfwe/wp-content/uploads/2020/02/National-map-feature-3.png
400
900
Erica Jackson
https://www.fractracker.org/a5ej20sjfwe/wp-content/uploads/2025/09/2025-Wordmark-Logo.png
Erica Jackson2020-02-28 17:35:142022-05-02 15:21:42National Energy and Petrochemical Map https://www.fractracker.org/a5ej20sjfwe/wp-content/uploads/2020/01/California-Governor-Gavin-Newsom--scaled.jpg
666
1500
Kyle Ferrar, MPH
https://www.fractracker.org/a5ej20sjfwe/wp-content/uploads/2025/09/2025-Wordmark-Logo.png
Kyle Ferrar, MPH2020-02-24 10:09:182021-04-15 14:55:29Governor Newsom Must Do More to Address the Cause of Oil Spill Surface Expressions
https://www.fractracker.org/a5ej20sjfwe/wp-content/uploads/2020/01/California-Governor-Gavin-Newsom--scaled.jpg
666
1500
Kyle Ferrar, MPH
https://www.fractracker.org/a5ej20sjfwe/wp-content/uploads/2025/09/2025-Wordmark-Logo.png
Kyle Ferrar, MPH2020-02-24 10:09:182021-04-15 14:55:29Governor Newsom Must Do More to Address the Cause of Oil Spill Surface Expressions https://www.fractracker.org/a5ej20sjfwe/wp-content/uploads/2020/02/Screen-Shot-2020-02-21-at-2.22.05-PM.png
674
1500
Kyle Ferrar, MPH
https://www.fractracker.org/a5ej20sjfwe/wp-content/uploads/2025/09/2025-Wordmark-Logo.png
Kyle Ferrar, MPH2020-02-22 13:29:222021-04-15 14:55:30Oil & Gas Well Permits Issued By Newsom Administration Rival Those Issued Under Gov. Jerry Brown
https://www.fractracker.org/a5ej20sjfwe/wp-content/uploads/2020/02/Screen-Shot-2020-02-21-at-2.22.05-PM.png
674
1500
Kyle Ferrar, MPH
https://www.fractracker.org/a5ej20sjfwe/wp-content/uploads/2025/09/2025-Wordmark-Logo.png
Kyle Ferrar, MPH2020-02-22 13:29:222021-04-15 14:55:30Oil & Gas Well Permits Issued By Newsom Administration Rival Those Issued Under Gov. Jerry Brown https://www.fractracker.org/a5ej20sjfwe/wp-content/uploads/2019/11/Newsom-Well-Watch-Feature-scaled.jpg
667
1500
Kyle Ferrar, MPH
https://www.fractracker.org/a5ej20sjfwe/wp-content/uploads/2025/09/2025-Wordmark-Logo.png
Kyle Ferrar, MPH2019-11-19 20:06:282021-04-15 14:55:36California is Frack Free, for the Moment
https://www.fractracker.org/a5ej20sjfwe/wp-content/uploads/2019/11/Newsom-Well-Watch-Feature-scaled.jpg
667
1500
Kyle Ferrar, MPH
https://www.fractracker.org/a5ej20sjfwe/wp-content/uploads/2025/09/2025-Wordmark-Logo.png
Kyle Ferrar, MPH2019-11-19 20:06:282021-04-15 14:55:36California is Frack Free, for the Moment https://www.fractracker.org/a5ej20sjfwe/wp-content/uploads/2019/07/inglewood-field-ca-feature-1-scaled.jpg
667
1500
Kyle Ferrar, MPH
https://www.fractracker.org/a5ej20sjfwe/wp-content/uploads/2025/09/2025-Wordmark-Logo.png
Kyle Ferrar, MPH2019-07-11 14:48:462021-04-15 14:56:28Permitting New Oil and Gas Wells Under the Newsom Administration
https://www.fractracker.org/a5ej20sjfwe/wp-content/uploads/2019/07/inglewood-field-ca-feature-1-scaled.jpg
667
1500
Kyle Ferrar, MPH
https://www.fractracker.org/a5ej20sjfwe/wp-content/uploads/2025/09/2025-Wordmark-Logo.png
Kyle Ferrar, MPH2019-07-11 14:48:462021-04-15 14:56:28Permitting New Oil and Gas Wells Under the Newsom Administration https://www.fractracker.org/a5ej20sjfwe/wp-content/uploads/2019/06/SignalHill_DavidMcNew_GettyImages_edit.jpg
400
900
Kyle Ferrar, MPH
https://www.fractracker.org/a5ej20sjfwe/wp-content/uploads/2025/09/2025-Wordmark-Logo.png
Kyle Ferrar, MPH2019-07-02 12:03:382021-04-15 14:56:29Impact of a 2,500′ Oil and Gas Well Setback in California
https://www.fractracker.org/a5ej20sjfwe/wp-content/uploads/2019/03/IdleWellsHathaway_resize.jpg
400
900
Kyle Ferrar, MPH
https://www.fractracker.org/a5ej20sjfwe/wp-content/uploads/2025/09/2025-Wordmark-Logo.png
Kyle Ferrar, MPH2019-04-03 11:30:582021-04-15 14:56:34Idle Wells are a Major Risk
https://www.fractracker.org/a5ej20sjfwe/wp-content/uploads/2019/06/SignalHill_DavidMcNew_GettyImages_edit.jpg
400
900
Kyle Ferrar, MPH
https://www.fractracker.org/a5ej20sjfwe/wp-content/uploads/2025/09/2025-Wordmark-Logo.png
Kyle Ferrar, MPH2019-07-02 12:03:382021-04-15 14:56:29Impact of a 2,500′ Oil and Gas Well Setback in California
https://www.fractracker.org/a5ej20sjfwe/wp-content/uploads/2019/03/IdleWellsHathaway_resize.jpg
400
900
Kyle Ferrar, MPH
https://www.fractracker.org/a5ej20sjfwe/wp-content/uploads/2025/09/2025-Wordmark-Logo.png
Kyle Ferrar, MPH2019-04-03 11:30:582021-04-15 14:56:34Idle Wells are a Major Risk https://www.fractracker.org/a5ej20sjfwe/wp-content/uploads/2019/02/San-Bruno-Aftermath-feature-image.png
400
900
Guest Author
https://www.fractracker.org/a5ej20sjfwe/wp-content/uploads/2025/09/2025-Wordmark-Logo.png
Guest Author2019-02-08 19:21:012021-04-15 14:56:55Unnatural Disasters
https://www.fractracker.org/a5ej20sjfwe/wp-content/uploads/2019/02/San-Bruno-Aftermath-feature-image.png
400
900
Guest Author
https://www.fractracker.org/a5ej20sjfwe/wp-content/uploads/2025/09/2025-Wordmark-Logo.png
Guest Author2019-02-08 19:21:012021-04-15 14:56:55Unnatural Disasters![]()
216 Franklin St, Suite 400, Johnstown, PA 15901
Phone: +1 (717) 303-0403 | info@fractracker.org
FracTracker Alliance is a 501(c)3 non-profit: Tax identification number: 80-0844297