Cover of Dangerous and Close report. Click to view report
FracTracker Alliance has been working with the Frontier Group and Environment America on a nationwide assessment of “fracked” oil and gas wells. The report is titled Dangerous and Close, Fracking Puts the Nation’s Most Vulnerable People at Risk. The assessment analyzed the locations of fracked wells and identified where the fracking has occurred near locations where sensitive populations are commonly located. These sensitive sites include schools and daycare facilities because they house children, hospitals because the sick are not able to fight off pollution as effectively, and nursing homes where the elderly need and deserve clean environments so that they can be healthy, as well. The analysis used data on fracked wells from regulatory agencies and FracFocus in nine states. Maps of these nine states, as well as a full national map are shown below.
No one deserves to suffer the environmental degradation that can accompany oil and gas development – particularly “fracking” – in their neighborhoods. Fracked oil and gas wells are shown to have contaminated drinking water, degrade air quality, and sicken both aquatic and terrestrial ecosystems. Additionally, everybody responds differently to environmental pollutants, and some people are much more sensitive than others. In fact, certain sects of the population are known to be more sensitive in general, and exposure to pollution is much more dangerous for them. These communities and populations need to be protected from the burdens of industries, such as fracking for oil and gas, that have a negative effect on their environment. Commonly identified sensitive groups or “receptors” include children, the immuno-compromised and ill, and the elderly. These groups are the focus of this new research.
National Map
National interactive map of sensitive receptors near fracked wells
How annual incomes in the shadow of oil refineries compare to state and regional prosperity
Figure 1. North American Oil Refinery Capacity
Typically, we analyze the potential economic impacts of oil refineries by simply quantifying potential and/or actual capacity on an annual or daily basis. Using this method, we find that the 126 refineries operating in the U.S. produce an average of 100,000-133,645 barrels per day (BPD) of oil – or 258 billion gallons per year.
In all of North America, there are 158 refineries. When you include the 21 and 27 billion gallons per year produced by our neighbors to the south and north, respectively, North American refineries account for 23-24% of the global refining capacity. That is, of course, if you believe the $113 dollar International Energy Agency’s 2016 “Medium-Term Oil Market Report” 4.03 billion gallon annual estimates (Table 1 and Figure 1).
Table 1. Oil Refinery Capacity in the United States and Canada (Barrels Per Day (BPD))
Prince George & Moose Jaw Refining in BC and SK, 12-15K BPD
Pemex’s Ciudad Madero Refinery, 152K BPD
—
High
Exxon Mobil in TX & LA, 502-560K BPD
Valero and Irving Oil Refining in QC & NS, 265-300K BPD
Pemex’s Tula Refinery, 340K BPD
—
Median
100,000 BPD
85,000 BPD
226,500
109,000
Total Capacity
16.8 MBPD
1.8 MBPD
1.4 MBPD
22.1 MBPD
Census Tract Income Disparities
However, we would propose that an alternative measure of a given oil refinery’s impact would be neighborhood prosperity in the census tract(s) where the refinery is located. We believe this figure serves as a proxy for economic justice. As such, we recently used the above refinery location and capacity data in combination with US Census Bureau Cartographic Boundaries (i.e., Census Tracts) and the Census’ American FactFinder clearinghouse to estimate neighborhood prosperity near refineries.
Methods
Our analysis involved merging oil refineries to their respective census tracts in ArcMAP 10.2, along with all census tracts that touch the actual census tract where the refineries are located, and calling that collection the oil refinery’s sphere of influence, for lack of a better term. We then assigned Mean Income in the Past 12 Months (In 2014 Inflation-Adjusted Dollars) values for each census tract to the aforementioned refinery tracts – as well as surrounding regional, city, and state tracts – to allow for a comparison of income disparities. We chose to analyze mean income instead of other variables such as educational attainment, unemployment, or poverty percentages because it largely encapsulates these economic indicators.
In today’s world, the enormous gap in the distribution of wealth, income and public benefits is growing ever wider, reflecting a general trend that is morally unfair, politically unwise and economically unsound… excessive income inequality restricts social mobility and leads to social segmentation and eventually social breakdown…In the modern context, those concerned with social justice see the general increase in income inequality as unjust, deplorable and alarming. It is argued that poverty reduction and overall improvements in the standard of living are attainable goals that would bring the world closer to social justice.
Environmental regulatory agencies like to separate air pollution sources into point and non-point sources. Point sources are “single, identifiable” sources, whereas non-point are more ‘diffuse’ resulting in impacts spread out over a larger geographical area. We would equate oil refineries to point sources of socioeconomic and/or environmental injustice. The non-point analysis would be far more difficult to model given the difficulties associated with converting perceived quality of life disturbance(s) associated with infrastructure like compressor stations from the anecdotal to the empirical.
Results
Primarily, residents living in the shadow of 80% of our refineries earn nearly $16,000 less than those in the surrounding region – or, in the case of urban refineries, the surrounding Metropolitan Statistical Areas (MSAs). Only residents living in census tracts within the shadow of 25 of our 126 oil refineries earn around $10,000 more annually than those in the region.
On average, residents of census tracts that contain oil refineries earn 13-16% less than those in the greater region and/or MSAs (Figure 2). Similarly, in comparing oil refinery census tract incomes to state averages we see a slightly larger 17-21% disparity (Figure 3).
Digging Deeper
Figure 4. United States Oil Refinery Income Disparities (Note: Larger points indicate oil refinery census tracts that earn less than the surrounding region or city.)
Oil refinery income disparities seem to occur not just in one region, but across the U.S. (Figure 4).
The biggest regional/MSA disparities occur in northeastern Denver neighborhoods around the Suncor Refinery complex (103,000 BPD), where the refinery’s census tracts earn roughly $42,000 less than Greater Denver residents1. California, too, has some issues near its Los Angeles’ Valero and Tesoro Refineries and Chevron’s Bay Area Refinery, with a combined daily capacity of nearly 600 BPD. There, two California census associations in the shadow of those refineries earn roughly $38,000 less than Contra Costa and Los Angeles Counties, respectively. In the Lone Star state Marathon’s Texas City, Galveston County refinery resides among census tracts where annual incomes nearly $33,000 less than the Galveston-Houston metroplex. Linden, NJ and St. Paul, MN, residents near Conoco Phillips and Flint Hills Resources refineries aren’t fairing much better, with annual incomes that are roughly $35,000 and nearly $33,000 less than the surrounding regions, respectively.
Click on the images below to explore each of the top disparate areas near oil refineries in the U.S. in more detail. Lighter shades indicate census tracks with a lower mean annual income ($).
Conclusion
Clearly, certain communities throughout the United States have been essentially sacrificed in the name of Energy Independence and overly-course measures of economic productivity such as Gross Domestic Product (GDP). The presence and/or construction of mid- and downstream oil and gas infrastructure appears to accelerate an already insidious positive feedback loop in low-income neighborhoods throughout the United States. Only a few places like Southeast Chicago and Detroit, however, have even begun to discuss where these disadvantaged communities should live, let alone how to remediate the environmental costs.
Internally Displaced People
There exists a robust history of journalists and academics focusing on Internally Displaced People (IDP) throughout war-torn regions of Africa, the Middle East, and Southeast Asia – to name a few – and most of these 38 million people have “become displaced within their own country as a result of violence.” However, there is a growing body of literature and media coverage associated with current and potential IDP resulting from rising sea levels, drought, chronic wildfire, etc.
The issues associated with oil and gas infrastructure expansion and IDPs are only going to grow in the coming years as the Shale Revolution results in a greater need for pipelines, compressor stations, cracker facilities, etc. We would propose there is the potential for IDP resulting from the rapid, ubiquitous, and intense expansion of the Hydrocarbon Industrial Complex here in the United States.
Over 38,000 oil and gas wells have likely been hydraulically fractured in California. The last permitted hydraulic fracturing operation in CA was approved in June 2015. Additionally, new aquifer exemption proposals will make it easier for operators to obtain hydraulic fracturing permits. One of the most interesting and troubling issues we found when analyzing the data on violations is that operators with the highest number of new well permits are also responsible for the majority of violations. In this article, we provide a look at these and other the trends of unconventional drilling in CA.
Updated CA Shale Viewer
First of all, the CA Shale Viewer has been updated! New data has been uploaded into the map about unconventional drilling in California, and new data resources have been used to identify shale gas activity (Fig. 1). Recent reports in CA have exposed what many researchers expected – hydraulic fracturing has been occurring in the state without any oversight or documentation for a long time.
In this presentation of the Updated CA Shale Viewer we showcase an analysis of these new data sources that better describe unconventional drilling in CA. We then look to new well permitting data to see what current spatial trends may mean for future oil and gas development. We also look at a sample of operator violations issued by the state regulatory agency to tell us a bit about who the bad actors may be.
Figure 1. CA Shale Viewer – Location of well stimulation & other unconventional oil & gas activity
Fracking in California has been put on hold at the moment as a result of low oil prices combined with the new permitting requirements for groundwater monitoring. In 2015, the CA Council on Science and Technology (CCST) released a report on hydraulic fracturing, as required by State Bill 4, proposed by Senator Pavley. The legislation required the Division of Oil, Gas and Geothermal Resources to create regulations for hydraulic fracturing and other stimulation activities such as acidizing. The report highlighted the necessity of protecting California’s groundwater resources. As another requirement of SB4, the state water resources control board adopted Model Criteria for Groundwater Monitoring in areas of Oil and Gas Well Stimulation, which includes three main components:
Area-specific required groundwater monitoring near stimulation wells by operators
Requirements for designated contractor sampling and testing
Regional scale groundwater monitoring to be implemented by the State Water Board
With these requirements in place to protect groundwater, using hydraulic fracturing and other “extreme” high energy input techniques to extract oil is not currently economical in California. Operators have not submitted a permit application for hydraulic fracturing in CA since June 2015.
This status may change in the near future, though, as DOGGR has proposed groundwater monitoring exemptions for 3 large aquifer systems in Kern and Arroyo Grande counties. Such a proposal would mean that operators would not have to monitor for groundwater contamination in these areas when using hydraulic fracturing or other stimulation technologies like acidizing.
Previous Fracking Activity
One outcome of the aforementioned CCST report on hydraulic fracturing was a review of stimulation activity that has occurred in CA but went undocumented. Researchers at Lawrence Berkeley National Laboratory (LBNL) screened thousands of oil and gas well logs and records to calculate the extent to which hydraulic fracturing was actually being used in California’s oil fields. LBNL derived “Well Stimulation Treatment” probabilities based on the number of well records that reported utilizing hydraulic fracturing.
Probabilities were then derived for each pool, which is a geographically isolated formation within an oil field. Using these probabilities, FracTracker calculated a conservative estimate for the number of stimulated wells in the state at over 38,000. There are 228,010 unique Well ID’s listed in the DOGGR database. This puts the proportion of hydraulically fractured wells in California at 16.7% of the total 228,090 wells known.
New Wells
Whereas many other states break down their oil and gas data to show in what phase of development a well may be, CA identifies all wells between the permitted and producing/injecting phase as “new.” In Figure 2 below you can see the wells identified in 2016 as “new.” The DOGGR dataset shows there are currently 6,561 new wells in California as of July 2016. Counts of new well permits were calculated for individual operators and are listed below in Table 1.
Table 1. Top 10 operators according to new well permit counts in California, along with the number of new well permits currently active, the percent those permits represent of total new well permits in the state, and the percentage of violations the operator is responsible in the DOGGR dataset provided to FracTracker Alliance.
Order
Operator
Permit Count
Permit %
Violations %
1
Aera Energy LLC
2012
30.67%
22.34%
2
Chevron U.S.A. Inc.
968
14.75%
20.35%
3
California Resources Production Corporation
768
11.70%
5.89%
4
Linn Operating, Inc.
574
8.75%
12.04%
5
E & B Natural Resources Management Corporation
572
8.71%
1%
6
California Resources Elk Hills, LLC
374
5.70%
5.52%
7
Seneca Resources Corporation
185
2.82%
2.83%
8
Freeport-McMoRan Oil & Gas LLC
164
2.50%
15.22%
9
Vaquero Energy, Inc.
154
2.35%
0.22%
10
Macpherson Oil Company
116
1.77%
2.09%
There are 68 fields in CA that have added new wells in the new DOGGR dataset published in July 2016. The top 10 fields are listed in Table 2 below.
Table 2. Top 10 Oil Fields by Permit (New Well) Count
Order
Oil Field
Well Count
1
Belridge, South
1518
2
Midway-Sunset
903
3
Poso Creek
553
4
Lost Hills
488
5
Cymric
336
6
Kern River
294
7
Elk Hills
276
8
Kern Front
233
9
McKittrick
186
10
Belridge, North
174
In Figure 2 below, the counts of new wells in fields are shown in shades of yellow/red. The fields with the highest number of new wells are located in the Central Valley. The top 10 operators’ wells are also identified. The majority of new well permits are located in the South Belridge oil field, and the majority of those wells are operated by Aera Energy. As can be seen in the map, most new wells are located in fields in Kern county, but Santa Barbara and Fresno, and even Salinas counties have fields with 40 or more new well permits.
Figure 2. New Well Permitting Map of Unconventional Drilling in California
In most states with heavy oil and gas drilling, data on violations is collected by the state regulatory agency, aggregated in datasets and spreadsheets, and made available to the public. FracTracker has done analyses with such data in the past.
In Pennsylvania for instance, a 2011 look at the data showed us that as the number of inspectors on the ground in the Marcellus Shale fields increases, the number of violations/well actually decrease. This was important information that challenged the cynical hypothesis: that more inspectors mean additional eyes on the ground to identify more violations during inspections. In reality, more inspectors actually mean that operators are held to higher standards, and further best management practices (BMPs) are employed. This trend at least seemed to be the case in Pennsylvania. As a regulatory agency, such knowledge is incredibly important, and even validates increased spending and budgets for more personnel.
In California, the issue of publishing violations data is again met with a similar response from the Division of Oil Gas and Geothermal Resources (DOGGR), specifically the “Oh, is that my job?” question.
How is it shared?
At FracTracker, we spent time working with regulatory officials at DOGGR to get some data on violations. We were informed that at some point in the future, the data may be aggregated and available digitally. Until then, however, a request for the data would have to be made to each of the six district offices individually and would take approximately a year to pull together scanned copies of violations notices in PDF format. Unfortunately, we at FracTracker do not have the capacity to process such files. Instead we asked for anything DOGGR had digitally available, and we were provided with a sample subset of 2,825 violations dating mostly from 2013 and 2014 and only in District 2, the Los Angeles Basin.
What does CA violations data look like?
Looking at the sample of data in Table 2, we see that the majority of violations are caused by the operators that also have the most new well permits. Aera Energy, in particular, is responsible for over 1/5 of all violations in our sample set. Limiting factors and sampling bias of the sample set of violations may impact this analysis, though, as all violations are limited to Los Angeles County. Operators that mostly operate in the Central Valley will be under represented in the violations count. When more violations data becomes available we will be sure to expand this analysis.
Bans and Regulations on Unconventional Drilling in California
Although every state regulatory agency lambasts that they have the most comprehensive and conservative set of oil and gas extraction regulations, California regulators may actually be right. That is, save for New York which has banned hydraulic fracturing outright.
As the price of oil rebounds closer to $100/barrel, there will be more interest by operators to increase unconventional drilling in California. The addition of new aquifer exemptions will make it all the more appealing. These local movements are therefore incredibly important to ensure that “extreme” extraction methods like fracking don’t expand in the future.
Feature Photo: South Belridge field by Sarah Leen, National Geographic
https://www.fractracker.org/a5ej20sjfwe/wp-content/uploads/2016/07/southbelridge_NatGeo_re.jpg400900Kyle Ferrar, MPHhttps://www.fractracker.org/a5ej20sjfwe/wp-content/uploads/2025/09/2025-Wordmark-Logo.pngKyle Ferrar, MPH2016-07-26 04:35:192020-03-12 17:18:14Trends in California’s Oil and Gas Development
CA Crude by Rail, from the Bakken Shale and Canada’s Tar Sands to California Refineries By Kyle Ferrar, Western Program Coordinator & Kirk Jalbert, Manager of Community Based Research & Engagement
Refineries in California plan to increase capacity and refine more Bakken Shale crude oil and Canadian tar sands bitumen. However, CA’s refinery communities that already bear a disparate amount of the burden (the refinery corridor along the north shore of the East Bay) will be more impacted than they were previously. New crude-by-rail terminals will put additional Californians at risk of accidents such as spills, derailments, and explosions. Additionally, air quality in refinery communities will be further degraded as refineries change to lower quality sources of crude oil. Below we discuss where the raw crude oil originates, why people are concerned about crude-by-rail projects, and what CA communities are doing to protect themselves. We also discuss our GIS analysis, showing the number of Californians living within the half-mile blast zones of the rail lines that currently are or will be supported by the new and existing crude by rail terminal projects.
Sources of Raw Crude Oil
Figure 1. Sources of crude oil feedstock refined in California over time (CA Energy Commission, 2015)
California’s once plentiful oil reserves of locally extracted crude are dwindling and nearing depletion. Since 1985, crude extraction in CA has dropped by half. Production from Alaska has dropped even more, from 2 million B/D (barrels per day) to around 500,000 B/D. The 1.9 million B/D refining capacity in CA is looking for new sources of fuels. Refineries continue to supplement crude feedstock with oil from other sources, and the majority has been coming from overseas, specifically Iraq and Saudi Arabia. This trend is shown in figure 1.
Predictions project that sources of raw crude oil are shifting to the energy intensive Bakken formation and Canadian Tar Sands. The Borealis Centre estimates an 800% increase of tar sands oil in CA refineries over the next 25 years (NRDC, 2015). The increase in raw material from these isolated locations means new routes are necessary to transport the crude to refineries. New pipelines and crude-by-rail facilities would be necessary, specifically in locations where there are not marine terminals such as the Central Valley and Central Coast of CA. The cheapest way for operators in the Canadian Tar Sands and North Dakota’s Bakken Shale to get their raw crude to CA’s refinery markets is by railroad (30% less than shipping by marine routes from ports in Oregon and Washington), but this process also presents several issues.
CA Crude by Rail
More than 1 million children — 250,000 in the East Bay — attend school within one mile of a current or proposed oil train line (CBD, 2015). Using this “oil train blast zone” map developed by ForestEthics (now called Stand) you can explore the various areas at risk in the US if there was an oil train explosion along a rail line. Unfortunately, there are environmental injustices that exist for communities living along the rail lines that would be transporting the crude according to another ForestEthics report.
The specific focus of the map in Figure 2 is the five proposed and eight existing crude-by-rail terminals that allow oil rail cars to unload at the refineries. The eight existing rail terminals have a combined capacity of 496,000 barrels. Combined, the 15 terminals would increase CA’s crude imports to over 1 million B/D by rail. The currently active terminals are shown with red markers. Proposed terminals are shown with orange markers, and inactive terminals with yellow markers. Much of the data on terminals was taken from the Oil Change International Crude by Rail Map, which covers the entire U.S.
The same type of facility is currently operating in the East Bay’s refinery corridor in Richmond, CA. The Kinder Morgan Richmond terminal was repurposed from handling ethanol to crude oil, but with no public notice. The terminal began operating without conducting an Environmental Impact Report (EIR) or public review of the permit. Unfortunately, this anti-transparent process was similar to a tactic used by another facility in Kern County. The relatively new (November 2014) terminal in Taft, CA operated by Plains All American Pipeline LLC also did not conduct an EIR, and the permit is being challenged on the grounds of not following the CA Environmental Quality Act (CEQA).
EIRs are an important component of the permitting process for any hydrocarbon-related facility. In April 2015 in Pittsburg, for example, a proposed 50,000 B/D terminal at the WesPac Midstream LLC’s railyard was abandoned due to community resistance and criticism over the EIR from the State Attorney General, along with the larger proposal of a 192,000 B/D marine terminal.
Crude-by-rail terminals bring with them not only the threat of derailments and the risk of other such accidents, but the terminals are also a source of air emissions. Terminals – both rail and marine – are major sources of PAH’s (polycyclic aromatic hydrocarbons). The Sacramento Valley Railroad (SAV) Patriot rail oil terminal at a business park on the former McClellan Air Force Base property actually had its operating permit withdrawn by Sacramento air quality regulators due to this issue (read more). The terminal was unloading and reloading oil tanker cars.
FracTracker’s recent report, Emissions in the Refinery Corridor, shows that the refineries in this region are the major point source for emissions of both cancer and non-cancer risk drivers in the region. These air pollution sources get worse, however. According to the report by NRDC, changing the source of crude feedstock to increased amounts of Canadian Tar Sands oil and Bakken Shale oil would:
… increase the levels of highly toxic fugitive emissions; heavy emissions of particulate, metals, and benzene; result in a higher risk of refinery accidents; and the accumulation of petroleum coke* (a coal-like, dusty byproduct of heavy oil refining linked to severe respiratory impacts). This possibility would exacerbate the harmful health effects faced by the thousands of low-income families that currently live around the edges of California’s refineries. These effects are likely to include harmful impacts to eyes, skin, and the nervous and respiratory systems. Read NRDC Report
The contribution to climate change from accessing the tar sands also needs to be considered. Extracting tar sands is estimated to release on average 17% average more green-house gas (GHG) emissions than conventional oil extraction operations in the U.S., according to the U.S. Department of State. (Greenhouse gases are gases that trap heat in the atmosphere, contributing to climate change on a global scale.) The refining process, too, has a larger environmental / public health footprint; refining the tar sands to produce gasoline or diesel generates an average of 81% more GHGs (U.S. Dept of State. Appendix W. 2015). In total this results in a much larger climate impact (NRDC, NextGen Climate, Forest Ethics. 2015).
Local Fights
People opposed to CA crude by rail have been fighting the railway terminal proposals on several fronts. In Benicia, Valero’s proposal for a rail terminal was denied by the city’s Planning Commission, and the project’s environmental impact report was denied, as well. The city of Benicia, however, hired lawyers to ensure that the railway projects are built. The legality of railway development is protected regardless of the impacts of what the rails may be used to ship. This legal principle is referred to as “preemption,” which means the federal permitting prevents state or local actions from trying to limit or block development. In this case, community and environmental advocacy groups such as Communities for a Better Environment, the Natural Resources Defense Council, and the Stanford-Mills Law Project all agree the “preemption” doctrine doesn’t apply here. They believe preemption does not disallow the city or other local governments from blocking land use permits for the refinery expansion and crude terminals that unload the train cars at the refinery. The Planning Commission’s decision is being appealed by Valero, and another meeting is scheduled for September, 2016.
The fight for local communities along the rail-lines is more complicated when the refinery is far way, under the jurisdiction of other municipalities. Such is the case for the Phillips 66 Santa Maria Refinery, located on California State Highway 1 on the Nipomo Mesa. The Santa Maria refinery is requesting land use permits to extend track to the Union Pacific Railway that transits CA’s central coast. The extension is necessary to bring the rail cars to the proposed rail terminal. This project would not just increase traffic within San Luis Obispo, but for the entirety of the rail line, which passes directly through the East Bay. The project would mean an 80-car train carrying 2 million gallons of Bakken Crude would travel through the East Bay from Richmond through Berekely and Emeryville to Jack London Square and then south through Oakland and the South Bay. This would occur 3 to 5 times per week. In San Luis Obispo county 88,377 people live within the half-mile blast zone of the railroad tracks.
In January, the San Luis Obispo County Planning Department proposed to deny Phillips 66 the permits necessary for the rail spur and terminals. This decision was not easy, as Phillips 66, a corporation ranked Number 7 on the Fortune 500 list, has fought the decision. The discussion remained open with many days of meetings, but the majority of the San Luis Obispo Planning Commission spoke in favor of the proposal at a meeting Monday, May 16. There is overwhelming opposition to the rail spur project coming from 250 miles away in Berkeley, CA. In 2014, the Berkeley and Richmond city councils voted to oppose all transport of crude oil through the East Bay. Without the rail spur approval, Phillips 66 declared the Santa Maria refinery would otherwise transport oil from Kern County via 100 trucks per day. Learn more about this project.
GIS Analysis
GIS techniques were used to estimate the number of Californians living in the half mile “at risk” blast zone in the communities hosting the crude-by-rail lines. First, we estimated the total population of Californians living a half mile from the BNSF and UP rail lines that could potentially transport crude trains. Next, we limited our study area to just the East Bay refinery corridor, which included Contra Costa and the city of Benicia in Solano County. Then, we estimated the number of Californians that would be living near rail lines if the Phillips 66 Santa Maria refinery crude by rail project is approved and becomes operational. The results are shown below:
Population living within a half mile of rail lines throughout all of California: 6,900,000
Population living within a half mile of rail lines in CA’s East Bay refinery communities: 198,000
Population living within a half mile of rail lines along the UP lines connecting Richmond, CA to the Phillips 66 Santa Maria refinery: 930,000
Emissions from Refineries and other Sources By Kyle Ferrar, Western Program Coordinator & Kirk Jalbert, Manager of Community Based Research & Engagement
Key Takeaways
Refineries and petrochemical industry in the Bay Area’s refinery corridor are responsible for the majority of the risk-driving point source emissions in this region.
The Chevron Richmond refinery has the largest refining capacity and emits the most hazardous air pollutants (HAPs).
The Tesoro refinery in Martinez and the Shell refinery in Martinez emit the most HAPs per barrel of oil (based on refining capacity).
The Valero refinery in Benicia, the Tesoro refinery in Martinez, and the Shell refinery in Martinez emit the most criteria air pollutants (CAPs).
If refineries increase their capacity and process more crude, the emissions of these various pollutants will invariably increase.
New emissions rules need to prioritize ambient air quality and hold the Air District and elected officials accountable for policies that increase risk.
Overview of the Bay Area’s Refinery Corridor
The Bay Area Air Quality Management District is revising the rules for facilities that emit a variety of hazardous pollutants into the air. The current draft of the new rules could actually increase the amount polluters are allowed to emit. The communities at risk are speaking out to support policies that would reduce the amount of air pollutants rather than increase the limits. In support of these communities, the FracTracker Alliance has focused on analyzing the sources of air pollutants in the region. The East Bay Oil Refinery Corridor is located along the North Shore of the East Bay, stretching from Richmond, CA east to Antioch, CA. The region has been named a “sacrifice zone” for the heavy concentration of petrochemical industrial sites. In addition to the five refineries along the north coast, these communities host a variety of other heavy industries and waste sites. The locations of these facilities have been mapped previously by the FracTracker Alliance, here. In the report we found that people of color, specifically African Americans, are disproportionately represented in the community demographics. Novel results indicate that Hispanic students may be disproportionately impacted by the presence of the petrochemical industry. In this post, we continue the analysis of risk in the region by providing an analysis of the contributions to air pollution from these facilities.
Regulations
Refineries and other sources of air pollution are regulated by the U.S. EPA’s Clean Air Act (CAA). The CAA regulates two classes of pollutants:
Criteria air pollutants (CAPs) – including sulfur dioxide, oxides of nitrogen, carbon monoxide, and particulate matter; and
Hazardous air pollutants (HAPs), which includes a list of 594 carcinogenic and non-carcinogenic chemicals that pose a risk to those exposed.
In addition, California regulates green-house-gas (GHG) emissions, and refineries are the second largest industrial source of GHGs. These regulations get applied when facilities need to obtain a permit for a new source of air pollution, or if a facility is making a structural change that could significantly affect emissions. Facilities are required to use “Maximum Available Control Technology” as it relates to industry best practices to control emissions. With these existing engineering controls, refinery emissions are released into the air from the multiple sources/processes shown below in Figure 1. Notice that a large amount of emissions are simply from “Leaks.”
Figure 1. Breakdown of emissions from petroleum refineries (US EPA, 2011)
The new rules drafted by the BAAQMD to regulate emissions from the East Bay Oil Refinery Corridor would not cap emissions at any level. The current proposal outlines limits on emissions per barrel, promoting efficiency rather than focusing on emissions reductions. Air quality in the refinery corridor could be improved only if this approach was proposed in conjunction with emission limits or reductions. But as the currently proposed rules stand, emissions could actually increase. Enforcement procedures for infractions are also limited. If a refinery’s emissions violate the per barrel standards, the refinery has a whole 3 years to address the violation. Also, these new rules come at a time when refineries are moving to increase the volume of crude coming in from other regions, such as Canada’s tar sands and the Bakken Shale. These regions produce much lower “quality” crude oil, with much higher emissions. This all amounts to more air pollution rather than less.
Community and environmental activist groups such as the Communities for a Better Environment (CBE) and the Bay Area Refinery Corridor Coalition have raised specific issues with the proposed rules as they stand. First, they allow for increase emissions when Air District data forecasts increasing refinery emissions, despite declining local and domestic fuels demand. Refining the lower quality crude is more energy intensive, which also results in increased emissions. In order to offset the increased emissions, CBE reports that refineries can just increase total refining production to decrease per barrel averages. This would in affect increase emissions to meet regulatory requirements. In addition, transporting the crude via new shipping routes would put additional communities at elevated risk of railway accidents (CBE, 2015).
Ambient Air Quality
Air quality in the Bay Area has been continuously improving over the last few decades, but these refinery communities are still at a significantly higher risk of dying from heart disease and strokes. The largest disparity is felt by the African-American populations. Data for Richmond, CA shows they are 1.5 times more likely to die from these diseases than the Contra Costa county average (Casanova, Diemoz, Lifshay, McKetney, 2010). Emissions reductions not only favor the local communities such as the refinery corridor that are most impacted, but also all of the downwind communities, specifically the Central Valley. The Air District’s 2012 report of PM provides a summary of these trends. PM is an important because it is “the air pollutant that causes by far the greatest harm to public health in the bay area. It is a useful indices because there is a linear correlation between increasing ambient concentrations and mortality. Figure 2 shows the progress the Bay Area has made, overall. This graph is based on regional monitors and not those in the refinery communities, where improvements have not been as drastic. In Figure 3 below, the graph shows major pollutant drivers of seven health risks and how health impacts have been reduced over this time period. What we see from the bar graph, is that non-diesel anthropogenic point sources of PM contribute the most to risk for the majority of health endpoints considered. Across the entire bay area, refineries account for 6% of all PM (BAAQMD, 2012).
An overview of other chemicals associated with the petrochemical industry in ambient air and their resulting health effects are outlined in tables 1-3 below. This is by no means a comprehensive list, but these are chemicals of primary concern, specific to petroleum refinery emissions, and are known risk drivers for the region.
Figure 2. Measurements of PM, averaged across the entire bay area, over time – showing an overall improvement in air quality.
Figure 3. Contribution of different species of air pollution to health impacts. The analysis is specific to the bay area and compares health risks estimates from the past (1980s) to estimates in 2012.
Table 1. Health impacts from criteria air pollutants
Criteria Air Pollutants
Compound
Health Effect
Sulfur Dioxide (SO2) and Oxides of Nitrogen (NOx)
Array of adverse respiratory effects, airway inflammation in healthy people, increased respiratory symptoms in people with asthma
Carbon Monoxide (CO)
Harmful health effects associated with the reduction of oxygen delivery to the body’s organs (heart and brain) and tissues
Particulate Matter
Increased respiratory symptoms, irritation of the airways, coughing, or difficulty breathing, decreased lung function; aggravated asthma; development of chronic bronchitis; irregular heartbeat; nonfatal heart attacks; and premature death in people with heart or lung disease
Table 2. Health impacts from hazardous air pollutants known to be emitted from petroleum refineries
Hazardous Air Pollutants
Compound
Acute
Chronic
Benzene, Toluene, Ethylbenzene, Xylenes
Neurological effects, Irritation of the eye, skin and respiratory tract
Blood disorders (reduced number of red blood cells and aplastic anemia), cancer.
1,3-Butadiene
Irritation of the eyes, throat and respiratory tract
Cardiovascular effects, leukemia, cancer
Naphthalene
Hemolytic anemia, damage to the liver, neurological effects
Cataracts, damage to the retina, hemolytic anemia, cancer
PAHs
Skin disorders, depression of the immune system
Skin disorders (dermatitis, photosensitization), depression of the immune system, damage to the respiratory tract, cataracts, cancer
Table 3. Health impacts from other pollutants emitted from petroleum refineries
Other Pollutants
Compound
Mechanism
Health Effect
Volatile Organic Compounds (VOC)
Combine with NOx in sunlight to create ozone
Significantly reduce lung function and induce respiratory inflammation in normal. Healthy people during periods of moderate exercise, symptoms include chest pain, coughing, nausea, and pulmonary congestion
Compounds with high global warming potential contribute to climate change
Increase in average temperatures, higher levels of ground-level ozone, increased drought, harm to water resources, ecosystems and wildlife, health risk to sensitive populations
North Coast Emissions
With these gains in ambient air quality it is hard to fathom why regulators would consider allowing refineries to increase emissions inventories. For this analysis, the focus was to map and compare emissions inventories from numerous industrial sites, with a particular focus on the petroleum refineries.
Current refinery capacities as of 2014 are shown in Figure 4, below. The Richmond Chevron has the largest refining capacity in the region, by far. Refining capacity is the maximum amount of crude oil the refinery is allowed to refine, according to their permit. Refining capacity numbers are used in place of actual refined crude volumes for this analysis, because actual crude volumes are considered proprietary information and are not published by the California Energy Commission (CEC).
The Richmond refinery has a raw crude (atmospheric crude is the technical term) refinement capacity over twice as large as the Phillips 66 San Francisco Refinery, and almost 40% larger than the Tesoro (Golden Eagle) refinery, which is the second largest in the region. According to the newly proposed rules, this would allow the Richmond refinery to emit the most pollutants.
The raw total emissions data is shown in Figure 5. The Phillips 66 refinery in Rodeo contributes the least to ambient air quality degradation. The Chevron Richmond refinery processes 40 – 100% more than the four other refineries, and emits 10 – 570% more than the other refiners. This large difference in capacity and emissions means that Chevron Richmond is more efficient than some, but much less efficient than others. To understand the efficiency differences between the refineries, the total HAPs emissions were adjusted by the refining capacity, shown below in Figure 6. With this data we can rank the refining efficiency specifically for HAPs emissions, based on facility capacity. The Tesoro refinery in Martinez and the Shell refinery in Martinez emit the most HAPs per barrel oil (based on refining capacity). From highest emitter to lowest emitter per barrel of crude, the facilities can be ranked:
Tesoro Refining & Marketing Co LLC (Golden Eagle Refinery in Martinez)
Shell Oil Products (Martinez Refinery)
Chevron Products Co Richmond Refinery
Valero Refining Co – California Benicia Refinery
Phillips 66 San Francisco Refinery (Rodeo Refinery)
Figure 4. Operating capacity of refineries. The bars show the maximum amount of crude the refineries are allowed to process daily, in barrels (1 barrel = 42 gallons).
Figure 5. Total amount of HAPs emissions from East Bay refineries
Figure 6. Relative HAPs emitted from each refinery adjusted by the crude capacity
These refineries along with the other industrial sites in the region have been mapped below in Figure 7. The data has been displayed to show the HAPs emissions from these facilities. The amounts of emissions are shown with graduated circles. The larger the circle, the higher the emissions. The cumulative summation of HAPs is a good value for comparing between facilities with diverse emission inventories (the list of all species of emitted pollutants), but different HAP chemicals have very different effects, both in magnitude and in health impacts. Different chemicals will affect different body systems, as described above in Tables 1-3 above. We have therefore incorporated individual chemical data into the map as well (Figure 7, below). The data displayed shows the total sum of HAPs emitted (in lbs/year) from petrochemical industrial facilities in the region. Explore the map to see emission sources for a selection of important pollutants. Smaller industrial sites/sources have been left out of the map.
Figure 7. Map of the East Bay’s Refinery Corridor with emissions data
View Map Fullscreen | How Our Maps Work
If you open the map into its own page, you can toggle between individual chemical emissions from these facilities. Use the layers tab to change the chemicals displayed. For more information on the individual chemicals, continue reading below.
This unique selection of pollutants was chosen by identifying the highest health risk drivers in the region. They are known to increase both cancer and non-cancer risk for residents in the bay area. The graphs that follow show the emissions inventories reported by each refinery. The refineries are organized on the X –axis according to increasing refining capacity, as they are in Figure 4, above.
Analysis of the graphs show that the Richmond Chevron facility is a largely responsible for 1,2,4-trimethylbenzene, naphthalene, hydrogen cyanide, PAH’s, vanadium, lead and nickel compounds. The Tesoro refinery is mostly responsible for almost all of the 1,3-butadiene, and most responsible for hydrogen sulfide and VOCs. Shell is mostly responsible for the ethylbenzene, much of the mercury and sulfur dioxide emissions, and the most VOCs. Valero in Benicia is responsible for much of the 1,2,4-trimethylbenzene, all BTEX compounds, the most nickel compounds, and the most oxides of nitrogen. And finally, the Phillips 66 refinery in Rodeo with the lowest operating capacity also had the lowest emissions in almost every case except lead, which was very large compared to all refineries except Chevron Richmond. The Valero refinery in Benicia, the Tesoro refinery in Martinez, and the Shell refinery in Martinez emit the most criteria air pollutants (CAPs), including PM2.5 (particulate matter with a diameter less than 2.5 um), sulfur dioxide, and oxides of nitrogen.
Figure 8 – 22. Emissions totals of various air pollutants from East Bay refineries
Marine Terminals
Emissions from marine terminals are also a significant source of HAPs and particulate matter. In the map in Figure 7, the marine terminals are shown with yellow markers. Their relative contributions of total hazardous pollutants are much less than the refineries and other sources, but when we look at specific risk drivers, such as 1,3-butadiene and benzene, we find that their contributions are quite sizable. Marine terminals are also a key component for the refineries looking to access more low-grade crude. Increasing the refining capacity of the refinery will also increase the emissions from the terminals.
The Tesoro Golden Eagle Refinery in Martinez, CA was recently approved for a 30-year lease on a new marine terminal. The new terminal will allow Tesoro to switch to processing lower-cost, lower-quality crude oil from California, Bakken crude, and Canadian tar sands. When crude is transported via ocean liner, besides the issue of air pollution there is the additional risk of an ocean spill. Tom Griffith, Martinez resident and co-founder of the Martinez Environmental Group and founding member of the Bay Area Refinery Corridor Coalition recently summed up the threat, saying:
When you take a close look at what is going on in the marine oil terminals along the refinery corridor from Richmond to Stockton, it’s chilling to imagine what could happen if a huge oil tanker carrying tar sands crude crashed in the Bay! (Earthjustice, 2015)
Incidents
Figure 23. Fires at Chevron Richmond Refinery 2012. Photo by John Sebastian Russo for the SF Chronicle
Like oil spills from tankers, there are other risks of industrial accidents for refineries that need to be considered. Accidents or incidents may occur that result in a sudden, large release of air pollution. Looking at the emissions data, the Richmond Chevron refinery with the largest production capacity may seem to be an efficient station compared to the other refineries. However, an explosion and large fire in 2012 there sent 15,000 community members to local hospitals with respiratory distress. The SF Chronicle’s coverage of the story can be found here. (Fire shown in photo right.) The incident resulted from pipes corroding and failing, and the facility failing to make the decision to shut down the process. The resulting plume of smoke is shown in the cover photo of this article. Other major explosions and fires have occurred in the recent past, as well, including a flaring incident in 2014, a fire in 2007, and two other explosion and fire events in 1999 and 1989.
Of course these events are not unique to the Chevron refinery. The Tesoro Golden Eagle refinery has a reputation of being the most dangerous refinery in the country for occupational hazards, and has one of the worst track records of violations.
Conclusions
If refineries increase their capacity and process more crude, the emissions of these various pollutants will invariably increase. Increased emissions elevate risk for surrounding communities, and in the bay area these communities already bare a disparate burden. Additionally, many of the pollutants will be transported with the prevailing wind that blows from the coast up the river delta and into the central valley. In FracTracker’s recent analysis of impacted communities in the refinery corridor, maps of air quality showed that the refinery communities are some of the most impacted in the entire bay area.
What we find in this report is that the refineries and petrochemical industry in the refinery corridor are responsible for the majority of the risk-driving emissions in this region. When the risk and total emissions are averaged for the entire Bay Area, the risk outcomes are much less than for those living in the communities hosting the industries. New emissions rules should prioritize contributions of emissions to ambient air pollution loads. The biggest issue with using a “per barrel” emissions limit is that it prioritizes the refining capacity rather than mitigating the existing health impacts. These types of policy decisions deal directly with risk management. The Air Management District must decide what amount of cancer and disease are acceptable to keep the refineries in the communities. An upper limit on emissions makes it easier to set a risk limit, an upper bound for health impacts. The upper limit also holds the Air Management District and elected officials accountable for their policy decisions.
BAAQMD. 2012. Summary of PM Report. Bay Area Air Quality Management District. Accessed 4/15/16.
** Feature image of the Richmond Chevron Refinery courtesy of D.H. Parks
https://www.fractracker.org/a5ej20sjfwe/wp-content/uploads/2016/04/Chevron_2012_Cover.jpg400900Kyle Ferrar, MPHhttps://www.fractracker.org/a5ej20sjfwe/wp-content/uploads/2025/09/2025-Wordmark-Logo.pngKyle Ferrar, MPH2016-04-29 14:33:532020-03-13 08:40:32Air Pollution in the Bay Area’s Refinery Corridor
Kyle Ferrar, Western Program Coordinator & Kirk Jalbert, Manager of Community-Based Research & Engagement
Key Takeaways
Communities living along the North Coast of the East Bay region in California are the most impacted by the presence of the petrochemical industry in their communities.
Emissions from these facilities disproportionately degrade air quality in this corridor region putting residents at an elevated risk of cancer and other health impacts.
People of color are more likely to live near the refineries and are therefore disproportionately affected.
Refinery Corridor Introduction
The North Coast of California’s East Bay region hosts a variety of heavy industries, including petroleum refineries, multiple power plants and stations, chemical manufacturing plants, and hazardous waste treatment and disposal facilities. Nationwide, the majority of petroleum refineries are located in heavily industrialized areas or near crude oil sources. The north coast region is unique. Access to shipping channels and the location being central to the raw crude product from North Dakota and Canada to the North, and California’s central valley oil fields to the south has resulted in the development of a concentrated petrochemical infrastructure within the largely residential Bay Area. The region’s petrochemical development includes seven fossil fuel utility power stations that produce a total of 4,283 MW, five major oil refineries operated by Chevron, Phillips 66, Shell Martinez, Tesoro, and Valero, and 4 major chemical manufacturers operated by Shell, General Chemical, DOW, and Hasa Inc. This unequal presence has earned the region the title, “refinery corridor” as well as “sacrifice zone” as described by the Bay Area Refinery Corridor Coalition.
The hazardous emissions from refineries and other industrial sites are known to degrade local air quality. It is therefore important to identify and characterize the communities that are affected, as well as identify where sensitive populations are located. The communities living near these facilities are therefore at an elevated risk of exposure to a variety of chemical emissions. In this particular North Coast region, the high density of these industrial point sources of air pollution drives the risk of resultant health impacts. According to the U.S.EPA, people of color are twice as likely to live near refineries throughout the U.S. This analysis by FracTracker will consider the community demographics and other sensitive receptors near refineries along the north coast corridor.
In the map below (Figure 1) U.S. EPA risk data in CalEnviroscreen is mapped for the region of concern. The map shows the risk resulting specifically from industrial point sources. Risk along the North Coast is elevated significantly. Risk factors calculated for the region show that these communities are elevated above the average. The locations of industrial sites are also mapped, with specific focus on the boundaries or fencelines of petrochemical sites. Additional hazardous sites that represent the industrial footprint in the region have been added to the map including sites registered with Toxic Release Inventory (TRI) permits as well as Superfund and otherComprehensive Environmental Response, Compensation, and Liability Act (CERCLA) sites. The Toxmap TRI sites are facilities that require a permit to emit hazardous air pollutants. The superfund and other CERCLA sites are locations where a historical footprint of industry has resulted in contamination. The sites are typically abandoned or uncontrolled hazardous waste sites that are part of register for tax-funded clean-ups.
Figure 1. Interactive map of risk in the East Bay’s North Coast refinery corridor
Oil refineries in particular are unique sources of air emissions. There are 150 large domestic refineries throughout the United States. They are shown in the map in Figure 2 below. The majority (90%) of the refined products from these refineries are fuels; motor vehicle gasoline accounts for 40%. The refinery sites have hundreds of stacks, or point sources, and they emit a wide variety of pollutants, as outlined by the U.S. EPA:
Criteria Air Pollutants (CAPs)
Sulfur Dioxide (SO2)
Nitrogen Oxides (NOx)
Carbon Monoxide (CO)
Particulate Matter (PM)
Volatile Organic Compounds (VOCs)
Hazardous Air Pollutants (HAPs)
Carcinogens, including benzene, naphthalene, 1,3-butadiene, PAH
Non-carcinogenic HAP, including HF and HCN
Persistent bioaccumulative HAP, including mercury and nickel
Greenhouse Gases (GHG)
Hydrogen Sulfide (H2S)
Figure 2. Map of North American Petroleum Refineries
Disparate health impacts are therefore a known burden for these Bay Area communities. The region includes the cities of Richmond, Pinole, Hercules, Rodeo, Crockett, Port Costa, Benicia, Martinez, Mt. View, Pacheco, Vine Hill, Clyde, Concord, Bay Point, Antioch, and Oakley. In addition to preserving the ecological system health of this intercostal region is also important for both the ecological biodiversity of the marsh as well as commercial and recreational purposes. These wetlands provide a buffer, able to absorb rising waters and abate flooding.
The Bay Area Air Quality Management District’s (BAAQMD) Cumulative Impacts report identified areas where air pollution’s health impacts are relatively high in the San Francisco Bay Area. The report is does not limit their analysis to the North Coast, but shows that these regions with the most impacts are also the most vulnerable due to income, education level, and race and ethnicity. The report shows that there is a clear correlation between socio-economic disadvantages and racial minorities and the impacted communities. Figure 3 shows the regions identified by the BAAQMD as having the highest pollution indices.
Analysis
This analysis by FracTracker focuses specifically on the north shore of the East Bay region. Like the BAAQMD report, National Air toxic Assessment (NATA) data to identify census tracts with elevated risk. Specifically, elevated cancer and non-cancer risk from point sources emitting hazardous air pollutants (HAPs) as regulated by the U.S. EPA were used. CalEnviroScreen 2.0 data layers were also incorporated, specifically the U.S. EPA’s Risk Screening Environmental Indicators (RSEI) data. RSEI uses toxic release inventory (TRI) data, emission locations and weather to model how chemicals spread in the air (in 810m-square grid units), and combines air concentrations with toxicity factors.
The census tracts that were identified as disproportionately impacted by air quality are shown in the map below (Figure 4). The demographics data for these census tracts are presented in the tables below. Demographics were taken from the U.S. census bureau’s 2010 Census Summary File 1 Demographic Profile (DP1). The census tracts shapefiles were downloaded from here.
Figure 4. Interactive Map of Petrochemical Sites and Neighboring Communities in the East Bays North Coast Industrial Corridor
Buffers were created at 1,000 ft; 2,000 ft; and 3,000 ft buffers from petrochemical sites. These distances were developed as part of a hazard screening protocol by researchers at the California Air Resources Board (ARB) to assess environmental justice impacts. The distances are based on environmental justice literature, ARB land use guidelines, and state data on environmental disamenities (Sadd et al. 2011). A demographical profile was summarized for the population living within a distance of 3,000 feet, and for the census tracts identified as impacted by local point sources in this region. The analysis is summarized in Table 1 below. Additional data on the socioeconomic status of the census tracts is found in Table 2.
Based on the increased percentage of minorities and indicators of economic hardship shows that the region within the buffers and the impacted census tracts host a disproportionate percentage of vulnerable populations. Of particular note is 30% increase in Non-white individuals compared to the rest of the state. We see in Table 2 that this is disparity is specifically for Black or African American communities, with an over 150% increase compared to the total state population. The number of households reported to be in poverty in the last 12 months of 2014 and those households receiving economic support via EBT are also elevated in this region. Additional GIS analysis shows that 7 healthcare facilities, 7 residential elderly care facilities, 32 licensed daycares, and 17 schools where a total of 10,474 students attended class in 2014. Of those students, 54.5% were Hispanic and over 84% identified as “Non-white.”
Table 1. Demographic Summaries of Race. Data within the 3,000 ft buffer of petrochemical sites was aggregated at the census block level.
Total Population
Non-White
Non-White (%ile)
Hispanic or Latino
Hispanic or Latino (%ile)
Impacted Census Tracts
387,446
212,307
0.548
138,660
0.358
3,000 ft. Buffer
77,345
41,696
0.539
30,335
0.392
State Total
37,253,956
–
0.424
–
0.376
Table 2. Additional Status Indicators taken from the 2010 census at the census tract level
Indicators (Census Tract data)
Impacted Count
Impacted Percentile
State Percentile
Children, Age under 5
27,854
0.072
0.068
Black or African American
60,624
0.156
0.062
Food Stamps (households)
–
0.1103
0.0874
Poverty (households)
–
0.1523
0.1453
Conclusion
The results of the refinery corridor analysis show that the communities living along the North Coast of the East Bay region are the most impacted by the presence of the petrochemical industry in their communities. Emissions from these facilities disproportionately degrade air quality in this corridor region putting residents at an elevated risk of cancer and other health impacts. The communities in this region are a mix of urban and single family homes with residential land zoning bordering directly on heavy industry zoning and land use. The concentration of industry in this regions places an unfair burden on these communities. While all of California benefits from the use of fossil fuels for transportation and hydrocarbon products such as plastics, the residents in this region bear the burden of elevated cancer and non-cancer health impacts.
Additionally, the community profile is such that residents have a slightly elevated sensitivity when compared to the rest of the state. The proportion of the population that is made up of more sensitive receptors is slightly increased. The region has suburban population densities and more children under the age of 5 than average. The number of people of color living in these communities is elevated compared to background (all of California). The largest disparity is for Black or African American residents. There are also a large number of schools located within 3,000 ft of at least one petrochemical site, where over half the students are Hispanic and the vast majority are students of color. Overall, people of color are disproportionately affected by the presence of the petrochemical industry in this region. Continued operation and any increases in production of the refineries in the East Bay disproportionately impact the disadvantaged and disenfranchised.
With this information, FracTracker will be elaborating on the work within these communities with additional analyses. Future work includes a more in depth look at emissions and drivers of risk on the region, mapping crude by rail terminals, and working with the community to investigate specific health endpoints. Check back soon.
https://www.fractracker.org/a5ej20sjfwe/wp-content/uploads/2016/03/chevron-refinery_cover.jpg400900Kyle Ferrar, MPHhttps://www.fractracker.org/a5ej20sjfwe/wp-content/uploads/2025/09/2025-Wordmark-Logo.pngKyle Ferrar, MPH2016-03-30 20:56:352020-03-12 17:30:45Petrochemical Industry Presence in East Bay CA’s North Coast Refinery Corridor
Who’s in charge here? By Kyle Ferrar, Western Program Coordinator
FracTracker Alliance recently worked with Clean Water Action to map an update to last year’s report* on the use of unlined, above ground oil and gas waste disposal pits, also known as sumps.
The new report identifies additional oil field wastewater pits and details how California regulators continue to allow these facilities to degrade groundwater, surface waters, and air quality. Other oil and gas production states do not permit or allow these type of operations due to the many documented cases of water contamination. A report published in 2011 identified unlined pits and other surface spills as the largest threat to groundwater quality. The sites are ultimately sacrifice zones, where the contamination from produced water and drilling mud solid wastes leaves a lasting fingerprint.
Central Coast & New Central Valley Pit Data
Figure 1. Central Coast wastewater pits
New data has been released by the Central Coast Regional Water Quality Control Board, identifying the locations of 44 active wastewater facilities and 5 inactive facilities in the California counties of Monterey, Santa Barbara, and San Luis Obispo. The number of pits at each facility is not disclosed, but satellite imagery shows multiple pits at some facilities. The locations of the majority of central coast pits are shown in the map in Figure 1, to the right.
In the web map below (Figure 2), the most updated data shows the number of pits at “active” facilities (those currently operating), shown in red and green, and inactive pits, shown in yellow and orange. The number of pits at each facility in the central valley are shown by the size of the graduated circles. Pit count data for the central coast facilities was not reported, therefore all facilities are shown with a small marker.
Figure 2. Interactive map of California oil field wastewater pits
Exploring the new central coast data shows that the operators with the most facilities include Greka Oil & Gas Inc. (14), E & B Natural Resources (10), ERG Operating Company, LLC (6), and Chevron (5). As shown in the table below, the majority of central coast pits are located in Santa Barbara County.
Table 1. Summaries by County
Site Counts by Activity and County
Facility Counts
Pit Counts
County
Active
Inactive
Active
Inactive
Santa Barbara
35
2
Unknown
Unknown
Monterey
9
0
Unknown
0
San Luis Obispo
0
3
0
Unknown
Kern
161
191
673
347
Fresno
8
5
31
14
Tulare
6
1
28
1
Kings
5
0
14
0
San Benito
0
4
0
5
Grand Total
224
206
746
367
Wastewater Pit Regulations
Way back in 1988, the U.S. EPA recognized that the federal regulations governing disposal practices of wastewater are inadequate to protect public health, but has yet to take action (NRDC 2015). There is little chance the U.S. EPA will enact regulations focused on pits. In certain cases, if wastewaters spill or are discharged to surface waters the operations will fall under the jurisdiction of the Clean Water Act and will require a National Pollutant Discharge Elimination System (NPDES) permit. Since the objective of the pit is to contain the wastewater to keep it away from surface waters, pits and the wastewater facilities in California that manage them do not require federal oversight. For now the responsibility to protect health and environment has been left to the states.
Most states have responded and have strict regulations for wastewater management. For the few states that allow unlined pits, the main use is storage of wastewater rather than as an dedicated method of disposal. The majority of high production states have banned or ended the use of unlined pits, including Texas, North Dakota, Pennsylvania, Ohio, and New Mexico, Texas (Heberger & Donnelly 2015). An effective liner will prevent percolation of wastewaters into groundwater. The goal of California oil field wastewater pits is quite the opposite.
For California, percolation is the goal and a viable disposal option.
Therefore other regulations that require monitoring of liquid levels in the pits are moot. In fact there is no evidence of regulation requiring spill reporting in California whatsoever (Kuwayama et al. 2015).
Numerous other extraction states throughout the country have phased out the use of open pits entirely, including those with liners due to the common occurrence of liner failures. The list includes those new players in the shale boom using hydraulic fracturing techniques such as North Dakota, Ohio, Pennsylvania, Wyoming, and Colorado. Rather than using the pits as storage, these states’ regulatory agencies favor instead the protections of closed systems of liquid storage. Wastewaters are stored in large tanks, often the same tanks used to store the fresh water used in the hydraulic fracturing process.
Because hydraulic fracturing in California uses much less water, it should be much easier to manage the flowback fluids and other wastewaters. According to the CCST report, 60% of the produced water from hydraulic fracturing operations was disposed to these unlined pits. Regardless of extraction technique, oil extraction in California produces 15 times the amount of wastewater. In total, an estimated 40% of all produced water was discharged to unlined “percolation” pits. As the 3rd largest oil producing state in the country, this equates to a massive waste stream of about 130 billion gallons/year (Grinberg 2014).
Regulatory Action
The facilities’ permits identify waste discharge requirements (WDRs) that allow for the discharge of oil field wastewater to the “ground surface, into natural drainage channels, or into unlined surface impoundments.” Using the Race Track Hill and Fee 34 Facilities as an example, the WDRS place criteria limits on total dissolved solids (TDS), chlorides, and boron. If you disregard all the other toxic constituents not monitored, the allowable concentration limits set for these three wastewater constituents would be reasonable for a discharge permit on the east coast, where a receiving body of water could provide the volume necessary for dilution. When the wastewater is applied directly to the ground or into a pit, the evaporative loss of water results in elevated concentrations of these contaminants.
Even with these very lax regulations, a number of facilities are in violation of the few restrictions required in their permits. Cease and desist orders have been several operators, most notably to Valley Water Management’s Race Track Hill and Fee 34 Facilities. According to the Regional Water Board documents, the Fee 34 disregarded salinity limitations and other regulations. As a result the Regional Water Board found soil and groundwater contamination that “threatens or creates a condition of pollution in surface and groundwater, and may result in the degradation of water quality.” Reports show that 6 domestic supply and 12 agricultural supply wells are located within 1 mile of the Fee 34 facility. At the Race Track Hill Facility the wastewater is continuously sprayed over several acre fields in a small watershed of the Cottonwood Creek. During a rain, the salt and boron loadings that have accumulated in the soil over the past 60 years of spraying can create increased salt and boron loading in the Kern River and groundwater. This would be a violation of the Clean Water Act (CVRWQCB 2015).
As shown in Table 2, below, the majority of facilities are currently operating without a permit whatsoever (61.2%). Of the 72 facilities that bothered to get permits, 32 (44.4%) received the permit prior to 1975, before the Tulare Basin Plan was implemented to preserve water quality. Of the 183 active facilities in the Central Valley, only 15 facilities have received Cease and Desist (11% of permitted) or Cleanup and Abatement Orders (6% of unpermitted). Only 3 of the 41 active Central Coast facilities operate with a permit (7.3%).
These types of WDR permits that allow pollutants to concentrate in the soil and the groundwater and degrade air quality. Chemicals that pose a public health risk are not being monitored. But at this point, these facilities are not only sites of legacy contamination, but growing threats to groundwater security. Operators say that closing the pits will mean certain doom for oil extraction in California, and recent letters from operators make pleas to DOGGR, that their very livelihood depends on using the pits as dumping grounds. The pits are the cheapest and least regulated mode of disposal.
Table 2. Facility Status Summaries
Facility Status
Activity
Permitted
Permitted; Cease & Desist Order
Unpermitted
Unpermitted; Cleanup & Abatement Order
Grand Total
Active
75
9
137
6
227
Inactive
20
2
184
3
209
Grand Total
92
11
321
9
433
New Mexico Case Study
Much like the groundwater impacts documented by California’s Central Valley Regional Water Quality Control Board, other states have been forced to deal with this issue. The difference is that other states have actually shut down the polluting facilities. In California, cease and desist orders have been met with criticism and pleas by operators, stating that the very livelihood of the oil and gas industry in California depends on wastewater disposal in pits. The same was said in other states such as New Mexico when these crude and antiquated practices were ended. Figure 3 below shows the locations of wastewater pits in New Mexico and the areas where groundwater was contaminated as a result of the pits.
The New Mexico oil and gas industry predicted in August 2008 that fewer drillers would sink wells in New Mexico, at least in part because of the new pit rule. Pro-industry (oil and gas) state representatives were concerned that new drilling techniques coupled with the pit rules could lead to an industry exodus from New Mexico, hoping that the Governor “would step in to help protect an important state revenue source.” But the state’s average rig count from June — when the pit rule took effect — through December 2008 was 7% higher than it was over the same period in the previous year. Development of oil and gas reserves is independent of such regulation. Read the FracTracker coverage of groundwater contamination in New Mexico, here!
Figure 3. Legacy map of cases where pits contaminated groundwater in New Mexico
https://www.fractracker.org/a5ej20sjfwe/wp-content/uploads/2015/10/Sumps_BrianvanderBrug_LATimes_Revised.jpg400900Kyle Ferrar, MPHhttps://www.fractracker.org/a5ej20sjfwe/wp-content/uploads/2025/09/2025-Wordmark-Logo.pngKyle Ferrar, MPH2016-03-09 14:39:482020-03-12 17:32:29More Oil Field Wastewater Pits Found in California!
By Kyle Ferrar, Western Program Coordinator, FracTracker Alliance
A natural gas well equipment failure in southern California has resulted in the largest point release of methane to the atmosphere in U.S. history. California Governor Jerry Brown has declared a California state of emergency for the incident, and the California Air Resources Board (CARB) has identified the site as the single largest source point of global warming.1 Since October 23, 2015 the failure has been reported to be releasing 62 million cubic feet of methane per day – 110,000 pounds per hour – for a total of about 80 million metric tons thus far. (A running counter for the natural gas leak can be found here, on Mother Jones).2,3 This quantity amounts to a quarter of California’s total methane emissions, and the impact to the climate is calculated to be the equivalent of the operation of 7 million cars.
SoCalGas (a subsidiary of Sempra Energy) reports that nothing can be done to stop or reduce the leak until February or March of 2016. As a result, the nearby community of Porter Ranch has been largely evacuated (30,000 people) due to health complaints and the rotten egg smell of tertbutyl mercaptan and tetradydrothiophen. Air quality sampling, being assessed by the Office of Environmental Health Hazard and Assessment (OEHHA), measured volatile organic compounds, specifically the carcinogen benzene, at concentrations below acute toxicity health standards.4 Exposure to benzene even at low levels presents a risk of cancer and other health hazards. Locals have complained of headaches, sore throats, nosebleeds and nausea. The LA County Department of Public Health has ordered SoCalGas to offer free temporary relocation to any area residents affected. About 1,000 people are suing the company.5A fly over of the site has been posted to youtube by the Environmental Defense Fund, and can be seen here. The video uses a FLIR camera to take infrared video that shows the leak.
Site Description
Figure 1. California active natural gas storage fields most active in 2014
The source of the leak is a natural gas storage well operated by SoCalGas in the Aliso Canyon oil field – a drained oil field now used to store natural gas. SoCalGas is the largest natural gas utility in the U.S., distributing natural gas to 20.9 million.4 Aliso Canyon is the largest gas storage field in the state, but there are numerous other gas storage fields in the state that could present similar risks. In Figure 1, to the right, California’s other currently active gas storage fields are shown. Injection volumes of natural gas are summed and averaged over the area of the field, and the Aliso Canyon is shown to have injected over 1,000,000 cubic feet per km2 of natural gas since the beginning of 2014. Other high volume fields include Honor Rancho, McDonald Island Gas, and Wild Goose Gas.
The failed well, known as Standard Sesnon 25, is marked with a red star in the map of gas storage wells shown below (Figure 2). The well was drilled in October of 1953. Reports show that pressures in the well bored reached 2,516 PSI in 2015. If you use the map to navigate around the state of California, it is clear that there are numerous other natural gas storage facilities in California, with wellbore pressures similar to or higher than the reported pressure of Standard Sesnon 25 and other wells in the Aliso Canyon Field. Beyond California, the state of Michigan is reported to have the most natural gas storage by volume, at 1.1 trillion cubic feet.6 The incident that caused the leak was a well casing failure, although the cause of the well casing failure has not yet been identified. There have been numerous editorials written that have painted SoCalGas as a model for contemporary corporate greed and corruption for several reasons, including the removal of safety valves, reports of corrosion, and lack of resources for inspections and repairs.7 Rather than this being a unique case of criminal neglect, casing failures are a statistical likelihood for wells of this age. Well casing failures are a systemic issue of all oil and gas development. Every well casing has a shelf life and will fail eventually.8 Additionally, leaks from gas storage wells have occurred at other SoCalGas natural gas storage facilities in California, such as Montebello and Playa Del Rey.
Figure 2. California’s gas storage wells. The size of orange markers indicates wellhead pressure, as reported in 2015. Blue markers show the volume of gas injected in 2014/2015. The Aliso Canyon leak at ‘Standard Sesnon 25’ natural gas storage well is marked with a red star. Click here to manipulate the map. After expanded, use the “Layers” menu to visualize the data with colored markers rather than size.
Response
Fixing the problem is therefore much more complicated, overall, in this specific case. Since the well casing has ruptured deep underground, natural gas is leaking in the annular space outside the borehole and spewing from the topsoil surrounding the well head. To stop the leak the production pipe must be plugged below the rupture. All attempts to plug the well from the surface have failed due to the high pressure within the borehole, a 7” inner diameter of the production pipe. Therefore, a relief well is being drilled to intersect the well casing, to inject a mud-chemical cocktail intended to plug the well far below the casing failure. Updates on the response, claims information, and the location of the Community Resource Center can be found here. Additionally, Governor Jerry Brown has declared a state of emergency, which means federal support and a requirement of the state of California to cover the costs.9
The state response to the natural gas leak has included numerous agencies. According to documents from California Public Utilities Commission (CPUC), the agencies leading the response are the California Department of Conservation, Division of Oil, Gas, and Geothermal Resources (DOGGR), the Office of Emergency Services (CalOES), California Air Resources Board (ARB), California Division of Occupational Safety and Health (CalOSHA), the California Energy Commission (CEC), and the CPUC. DOGGR is conducting an independent investigation of the incident. The investigation will include a third party analysis for root-cause issues. CARB is monitoring total methane emissions while the Office of Environmental Health Hazard Assessment with CalEPA are collecting and reviewing air quality data. Coordinated response information can be found on the CalOES site. SoCalGas has submitted a proposal to regulators to raise customer rates in order to raise $30 million for a more proactive approach to inspections and repairs.10
This event is the largest, but is not the first major methane/natural gas leak to occur at a wellsite. Leaks can result from a number of natural and anthropogenic (man made) causes. Besides the natural degradation of well integrity with age, acute events can also cause casing failures. There are documented cases where seismic activity has caused casing failures.
As a result of an earthquake natural fractures in the region can grow and disrupt well bores. In areas of dense drilling, fracture stimulations that propagate improperly or intersect unknown faults. When two wells become interconnected, known as “downhole communication” or a “frack hit” when it occurs due to hydraulic fracturing, spills and leaks can occur due to over-pressurization. In many states, these risks are mitigated by having setbacks between wells. California, the most seismically active state, has minimal setbacks for drilling or fracking oil and gas wells. In previous research, FracTracker found that over 96% of new hydraulic fractures in 2013 were drilled within 1,200 feet of another well, which would even violate setback rules in Texas!
Climate Impacts
Natural gas is hailed by the fossil fuel industry as the bridge fuel that will allow the world to transition to renewables. The main argument claims natural gas is necessary to replace coal as our main source of generating electricity. Burning both coal and natural gas produce carbon dioxide, but natural gas is more efficient. For the same amount of energy production, natural gas produces half as much carbon dioxide emissions. The legitimate threat of climate impacts comes from fugitive (leaked) emissions of methane, before the natural gas can be burned. Since methane is a gas, it is much harder to contain than oil or coal. Methane is also more insulating than carbon dioxide in the atmosphere (34-86 times more insulating), making it a more potent greenhouse gas. The leaked natural gas from the Aliso Canyon well is currently equivalent to 7,000,000 tons of CO2 (Updated here, on Mother Jones).
Current estimates show methane is responsible for 25% of the world’s anthropogenic warming to date. Proponents of the bridge fuel theorize that if methane leakage can be kept under 4% of total production, natural gas power generation will provide a climate-positive alternative to coal. EPA estimates set the leakage rate at 2.4%, but independent research estimates actual rates up to 7.9%.11 The EDF has been conducting an $18 million project focused on quantifying methane leaks from the natural gas industry. A team of 20 researchers from 13 institutions conducted the 2 year study measuring emissions from the Barnett Shale. Details can be found on the Environmental Defense Fund’s Page.12
Ingraffea et al. (2013). Assessment and risk analysis of casing and cement impairment in oil and gas wells in Pennsylvania, 2000-2012. PNAS. Vol.111 no.30.
Feature Image: Aliso Canyon natural gas leak – Photo by Environmental Defense Fund
https://www.fractracker.org/a5ej20sjfwe/wp-content/uploads/2016/01/CA-gas-leak_Revised.jpg400900Kyle Ferrar, MPHhttps://www.fractracker.org/a5ej20sjfwe/wp-content/uploads/2025/09/2025-Wordmark-Logo.pngKyle Ferrar, MPH2016-01-11 16:22:382020-03-12 13:37:10A Climate Disaster – California in state of emergency as a result of massive natural gas leak
It is hard to believe, but disposing of hazardous oil and gas wastewaters in unlined, open-air pits – also known as sumps or ponds – is still a common practice in California. It is also permitted in other states such as Texas and West Virginia. Because these ponds are unlined and not enclosed, they contribute to degraded air quality, are a hazard for terrestrial animals and birds, and threaten groundwater quality. A 2014 report by Clean Water Action, entitled In the Pits provides a thorough summary of the issue in California. Since the report was released, new data has been made available by the Central Valley Regional Water Quality Review Board identifying additional locations of wastewater pits.
With the increase of oil and gas development in unconventional reservoirs, such as the Monterey Shale Play in California, the size of the resultant waste stream of drill cuttings, produced brines, and wastewater has skyrocketed. Operators now drill larger, deeper wells, requiring larger volumes of liquid required for enhanced oil recovery methods, such as steam injection, and stimulations such as hydraulic fracturing and acidizing. While California is the 4th largest oil-producing state, it is 2nd only to Texas in wastewater production. This boom of unconventional development, which may still in its infancy in California, has resulted in an annual waste stream of over 130 billion gallons across the state, 80 billion (62%) from Kern County alone.1
Results of the state mandated California Council on Science and Technology Report found that more than half of the California oil industries waste water is “disposed” in pits.2 As outlined by Clean Water Action, the massive waste-stream resulting from drilling, stimulation, and production is one of the most significant and threatening aspects of oil and gas operations in terms of potential impacts to public health and environmental resources.
Wastewater Facility Details
Last February, the LA Times reported on the pits, identifying a total of 933 in California.3 The most recent data from the Regional Water Quality Control Board of the Central Valley shows:
A total of 1,088 pits at 381 different facilities
719 pits are listed as “Active.” 369 are “Idle.”
444/939 (47.3%) ponds do not list a permit.
462 pits are operated by Valley Water Management Corporation.
In Table 1, below, the counts of Active and Idle facilities and pits are broken down further to show the numbers of sites that are operating with or without permits. The same has been done for the operator with the most pits in Table 2, because Valley Wastewater operates nearly 9 times as many pits as the second largest operator, E & B Natural Resources Management Corporation. These two operators, along with California Resources Elk Hills LLC, all operate the same number of facilities (28). The other top 20 operators in Kern County are listed in Table 3, below.
Table 1. Wastewater Pit and Facility Counts by Category
Counts
Active
Idle
Facilities
180
201
Unpermitted Facilities
102
179
Facility Permitted prior to 1985
37
11
Individual Pits
719
369
Unpermitted Individual Pits
187
257
Pit Permitted prior to 1985
252
63
Table 2. Valley Water Wastewater Pit and Facility Counts by Category
Counts
Active
Inactive
Facilities
21
7
Unpermitted Facilities
2
2
Facility Permitted prior to 1985
9
1
Individual Pits
356
78
Unpermitted Individual Pits
5
9
Pit Permitted prior to 1985
166
35
Table 3. Top 20 Operators by Facility Count, with Pond Counts.
Rank
Operator
Pond Count
Facility Count
1
Valley Water Management Company
462
28
2
E & B Natural Resources Management Corporation
53
28
3
California Resources Elk Hills, LLC
31
28
4
Aera Energy LLC
67
25
5
California Resources Corporation
31
23
6
Chevron U.S.A. Inc.
40
14
7
Pyramid Oil Company
21
12
8
Macpherson Oil Company
14
9
9
Schafer, Jim & Peggy
8
8
10
Crimson Resource Management
20
6
11
Bellaire Oil Company
11
6
12
Howard Caywood
11
6
13
LINN Energy
10
6
14
Seneca Resources Corporation
9
6
15
Holmes Western Oil Corporation
6
6
16
Hathaway, LLC
22
5
17
Central Resources, Inc.
15
5
18
Griffin Resources, LLC
13
5
19
KB Oil & Gas
8
5
20
Petro Resources, Inc.
6
5
Maps of the Pit Locations and Details
The following maps use the Water Authority data to show the locations details of the wastewater pits. The first map shows the number of pits housed at each facility. Larger markers represent more pits. Zoom in closer using the [+] to see the activity status of the facilities. Click the link below the map to open a new webpage. View the names of the facility operators by turning on the layer in the “Layers” menu at the top of the page. The second and third maps show the activity and permit status of each facility. The fourth map allows you to view both activity status and permit status simultaneously by toggling the layers on and off (Open the map in its own webpage, then use the layers menu at the top of the screen to change views).
Map 1. Facility Pit Counts with the top 10 operators identified as well as facility status
Map 1. To view the legend and map full screen, click here.
Map 2. Facility Activity Status
Map 2. To view the legend and map full screen, click here.
Map 3. Facility Permit Status
Map 3. To view the legend and map full screen, click here.
Map 4. Facilityhttps://maps.fractracker.org/lembed/?appid=7385605f018e437691731c94bb589f0a” width=”800″ height=”500″> Map 4. To view the legend and map full screen, click here.
https://www.fractracker.org/a5ej20sjfwe/wp-content/uploads/2015/10/Pit-Pipes-AG.jpg400900Kyle Ferrar, MPHhttps://www.fractracker.org/a5ej20sjfwe/wp-content/uploads/2025/09/2025-Wordmark-Logo.pngKyle Ferrar, MPH2015-10-13 10:55:392020-03-12 17:37:53Wastewater Pits Still Allowed in California
In February 2014, the FracTracker Alliance produced our first version of a national well data file and map, showing over 1.1 million active oil and gas wells in the United States. We have now updated that data, with the total of wells up to 1,666,715 active wells accounted for.
Density by state of active oil and gas wells in the United States. Click here to access the legend, details, and full map controls. Zoom in to see summaries by county, and zoom in further to see individual well data. Texas contains state and county totals only, and North Carolina is not included in this map.
While 1.7 million wells is a substantial increase over last year’s total of 1.1 million, it is mostly attributable to differences in how we counted wells this time around, and should not be interpreted as a huge increase in activity over the past 15 months or so. Last year, we attempted to capture those wells that seemed to be producing oil and gas, or about ready to produce. This year, we took a more inclusive definition. Primarily, the additional half-million wells can be accounted for by including wells listed as dry holes, and the inclusion of more types of injection wells. Basically anything with an API number that was not described as permanently plugged was included this time around.
Data for North Carolina are not included, because they did not respond to three email inquiries about their oil and gas data. However, in last year’s national map aggregation, we were told that there were only two active wells in the state. Similarly, we do not have individual well data for Texas, and we use a published list of well counts by county in its place. Last year, we assumed that because there was a charge for the dataset, we would be unable to republish well data. In discussions with the Railroad Commission, we have learned that the data can in fact be republished. However, technical difficulties with their datasets persist, and data that we have purchased lacked location values, despite metadata suggesting that it would be included. So in short, we still don’t have Texas well data, even though it is technically available.
Wells by Type and Status
Each state is responsible for what their oil and gas data looks like, so a simple analysis of something as ostensibly straightforward as what type of well has been drilled can be surprisingly complicated when looking across state lines. Additionally, some states combine the well type and well status into a single data field, making comparisons even more opaque.
Top 10 of 371 published well types for wells in the United States.
Among all of the oil producing states, there are 371 different published well types. This data is “raw,” meaning that no effort has been made to combine similar entries, so “gas, oil” is counted separately from “GAS OIL,” and “Bad Data” has not been combined with “N/A,” either. Conforming data from different sources is an exercise that gets out of hand rather quickly, and utility over using the original published data is questionable, as well. We share this information, primarily to demonstrate the messy state of the data. Many states combine their well type and well status data into a single column, while others keep them separate. Unfortunately, the most frequent well type was blank, either because states did not publish well types, or they did not publish them for all of their wells.
There are no national standards for publishing oil and gas data – a serious barrier to data transparency and the most important takeaway from this exercise…
Wells by Location
Active oil and gas wells in 2015 by state. Except for Texas, all data were aggregated published well coordinates.
There are oil and gas wells in 35 of the 50 states (70%) in the United States, and 1,673 out of 3,144 (53%) of all county and county equivalent areas. The number of wells per state ranges from 57 in Maryland to 291,996 in Texas. There are 135 counties with a single well, while the highest count is in Kern County, California, host to 77,497 active wells.
With the exception of Texas, where the data are based on published lists of well county by county, the state and county well counts were determined by the location of the well coordinates. Because of this, any errors in the original well’s location data could lead to mistakes in the state and county summary files. Any wells that are offshore are not included, either. Altogether, there are about 6,000 wells (0.4%) are missing from the state and county files.
Wells by Operator
There are a staggering number of oil and gas operators in the United States. In a recent project with the National Resources Defense Council, we looked at violations across the few states that publish such data, and only for the 68 operators that were identified previously as having the largest lease acreage nationwide. Even for this task, we had to follow a spreadsheet of which companies were subsidiaries of others, and sometimes the inclusion of an entity like “Williams” on the list came down to a judgement call as to whether we had the correct company or not.
No such effort was undertaken for this analysis. So in Pennsylvania, wells drilled by the operator Exco Resources PA, Inc. are not included with those drilled by Exco Resources PA, Llc., even though they are presumably the same entity. It just isn’t feasible to systematically go through thousands of operators to determine which operators are owned by whom, so we left the data as is. Results, therefore, should be taken with a brine truck’s worth of salt.
Top 10 wells by operator in the US, excluding Texas. Unknown operators are highlighted in red.
Texas does publish wells by operator, but as with so much of their data, it’s just not worth the effort that it takes to process it. First, they process it into thirteen different files, then publish it in PDF format, requiring special software to convert the data to spreadsheet format. Suffice to say, there are thousands of operators of active oil and gas wells in the Lone Star State.
Not counting Texas, there are 39,693 different operators listed in the United States. However, many of those listed are some version of “we don’t know whose well this is.” Sorting the operators by the number of wells that they are listed as having, we see four of the top ten operators are in fact unknown, including the top three positions.
Summary
The state of oil and gas data in the United States is clearly in shambles. As long as there are no national standards for data transparency, we can expect this trend to continue. The data that we looked for in this file is what we consider to be bare bones: well name, well type, well status, slant (directional, vertical, or horizontal), operator, and location. In none of these categories can we say that we have a satisfactory sense of what is going on nationally.
Click on the above button to download the three sets of data we used to make the dynamic map (once you are zoomed in to a state level). The full dataset was broken into three parts due to the large file sizes.
https://www.fractracker.org/a5ej20sjfwe/wp-content/uploads/2015/08/2015Update-Feature.jpg400900Matt Kelso, BAhttps://www.fractracker.org/a5ej20sjfwe/wp-content/uploads/2025/09/2025-Wordmark-Logo.pngMatt Kelso, BA2015-08-03 14:19:532020-07-21 10:30:051.7 Million Wells in the U.S. – A 2015 Update
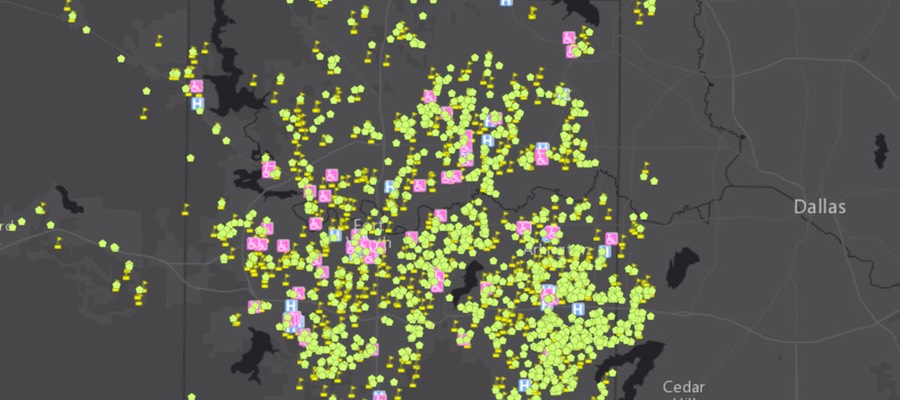
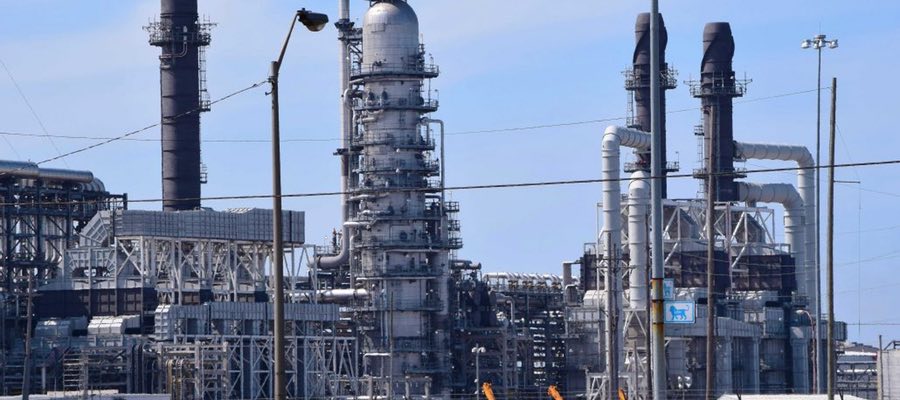
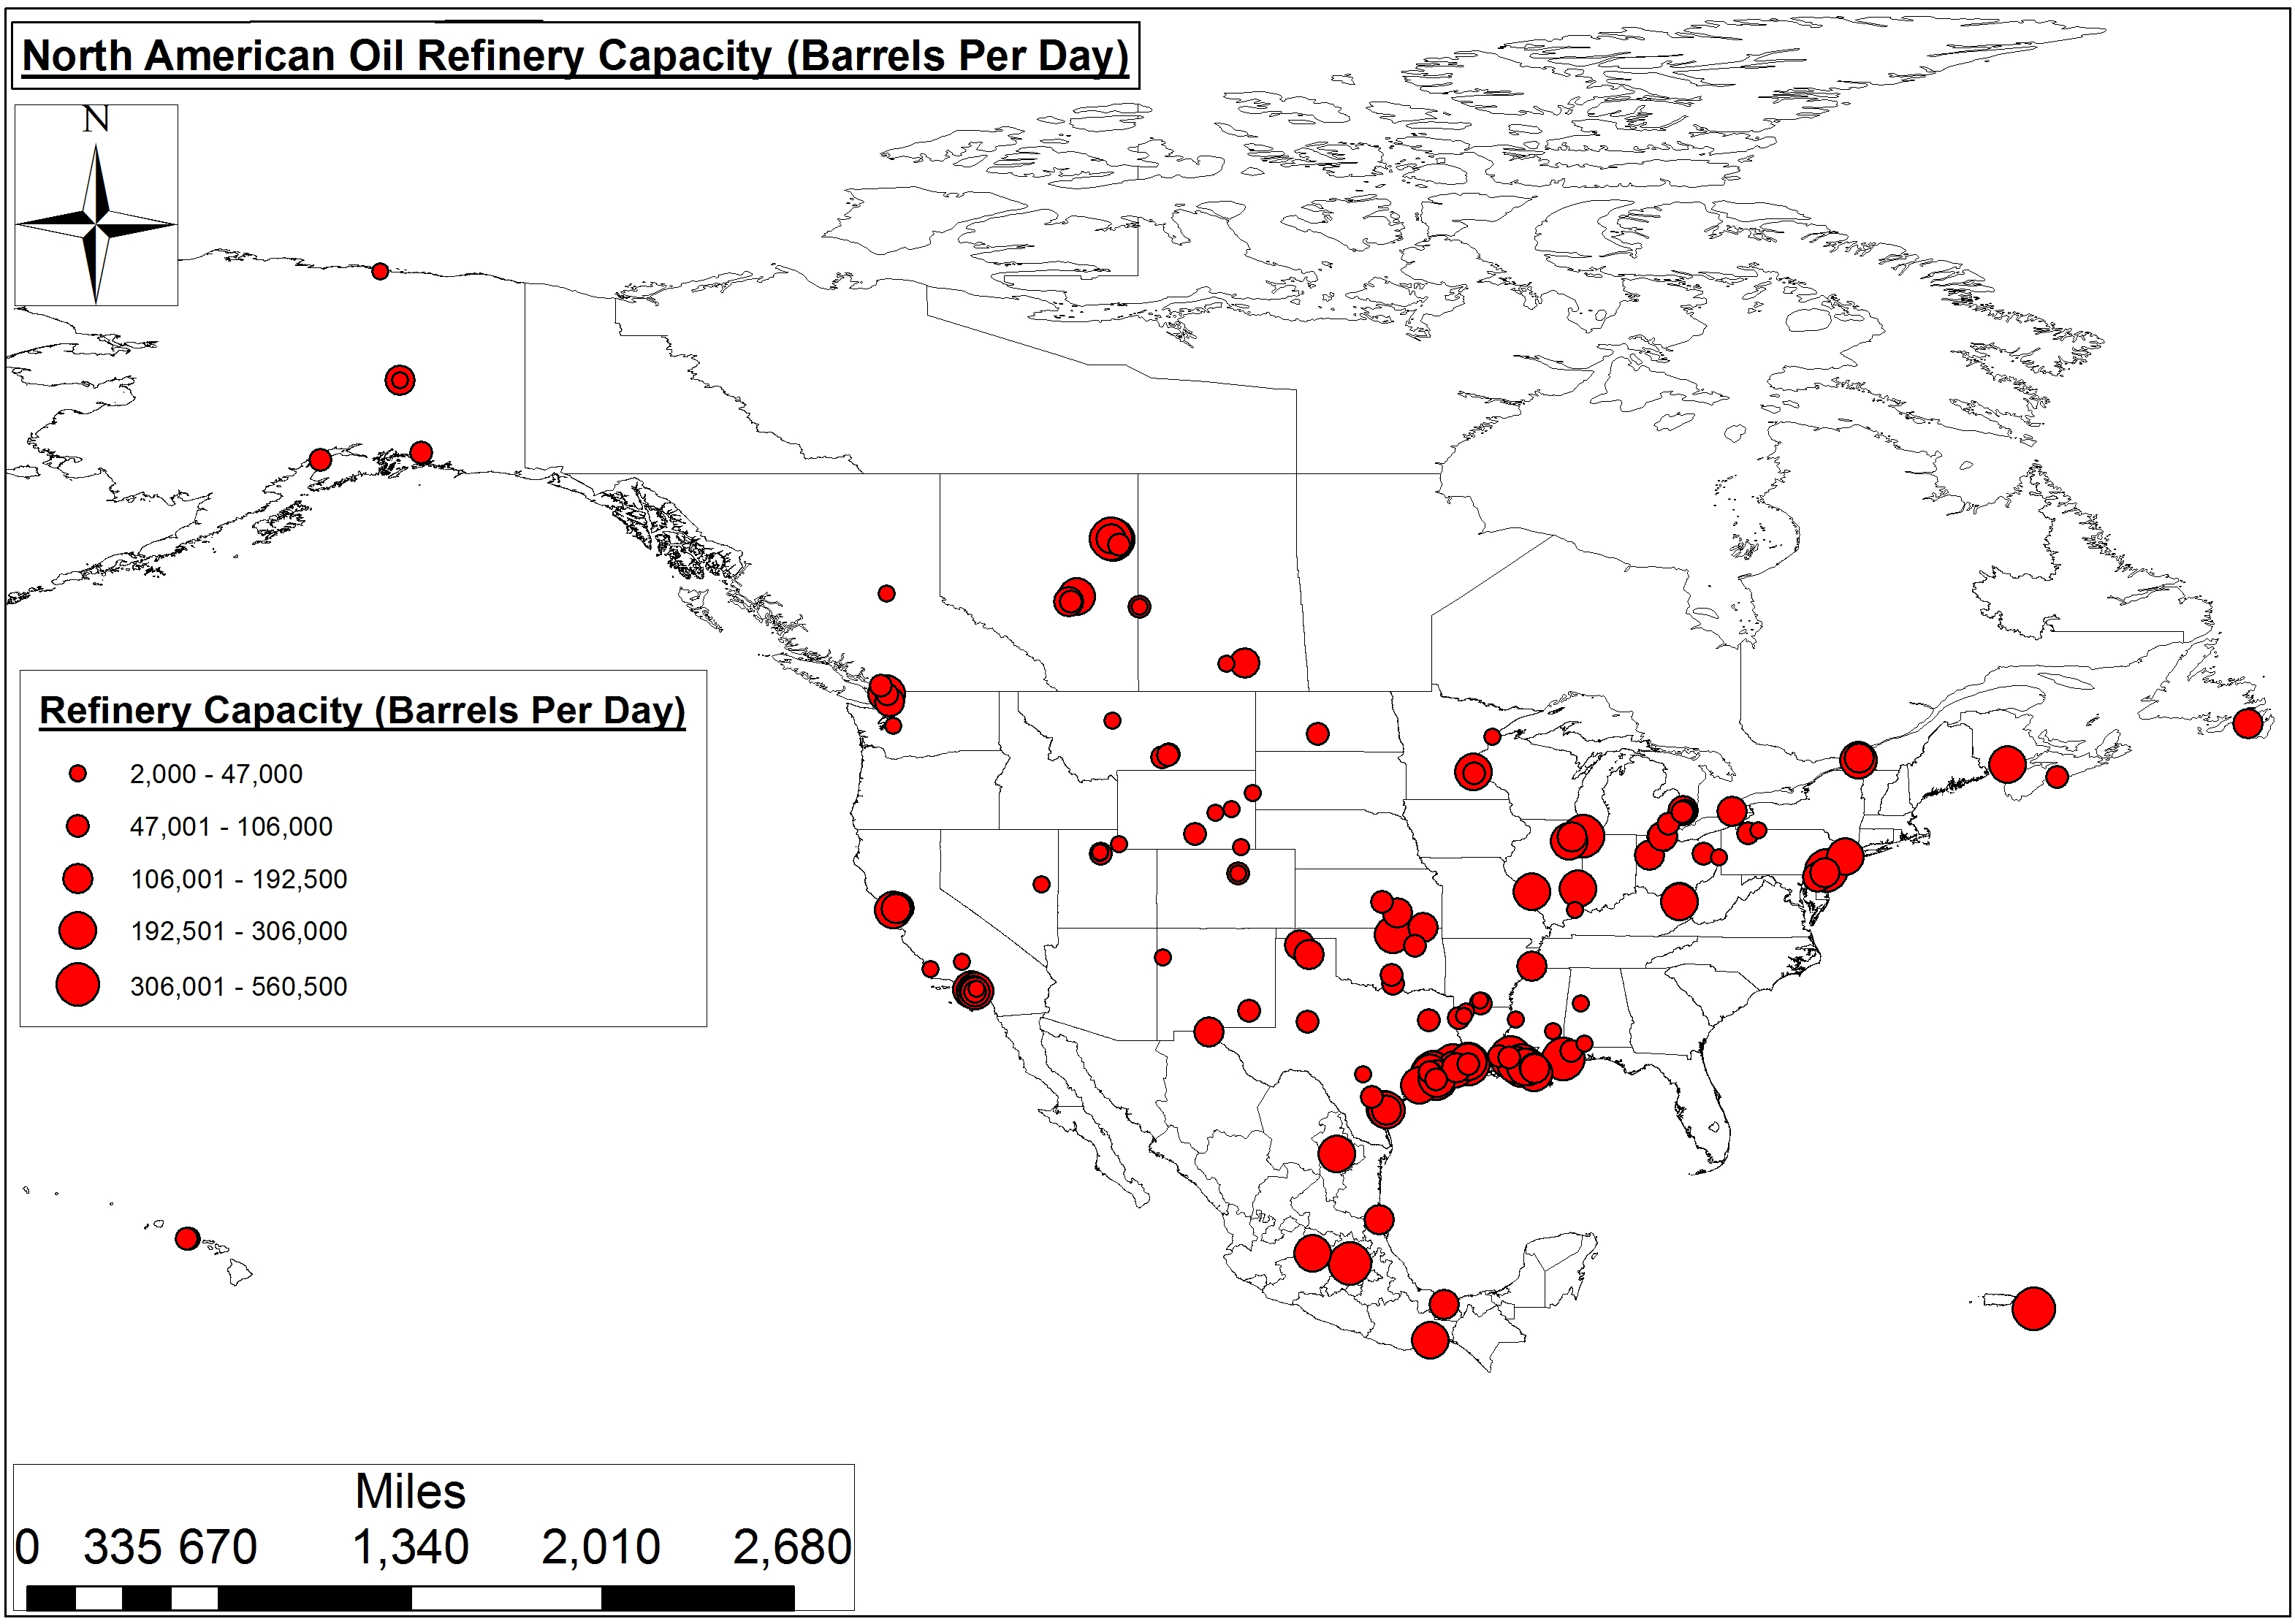
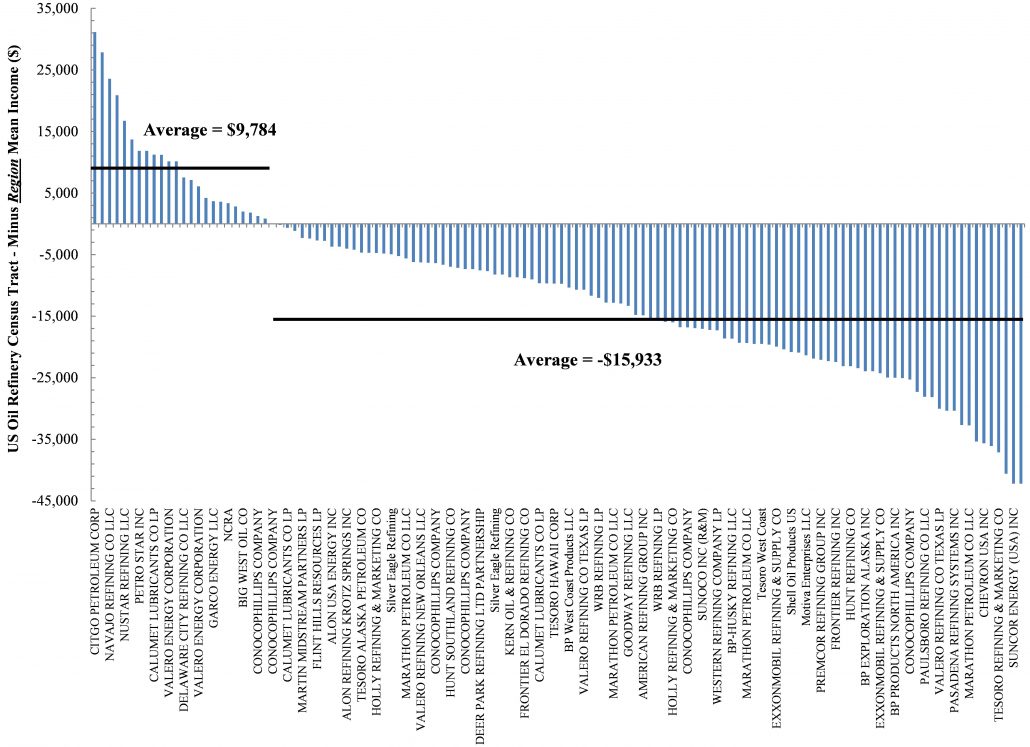
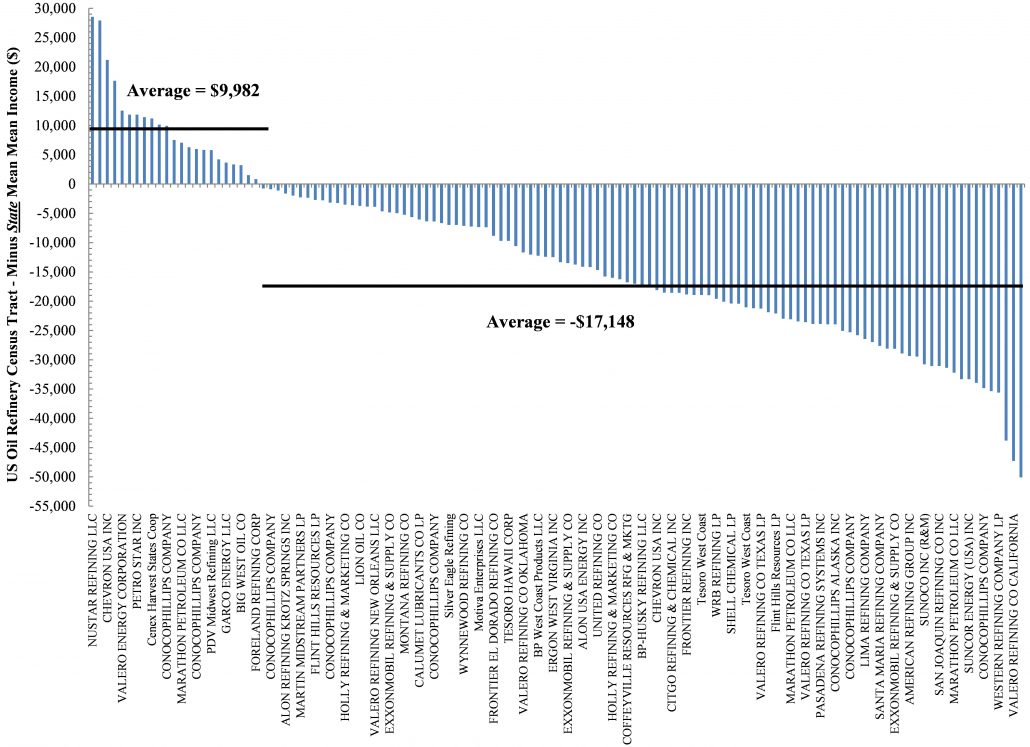
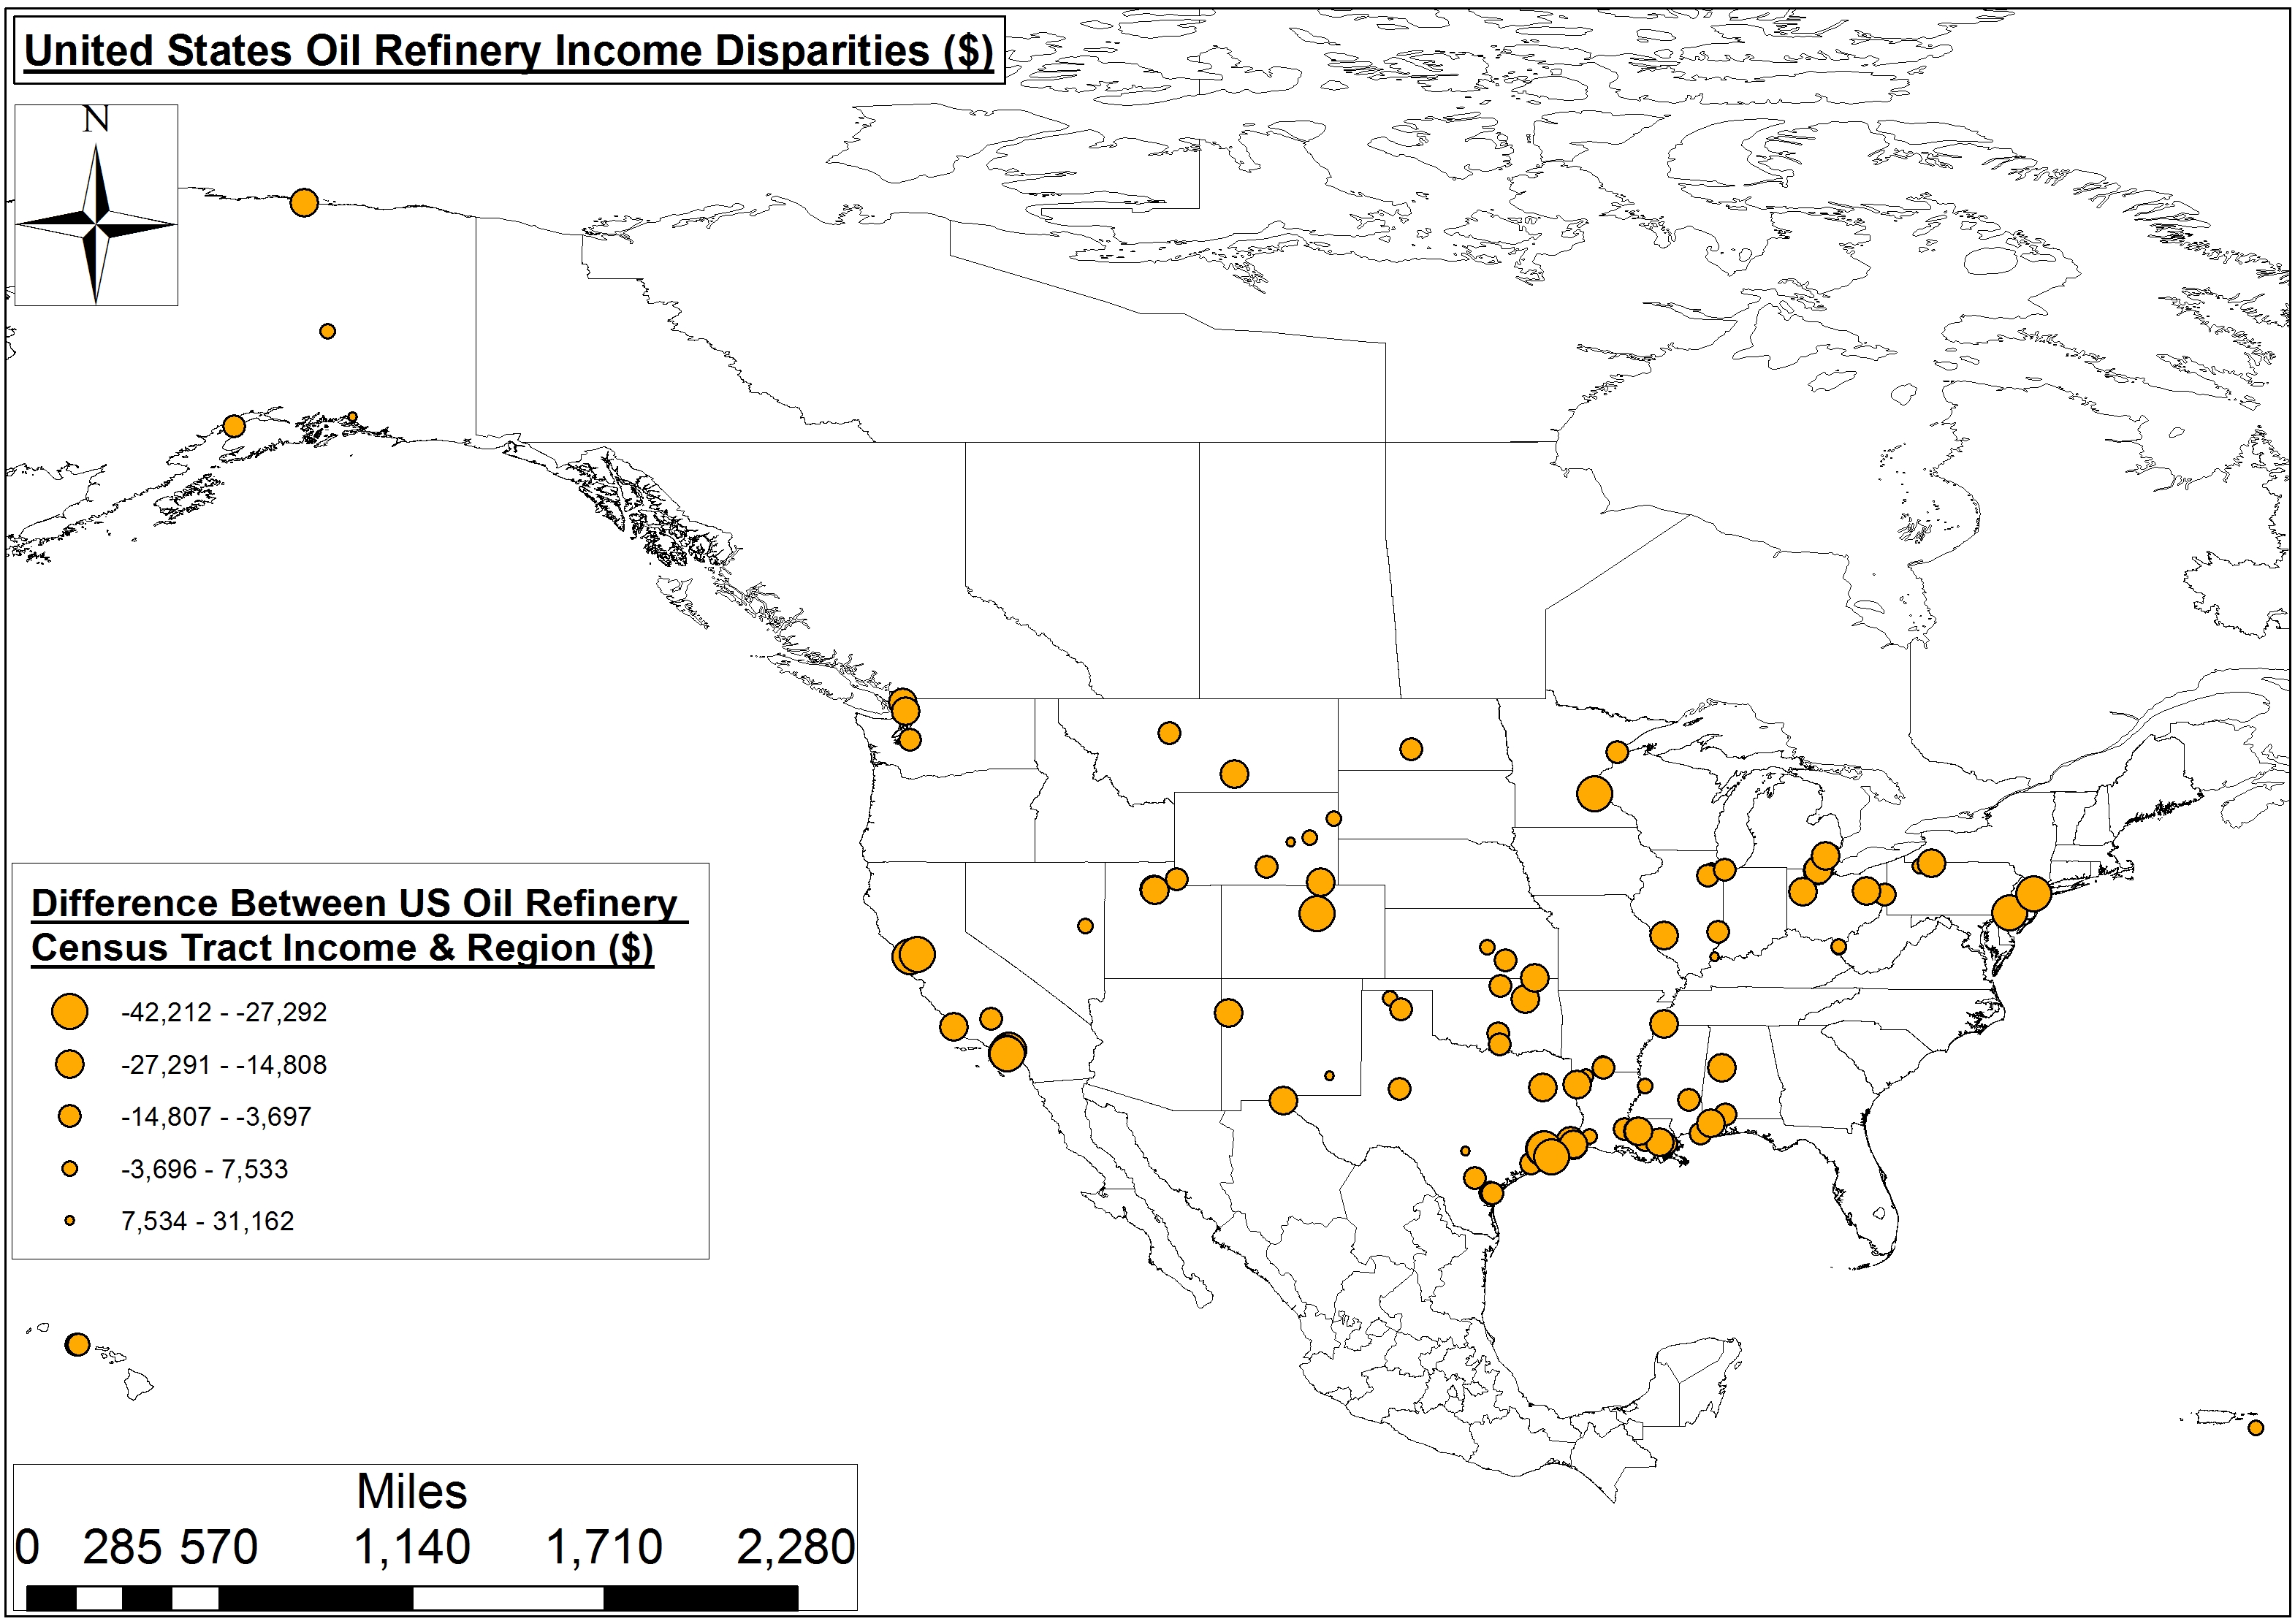
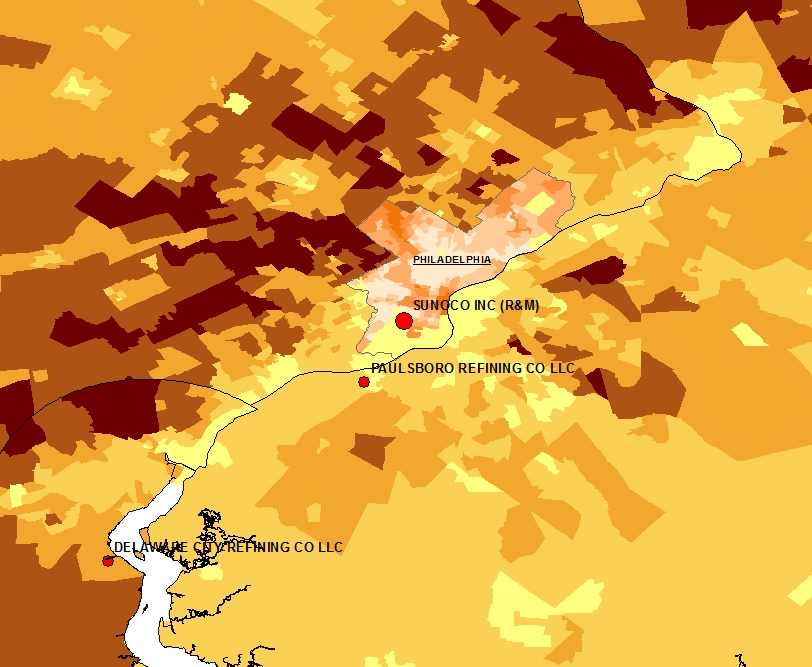
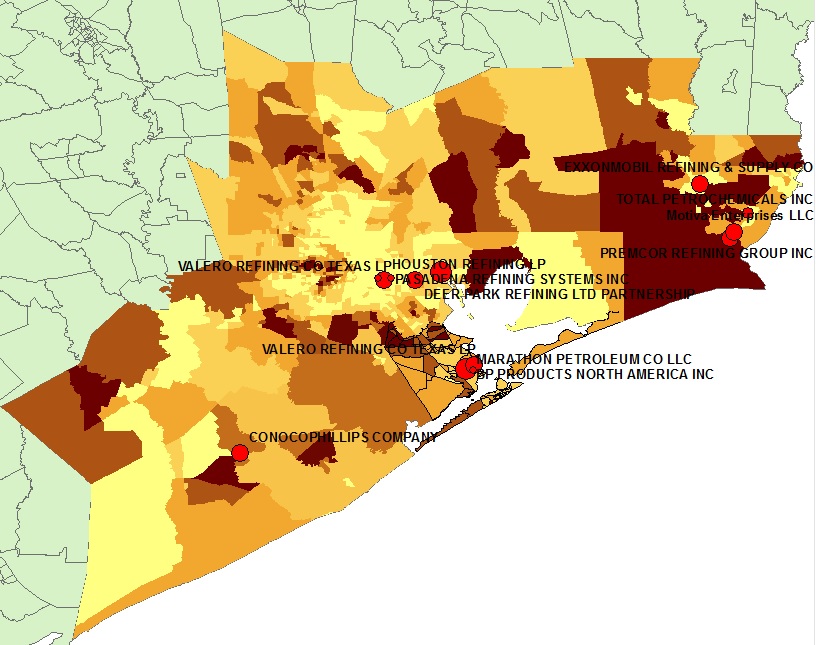
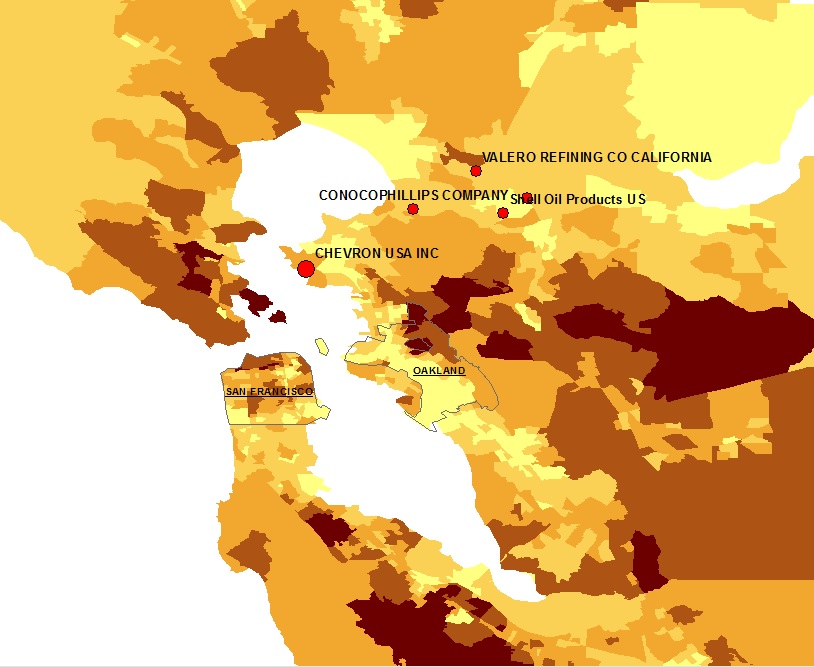
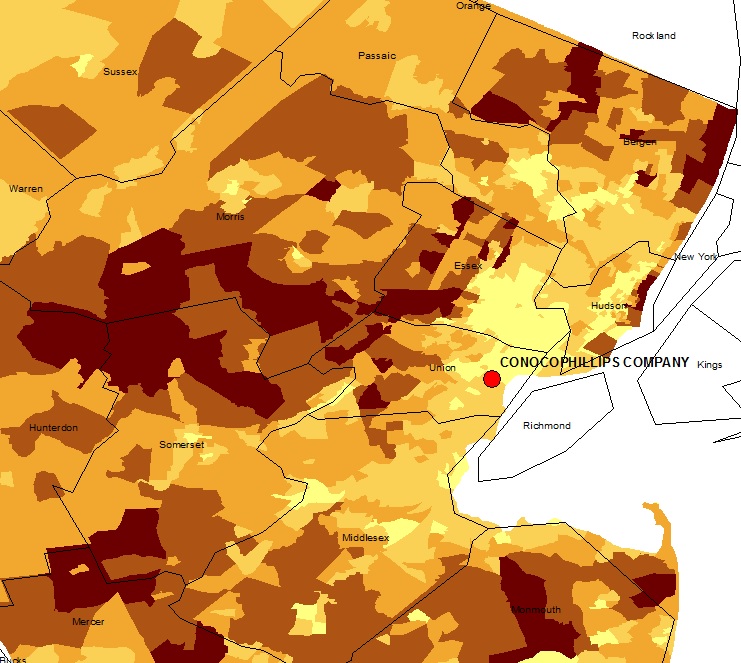
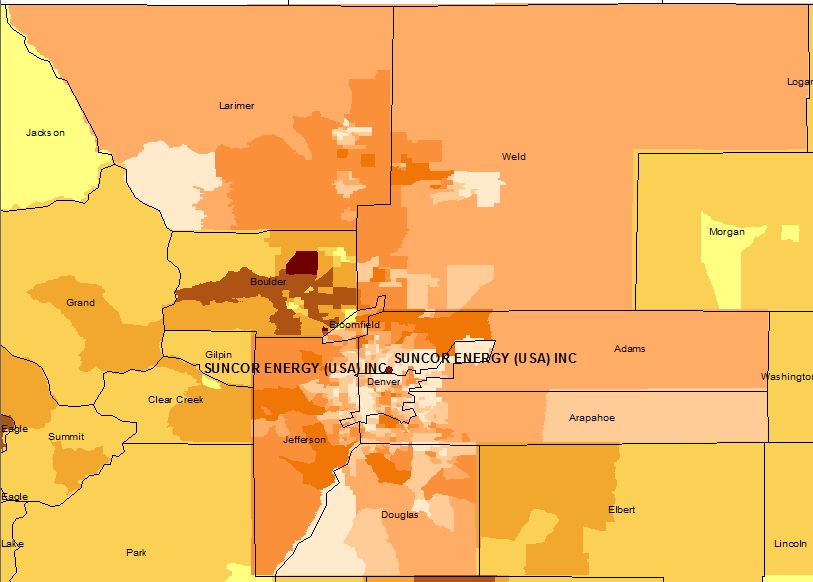
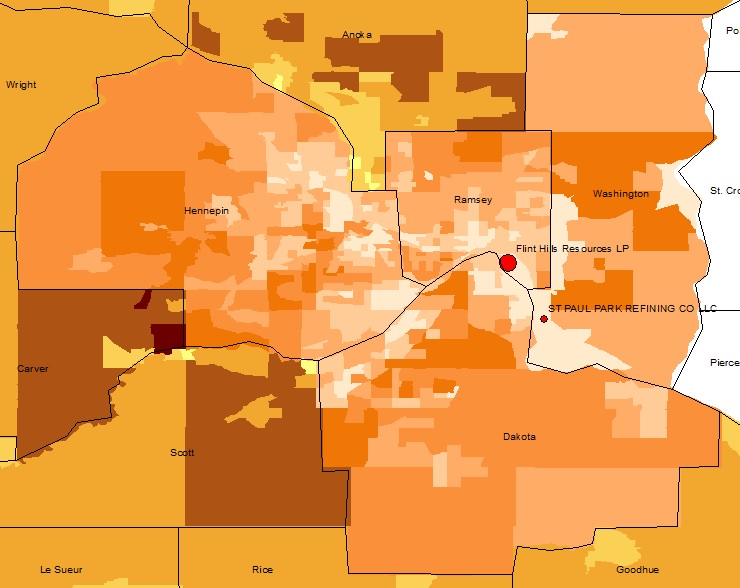
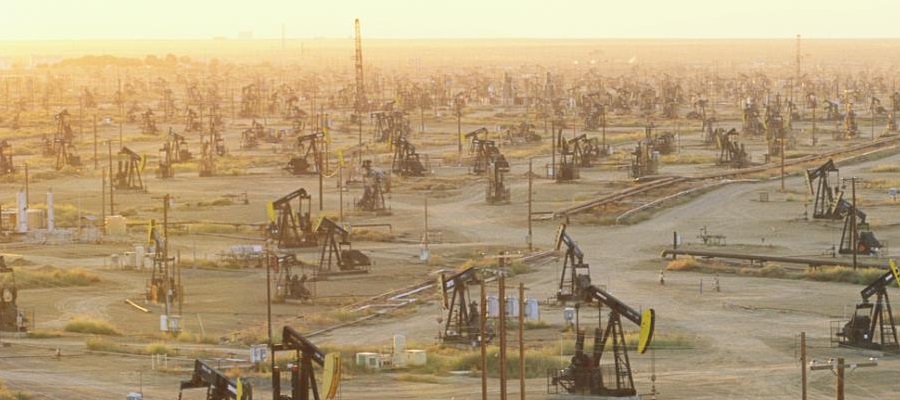
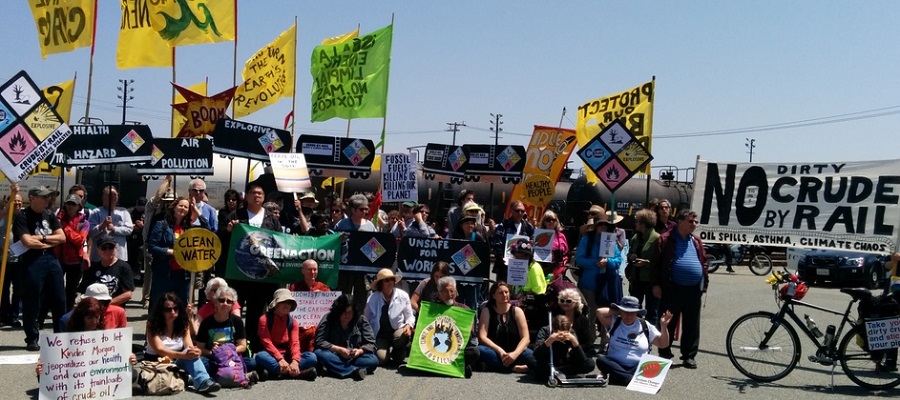
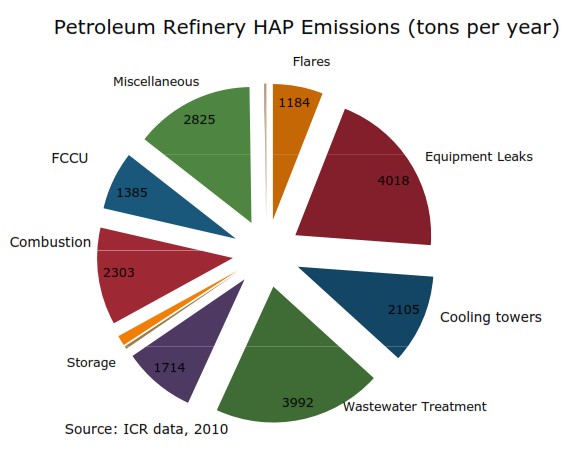
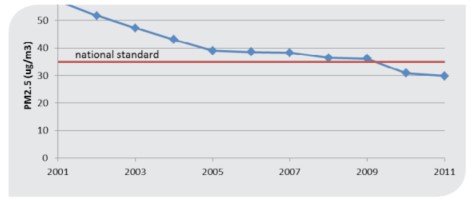
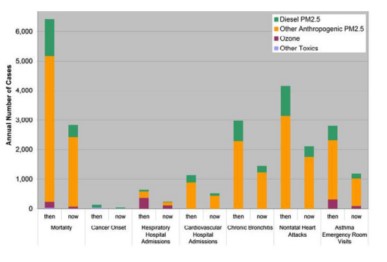
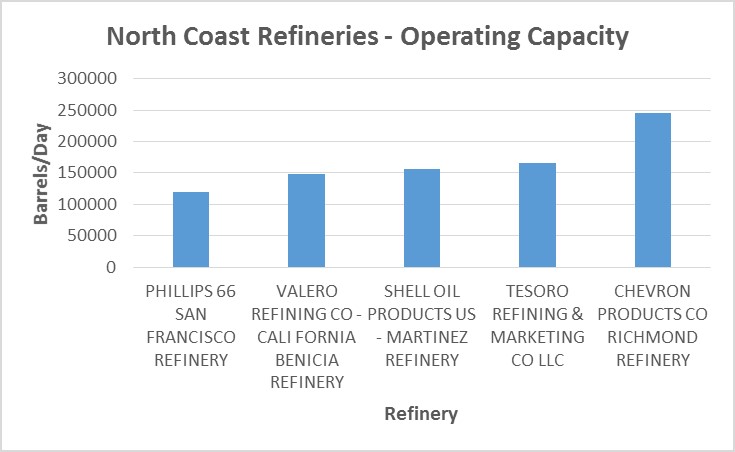
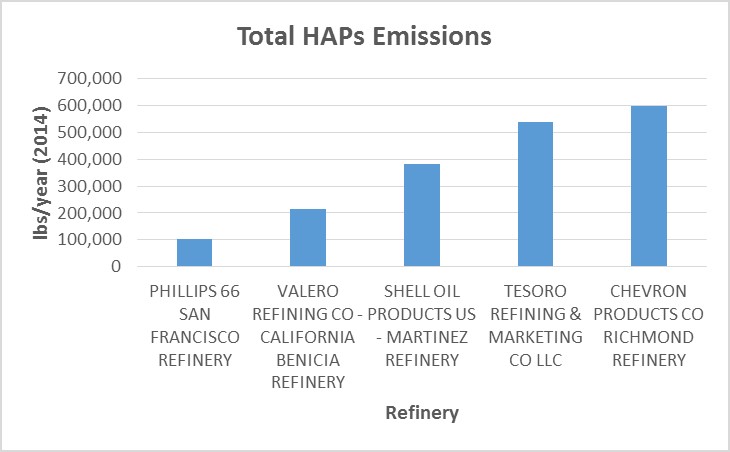
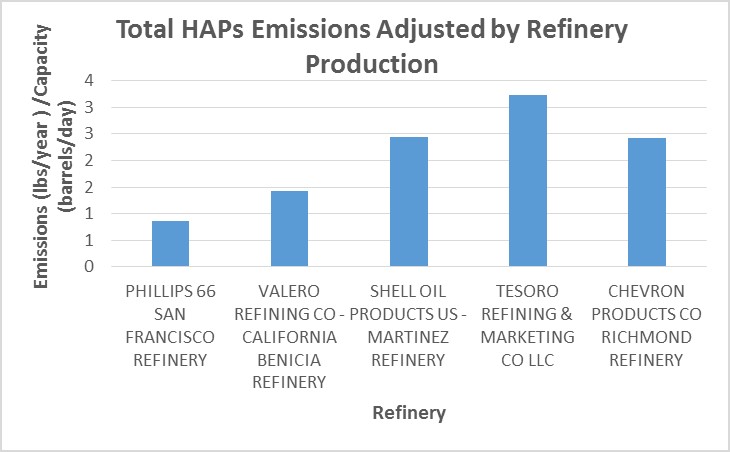
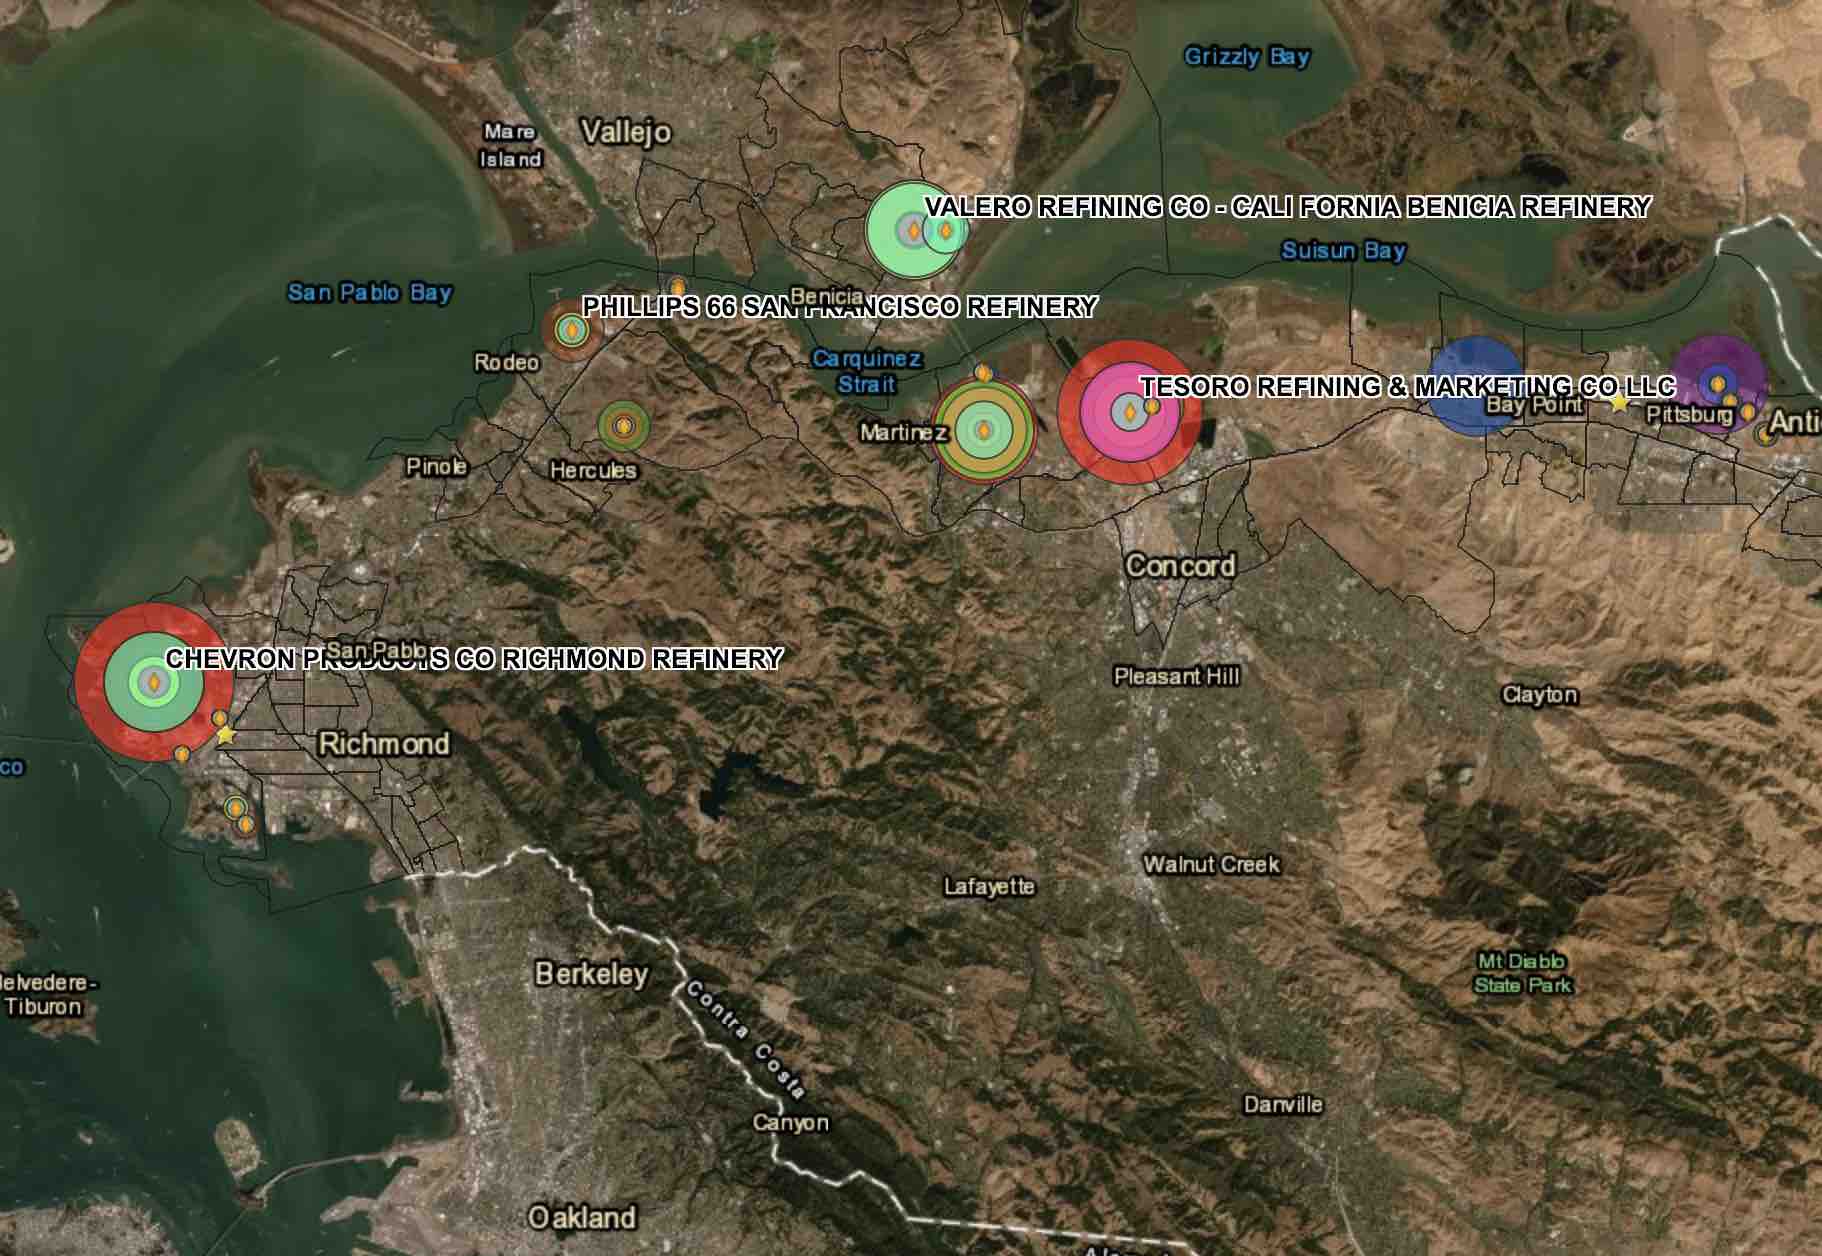


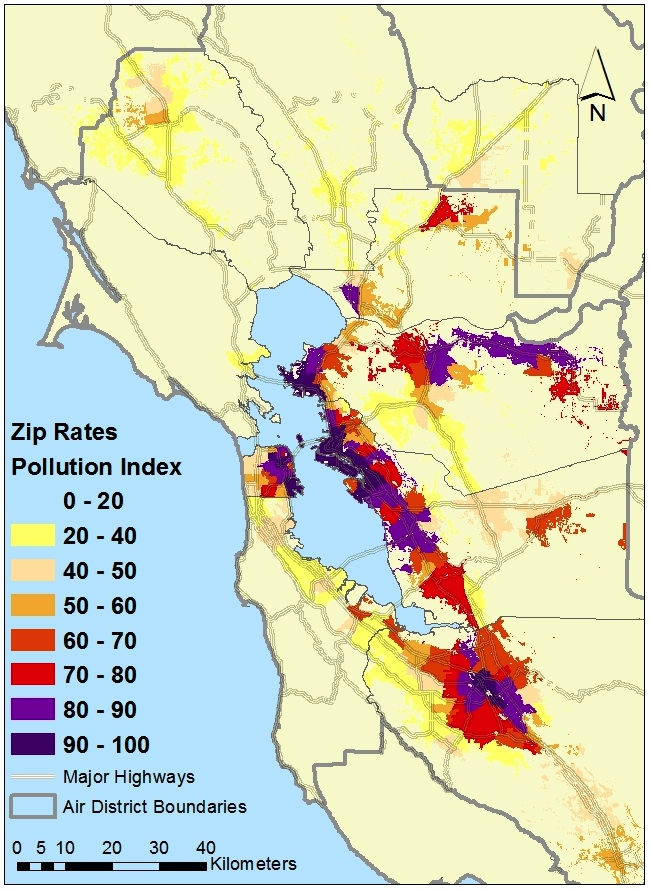
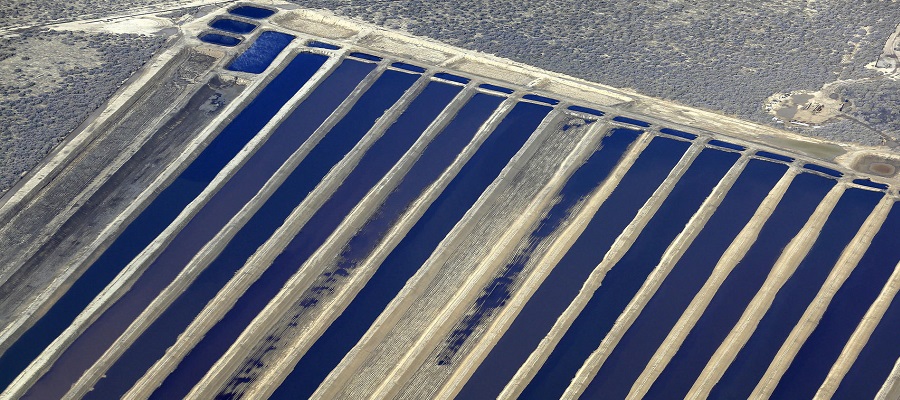
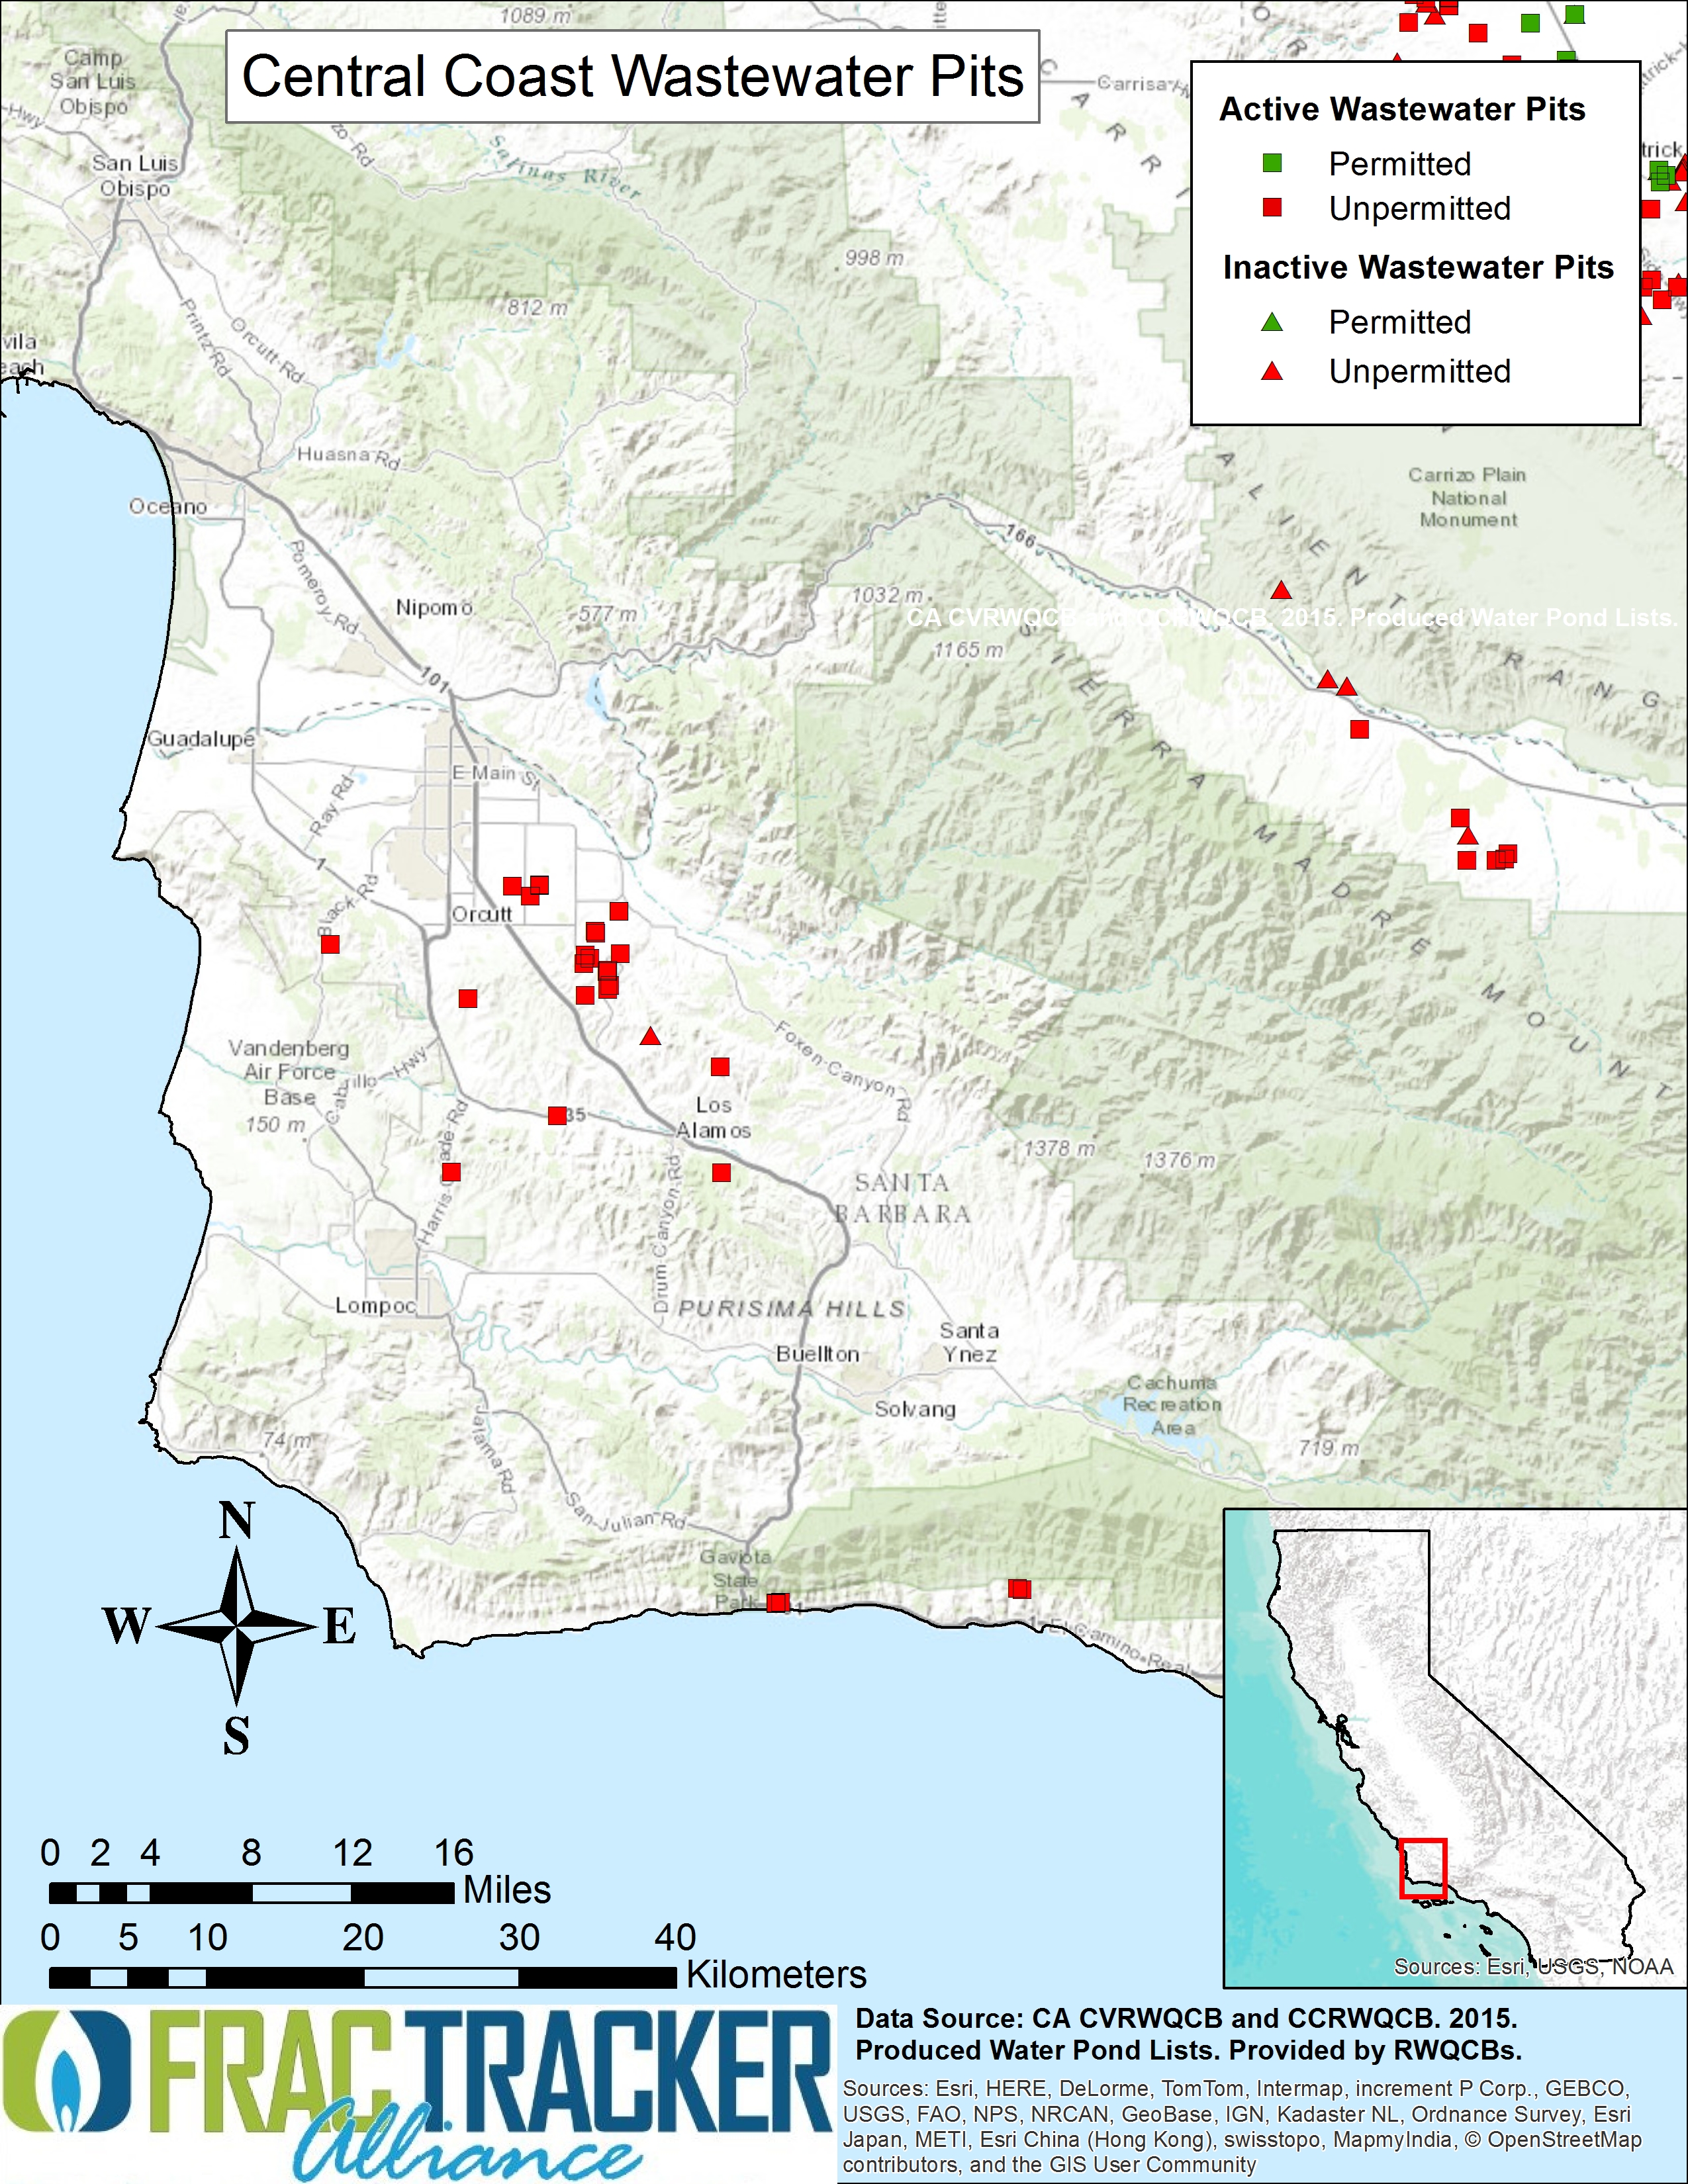
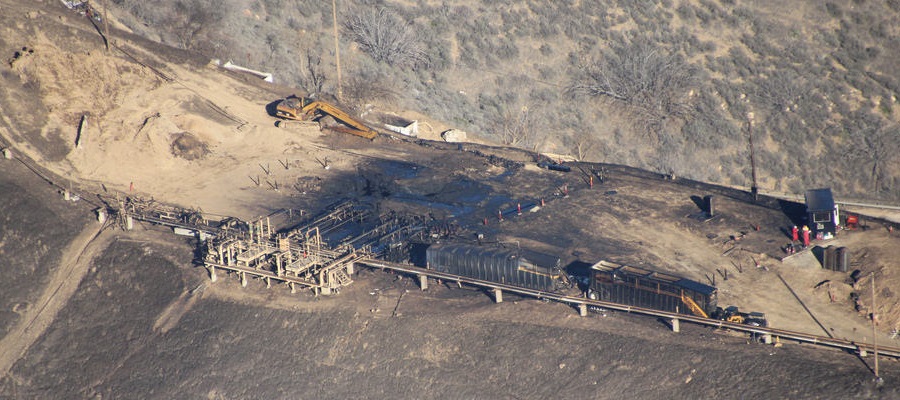
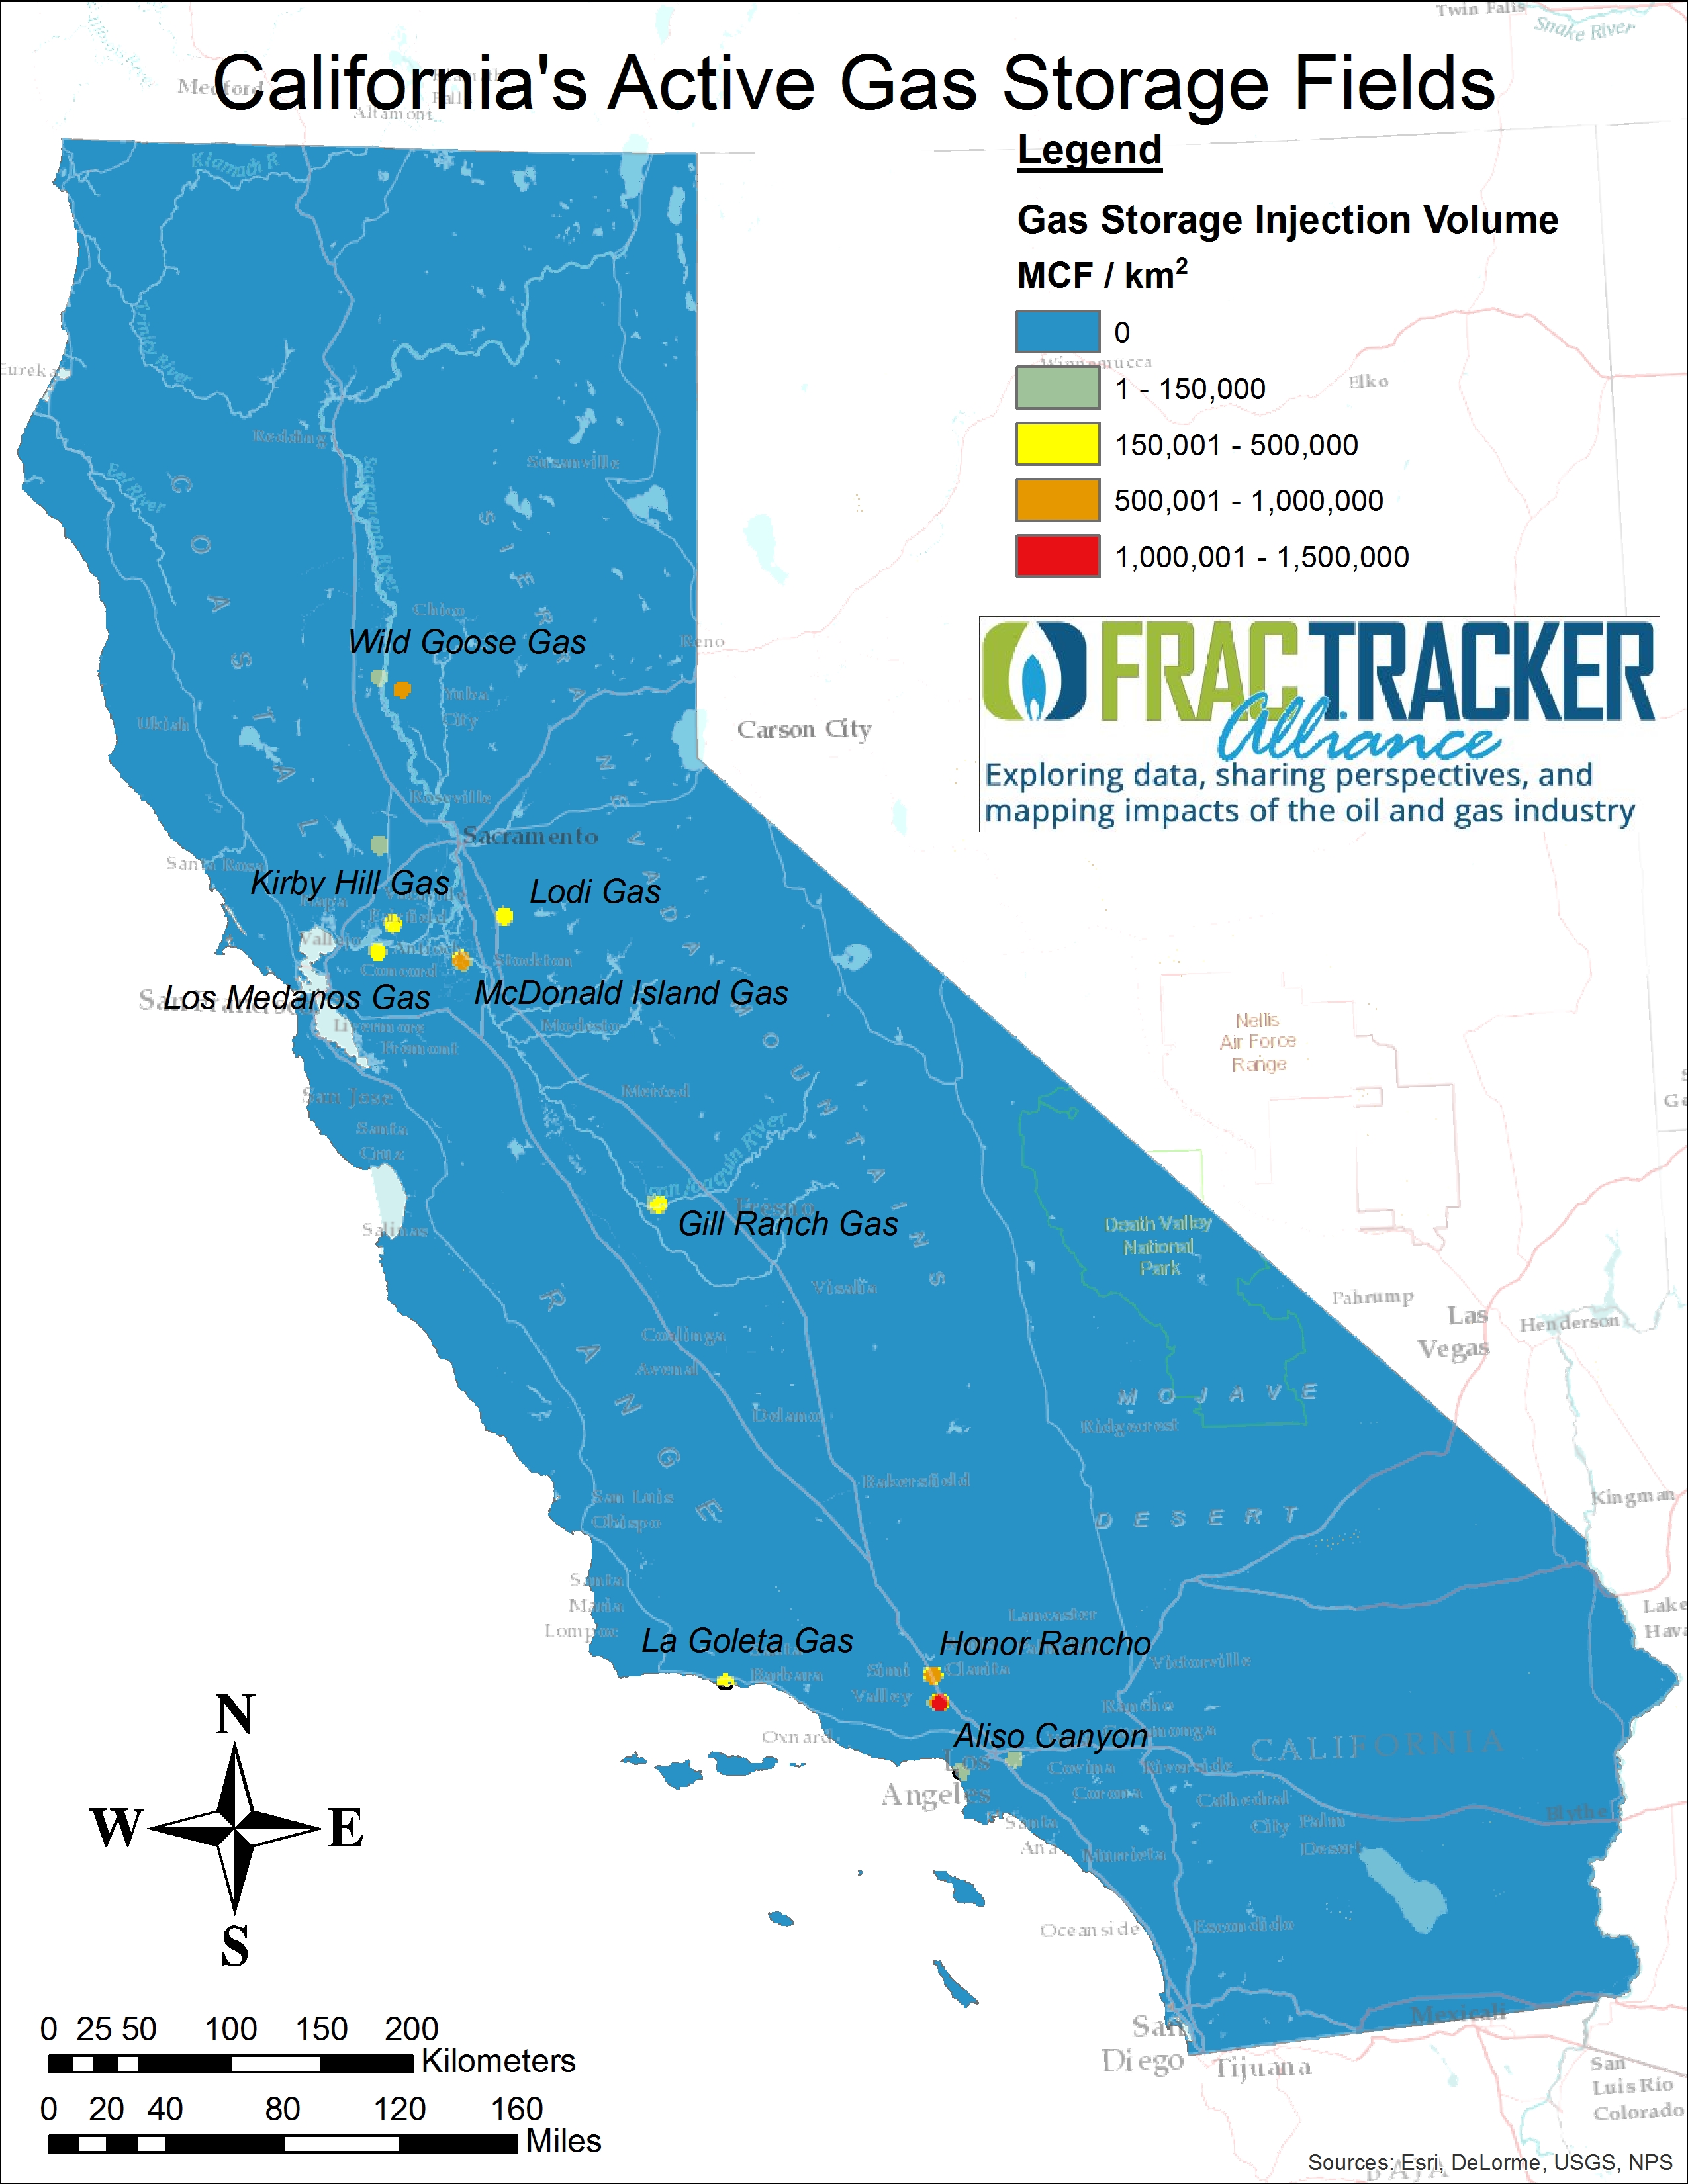
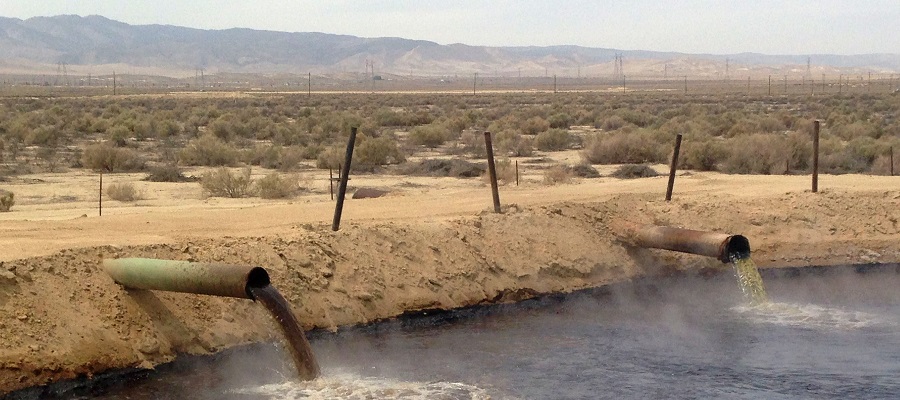
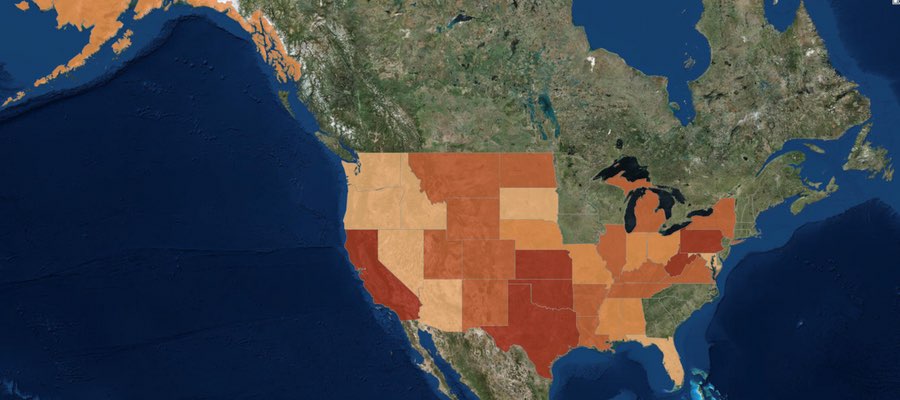
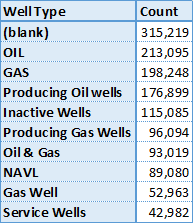
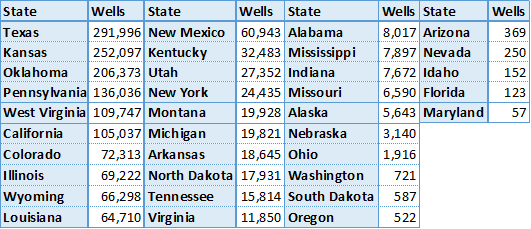
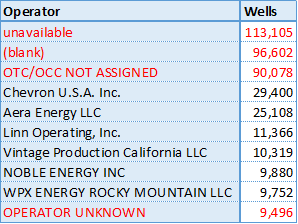
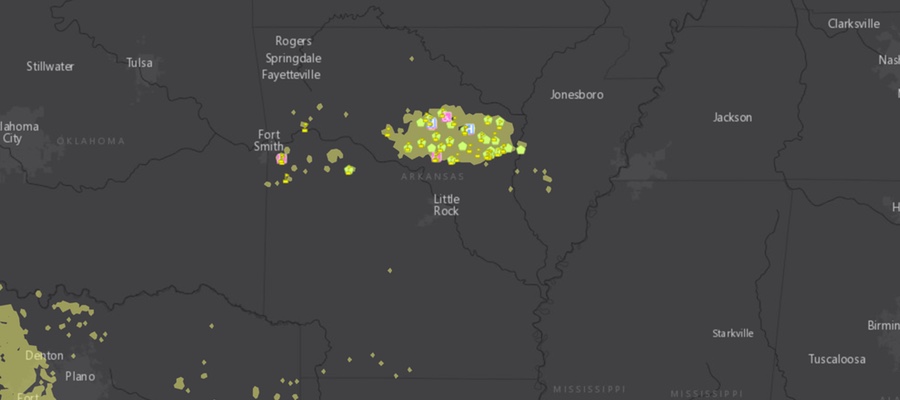
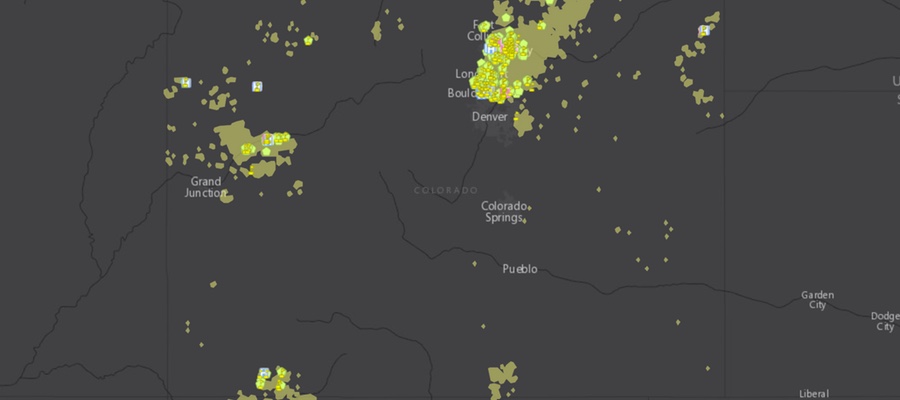
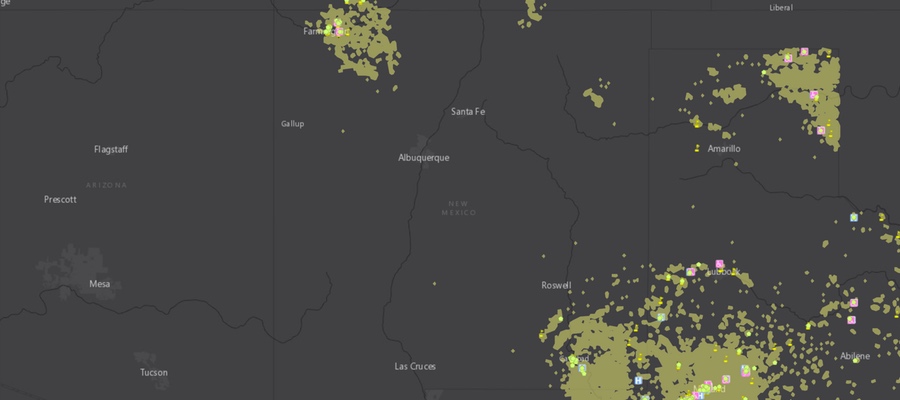
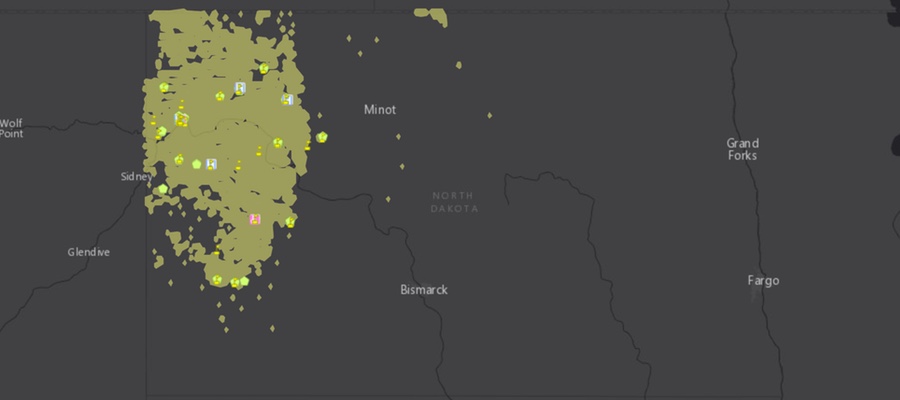