Oil and Gas Wastes are Radioactive – and Lack Regulatory Oversight
Highlighting the maps of radioactive oil and gas exploration and production wastes created in collaboration with the Western Organization of Research Councils
By Kyle Ferrar, Western Program Coordinator, FracTracker Alliance
Scott Skokos, Western Organization of Research Councils
Oil and gas waste can be radioactive, but it is not considered “hazardous,” at least according to the federal government. In this article, we summarize several of the hazardous risks resulting from the current federal policy that fails to regulate this massive waste stream, and the gaps left by states. Of the six states mapped in this assessment, only the state of Montana has initiated any type of rule-making process to manage the waste.
When it comes to unconventional oil and gas waste streams:
Nobody can say how much of any type of waste is being produced, what it is, and where it’s ending up. – Nadia Steinzor, Earthworks
To address some of these gaps, FracTracker Alliance has been working with the Western Organization of Resources Councils (WORC) to map out exactly where radioactive oil and wastes are being dumped, stored, and injected into the ground for disposal. The work is an extension to WORC’s comprehensive No Time to Waste report.
Why is accurate waste data so hard to come by? The Earthworks report, Wasting Away explains that the U.S. EPA intentionally exempted oil and gas exploration and production wastes from the federal regulations known as the Resource Conservation and Recovery Act (RCRA) despite concluding that such wastes “contain a wide variety of hazardous constituents.” As a result, there is very little waste tracking and reporting of oil and gas waste data nationally.
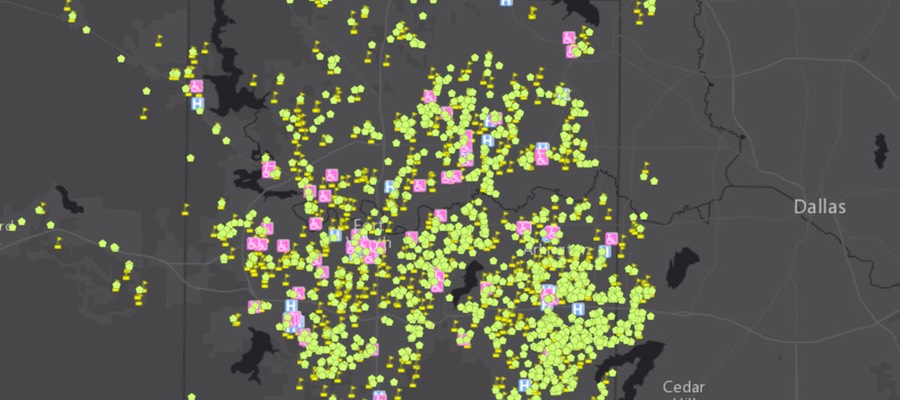
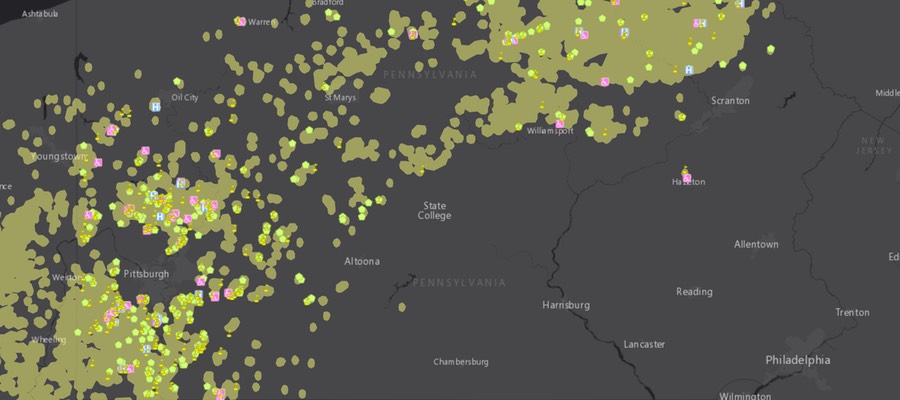
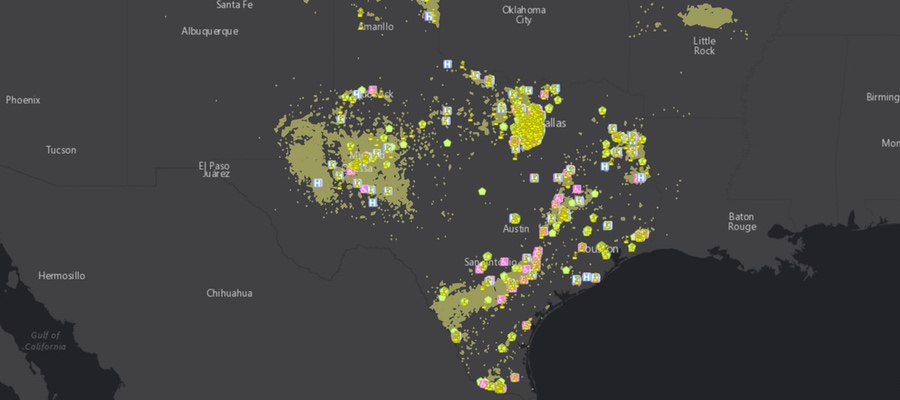
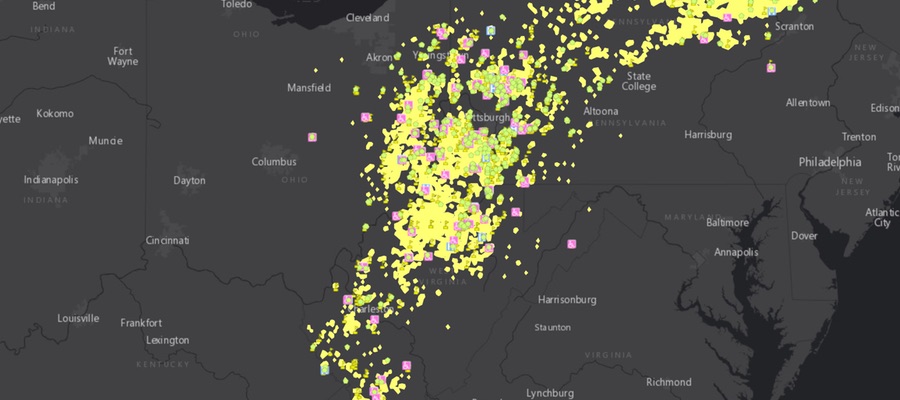
State Waste Management Maps
Some data is available at the state level, so we at FracTracker have compiled, cleaned, and mapped what little data we could find.
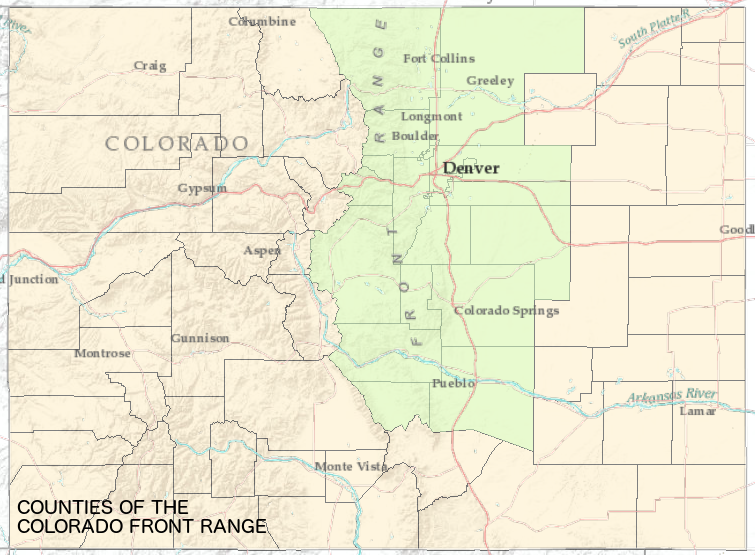
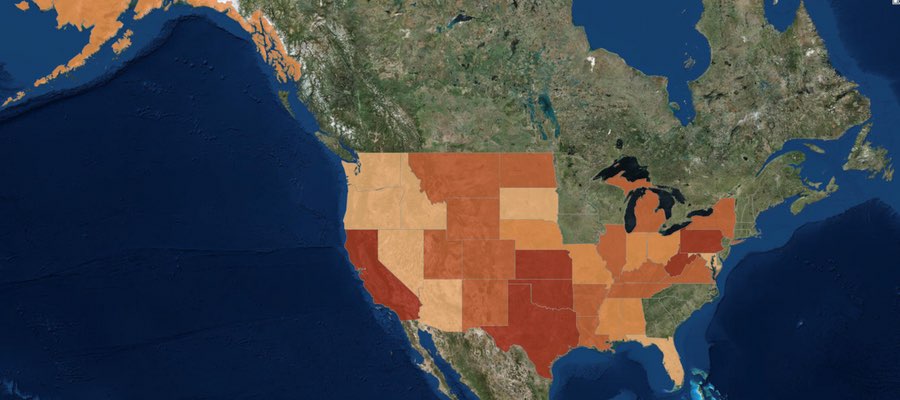
State-specific maps have been created for Montana, North Dakota, Colorado, and Wyoming – see below:
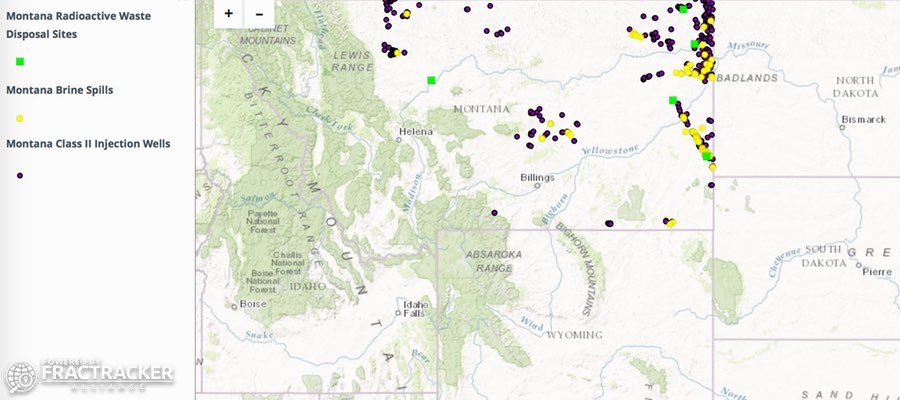 Montana – View map fullscreen
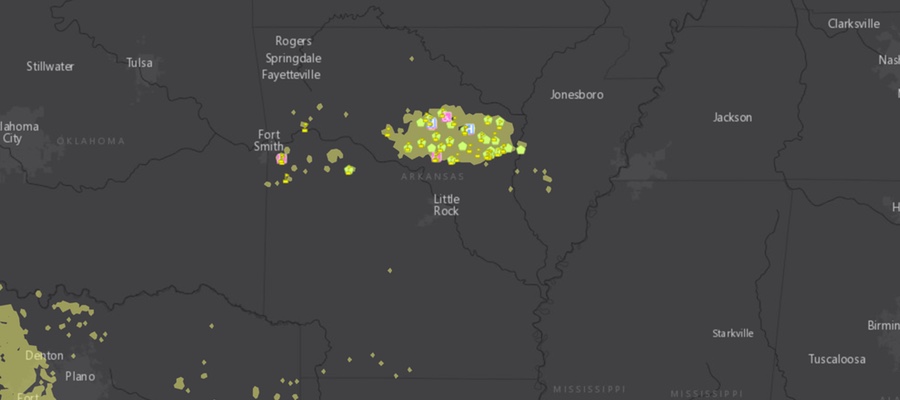
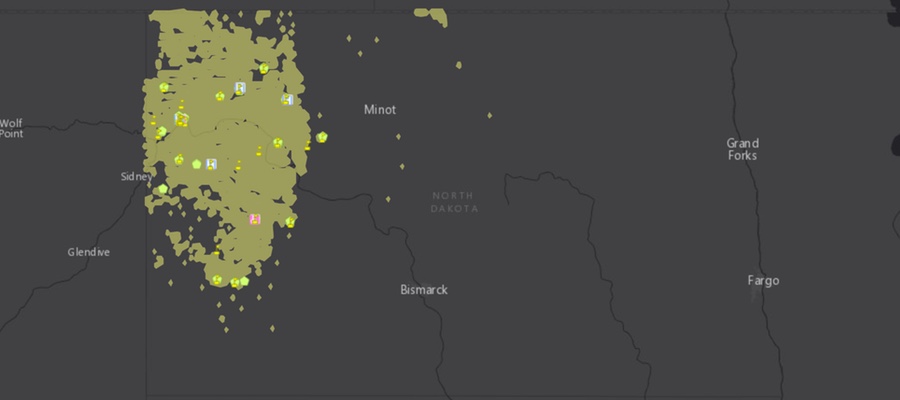
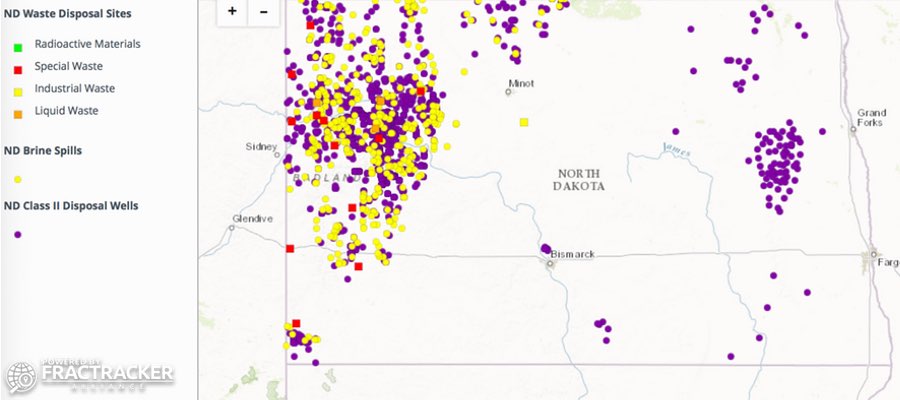 North Dakota – View map fullscreen
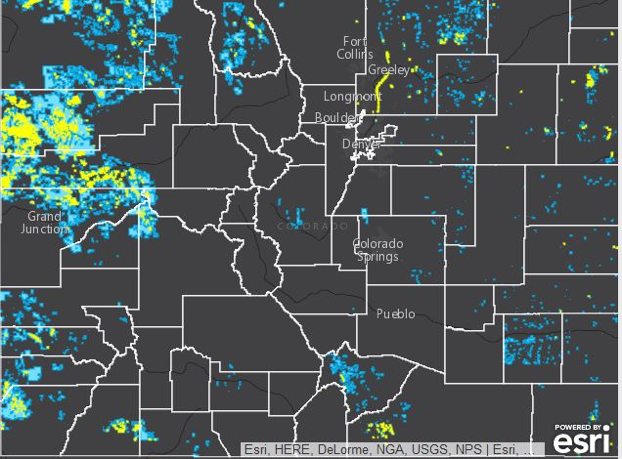
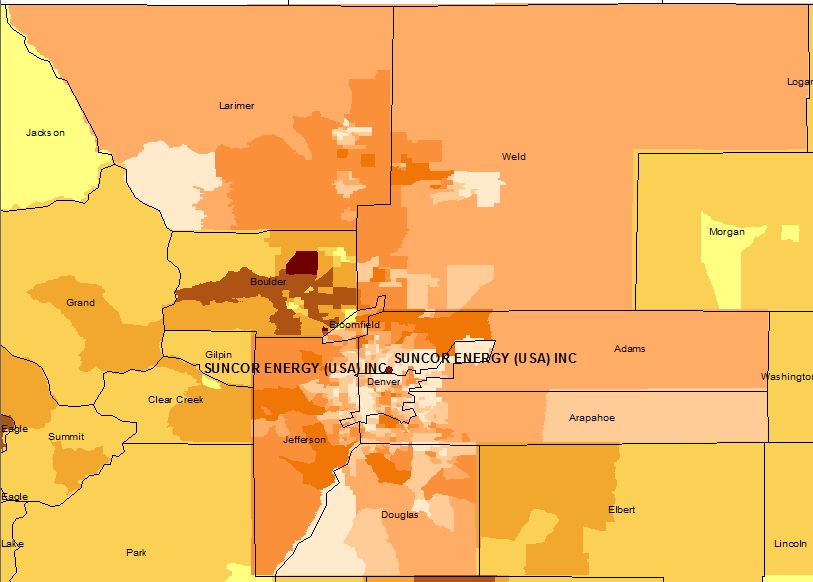
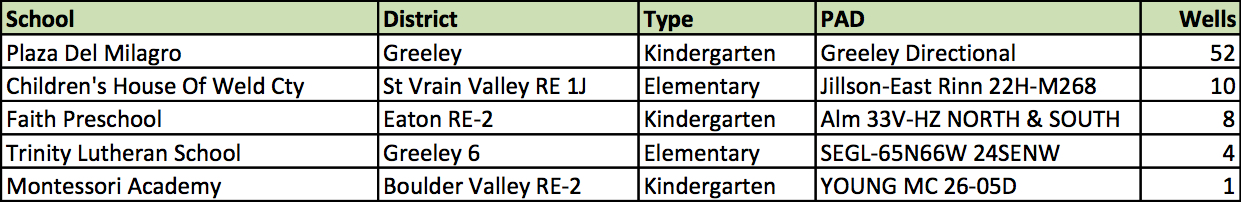
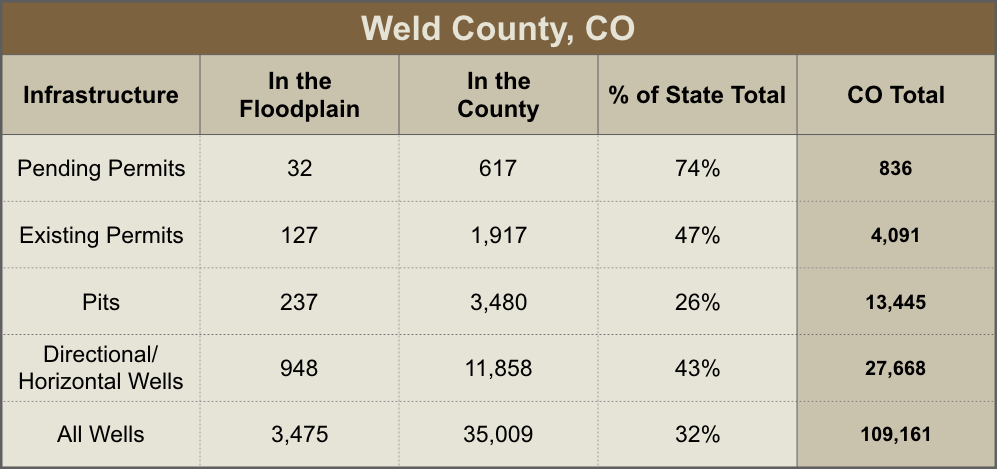
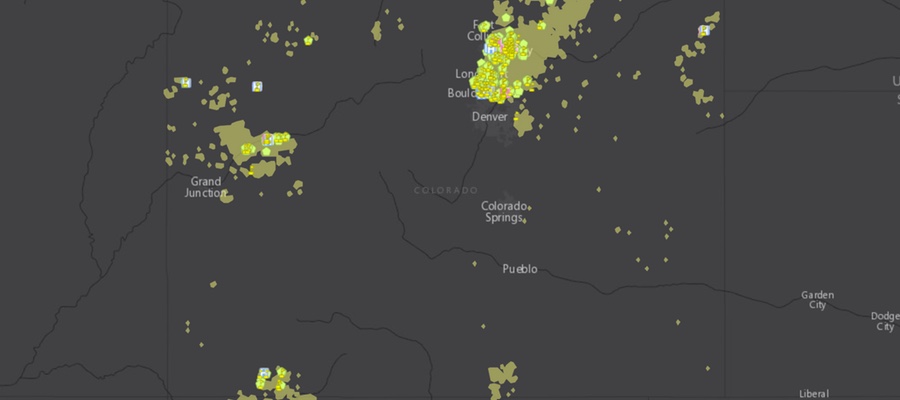
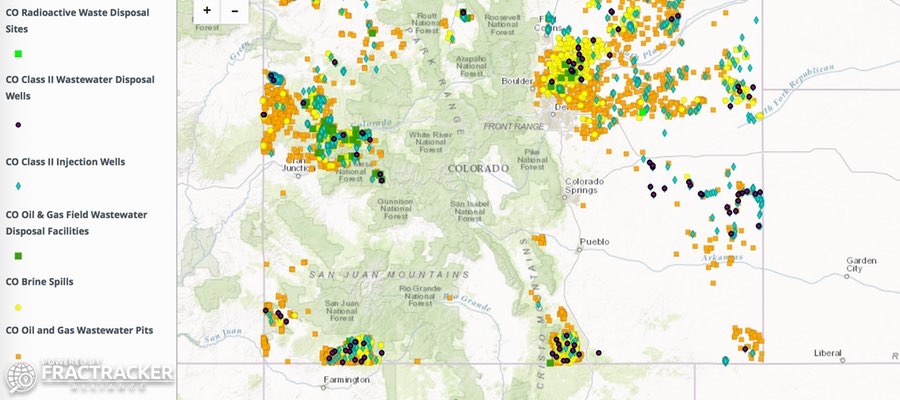 Colorado – View map fullscreen
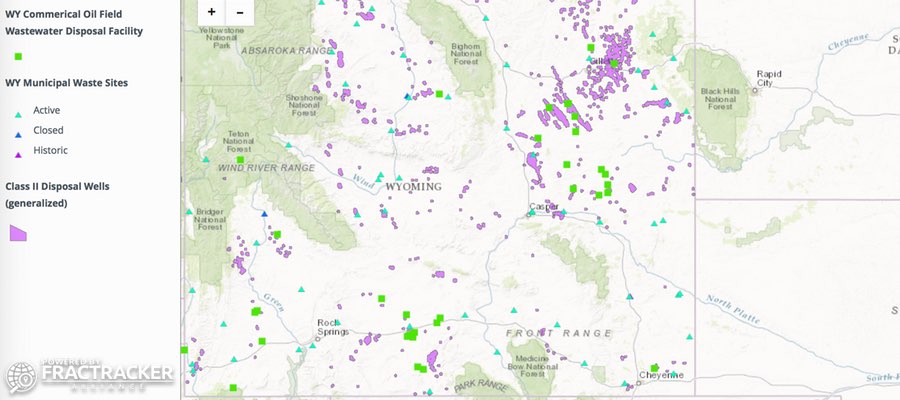 Wyoming – View map fullscreen
Sources of Radioactivity
When we hear about “radioactive waste” associated with the energy industry, nuclear power stations and fission reactors are usually what come to mind. But, as the EPA explains, fracking has transformed the nature of the oil and gas waste stream. Components of fracking waste differ from conventional oil and gas exploration and production wastes in a number of ways:
- In general, the waste stream has additional hazardous components, and that transformation includes increased radioactivity.
- Fracking has allowed for more intrusive drilling, penetrating deep sedimentary formations using millions of gallons of fluid.
- Drilling deeper produces more drill cuttings.
- The process of hydraulic fracking introduces millions more gallons of fluid into the ground that then return to the surface. These returns are ultimately contaminated and require disposal.
- The formations targeted for unconventional development are mostly ancient seabeds still filled with salty “brines” known as “formation waters.”
- In addition to the hazardous chemicals in the fracking fluid pumped into the wells for fracking, these unconventional formations contain larger amounts of heavy metals, carcinogens and other toxics. This also includes more radioisotopes such as Uranium, Thorium, Radium, Potassium-40, Lead-210, and Polonium-210 than the conventional formations that have supplied the majority of oil and gas prior to the shale boom.
A variety of waste products make up the waste stream of oil and gas development, and each is enhanced with naturally occurring radioactive materials (NORM). This waste stream must be treated and disposed of properly. All the oil and gas equipment – such as production equipment, processing equipment, produced water handing equipment, and waste management equipment – also need to be considered as sources of radioactive exposure.
Figure 1 below explains where the waste from fracking goes after it leaves the well pad.
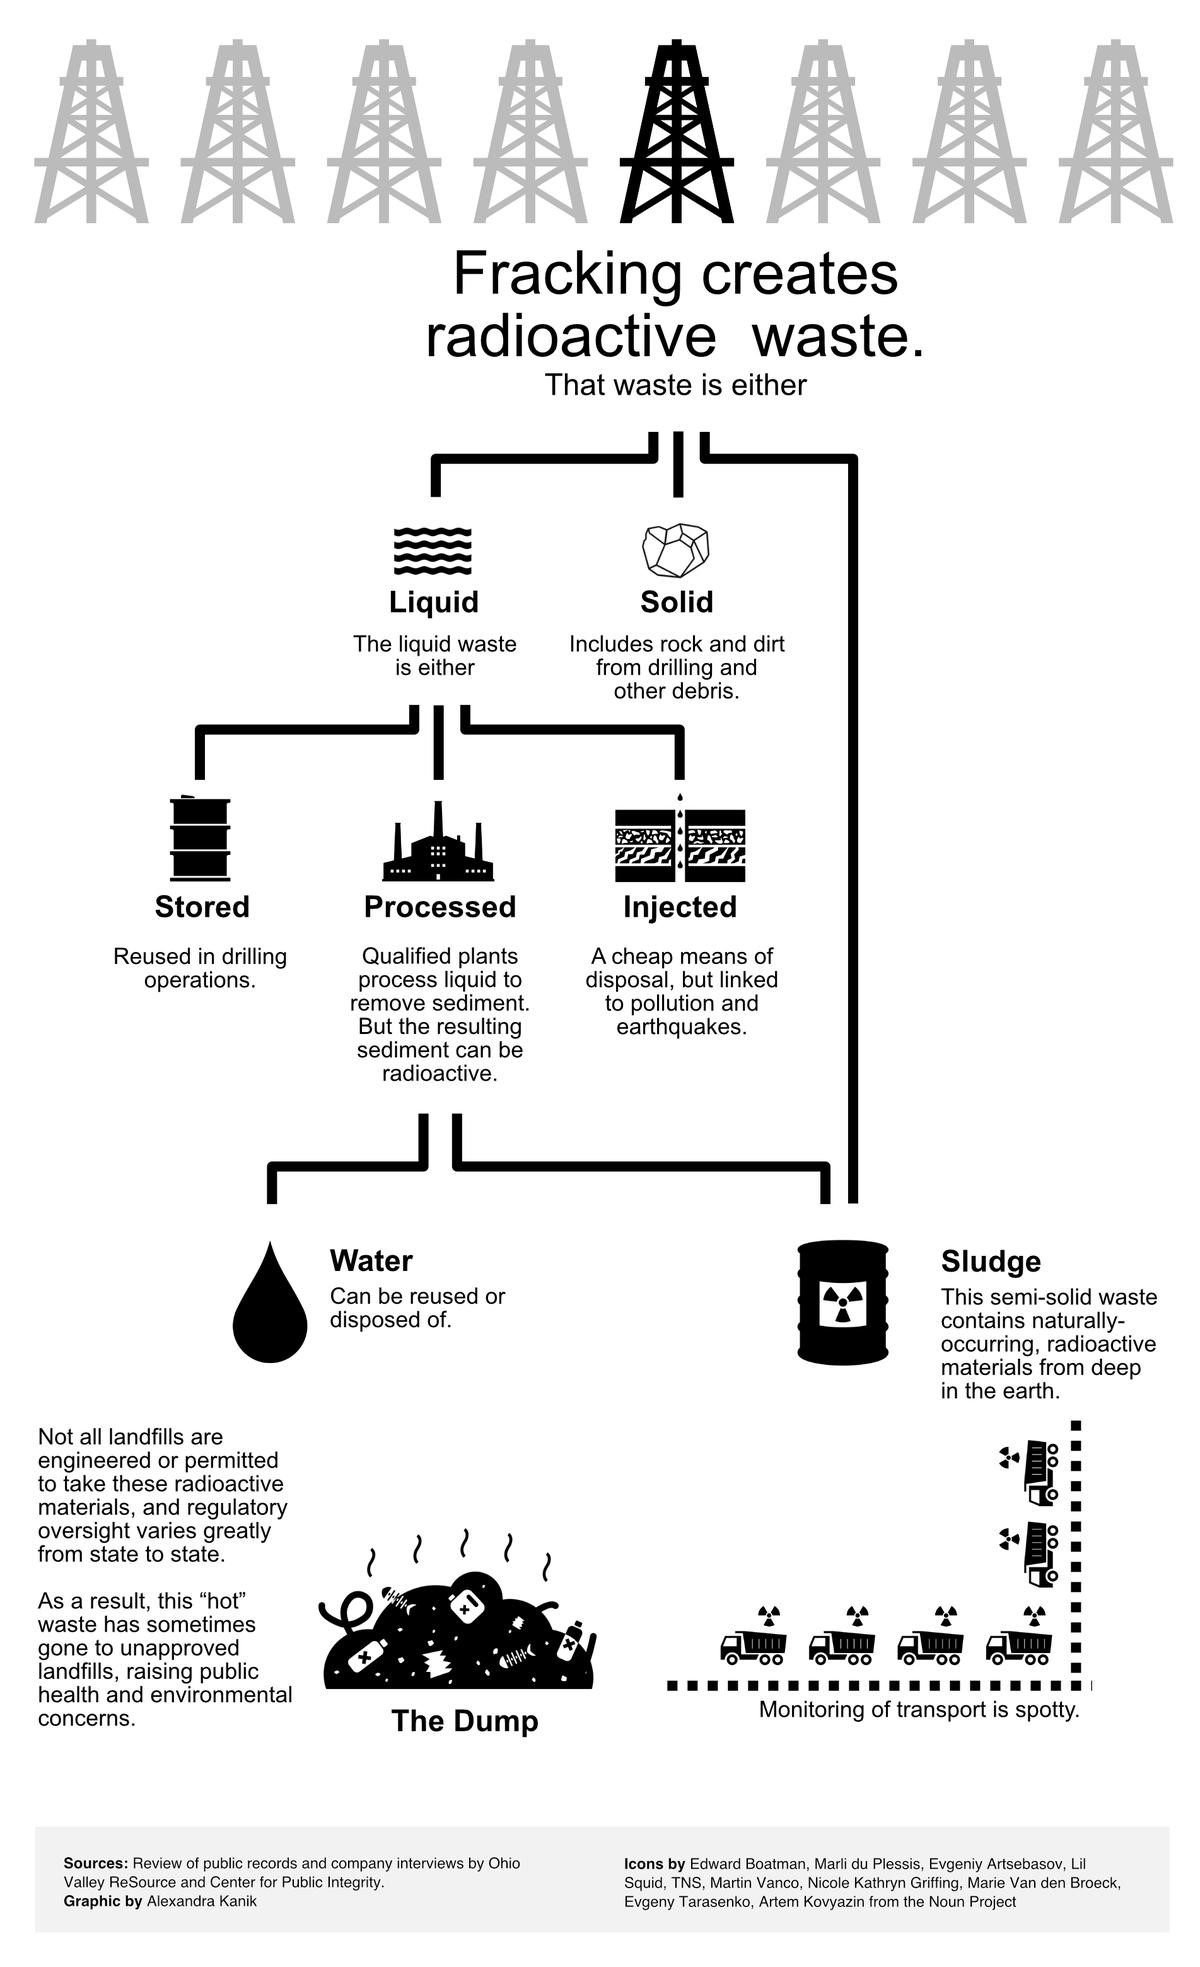
Figure 1. Breakdown of the radioactive oil and gas waste life-cycle
Three facets of the waste stream particularly enhanced with NORMs by fracking include scales, produced waters, and sludges.
A. Scales
When injected into the ground, fracking fluid mixes with formation waters, dissolving metals, radioisotopes and other inorganic compounds. Additionally the fracking liquids are often supplemented with strong acids to reduce “scaling” from precipitate build up (to prevent clogging up the well). Regardless, each oil well generates approximately 100 tons of radioactive scale annually. As each oil and gas reservoir is drained, the amount of scale increases. The EPA reports that lead-210 and polonium-210 are commonly found in scales along with their decay product radon at concentrations estimated to be anywhere from 480 picocuries per gram (pCi/g) to 400,000 pCi/g). Scale can be disposed of as a solid waste, or dissolved using “scale inhibitors.” These radioactive elements then end up in the liquid waste portion of the waste stream, known as produced waters.
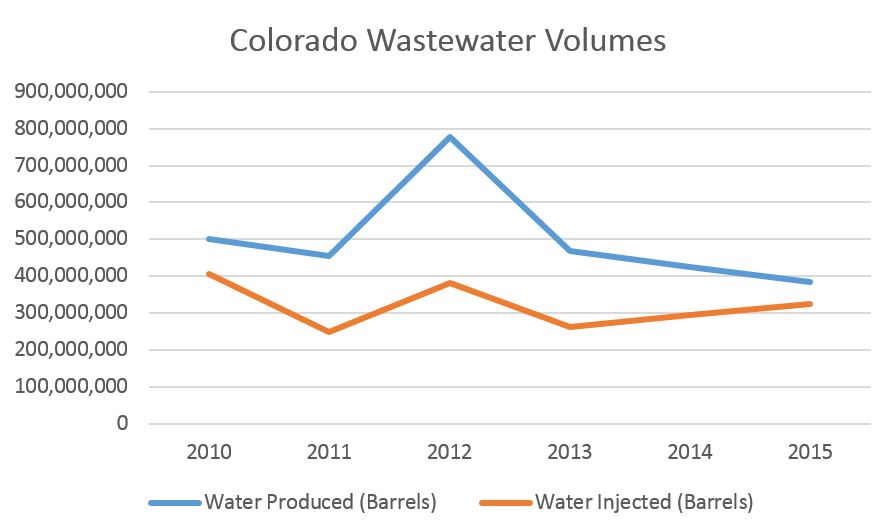
B. Produced Waters
In California, strong acids are used to further dissolve formations to stimulate additional oil production. Acidic liquids are able to dissolve more inorganic elements and compounds such as radioisotopes. While uranium and thorium are not soluble in water, their radioactive decay products such as radium dissolve in the brines. The brines return to the surface as “produced water.” As the oil and gas in the formation are removed, much of what is pumped to the surface is formation water.
Consequently, declining oil and gas fields generate more produced water. The ratio of produced water to oil in conventional well was approximately 10 barrels of produced water per barrel of oil. According to the American Petroleum Institute (API), more than 18 billion barrels of waste fluids from oil and gas production are generated annually in the United States. There are several options for managing the liquid waste stream. The waste could be treated using waste treatment facilities, reinjected into other wells to enhance production (a cheaper option), or injected for disposal. Before disposal of the liquid portion, all the solids in the solution must be removed, resulting in a “sludge.”
C. Sludges
The U.S. EPA reports that conventional oil production alone produces 230,000 million tons – or five million ft3 (141 cubic meters) – of TENORM sludge each year. Unconventional processes produce much more sludge waste than conventional processes. The average concentration of radium in sludges is estimated to be 75 pCi/g, while the concentration of lead-210 can be over 27,000 pCi/g. Sludges present a high risk to the environment and a higher risk of exposure for people and other receptors in those environments because sludges are typically very water soluble.
Federal Exemptions
According to the EPA, “because the extraction process concentrates the naturally occurring radionuclides and exposes them to the surface environment and human contact, these wastes are classified as Technologically Enhanced Naturally Occurring Radioactive Material (TENORM).” Despite the conclusions that oil and gas TENORM pose a risk to the environment and humans, the EPA exempts oil and gas exploration and production wastes from the definition of “hazardous” under Resource Conservation and Recovery Act (RCRA) law. In fact, most wastes from all of the U.S. fossil fuel energy industry, including coal-burning and natural gas, are exempt from the disposal standards that hazardous waste normally requires.
The Center for Public Integrity calls this radioactive waste stream “orphan waste,” because no single government agency is fully managing it.
Fortunately, the EPA has acknowledged that federal regulations are currently inadequate, though this is nothing new. A U.S. EPA report from the 1980’s reported as much, and gave explicit recommendations to address the issue. For 30 years nothing happened! Then in August, 2015, a coalition of environmental groups (including the Environmental Integrity Project, Natural Resources Defense Council, Earthworks, Responsible Drilling Alliance, West Virginia Surface Owners’ Rights Organization, and the Center for Health, Environment and Justice) filed a lawsuit against the EPA, and has since reached a settlement.
Just last month (January 10, 2017) the U.S. EPA agreed to review federal regulations of oil and gas waste – a process they were meant to do every 3 years for the last 30 years. The EPA has until March 15, 2019, to determine whether or not regulatory changes are warranted for “wastes associated with the exploration, development, or production of crude oil, natural gas, or geothermal energy.” With the recent freeze on all U.S. EPA grants, however, it is not clear whether these regulations will receive the review they need.
State Regulations
Regulation of this waste stream is left up to the states, but most states do not require operators to manage the radioactivity in oil and gas wastes, either. Because of the federal RCRA exemptions most state policies ignore the radioactive issue altogether. Operators are free to dispose of the waste at any landfill facility, unless the landfill tells them otherwise. For detailed analyses of state policies, see pages 10-45 of the No Time to Waste report. FracTracker has also covered these issues in Pennsylvania and Ohio.
Another issue that screams for federal consideration of this waste stream is that states do not have the authority to determine whether or not the wastes can cross their borders. States also do not have the jurisdiction to decide whether or not facilities in their state can accept waste from across state lines. That determination is reserved for federal jurisdiction, and there are not any federal laws regulating such wastes. In fact, these wastes are strategically exempt from federal regulation for just these reasons.
Why can’t the waste be treated?
This type of industrial waste actually cannot be treated, at least not entirely. Unlike organic pollutants that can be broken down, inorganic constituents of the waste cannot be simply disintegrated out of existence. Inorganic components include heavy metals like arsenic and bromides, as well as radioactive isotopes of radium, lead, and uranium. Such elements will continue to emit radiation for hundreds-to-thousands of years. The best option available is to find a location to “isolate” and dispose of these wastes – a sacrifice zone.
Current management practices do their best to separate the liquid portions from the solid portions, but that’s about it. Each portion can then be disposed independently of each other. Liquids are injected into the ground, which is the cheapest option where it is available. If enough of the dissolved components (heavy metals, salts, and radioisotopes) can be removed, wastewaters are discharged into surface waters. The compounds and elements that are removed from the liquid waste stream are hyper-concentrated in the solid portion of the waste, described as “sludge” in the graphic above. This hazardous material can be disposed of in municipal or solid waste landfills if the state regulators do not require the radioactivity or toxicity of this material to be a consideration for disposal. There are not federal requirements, so unless there is a specific state policy regarding the disposal, it can end up almost anywhere with little oversight. These chemicals do not magically disappear. They never disappear.
Risks
There are multiple pathways for contamination from facilities that are not qualified to manage radioactive and hazardous wastes. At least seven different environmental pathways provide potential risks for human exposure. They include:
- Radon inhalation,
- External gamma exposure,
- Groundwater ingestion,
- Surface water ingestion,
- Dust inhalation,
- Food ingestion, and
- Skin beta exposure from particles containing the radioisotopes.
According to the EPA, the low-level radioactive materials in drilling waste present a definitive risk to those exposed. High risk examples include dust suppression and leaching. If dust is not continuously suppressed, radioactive materials in dust pose a risk to people at these facilities or those receptors or secondary pathways located downwind of the facilities. Radioactive leachate entering surface waters and groundwaters is also a significant threat. A major consideration is that radioactive waste can last in these landfills far longer than the engineered lifespans of landfills, particularly those that are not designed to retain hazardous wastes.
Cases of Contamination
North Dakota
In North Dakota, the epicenter of the Bakken Oil Fields, regulators were not ready for the massive waste streams that came from the fast growing oil fields. This allowed thousands of wastewater disposal wells be drilled to dispose of salty wastewater without much oversight, and no places in state for companies to dispose of radioactive solid waste. Many of the wastewater disposal wells were drilled haphazardly, and as a result many contaminated surrounding farmland with wastewater. With regard to radioactive solid waste, the state until recently had a de facto ban on solid radioactive waste disposal due to their radioactivity limit being 5 picocuries per gram. The result of this de facto ban made it so companies either had to make one of two decisions: 1. Haul their radioactive solid waste above the limit out of state to facilities in Idaho or Colorado; or 2. Risk getting caught illegally dumping waste in municipal landfills or just plain illegal dumping in roadsides, buildings, or farmland.
In 2014, a massive illegal dumping site was discovered in Noonan, ND when North Dakota regulators found a gas station full of radioactive waste and filter socks (the socks used to filter out solid waste from wastewater, which contain high levels of radioactivity). Following the Noonan, ND incident North Dakota regulators and politicians began discussions regarding the need for new regulations to address radioactive solid waste.
In 2015, North Dakota moved to create rules for the disposal of solid radioactive waste. Its new regulations increase the radioactivity limit from 5 picocuries per gram to 50 picocuries per gram, and sets up new requirements for the permitting of waste facilities accepting radioactive waste and the disposal of radioactive waste in the waste facilities. Dakota Resource Council, a member group of WORC, challenged the rules in the courts, arguing the rules are not protective enough and that the agency responsible for the rules pushed through the rules without following the proper procedures. Currently the rules are not in effect until the litigation is settled.
Pennsylvania
In Pennsylvania, the hotbed of activity for Marcellus Shale gas extraction, the regulatory body was ill equipped and uninformed for dealing with the new massive waste stream when it first arrived on scene. Through 2013, the majority of wastewater was disposed of in commercial and municipal wastewater treatment facilities that discharge to surface waters. Numerous facilities engaged in this practice without amending their federal discharge permits to include this new waste stream.
Waste treatment facilities in Pennsylvania tried to make the waste streams less innocuous by diluting the concentrations of these hazardous pollutants. They did this by mixing the fracking wastes with other waste streams, including industrial discharges and municipal waste. Other specialized facilities also tried to remove these dissolved inorganic elements and filter them from the discharge stream.
As a result of site assessments by yours-truly and additional academic research, these facilities realized that such hazardous compounds do not simply dilute into receiving waters such as the Allegheny, Monongahela, and Ohio rivers. Instead, they partition (settle) into sediments where they are hyper-concentrated. As a result of the lawsuits that followed the research, entire river bottoms in Pennsylvania had to be entirely dug up, removed, and disposed of in hazardous waste landfills.
Action Plans Needed
Massive amounts of solid and liquid wastes are still generated during drilling exploration and production from the Marcellus Shale. There is so much waste, operators don’t know what to do with it. In Pennsylvania, there is not much they can do with it, but it is not just Pennsylvania. Throughout the Ohio River Valley, operators struggle to dispose of this incredibly large waste stream.
Ohio, West Virginia, and Pennsylvania have all learned that this waste should not be allowed to be discharged to surface waters even after treatment. So it goes to other states – those without production or the regulatory framework to manage the wastes. Like every phase of production in the oil and gas industry, operators (drillers) shop around for the lowest disposal costs. In Estill County, Kentucky, the State Energy and Environment Department just recently cited the disposal company Advance Disposal Services Blue Ridge Landfill for illegally dumping hydraulic fracturing waste. The waste had traveled from West Virginia Marcellus wells, and ended up at an ignorant or willfully negligent waste facility.
In summary, there is inadequate federal oversight of potentially hazardous waste coming from the oil and gas industry, and there are serious regulatory gaps within and between states. Data management practices, too, are lacking. How then, is the public health community supposed to assess the risk that the waste stream poses to people? Obviously, a more thorough action plan is needed to address this issue.
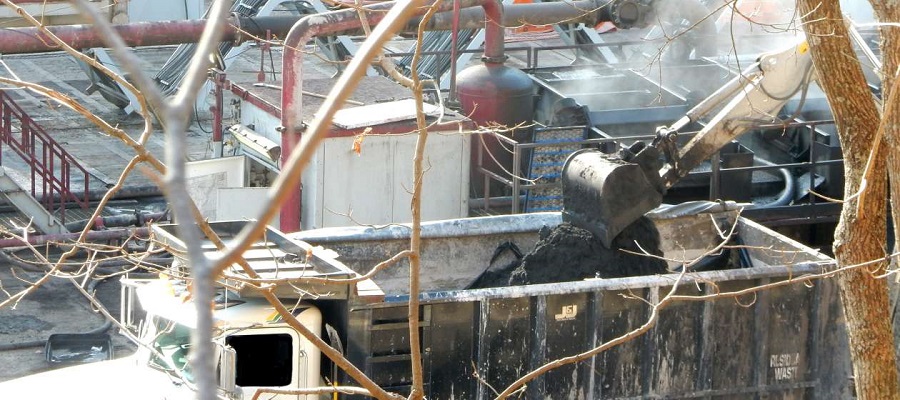
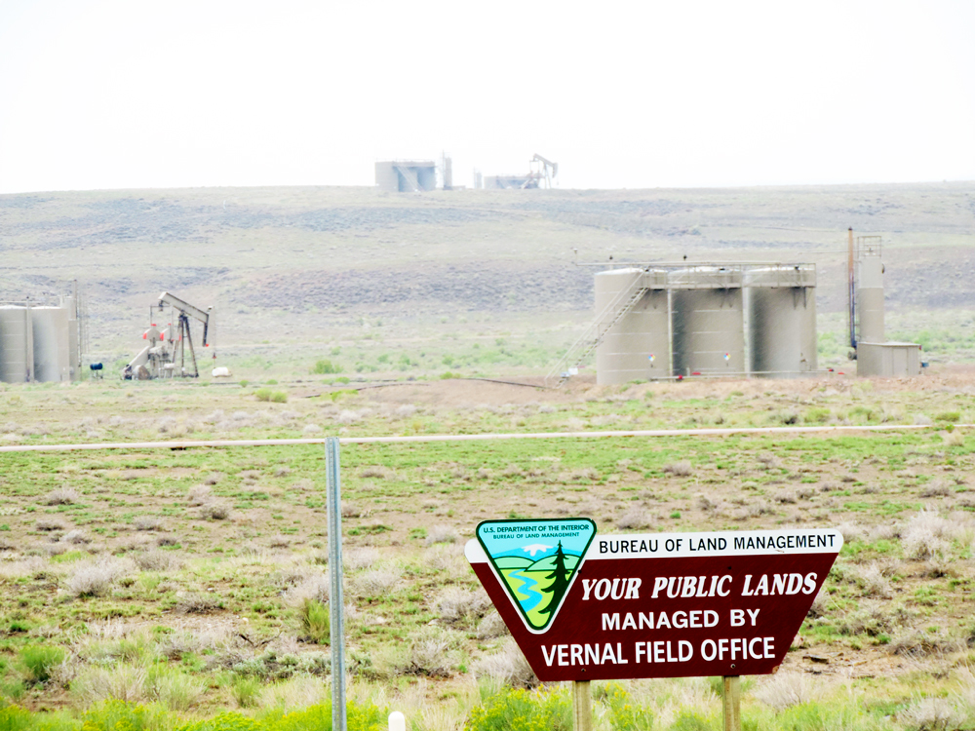
Feature image: Drill cuttings being prepared to be hauled away from the well pad. Photo by Bill Hughes, OVEC


