This article explores Cancer Alley, an 85-mile stretch in Louisiana that epitomizes the intersection of environmental justice and industrial development, where predominantly Black communities face disproportionate health risks from a high concentration of petrochemical plants and refineries.
FracTracker Alliance released a new map identifying the locations of over 1,200 oil and gas wells using toxic “forever chemicals” in Arkansas, Louisiana, Oklahoma, New Mexico, Texas, and Wyoming.
A new collaboration between FracTracker Alliance and Algalita is aiming to help middle school and high school students understand the connection between plastics and fracking — and the wide ranging implications for climate change, environmental injustice, and human health.
Most young people today understand that plastics are problematic. But, there is still often a disconnect between the symptom of plastics in our oceans, and the root causes of the problem. Algalita’s mission is to empower a new generation of critical thinkers to shift the broken and unjust systems that are causing the plastic pollution crisis. Algalita’s strategy is creating educational experiences directly with the movement’s diverse leaders, and this new project with FracTracker is a perfect example.
Specifically, Algalita and FracTracker have been working together to add new lessons to Algalita’s brand-new online, gamified, action platform: Wayfinder Society. Through this program, students can guide their own exploration of the complexities of the plastics issue, and can take action at their own pace and scale, by completing lessons and action-items (called Waymarks) based on difficulty, topic, and type of impact.
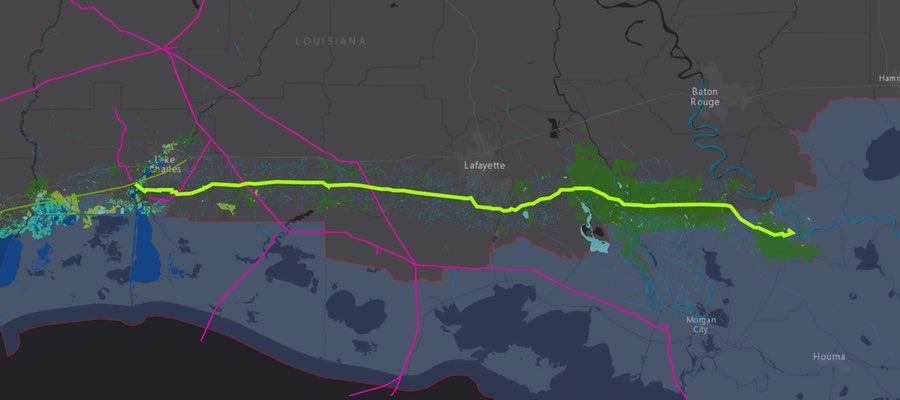
The first of two FracTracker Waymarks outlines the connection between fracking and plastic production. Students explore a map showing the full plastics production process from fracking pads, to pipelines, to ethane crackers, and packaging factories.
In a second Waymark that builds off of the first, students explore the massive petrochemical buildout on the Gulf Coast and in the Ohio River Valley. The map allows students to analyze the greenhouse gas emissions predicted for this buildout using the data point pop-up boxes. They can also examine the effects of climate change on communities amongst the buildout by viewing the coastal flood zone areas in Texas and Louisiana. Beyond that, students can investigate how facilities are impacting their peers in schools close to massive ethane cracker facilities. Finally, students are introduced to the movement’s #PlasticFreePresident Campaign, giving them a direct action to apply their new knowledge.
Mapping Fracking’s Link to Plastic Production
This StoryMap was created by FracTracker for Wayfinder Society, a program by Algalita. Learn more at Algalita.org. Place your cursor over the image and scroll down to advance the StoryMap and explore a series of maps charting the fracking-for-plastic system. Click on the icon in the bottom left to view the legend. Scroll to the end of the StoryMap to learn more and access the data sources.
Algalita is excited about this partnership for so many reasons. For one, GIS is a critical skill for young people to learn. These two Waymarks pose an accessible and non-intimidating introduction to ArcGIS by using simple maps and StoryMaps like the one above. The maps let students get comfortable with GIS concepts and capabilities like layers, data attribute tables, measuring tools, and filters. Allowing students to explore how plastics are produced through a geographical lens provides a unique visual and interactive experience for them. The goal is for students to be able to connect petrochem buildout, with the plastics, climate and justice issues that they are focusing on — often separately. Our aim is that by putting this part of the story in context of real physical space they will more easily make those connections. We hope these lessons spark some students’ interest in mapping, geography, and GIS, providing a new generation of changemakers with GIS in their toolbox.
On top of that, we are stoked to be building this partnership with FracTracker because the success of our collective movement depends on strong, clear communication and synergies between the nodes of the movement’s network. The FracTracker Waymarks give our Wayfinders direct access to real-time data, visualizations, and expert insights that they can then use to level-up their actions and stories around their activism. And, they connect the dots not just for students, but also for educators and movement partners like us at Algalita — we are all for this powerful lever for change!
Check out Wayfinder Society here. Access the FracTracker Waymarks here and here— but you’ll need to be logged in. If you’re a student, get started by creating a profile, and then start earning Cairns (points)! If you’re an educator, parent or mentor, and interested in exploring the site, email us here for the guest login.
By Anika Ballent, Education Director, Algalita
Algalita empowers a new generation of critical thinkers who will shift the broken and unjust systems that are causing the plastic pollution crisis. We do this by offering educational experiences created directly with the movement’s diverse leaders.
Anika has been working in the movement against plastic pollution for ten years, studying microplastics in benthic and freshwater environments. She brings together her science background and creativity to educate young changemakers through hands-on experiences in schools, Algalita’s International Youth Summit, and online programs.
All other data points were mapped by FracTracker Alliance referencing various online sources. While this map is based on actual infrastructure, it is intended as a model of the fracking-for-plastic lifecycle and certain steps may vary in real life.
It’s been a little over a year since I visited the Texas Gulf Coast to document the oil, gas, and petrochemical landscape with our partners at LightHawk and Scott Humphries, an amazing pilot and Houston native.
Much has happened since then – in regard to and because of – the Gulf Coast’s petrochemical industry.
The fossil fuel landscape along the Gulf Coast is broad, and its impact is heavy.
The area has seen a massive build out over the last five years. New plastics and steel manufacturing facilities and pipelines from the Permian Basin that transport crude to ever-expanding tank farms and marine terminals – all with the blessings of local economic development groups and local government, despite known present and potential hazards.
As these developments continue, communities and workers pay the price. An incident in early December, 2020 left workers injured after a condensate fire at a Citgo tank farm in Corpus Christi. Before that, a pipeline explosion on August 20th in the Corpus Christi Ship Channel resulted in four deaths, with only two of those bodies recovered.
Channels of Life, below, is a short video looking at what is already on the ground, and what is on the horizon. Whether you are pleasure-boating in the channels or driving down the highway, you only see the edge of industrial sprawl that already exists. The depth of the incursion is not visible from the ground. Further down in an interactive Story Map, we give you a rare look from above, while pinpointing various incidents and facilities of concern. Partnering with LightHawk, we flew from Port Aransas, up the La Quinta Channel to the Nueces Delta, and ending at Refinery Row, giving you a bird’s-eye view of the sprawling fossil fuel landscape.
How much more industrial saturation can the Coastal Bend’s public health and ecosystem withstand before it is all sacrificed?
Is it destined to become a sacrifice zone for increasing corporate wealth and prestige?
In many parts of Texas – as well as in Louisiana and New Mexico – oil, gas, and petrochemical facilities abut schools, backyards, and playgrounds. The Gulf Coast contains 95% of the country’s ethylene capacity and roughly half of the country’s petroleum refining and natural gas processing capacity. This development has propelled a new wave of petroleum and petrochemical infrastructure in recent years. There are 129 planned or recently completed petrochemical facilities in TX and LA alone.
This buildout has enormous consequences for the country’s greenhouse gas emissions, including intensifying climate change; increasing production of (often radioactive) waste and the need for its disposal; and discharging dangerous pollution into frontline communities where health has already been compromised by industry activities.
As the sacrifice builds and the losses mount, economic development corporations advertise the area as prime real estate for more facilities and infrastructure – even as markets steadily move away from fossil fuels. Exports are a tenuous lifeline for an industry drowning in an oversupply of oil and gas, but advocates like the Port of Corpus Christi Authority insist on proposing, financing, and constructing new crude oil and liquefied natural gas (LNG) export terminals along the Gulf Coast, including the BlueWater and GulfLink terminals.
Even with access to global markets, the outlook for this Gulf Coast petrochemical expansion doesn’t look great. Countries that planned to import the US’ fossil fuels are withdrawing interest, citing climate concerns. Major projects are being abandoned, like the petrochemical facility Project Falcon that SABIC had planned to build near Aransas Pass. Frontline communities that have suffered devastating health impacts from the industry for too long are calling out environmental racism and causing major delays for new facilities.
These Texan sites are further captured in the Story Map below, as are the footprints of countless other existing and proposed petrochemical infrastructure sites, from the frac sand mines south of San Antonio down into Corpus Christi Bay, the mushrooming industry along the La Quinta Channel, up the Gulf Coast to Freeport, and finally along the always hectic Houston Ship Channel that empties out into Galveston Bay.
Left to Right: Corpus Christi native and Coastal Alliance to Protect Our Environment (CAPE) member Dewey Magee, FracTracker Alliance’s Ted Auch, and LightHawk pilot Scott Humphries stand outside Scott’s Beechcraft Bonanza A-36 at McCampbell-Porter Airport in Aransas Pass, TX, November 11th, 2019. Photo by Errol Summerlin
The View of Corpus Christi’s Petrochemical Corridor along La Quinta Channel and Tule Lake Shipping Channel from 200’ above McCampbell-Porter Airport in Aransas Pass, TX, November 11th, 2019. Photo by Ted Auch, FracTracker Alliance
I reached out to pilot and native Houstonian Scott Humphries for his thoughts on what he expected and what he gleaned from our flight. He wrote the following:
Question #1: What about our proposed flight interested you as a Texan and/or Houstonian – or just more generally – what interested you about this mission?
I’ve always tried to be environmentally conscious, and always try to have, “think globally, act locally” rummaging around in my head, but this mission (and affiliating with LightHawk generally) presented an opportunity for me to try to (hopefully) have a little more impact than just personally recycling, outlawing Styrofoam cups at our office, etc. Separately, as a longtime Houstonian, I’ve always been proud to live and work in what many refer to as the “Energy Capital of the World.” This mission seemed a useful way to do some small part to help make sure that title continues to be held responsibly.
Question #2: After conducting the flights, or as they were happening, did you learn anything, or have any thoughts that surprised you or realizations about anything particular?
I have flown along the Gulf Coast (including to/from Houston/Corpus Christi) many, many times, and if you’d asked me before this mission, I would have said, ‘Sure, there’s a decent amount of industry along that part of the coast.’ What surprised me while we were flying was two things: (1) there’s not just a decent amount of industry along that part of the coast; rather, along that route, even flying low, you’re rarely – if ever – out of sight of a significant facility of some kind, and (2) the size of the facilities – in other circumstances I’d have been flying much higher and wouldn’t get a good sense of the size of the pads. Flying as we were at just over 1000′, it was striking how massive the various plants were, both in Corpus Christi Bay and along the coast.
Another perspective on this flight and the area we flew over comes from Kevin Sims, Aransas Bay Birding Charters Operator whose Whooping Crane and Pink Spoonbill photos we feature in the story map below. Kevin has been plying the waters in and around Aransas Wildlife Refuge since 1972, and when I contacted him about using some of his photos, he told me the following:
“We need the desalination plants, but the planned discharge points are going to cripple our ecology and the business that rely on it for tourism. They could’ve discharged offshore, but instead they are discharging into the bay, and if it gets too salty the crab populations will plummet, and everything around here depends on crabs and shrimp. If we have a constant influx of brine it could really cripple us. I went to a fantastic meeting from Texas A&M, and their science told them that if red fish larvae migrated into the [Aransas Pass] shipping channel and hit a wall of salty water, they wouldn’t go further, and their population would crash. But despite these facts, they’ve chosen to discharge into the La Quinta Channel, and that is bad news! They were having fairly regular meetings on all of these proposals prior to COVID, but once COVID hit, they went all remote, and less people knew when the meetings were, and the meeting details weren’t widely disseminated … So, the next thing we knew, everything was passed, and they’re gonna [sic] go ahead and do [all of] it.
My perspective comes from a lifetime of fishing and observing the Whooping Crane, and watching them progress from 157 eighteen years ago, to 507 at the present time. Well, I feel this will threaten an endangered species that they’ve been trying to bring back from the brink of extinction since the 1940s. I can remember my dad showing me the cranes in the mid-70s, and there were only 52-55. All of the projects you are mapping have the potential to decimate all the progress made, not to mention money spent on Whooping Crane recovery. From my perspective, it’s a catch-22, ‘cause [sic] the big cities take the water out of the river, and they don’t have the inflows into the bays that they did in the past. We also don’t have the rains that we used to have. The desalination plants would relieve some of that pressure if they would just put that brine offshore. The other species of concern to my industry is the Pink Spoonbills, but the Whooping Crane is the main draw.”
Channels of Life: The Gulf Coast Buildout in TX
A Story Map
This Story Map illustrates the impacts of oil and gas infrastructure from San Antonio down to Corpus Christi, and then up the Gulf Coast to Houston.
The map displays aerial photographs of infrastructure, from frac sand mines and refineries, to chemical plants and offshore drill rig construction sites. This map includes CO2 emissions from oil and gas infrastructure from 2010 – 2018 (weighted by total CO2 during this period in orange), and/or oil refineries and their myriad products (weighted by capacity in black [barrels/day oil equivalents]).
The Story Map also presents detailed information and locations for proposed petrochemical infrastructure in the Corpus Christi Bay region, courtesy of Errol Summerlin and our partners at Coastal Alliance to Protect Our Environment (CAPE). These proposals include dredging projects needed to accommodate more traffic from larger tanker ships, as well as desalination facilities that would collectively intake 758 million gallons of Corpus Christi Bay water each day, and discharge 507 million gallons of brine per day, with an average of 95 and 64 million gallons of desalinated water produced daily, respectively.
The perforated yellow line is the flight path we took with our LightHawk partners. When the viewer scrolls into any given region, they will see SkyTruth incident alerts within five miles of our flight path. The two examples cited at the beginning of this article are just a couple of the nearly 760 such incidents in just the Corpus Christi Shipping Channel since 2011, according to data provided by SkyTruth.
The most recent data in this map is Whooping Crane locations and number counts in TX as of November 2020, courtesy of The Cornell Lab of Ornithology’s eBird data portal. This data speaks to the concerns of Mr. Sims and many of his colleagues who rely on the Whooping Crane’s attraction to birders internationally, and it also highlights that the projects photographed and in the works across Corpus Christi Bay will not just negatively affect the human communities, but will have far reaching impacts on the ecosystems of the western Gulf, and the industries that have relied on these ecosystems for all manner of ecosystems services.
Decades of oil and gas development have created a dependency on extractive industries, which has in turn hindered community health and stability.
The Port of Corpus Christi’s controversial dock expansion and Harbor Bridge replacement project at the southern end of Refinery Row has taken over community land and eclipsed their fight to protect their neighborhoods and their public health. Even after an environmental review, the preferred route cuts through these neighborhoods that are surrounded by industry, interstates, and waste treatment facilities – isolated from other residences, and subjected to heavy pollution, noise, and constant hazard.
But with interest and investments declining in the fossil fuel industry and overproduction keeping prices low, the future of the Gulf Coast, its people, environment, and industrial landscape is uncertain – but resistance to extractive industry is strong.
Several activists and environmental coalitions are fighting this project and the industrial onslaught for the health of their communities. For more information on how to support their vision, visit our friends at Coastal Alliance to Protect our Environment (CAPE) and Texas Environmental Justice Advocacy Services (TEJAS).
Thank You
This video, Story Map and article were produced with much gratitude and appreciation for our partners at LightHawk, as well as the support and resources of Scott Humphries, Kevin Sims, and Errol Summerlin.
https://www.fractracker.org/a5ej20sjfwe/wp-content/uploads/2020/12/TAuch_Infrastructure-Refinery-BritishPetroleum-TexasCity_TX_LightHawk_Nov2019-Feature-scaled.jpg6671500Ted Auch, PhDhttps://www.fractracker.org/a5ej20sjfwe/wp-content/uploads/2025/09/2025-Wordmark-Logo.pngTed Auch, PhD2020-12-23 16:23:392021-04-15 14:16:01Channels of Life: The Gulf Coast Buildout in Texas
By Ted Auch, PhD, Great Lakes Program Coordinator and Shannon Smith, Manager of Communications & Development
The oil and gas industry continues to use rhetoric focusing on national security and energy independence in order to advocate for legislation to criminalize climate activists. Backlash against protestors and environmental stewards has only increased since the onset of COVID-19, suggesting that industry proponents are exploiting this public health crisis to further their own dangerous and controversial policies.[1]
Industry actors contributing to the wave of anti-protest bills include American Petroleum Institute (API), IHS Markit, The American Fuel & Petrochemical Manufacturers (AFPM), and most effectively, the American Legislative Exchange Council (ALEC), by way of its primary financial backer, Koch Industries (Fang, 2014, Shelor, 2017).
ALEC is the source of the model legislation “Critical Infrastructure Protection Act” of 2017, intended to make it a felony to “impede,” “inhibit,” “impair,” or “interrupt” critical infrastructure operation and/or construction. Close approximations – if not exact replicas – of this legislative template have been passed in 11 hydrocarbon rich and/or pathway states, and 8 more are being debated in 4 additional states.
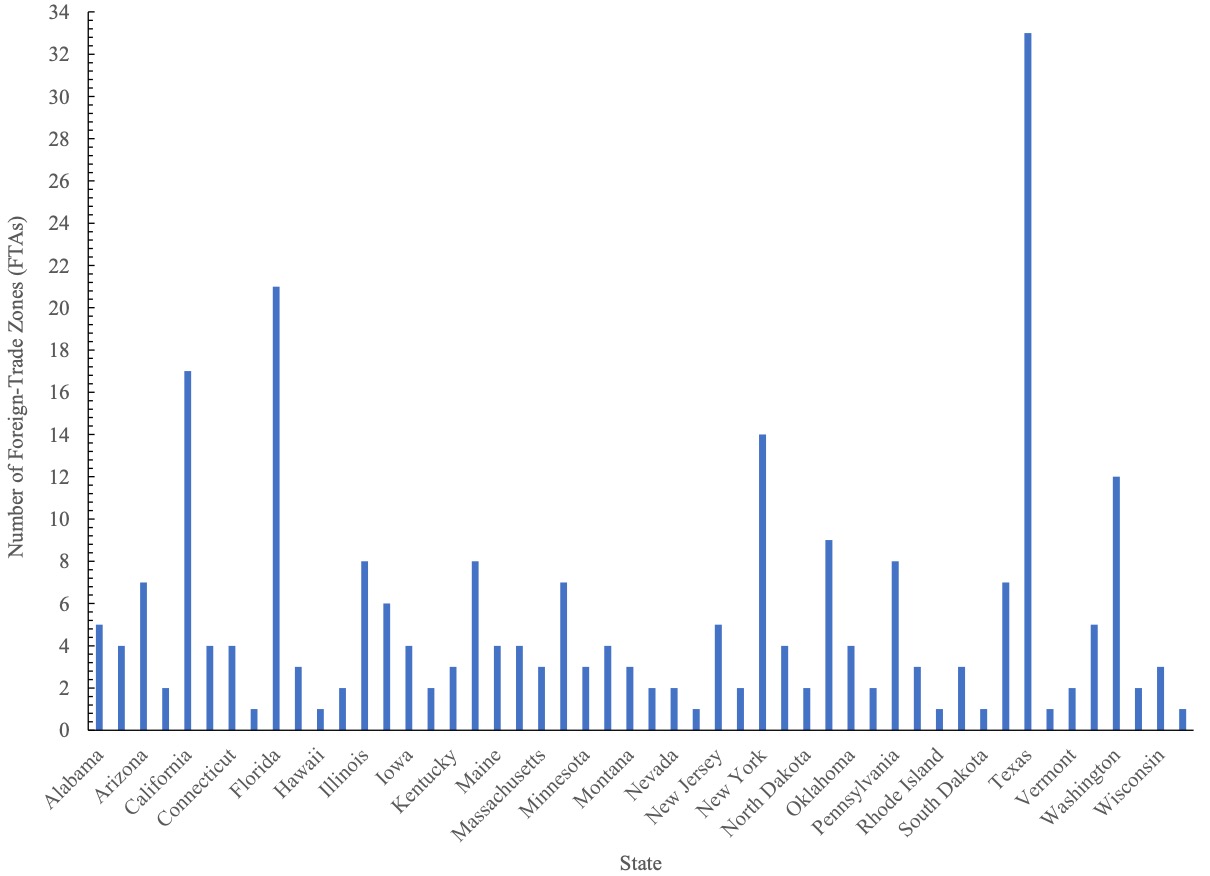
The “critical infrastructure” designation in ALEC’s “Critical Infrastructure Protection Act” is extremely broad, including over 70 pieces of infrastructure, from wastewater treatment and well pads, to ports and pipelines. However, along with the 259 Foreign Trade Zones (FTZ) (Figures 1 and 4) supervised by US Customs and Border Protection (CBP), security is of such importance because over 50% of this infrastructure is related to oil and gas. According to our analysis, there are more than 8,000 unique pieces of infrastructure that fall under this designation, with over 10% in the Marcellus/Utica states of Ohio, West Virginia, and Pennsylvania. See Figure 1 for the number of FTZ per state.
Regarding FTZ, the US Department of Homeland Security doesn’t attempt to hide their genuine nature, boldly proclaiming them “… the United States’ version of what are known internationally as free-trade zones … to serve adequately ‘the public interest’.” If there remains any confusion as to who these zones are geared toward, the US Department of Commerce’s International Administration (ITA) makes the link between FTZ and the fossil fuel industry explicit in its FTZ FAQ page, stating “The largest industry currently using zone procedures is the petroleum refining industry.” (Figure 2)
Figure 1. Number of Foreign-Trade Zones (FTZ) by state as of June 2020.
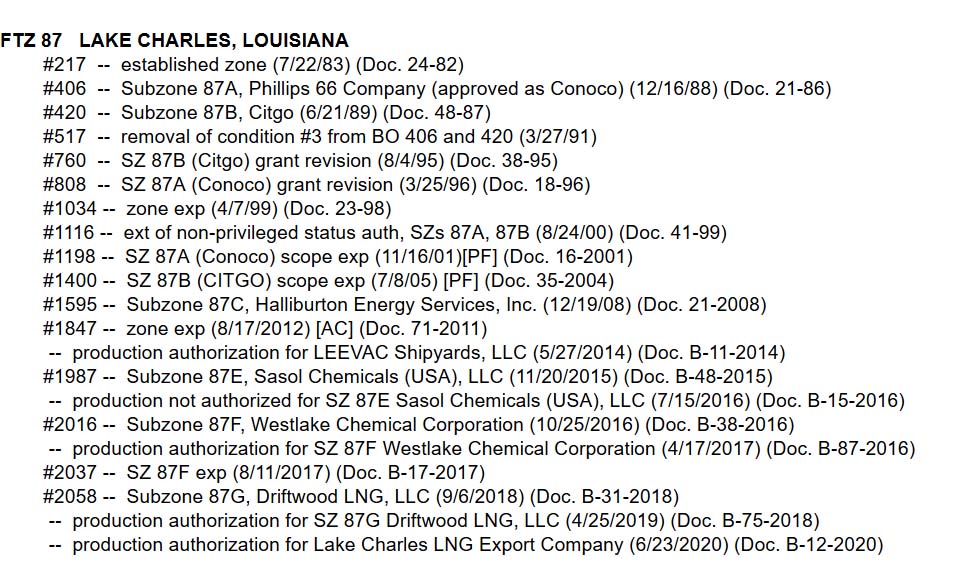
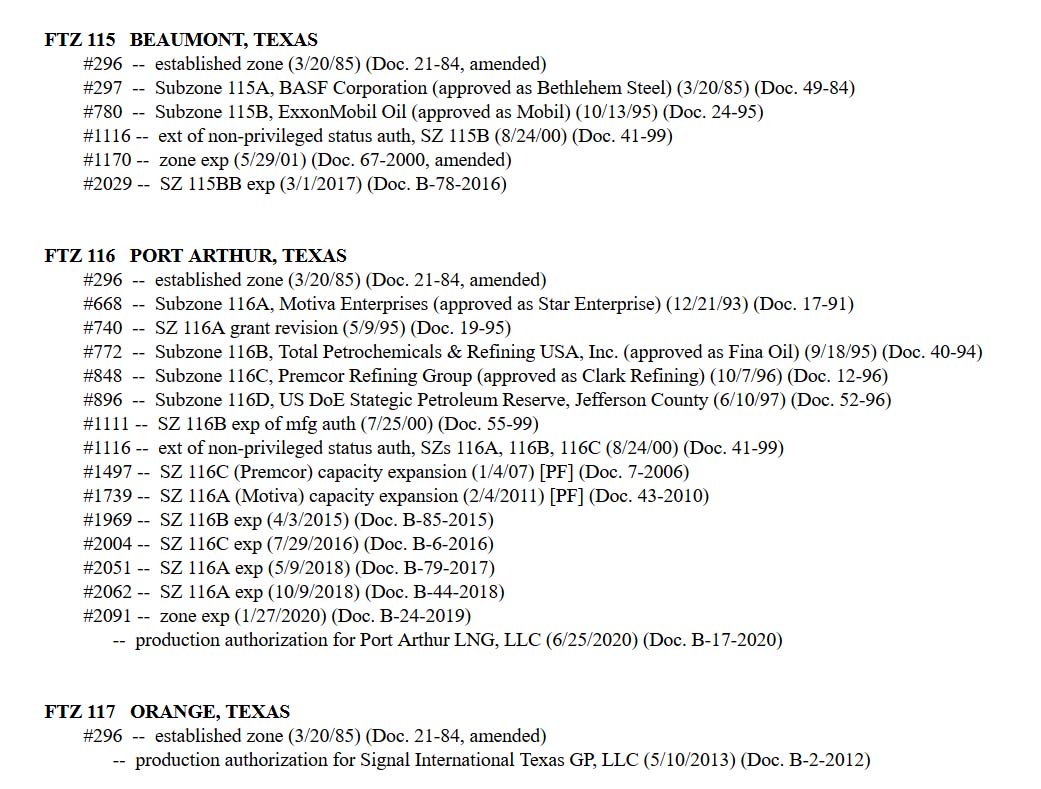
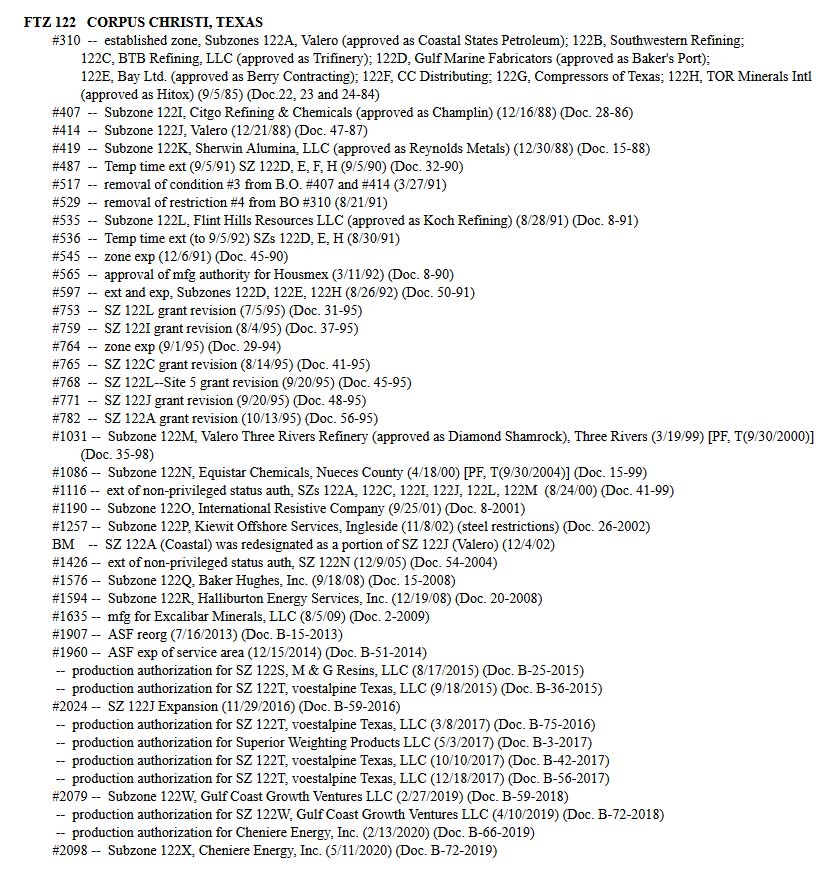
Figure 2. Foreign-Trade Zone (FTZ) Board of Actions in Zones 87 in Lake Charles, LA, 115-117 in and around Port Arthur, TX, and 122 in Corpus Christi, TX. (click on the images to enlarge)
Foreign-Trade Zone (FTZ) Board of Actions in Zone 87 in Lake Charles, Louisiana
Foreign-Trade Zone (FTZ) Board of Actions in Zones 115-117 in and around Port Arthur, Texas
Foreign-Trade Zone (FTZ) Board of Actions in Zone 122 in Corpus Christi, Texas
Much of the oil, gas, and petrochemical industries’ efforts stem from the mass resistance to the Dakota Access Pipeline (DAPL). Native American tribes and environmental groups spent months protesting the environmentally risky $3.78 billion dollar project, which began production in June 2017, after Donald Trump signed an executive order to expedite construction during his first week in office. The Standing Rock Sioux tribe also sued the US government in a campaign effort to protect their tribal lands. The world watched as Energy Transfer Partners (ETP), the company building the pipeline, destroyed Native artifacts and sacred sites, and as police deployed tear gas and sprayed protesters with water in temperatures below freezing.
ETP’s bottom line and reputation were damaged during the fight against DAPL. Besides increasingly militarized law enforcement, the oil and gas industry has retaliated by criminalizing similar types of protests against fossil fuel infrastructure. However, the tireless work of Native Americans and environmental advocates has resulted in a recent victory in March 2020, when a federal judge ordered a halt to the pipeline’s production and an extensive new environmental review of DAPL.
Just days ago, on July 6, 2020, a federal judge ruled that DAPL must shut down until further environmental review can assess potential hazards to the landscape and water quality of the Tribe’s water source. This is certainly a victory for the Standing Rock Sioux Tribe and other environmental defenders, but the decision is subject to appeal.
Since the DAPL conflict began, the industry has been hastily coordinating state-level legislation in anticipation of resistance to other notable national gas transmission pipelines, more locally concerning projects like Class II Oil and Gas Waste Injection Wells, and miles of gas gathering pipelines that transport increasing streams of waste – as well as oil and gas – to coastal processing sites.
The following “critical infrastructure” bills have already been enacted:
STATE
BILL
TITLE
DATE PASSED
West Virginia
HB 4615
NEW PENALTIES FOR PROTESTS NEAR GAS AND OIL PIPELINES
3/25/20
South Dakota
SB 151
NEW PENALTIES FOR PROTESTS NEAR PIPELINES AND OTHER INFRASTRUCTURE
3/18/20
Kentucky
HB 44
NEW PENALTIES FOR PROTESTS NEAR PIPELINES AND OTHER INFRASTRUCTURE
3/16/20
Wisconsin
AB 426
NEW PENALTIES FOR PROTESTS NEAR GAS AND OIL PIPELINES
11/21/19
Missouri
HB 355
NEW PENALTIES FOR PROTESTS NEAR GAS AND OIL PIPELINES
7/11/19
Texas
HB 3557
NEW CRIMINAL AND CIVIL PENALTIES FOR PROTESTS AROUND CRITICAL INFRASTRUCTURE
6/14/19
Tennessee
SB 264
NEW PENALTIES FOR PROTESTS NEAR GAS AND OIL PIPELINES
5/10/19
Indiana
SB 471
NEW PENALTIES FOR PROTESTS NEAR CRITICAL INFRASTRUCTURE
5/6/19
North Dakota
HB 2044
HEIGHTENED PENALTIES FOR PROTESTS NEAR CRITICAL INFRASTRUCTURE
4/10/19
Louisiana
HB 727
HEIGHTENED PENALTIES FOR PROTESTING NEAR A PIPELINE
5/30/18
Oklahoma
HB 1123
NEW PENALTIES FOR PROTESTS NEAR CRITICAL INFRASTRUCTURE
5/3/17
There are an additional eight bills proposed and under consideration in these six states:
STATE
PENDING
TITLE
DATE PROPOSED
Louisiana
HB 197
NEW PENALTIES FOR PROTESTS NEAR CRITICAL INFRASTRUCTURE
2/24/20
Minnesota
HF 3668
NEW PENALTIES FOR PROTESTS NEAR GAS AND OIL PIPELINES
2/24/20
Mississippi
HB 1243
NEW PENALTIES FOR PROTESTS NEAR CRITICAL INFRASTRUCTURE
2/19/20
Alabama
SB 45
NEW PENALTIES FOR PROTESTS NEAR GAS AND OIL PIPELINES
2/4/20
Minnesota
HF 2966
NEW PENALTIES FOR PROTESTS NEAR OIL AND GAS PIPELINES
1/31/20
Minnesota
SF 2011
NEW PENALTIES FOR PROTESTS NEAR GAS AND OIL PIPELINES
3/4/19
Ohio
SB 33
NEW PENALTIES FOR PROTESTS NEAR CRITICAL INFRASTRUCTURE
2/12/19
Illinois
HB 1633
NEW PENALTIES FOR PROTESTS NEAR CRITICAL INFRASTRUCTURE
1/31/19
Desperate Backlash Against Peaceful Protest
Activists and organizations like the American Civil Liberties Union (ACLU) are framing their opposition to such legislation as an attempt to stave off the worst Orwellian instincts of our elected officials, whether they are in Columbus or Mar-a-Lago. On the other hand, industry and prosecutors are framing these protests as terroristic acts that threaten national security, which is why sentencing comes with a felony conviction and up to ten years in prison. The view of the FBI’s deputy assistant director and top official in charge of domestic terrorism John Lewis is that, “In recent years, the Animal Liberation Front and the Earth Liberation Front have become the most active, criminal extremist elements in the United States … the FBI’s investigation of animal rights extremists and ecoterrorism matters is our highest domestic terrorism investigative priority.”
It shocked many when last week, two protesters in the petrochemical-laden “Cancer Alley” region of Louisiana were arrested and charged under the state’s felony “terrorist” law. Their crime? Placing boxes of nurdles – plastic pellets that are the building blocks of many single-use plastic products – on the doorsteps of fossil fuel lobbyists’ homes. To make matters more ridiculous, the nurdles were illegally dumped by the petrochemical company Formosa Plastics.[2] This is outrageous indeed, but is the sort of legally-sanctioned oppression that fossil fuel industry lobbyists have been successfully advocating for years.
American Fuel & Petrochemical Manufacturers (AFPM) stated in a letter of support for ALEC’s legislative efforts:
“In recent years, there has been a growing and disturbing trend of individuals and organizations attempting to disrupt the operation of critical infrastructure in the energy, manufacturing, telecommunications, and transportation industries. Energy infrastructure is often targeted by environmental activists to raise awareness of climate change and other perceived environmental challenges. These activities, however, expose individuals, communities, and the environment to unacceptable levels of risk, and can cause millions of dollars in damage … As the private sector continues to expand and maintain the infrastructure necessary to safely and reliably deliver energy and other services to hundreds of millions of Americans, policymakers should continue to consider how they can help discourage acts of sabotage … Finally, it will also hold organizations both criminally and vicariously liable for conspiring with individuals who willfully trespass or damage critical infrastructure sites.”
Those organizations deemed ‘criminally and vicariously liable’ would in some states face fines an order of magnitude greater than the actual individual, which would cripple margin-thin environmental groups around the country, and could amount to $100,000 to $1,000,000. The AFPM’s senior vice president for federal and regulatory affairs Derrick Morgan referred to these vicarious organizations as “inspiring … organizations who have ill intent, want to encourage folks to damage property and endanger lives …”
One of the most disturbing aspects of this legislation is that it could, according to the testimony and additional concerns of ACLU of Ohio’s Chief Lobbyist Gary Daniels, equate “‘impeding’ and ‘inhibiting’ the ‘operations’ of a critical infrastructure site” with acts as innocuous as Letters to the Editor, labor strikes or protests, attending and submitting testimony at hearings, or simply voicing your concern or objections to the validity of industry claims and its proposals with emails, faxes, phone calls, or a peaceful protest outside critical infrastructure that raises the concern of site security. Mr. Daniels noted in his additional written testimony that the latter, “may prove inconvenient to the site’s staff, under SB 250 they would be an F3 [Third Degree Felony], and that is without someone even stepping foot on or near the property, as physical presence is not required to be guilty of criminal mischief, as found in/defined in Sec. 2907.07(A)(7) of the bill.”
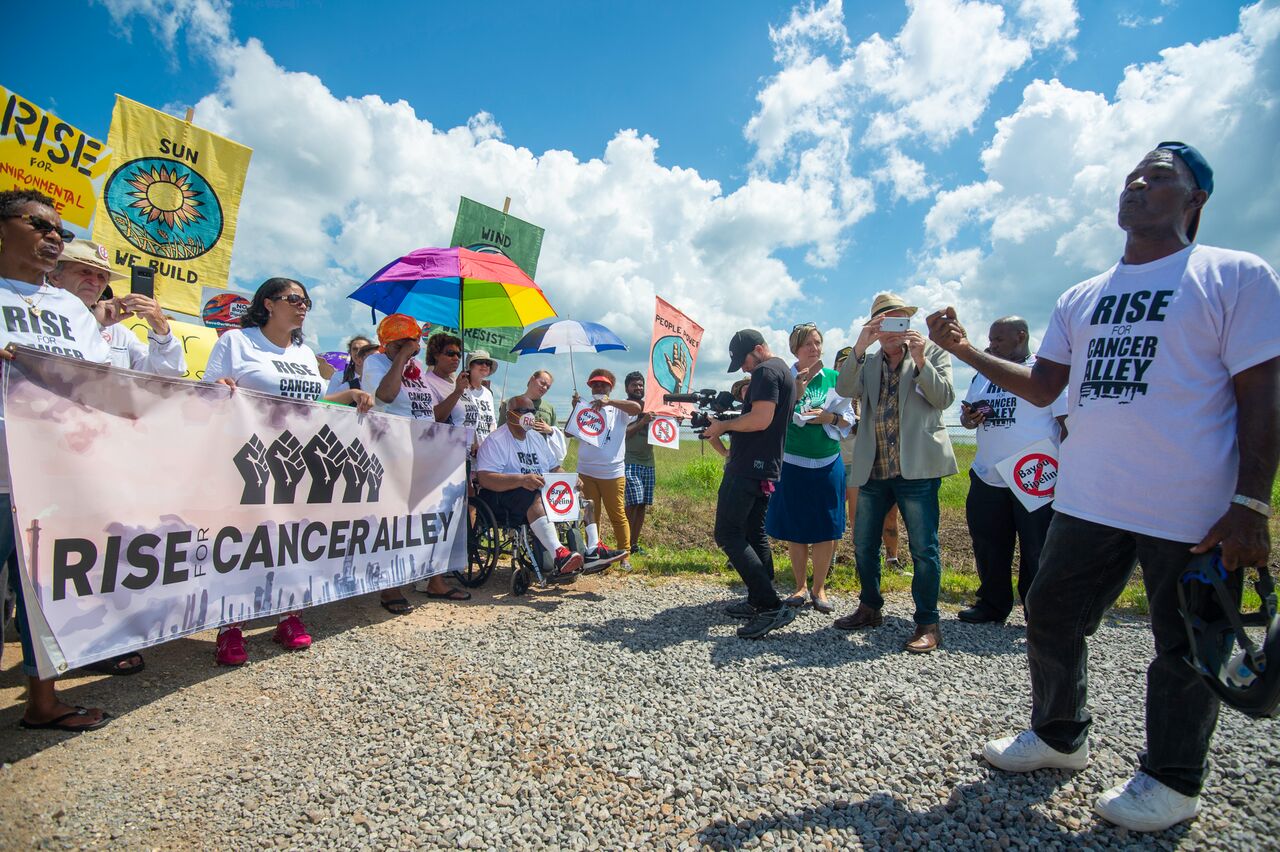
Figure 3. A rally held by the Louisiana-based nonprofit RISE St. James.
This connection, when enshrined into law, will have a chilling effect on freedom of speech and assembly, and will stop protests or thoughtful lines of questioning before they even start. As the Ohio Valley Environmental Coalition (OVEC) put it in their request for residents to ask the governor to veto the now-enacted HB 4615, such a bill is unnecessary, duplicative, deceitful, un-American, unconstitutional, and “will further crowd our jails and prisons.”
To combat such industry-friendly legislation that erodes local government control in Ohio, lawmakers like State Senator Nikki Antonio are introducing resolutions like SR 221, which would, “abolish corporate personhood and money-as-speech doctrine” made law by the Supreme Court of the United States’ rulings in Citizens United v. FEC and Buckley v. Valeo. After all, the overarching impact of ALEC’s efforts and those described below furthers privatized, short-term profit and socialized, long-term costs, and amplifies the incredibly corrosive Citizen’s United decision a little over a decade ago.
Further Criminalization of Protest, Protections for Law Enforcement
Simultaneously, there is an effort to criminalize protest activities through “riot boosting acts,” increased civil liability and decreased police liability, trespassing penalties, and new sanctions for protestors who conceal their identities (by wearing a face mask, for example).
The following bills have already been enacted:
STATE
BILL
TITLE
DATE PASSED
South Dakota
SB 189
EXPANDED CIVIL LIABILITY FOR PROTESTERS AND PROTEST FUNDERS
3/27/19
West Virginia
HB 4618
ELIMINATING POLICE LIABILITY FOR DEATHS WHILE DISPERSING RIOTS AND UNLAWFUL ASSEMBLIES
3/10/18
North Dakota
HB 1426
HEIGHTENED PENALTIES FOR RIOT OFFENCES
2/23/17
North Dakota
HB 1293
EXPANDED SCOPE OF CRIMINAL TRESPASS
2/23/17
North Dakota
HB 1304
NEW PENALTIES FOR PROTESTERS WHO CONCEAL THEIR IDENTITY
2/23/17
In addition, the following bills have been proposed and are under consideration:
STATE
PENDING
TITLE
DATE PROPOSED
Rhode Island
H 7543
NEW PENALTIES FOR PROTESTERS WHO CONCEAL THEIR IDENTITY
2/12/20
Oregon
HB 4126
HARSH PENALTIES FOR PROTESTERS WHO CONCEAL THEIR IDENTITY
1/28/20
Tennessee
SB 1750
NEW PENALTIES FOR PROTESTERS WHO CONCEAL THEIR IDENTITY
1/21/20
Ohio
HB 362
NEW PENALTIES FOR PROTESTERS WHO CONCEAL THEIR IDENTITY
10/8/19
Pennsylvania
SB 887
NEW PENALTIES FOR PROTESTS NEAR “CRITICAL INFRASTRUCTURE”
10/7/19
Massachusetts
HB 1588
PROHIBITION ON MASKED DEMONSTRATIONS
1/17/19
All the while, the Bundy clan of Utah pillage – and at times – hold our public lands hostage, and white male Michiganders enter the state capital in Lansing armed for Armageddon, because they feel that COVID-19 is a hoax. We imagine that it isn’t these types of folks that West Virginia State Representatives John Shott and Roger Hanshaw had in mind when they wrote and eventually successfully passed HB 4618, which eliminated police liability for deaths while dispersing riots and unlawful assemblies.
Contrarily, South Dakota’s SB 189, or “Riot Boosting Act,” was blocked by the likes of US District Judge Lawrence L. Piersol, who wrote:
“Imagine that if these riot boosting statutes were applied to the protests that took place in Birmingham, Alabama, what might be the result? … Dr. King and the Southern Christian Leadership Conference could have been liable under an identical riot boosting law.”
FracTracker collaborated with Crude Accountability on a report documenting increasing reprisals against environmental activists in the US and Eurasia. Read the Report.
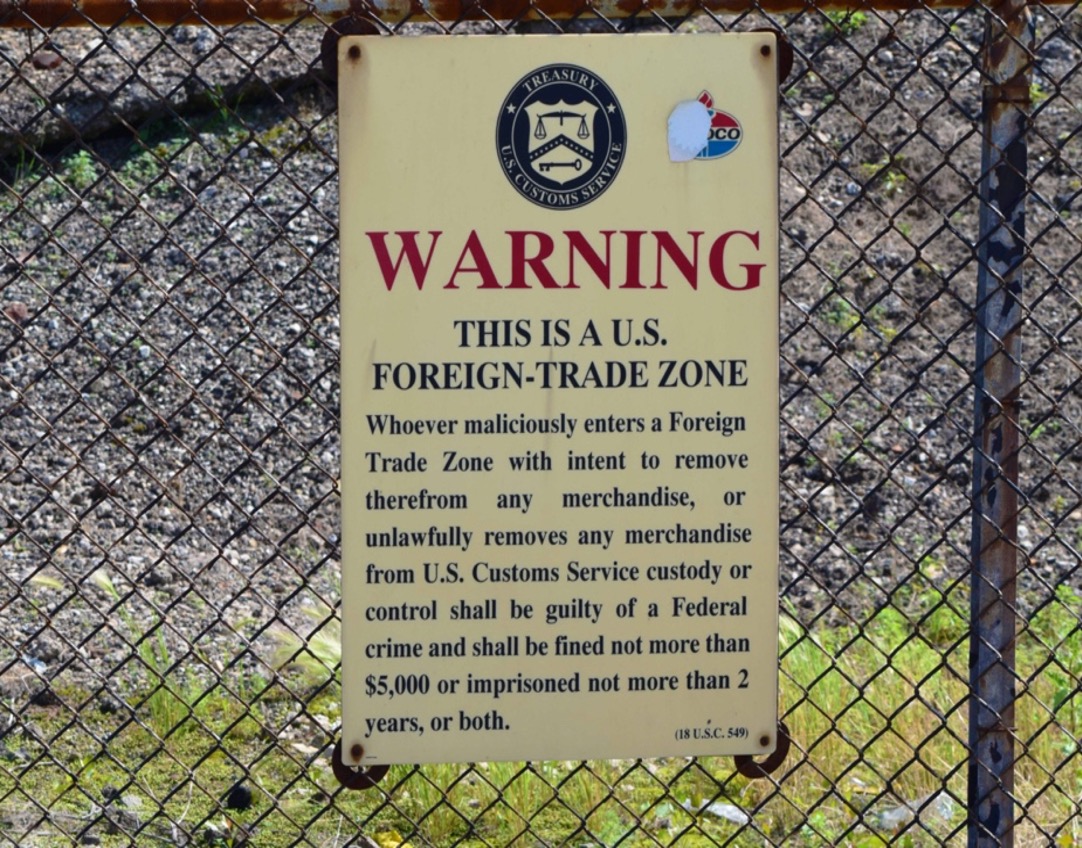
Figure 4. Photo of US Treasury Department signage outlining the warning associated with BP’s Whiting, IN, oil refinery designated a Foreign Trade Zone (FTZ). Photo by Ted Auch July 15th, 2015
In all fairness to Mr. Emanuel, he was referring to the Obama administration’s support for the post-2008 bipartisan Wall Street bailout. However, it is critical that we acknowledge the push for critical infrastructure legislation has been most assuredly bipartisan, with Democratic Governors in Kentucky, Louisiana, and Wisconsin signing into law their versions on March 16th of this year, in May of 2018, and in November of 2019, respectively.
Related Legislation in Need of Immediate Attention
In Columbus, Ohio, there are several pieces of legislation being pushed in concert with ALEC-led efforts. These include the recently submitted HB 362, that would “create the crime of masked intimidation.” Phil Plummer and George F. Lang sponsor the bill, with the latter being the same official who introduced HB 625, a decidedly anti-local control bill that would preempt communities from banning plastic bags. Most of the general public and some of the country’s largest supermarket chains have identified plastic bag bans as a logical next step as they wrestle with their role in the now universally understood crimes plastics have foisted on our oceans and shores. As Cleveland Scene’s Sam Allard wrote, “bill mills” and their willing collaborators in states like Ohio cause such geographies to march “boldly, with sigils flying in the opposite direction” of progress, and a more renewable and diversified energy future.
With respect to Plummer and Lang’s HB 362, two things must be pointed out:
1) It is eerily similar to North Dakota’s HB 1304 that created new penalties for protestors who conceal their identity, and
So, when elected officials as far away as Columbus copy and paste legislation passed in the aftermath of the DAPL resistance efforts, it is clear the message they are conveying, and the audience(s) they are trying to intimidate.
Plummer and Lang’s HB 362 would add a section to the state’s “Offenses Against the Public Peace,” Chapter 2917, that would in part read:
No person shall wear a mask or disguise in order to purposely do any of the following:
(A) Obstruct the execution of the law;
(B) Intimidate, hinder, or interrupt a person in the performance of the person’s legal duty; or
(C) Prevent a person from exercising the rights granted to them by the Constitution or the laws of this state.
Whoever violates this proposed section is guilty of masked intimidation. Masked intimidation is a first degree misdemeanor. It was critical for the DAPL protestors to protect their faces during tear gas and pepper spray barrages, from county sheriffs and private security contractors alike.
At the present moment, masks are one of the few things standing between COVID-19 and even more death. Given these realities, it is stunning that our elected officials have the time and/or interest in pushing bills such as HB 362 under the thin veil of law and order.
But judging by what one West Virginia resident and former oil and gas industry draftsman,[3] wrote to us recently, elected officials do not really have much to lose, given how little most people think of them:
“Honestly, it doesn’t seem to matter what we do. The only success most of us have had is in possibly slowing the process down and adding to the cost that the companies incur. But then again, the increase in costs probably just gets passed down to the consumers. One of the biggest drawbacks in my County is that most, if not all, of the elected officials are pro drilling. Many of them have profited from it.”
The oil, gas, and petrochemical industries are revealing their weakness by scrambling to pass repressive legislation to counteract activists. But social movements around the world are determined to address interrelated social and environmental issues before climate chaos renders our planet unlivable, particularly for those at the bottom of the socioeconomic ladder. We hope that by shining a light on these bills, more people will become outraged enough to join the fight against antidemocratic legislation.
This is Part I of a two-part series on concerning legislation related to the oil, gas, and petrochemical industries. Part II focuses on bills that would weaken environmental regulations in Ohio, Michigan, and South Dakota.
By Ted Auch, PhD, Great Lakes Program Coordinator and Shannon Smith, Manager of Communications & Development
[1] See Naomi Klein’s concept of the Shock Doctrine for similar trends.
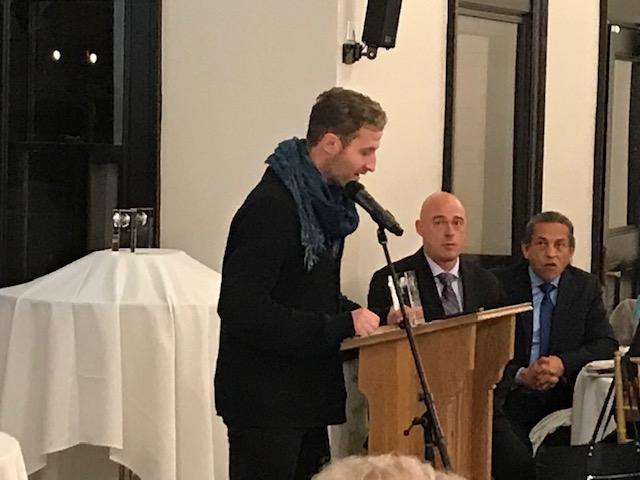
[2] The community-based environmental organization RISE St. James has been working tirelessly to prevent Formosa Plastics from building one of the largest petrochemical complexes in the US in their Parish. Sharon Lavigne is a leading member of RISE St. James, and is an honored recipient of the 2019 Community Sentinel Award for Environmental Stewardship. Read more on Sharon’s work with RISE St. James here.
[3] This individual lives in Central West Virginia, and formerly monitored Oil & Gas company assets in primarily WV, PA, NY, VA, MD & OH, as well as the Gulf Coast. Towards the end of this individual’s career, they provided mapping support for the smart pigging program, call before you dig, and the pipeline integrity program.
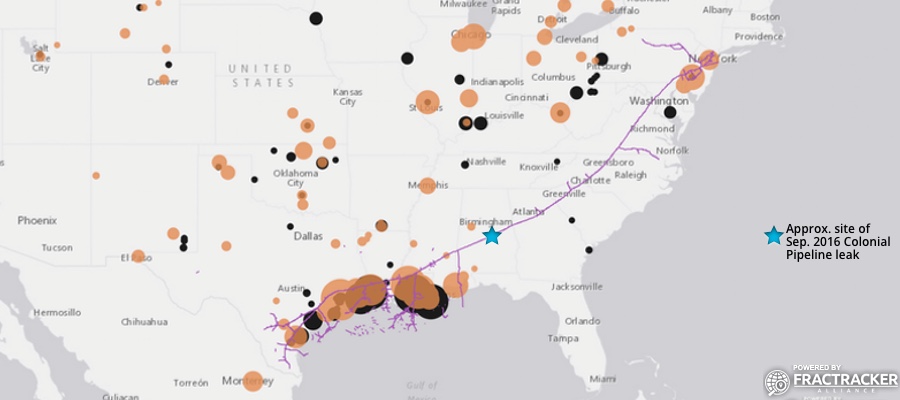
FracTracker Alliance has released a new national map, filled with energy and petrochemical data. Explore the map, continue reading to learn more, and see how your state measures up!
This map has been updated since this blog post was originally published, and therefore statistics and figures below may no longer correspond with the map
The items on the map (followed by facility count in parenthesis) include:
For oil and gas wells, view FracTracker’s state maps.
Transportation & Storage
Natural gas compressor stations (1,367) – Facilities built along a pipeline route that pressurize natural gas to keep it flowing through the pipeline.
Crude oil rail terminals (94) – Rail terminals that load and unload crude oil (liquid hydrocarbons that have yet to be processed into higher-value petroleum products).
Liquefied natural gas import/export terminals (8) – Facilities that can a) liquefy natural gas so it can be exported as LNG (liquefied natural gas) and/or b) re-gasify LNG so it can be used as natural gas. Natural gas is transported in a liquid state because it takes up less space as a liquid than as a gas.
Natural Gas Underground Storage (486) – Locations where natural gas is stored underground in aquifers, depleted gas fields, and salt formations.
Petroleum Product Terminals (1,484) – Terminals with a storage capacity of 50,000 barrels or more and/or the ability to receive volumes from tanker, barge, or pipeline. Petroleum products include products “produced from the processing of crude oil and other liquids at petroleum refineries, from extraction of liquid hydrocarbons at natural gas processing plants, and from production of finished petroleum products at blending facilities.”
Petroleum Ports (242) – A port that can import and/or export 200,000 or more short tons of petroleum products a year.
Natural gas import/export pipeline facility (54) – A facility where natural gas crosses the border of the continental United States.
Pipelines
Crude oil pipelines – major crude oil pipelines, including interstate truck lines and selected intrastate lines, but not including gathering lines.
Natural gas liquid pipelines – Also referred to as hydrocarbon gas liquid pipelines, they carry the heavier components of the natural gas stream which are liquid under intense pressure and extreme cold, but gas in normal conditions.
Natural gas pipelines– Interstate and intrastate natural gas pipelines. Due to the immensity of this pipeline network and lack of available data, this pipeline layer in particular varies in degree of accuracy.
Petroleum Product Pipelines – Major petroleum product pipelines.
Recent Pipeline Projects – Pipeline projects that have been announced since 2017. This includes projects in various stages, including under construction, complete, planned or canceled. Click on the pipeline for the status.
Processing & Downstream
Natural Gas Processing Plants (478) – Plants that separate impurities and components of the natural gas stream.
Chemical plants (36) – Includes two types of chemical plants – petrochemical production and ammonia manufacturing – that report to EPA’s Greenhouse Gas Reporting Program.
Ethylene Crackers (30) – Also referred to as ethane crackers, these petrochemical complexes that converts ethane (a natural gas liquid) into ethylene. Ethylene is used to make products like polyethylene plastic.
Petroleum Refineries (135) – A plant that processes crude oil into products like petroleum naphtha, diesel fuel, and gasoline.
Power Plants (9,414) – Electric generating plants with a capacity of at least one megawatt, sorted by energy source.
Wind Turbines (63,003) – Zoom in on wind power plants to see this legend item appear.
Natural Resources
Shale Plays (45) – Tight oil and gas shale plays, which are formations where oil and gas can be extracted.
Major Rivers
Solar Energy Potential – Potential solar energy generation, in kilowatt-hours per square meter per day – averaged annually.
This map is by no means exhaustive, but is exhausting. It takes a lot of infrastructure to meet the energy demands from industries, transportation, residents, and businesses – and the vast majority of these facilities are powered by fossil fuels. What can we learn about the state of our national energy ecosystem from visualizing this infrastructure? And with increasing urgency to decarbonize within the next one to three decades, how close are we to completely reengineering the way we make energy?
Key Takeaways
Natural gas accounts for 44% of electricity generation in the United States – more than any other source. Despite that, the cost per megawatt hour of electricity for renewable energy power plants is now cheaper than that of natural gas power plants.
The state generating the largest amount of solar energy is California, while wind energy is Texas. The state with the greatest relative solar energy is not technically a state – it’s D.C., where 18% of electricity generation is from solar, closely followed by Nevada at 17%. Iowa leads the country in relative wind energy production, at 45%.
The state generating the most amount of energy from both natural gas and coal is Texas. Relatively, West Virginia has the greatest reliance on coal for electricity (85%), and Rhode Island has the greatest percentage of natural gas (92%).
With 28% of total U.S. energy consumption for transportation, many of the refineries, crude oil and petroleum product pipelines, and terminals on this map are dedicated towards gasoline, diesel, and other fuel production.
Petrochemical production, which is expected to account for over a third of global oil demand growth by 2030, takes the form of chemical plants, ethylene crackers, and natural gas liquid pipelines on this map, largely concentrated in the Gulf Coast.
Electricity generation
The “power plant” legend item on this map contains facilities with an electric generating capacity of at least one megawatt, and includes independent power producers, electric utilities, commercial plants, and industrial plants. What does this data reveal?
In terms of the raw number of power plants – solar plants tops the list, with 2,916 facilities, followed by natural gas at 1,747.
In terms of megawatts of electricity generated, the picture is much different – with natural gas supplying the highest percentage of electricity (44%), much more than the second place source, which is coal at 21%, and far more than solar, which generates only 3% (Figure 1).
Figure 1. Electricity generation by source in the United States, 2019. Data from EIA.
This difference speaks to the decentralized nature of the solar industry, with more facilities producing less energy. At a glance, this may seem less efficient and more costly than the natural gas alternative, which has fewer plants producing more energy. But in reality, each of these natural gas plants depend on thousands of fracked wells – and they’re anything but efficient.
The cost per megawatt hour of electricity for a renewable energy power plants is now cheaper than that of fracked gas power plants. A report by the Rocky Mountain Institute, found “even as clean energy costs continue to fall, utilities and other investors have announced plans for over $70 billion in new gas-fired power plant construction through 2025. RMI research finds that 90% of this proposed capacity is more costly than equivalent [clean energy portfolios, which consist of wind, solar, and energy storage technologies] and, if those plants are built anyway, they would be uneconomic to continue operating in 2035.”
The economics side with renewables – but with solar, wind, geothermal comprising only 12% of the energy pie, and hydropower at 7%, do renewables have the capacity to meet the nation’s energy needs? Yes! Even the Energy Information Administration, a notorious skeptic of renewable energy’s potential, forecasted renewables would beat out natural gas in terms of electricity generation by 2050 in their 2020 Annual Energy Outlook.
This prediction doesn’t take into account any future legislation limiting fossil fuel infrastructure. A ban on fracking or policies under a Green New Deal could push renewables into the lead much sooner than 2050.
In a void of national leadership on the transition to cleaner energy, a few states have bolstered their renewable portfolio.
Figure 2. Electricity generation state-wide by source, 2019. Data from EIA.
One final factor to consider – the pie pieces on these state charts aren’t weighted equally, with some states’ capacity to generate electricity far greater than others. The top five electricity producers are Texas, California, Florida, Pennsylvania, and Illinois.
Transportation
In 2018, approximately 28% of total U.S. energy consumption was for transportation. To understand the scale of infrastructure that serves this sector, it’s helpful to click on the petroleum refineries, crude oil rail terminals, and crude oil pipelines on the map.
Transportation Fuel Infrastructure. Data from EIA.
The majority of gasoline we use in our cars in the US is produced domestically. Crude oil from wells goes to refineries to be processed into products like diesel fuel and gasoline. Gasoline is taken by pipelines, tanker, rail, or barge to storage terminals (add the “petroleum product terminal” and “petroleum product pipelines” legend items), and then by truck to be further processed and delivered to gas stations.
China leads the world in this movement. In 2018, just over half of the world’s electric vehicles sales occurred in China. Analysts predict that the country’s oil demand will peak in the next five years thanks to battery-powered vehicles and high-speed rail.
In the United States, the percentage of electric vehicles on the road is small but growing quickly. Tax credits and incentives will be important for encouraging this transition. Almost half of the country’s electric vehicle sales are in California, where incentives are added to the federal tax credit. California also has a “Zero Emission Vehicle” program, requiring electric vehicles to comprise a certain percentage of sales.
We can’t ignore where electric vehicles are sourcing their power – and for that we must go back up to the electricity generation section. If you’re charging your car in a state powered mainly by fossil fuels (as many are), then the electricity is still tied to fossil fuels.
Petrochemicals
Many of the oil and gas infrastructure on the map doesn’t go towards energy at all, but rather aids in manufacturing petrochemicals – the basis of products like plastic, fertilizer, solvents, detergents, and resins.
Natural gas processing plants separate components of the natural gas stream to extract natural gas liquids like ethane and propane – which are transported through the natural gas liquid pipelines. These natural gas liquids are key building blocks of the petrochemical industry.
Ethane crackers process natural gas liquids into polyethylene – the most common type of plastic.
The chemical plants on this map include petrochemical production plants and ammonia manufacturing. Ammonia, which is used in fertilizer production, is one of the top synthetic chemicals produced in the world, and most of it comes from steam reforming natural gas.
As we discuss ways to decarbonize the country, petrochemicals must be a major focus of our efforts. That’s because petrochemicals are expected to account for over a third of global oil demand growth by 2030 and nearly half of demand growth by 2050 – thanks largely to an increase in plastic production. The International Energy Agency calls petrochemicals a “blind spot” in the global energy debate.
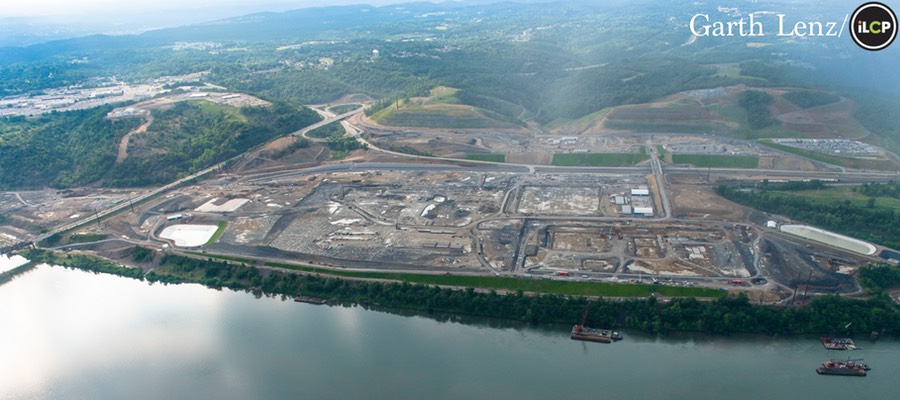
Petrochemical development off the coast of Texas, November 2019. Photo by Ted Auch, aerial support provided by LightHawk.
Investing in plastic manufacturing is the fossil fuel industry’s strategy to remain relevant in a renewable energy world. As such, we can’t break up with fossil fuels without also giving up our reliance on plastic. Legislation like the Break Free From Plastic Pollution Act get to the heart of this issue, by pausing construction of new ethane crackers, ensuring the power of local governments to enact plastic bans, and phasing out certain single-use products.
“The greatest industrial challenge the world has ever faced”
Mapped out, this web of fossil fuel infrastructure seems like a permanent grid locking us into a carbon-intensive future. But even more overwhelming than the ubiquity of fossil fuels in the US is how quickly this infrastructure has all been built. Everything on this map was constructed since Industrial Revolution, and the vast majority in the last century (Figure 3) – an inch on the mile-long timeline of human civilization.
Figure 3. Global Fossil Fuel Consumption. Data from Vaclav Smil (2017)
In fact, over half of the carbon from burning fossil fuels has been released in the last 30 years. As David Wallace Wells writes in The Uninhabitable Earth, “we have done as much damage to the fate of the planet and its ability to sustain human life and civilization since Al Gore published his first book on climate than in all the centuries—all the millennia—that came before.”
What will this map look like in the next 30 years?
A recent report on the global economics of the oil industry states, “To phase out petroleum products (and fossil fuels in general), the entire global industrial ecosystem will need to be reengineered, retooled and fundamentally rebuilt…This will be perhaps the greatest industrial challenge the world has ever faced historically.”
Is it possible to build a decentralized energy grid, generated by a diverse array of renewable, local, natural resources and backed up by battery power? Could all communities have the opportunity to control their energy through member-owned cooperatives instead of profit-thirsty corporations? Could microgrids improve the resiliency of our system in the face of increasingly intense natural disasters and ensure power in remote regions? Could hydrogen provide power for energy-intensive industries like steel and iron production? Could high speed rail, electric vehicles, a robust public transportation network and bike-able cities negate the need for gasoline and diesel? Could traditional methods of farming reduce our dependency on oil and gas-based fertilizers? Could zero waste cities stop our reliance on single-use plastic?
Of course! Technology evolves at lightning speed. Thirty years ago we didn’t know what fracking was and we didn’t have smart phones. The greater challenge lies in breaking the fossil fuel industry’s hold on our political system and convincing our leaders that human health and the environment shouldn’t be externalized costs of economic growth.
https://www.fractracker.org/a5ej20sjfwe/wp-content/uploads/2020/02/National-map-feature-3.png400900Erica Jacksonhttps://www.fractracker.org/a5ej20sjfwe/wp-content/uploads/2025/09/2025-Wordmark-Logo.pngErica Jackson2020-02-28 17:35:142022-05-02 15:21:42National Energy and Petrochemical Map
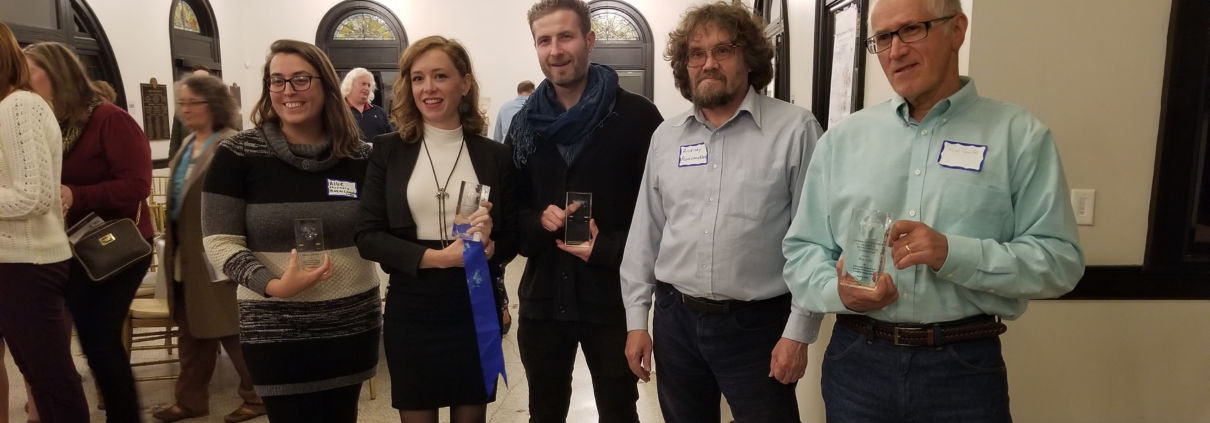
There are many courageous and determined individuals to be grateful for within the environmental movement. At the 2019 Community Sentinel Awards for Environmental Stewardship, we were graced with the presence of many such leaders, and celebrated four in particular as this year’s award winners. From those fighting LNG export terminals on the West Coast, to those resisting fracking expansion in the Marcellus Shale and other formations, to those shutting down petrochemical expansion in the Gulf Coast – thank you, Sentinels.
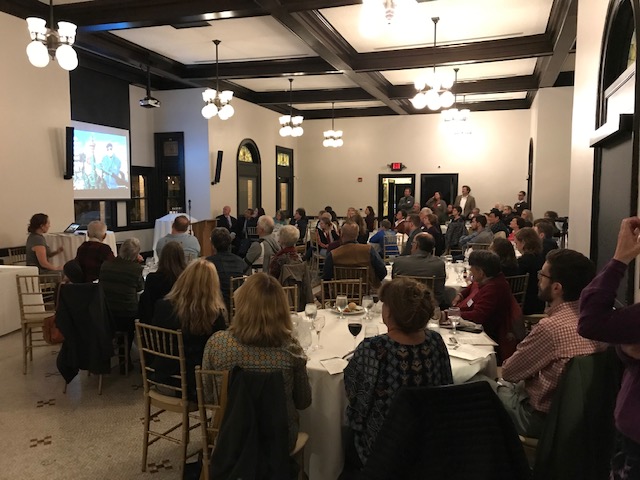
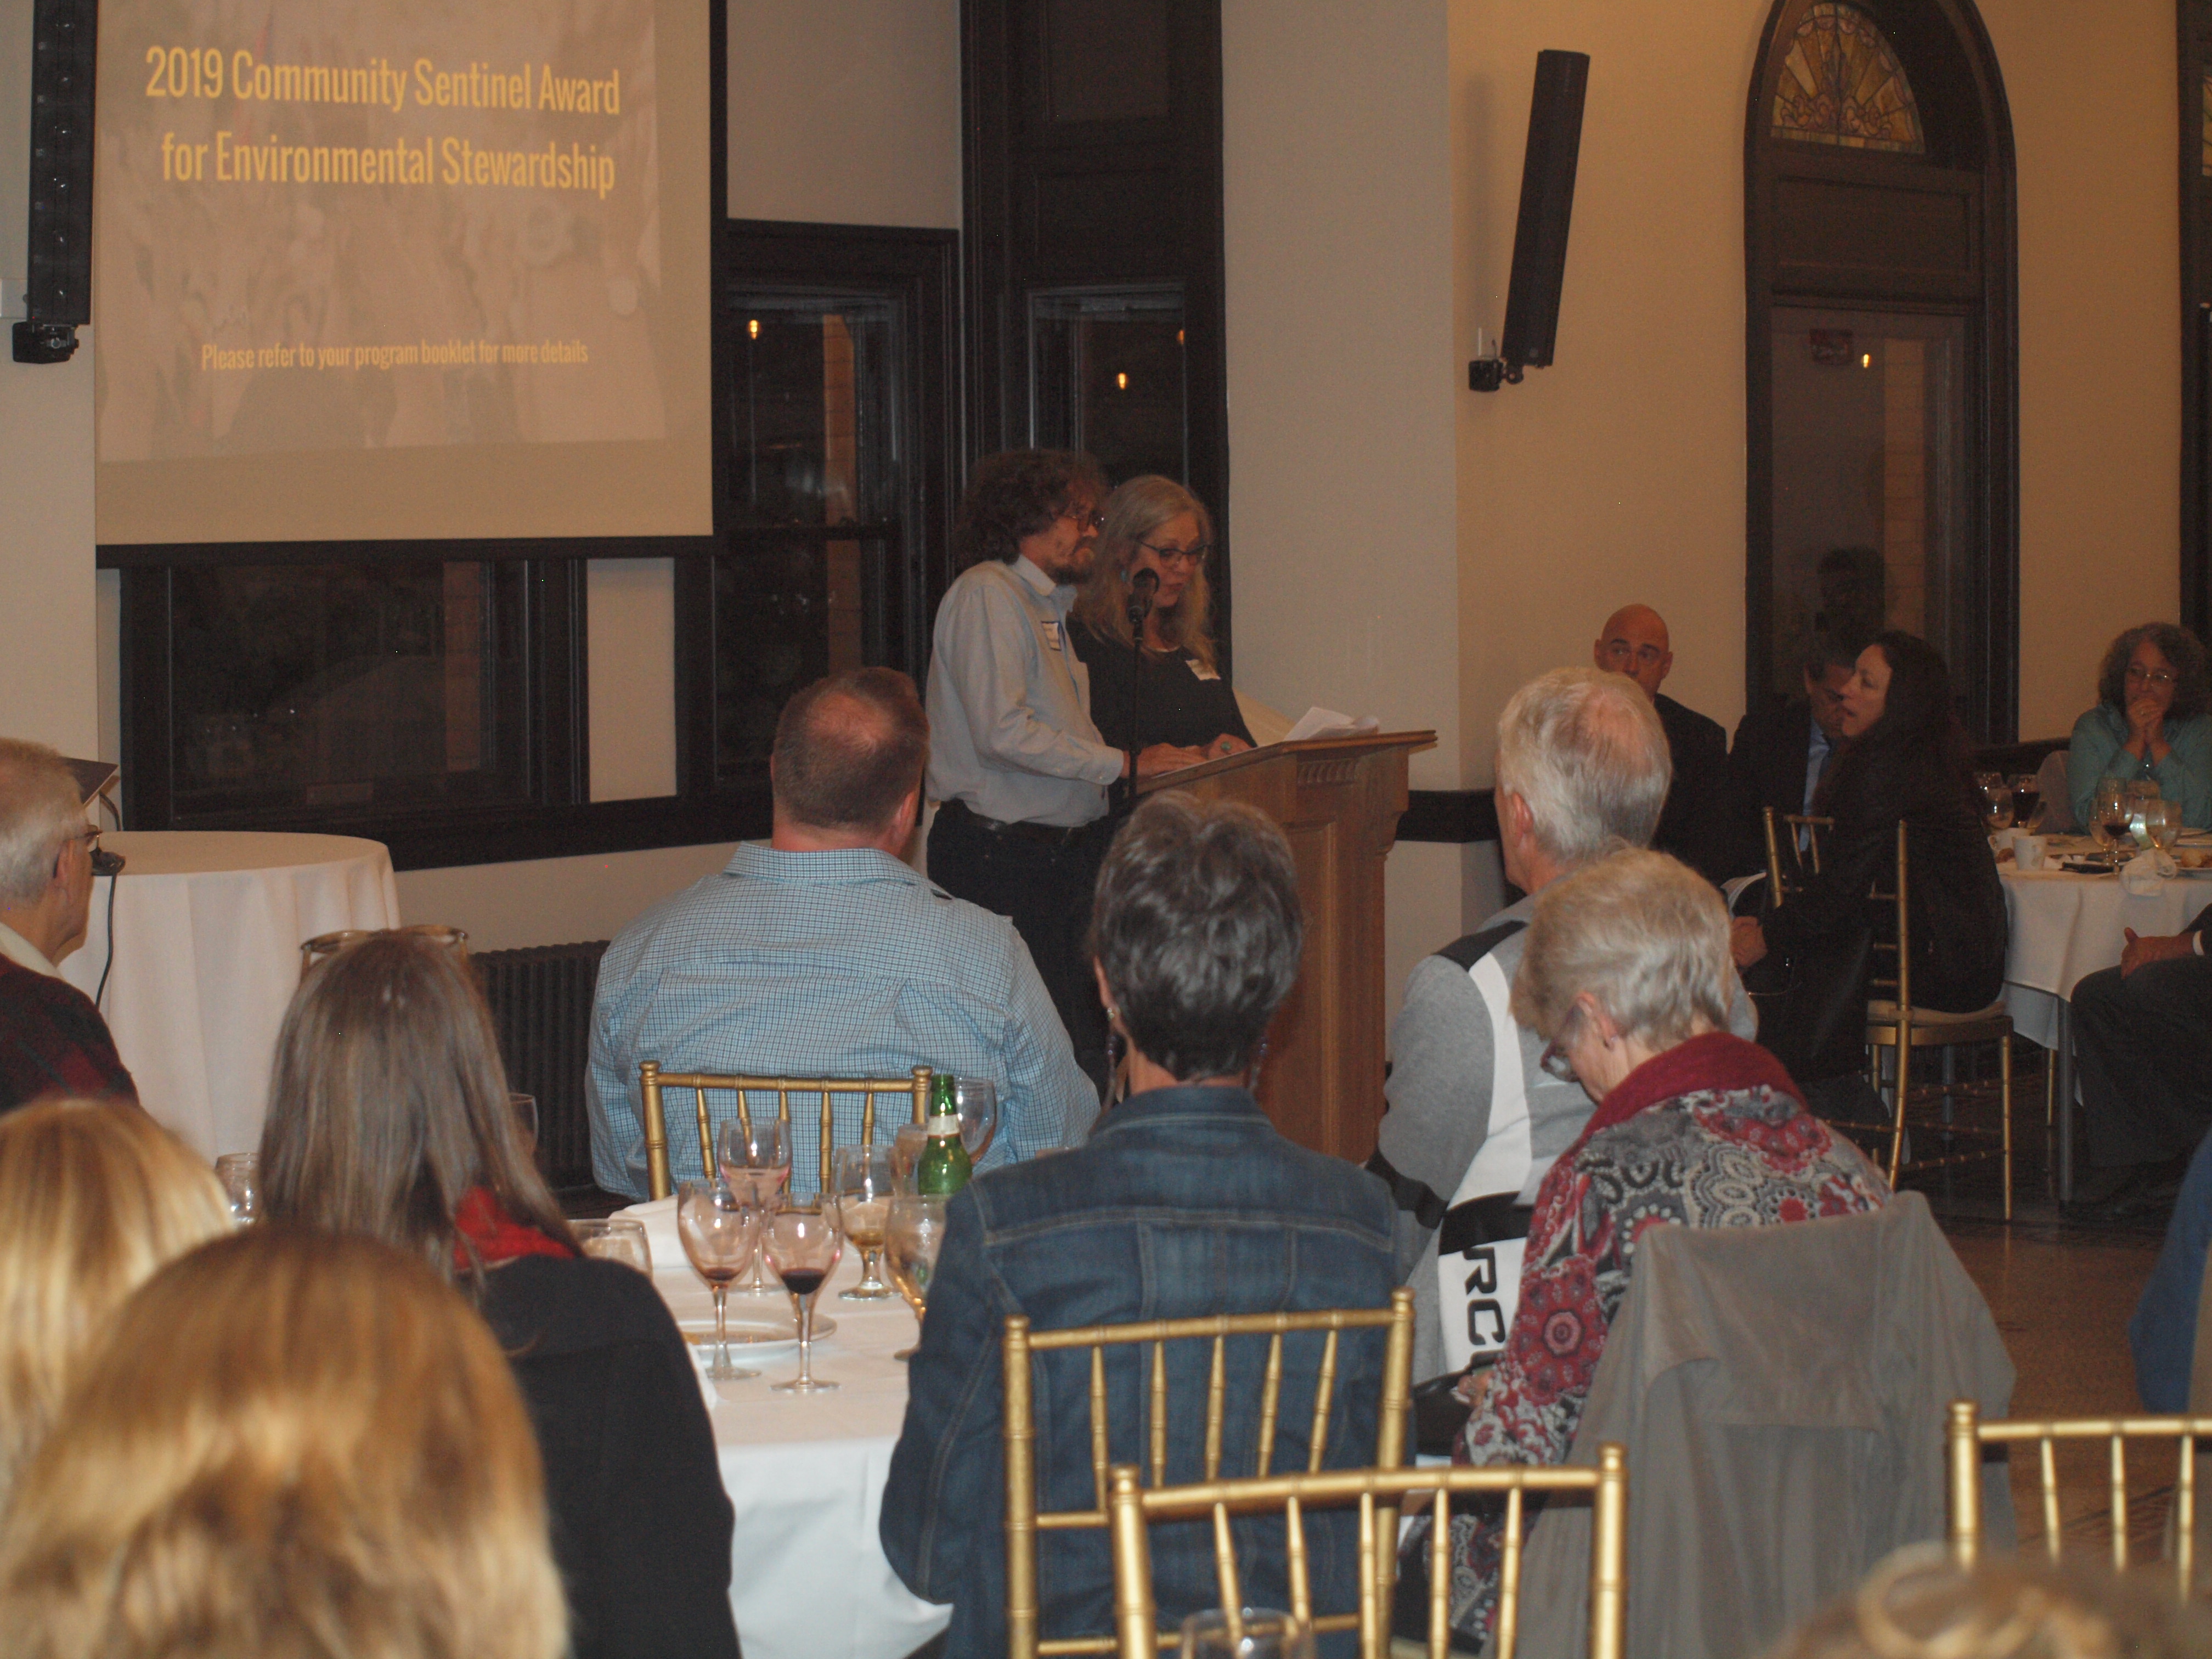
2019 Community Sentinel Award Reception
The Program on October 22nd
The 2019 reception and ceremony coincided with the oil and gas industry’s three-day Shale Insight Conference. The fighters and victims of dirty energy and petrochemical development were recognized as we opposed the nearby perpetrators of these harms. The event featured the keynote speaker Andrey Rudomakha, Director of Environmental Watch on North Caucasus, and inspirational emcee David Braun of Rootskeeper.
You can watch the full 2019 Awards Reception here:
More About the Awardees
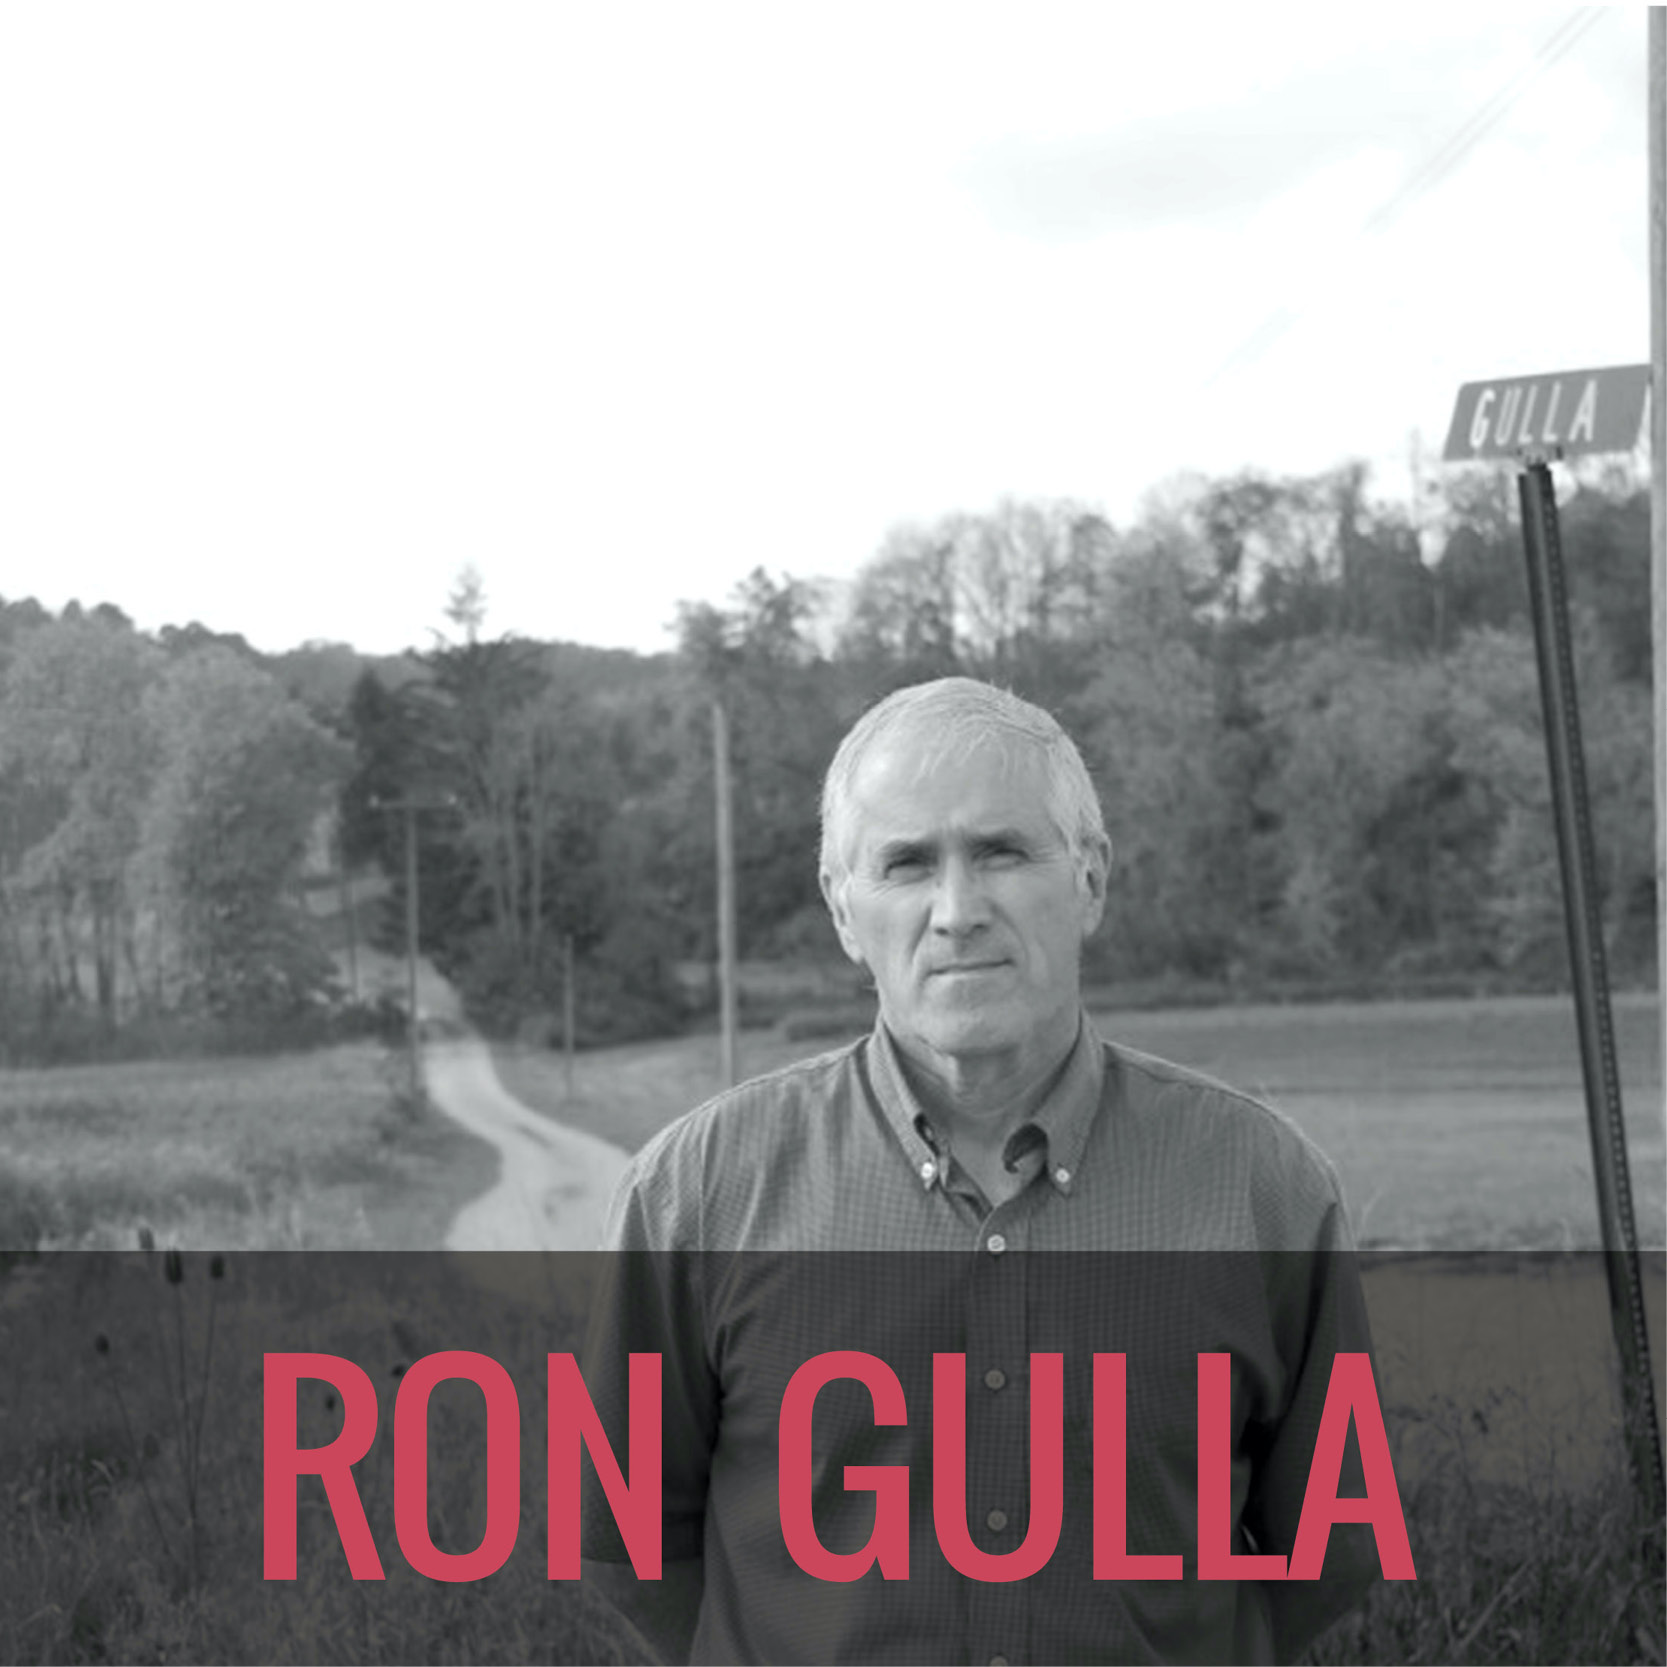
Ron Gulla
Mr. Ron Gulla has been a pivotal voice in fighting unconventional oil and gas development in Pennsylvania and beyond. After natural gas development destroyed his property in Canonsburg, PA in 2005, Mr. Gulla became an outspoken advocate for citizens and landowners facing the many harms of fracking.
Mr. Gulla knows the industry well, having worked as an equipment supplier for various oil and gas operations. Like so many, he believed the industry crusade that touted energy independence and its promise of becoming a “shalionaire.”
Four unconventional gas wells were installed on Mr. Gulla’s property from 2005 to 2008. As a result, his water source and soil were contaminated, as well as a nearby stream and pond. He immediately began speaking out about his experiences and warning people of the potential dangers of fracking. Soon, people from all over the state were reaching out to him to share their stories.
Mr. Gulla became a central figure in informing and connecting people who were desperately looking for help. He has documented individuals’ stories for health studies and appropriate regulatory agencies, testified in front of the PA Department of Health and other official bodies, and he was instrumental in organizing letter campaigns with other affected landowners addressed to local district attorneys. These efforts resulted in a statewide investigation into many of these cases. He also has coordinated with local, state, and national news agencies to expose these critical issues.
Mr. Gulla proactively engaged the media and brought like-minded people together to tell their stories. Without his relentless efforts, much of the progress made in exposing the oil and gas industry in Pennsylvania would not have been possible.
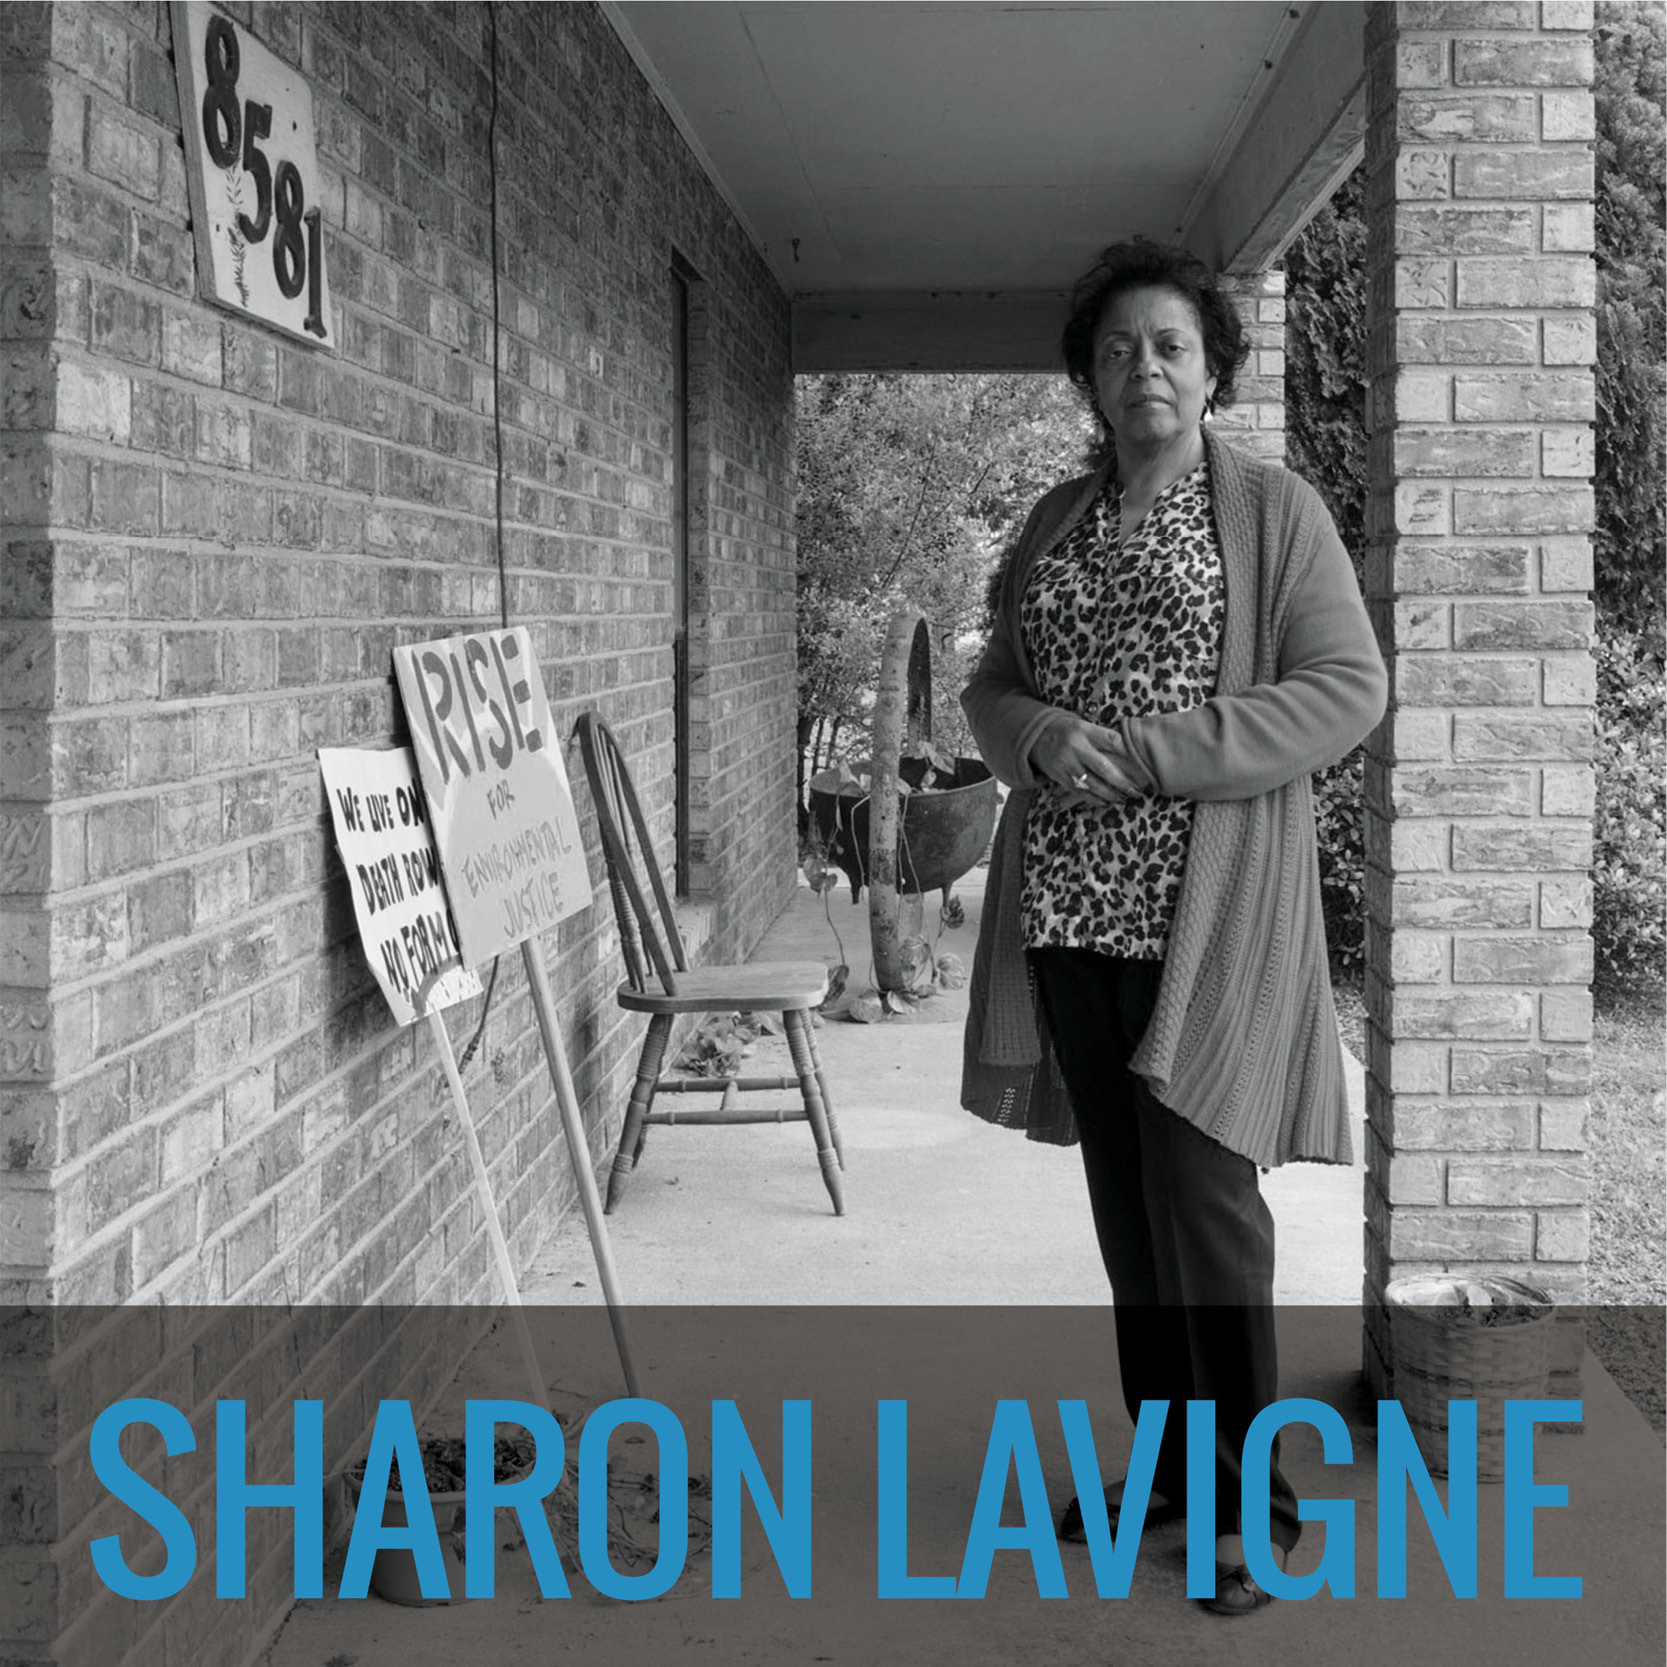
Sharon Lavigne
Ms. Sharon Lavigne lives in the epicenter of the oil, gas, and petrochemical facilities in Louisiana. She is the founder of RISE St. James, a faith-based environmental and social justice organization dedicated to protecting St. James Parish from these toxic, cancer- causing industries. Her work is a matter of life or death — the 20 acres of land that Ms. Lavigne inherited from her grandfather is dead center of what is known today as “Cancer Alley.”
The 4th and 5th Districts of St. James Parish are majority Black neighborhoods, and they were the only districts to be covertly rezoned from residential to “residential/future industrial.” The environmental racism could not be more pronounced. Ms. Lavigne is fighting to protect the health of all residents living along the 85-mile long Cancer Alley, from those in New Orleans to those in Baton Rouge. Industry and elected officials are intent on wiping historic Black communities off the map, but with Ms. Lavigne’s leadership, residents are rising up to protect their health, their home, and their future.
At the heart of Ms. Lavigne’s work with RISE St. James is the demand for a moratorium on oil, gas, and petrochemical industry in St. James Parish. The district where Sharon lives has 2,822 people and 12 petrochemical plants — one plant for every 235 residents. Despite these staggering ratios, Formosa Plastics is trying to build a 14-plant petrochemical complex less than two miles from Ms. Lavigne’s home.
After working tirelessly over the last year to educate and mobilize other residents, Ms. Lavigne and RISE St. James members recently celebrated their biggest victory yet: blocking a $1.5B Wanhua petrochemical plant from moving into St. James Parish and operating within a mile of residents’ homes. In Ms. Lavigne’s words, “This is our land, this is our home, and we are standing up together to defend it. St. James is rising.”
Allie Rosenbluth
Ms. Allie Rosenbluth is a dedicated community activist who has spent years coordinating a huge grassroots rural coalition opposing Pembina’s proposed Jordan Cove LNG export terminal and Pacific Connector fracked gas pipeline in southern Oregon. She also recently traveled to Poland as a COP 24 delegate with SustainUS, a youth-led justice and sustainability advocacy group.
For over a decade, the Jordan Cove LNG project has been threatening southern Oregonians with the prospect of a 36-inch pipeline stretching across four rural counties, 229 miles, and over 180 state waterways, ending in a massive methane liquefaction and export terminal in Coos Bay. Ms. Rosenbluth has worked incredibly hard to ensure that all those opposed to the project gets a chance to speak with their elected representatives about the project and make their voice heard in local, state, and federal permitting processes. She has coordinated efforts to generate tens of thousands of comments in state and federal agency comment periods to review the various environmental impacts of the project. This turnout has surpassed public participation records in such permitting processes.
Ms. Rosenbluth’s efforts helped lead to a May 2019 denial from the Oregon Department of Environmental Quality on a Clean Water Act permit needed to build the project, underlining the importance of state authority to defend water quality under Section 401 of the Clean Water Act, which the Trump Administration was simultaneously trying to weaken. She also helped mobilize over 3,000 rural Oregonians to attend four public hearings on the State Lands review of the project. Ms. Rosenbluth’s masterful coalition-building has helped unify people of all political persuasions, races, and ethnicities across the state to unify their opposition to fracked gas infrastructure in Oregon.
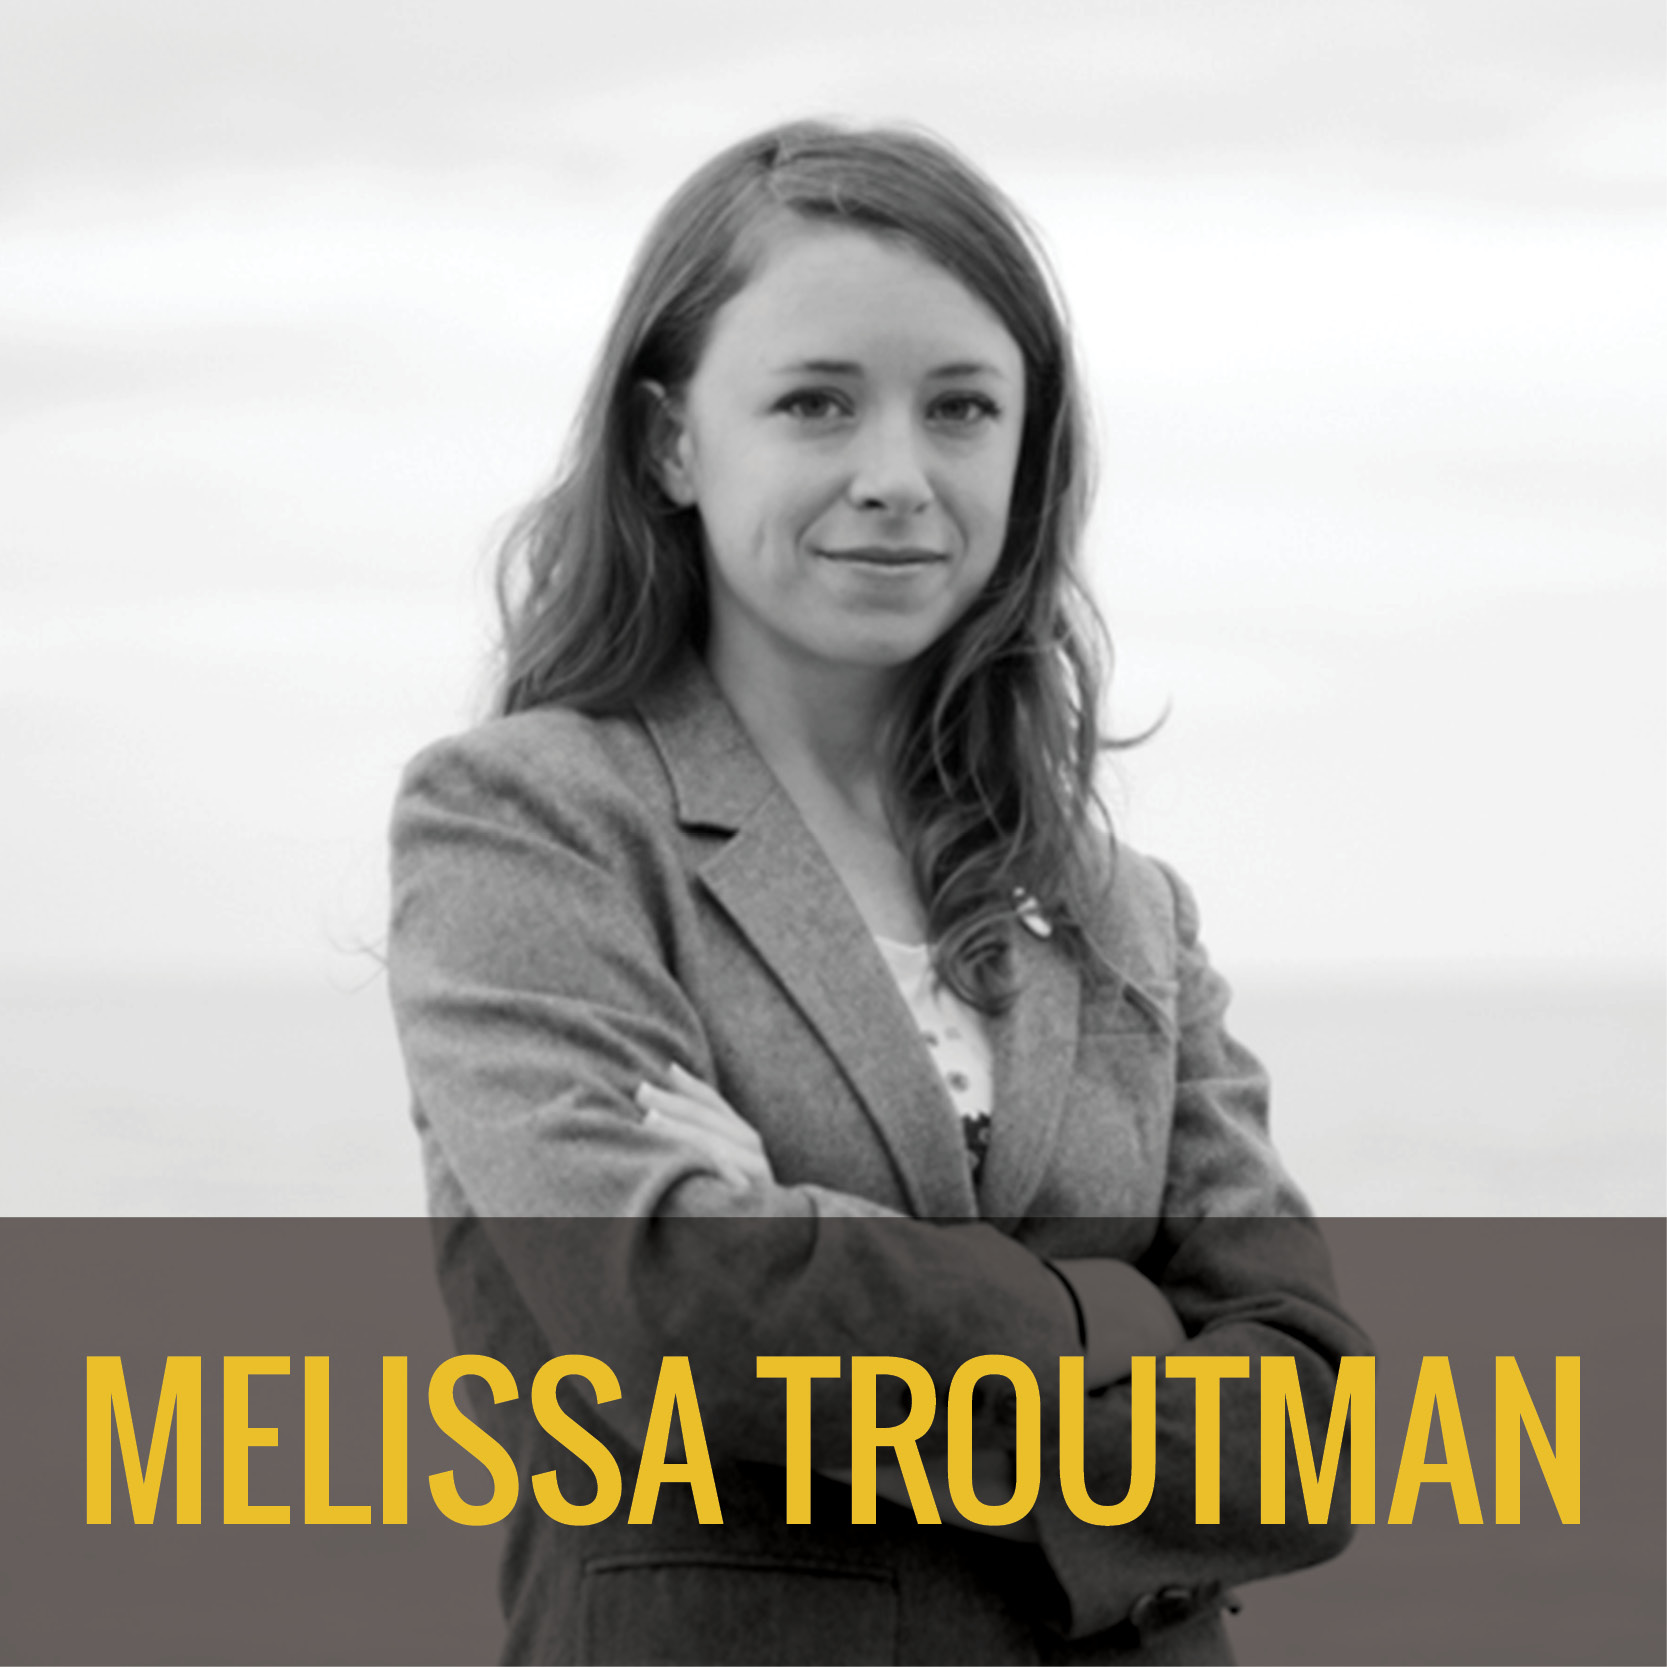
Melissa Troutman
Ms. Melissa Troutman is co-founder of the investigative news nonprofit Public Herald as well as a research and policy analyst for Earthworks. Her work as a film director and journalist has redefined the landscape and narrative around fracking w, and her community organizing has led to major wins against the industry.
Ms. Troutman’s Public Herald publications have seen widespread coverage. Her work has been referenced in the books Amity and Prosperity: One Family and the Fracturing of America by Eliza Griswald; Legal Rights for Rivers: Competition, Collaboration and Water Governance by Erin O’Donnell; and Sustainability and the Rights of Nature: An Introduction by Cameron La Follette and Chris Maser. Her work has been cited in over 20 academic studies to date. Furthermore, Ms. Troutman has produced three award-winning documentary films on fracking: Triple Divide (2013), TRIPLE DIVIDE [REDACTED] (2017), and INVISIBLE HAND (2019). Her films continue to play an important role in the narrative surrounding fracking and democracy.
In 2017, Ms. Troutman uncovered that 9,442 complaints related to oil and gas operations were never made public by the state. Her analysis of drinking water complaints revealed official misconduct by state officials that left families without clean water for months, even years. Consequently, Public Herald called for a criminal and civil investigation of the Pennsylvania Dept. of Environmental Protection. In 2018, Ms. Troutman’s reporting on an untested fracking wastewater treatment facility at the headwaters of the Allegheny River was used by the Seneca Nation of Indians to shut down the project.
Ms. Troutman’s tireless efforts are an inspiration to the environmental movement in Pennsylvania, across the country, and beyond.
Check out the Community Sentinels in action | Reception slideshow
On March 25, 2019, Bill Hughes of Wetzel County, West Virginia, passed away at age 74. Mr. Hughes, an environmental defender extraordinaire and former FracTracker colleague, served on the County solid waste authority, where he consistently pushed back on accepting the radioactive waste of the fracking industry. For nearly a decade, Mr. Hughes documented and disseminated photographic evidence of the activities and effects of shale gas development, and in turn educated thousands of people on the negative impacts of this industry. Mr. Hughes also shared information via gas field tours, PowerPoint presentations to groups in five states, op-ed pieces written for news media, and countless responses to questions and inquiries.
His legacy lives through the multitude of lives he enriched – from students, to activists, to everyday people. Bill was an omnipresent force for good, always armed with facts and a pervasive smile.
April Pierson-Keating
April Pierson-Keating of Buckhannon, West Virginia, passed away on September 28, 2019, at age 52. Mrs. Pierson-Keating was the founder and director of Mountain Lakes Preservation Alliance, and a founding member of Preserve Our Water Heritage and Rights (POWHR). She was a board member of the Buckhannon River Watershed Association, the cancer research group ICARE, and the WV Environmental Council, and she was also a member of the Sierra Club, the WV Highlands Conservancy, and Ohio Valley Environmental Coalition (OVEC). When one met Mrs. Pierson-Keating, one could not help noticing and absorbing her passion for environmental preservation.
Mrs. Pierson-Keating received the Buckhannon BEST Award on May 14, 2019 in recognition of her commitment. Mayor David McCauley stated: “Mrs. Keating is a supreme protector of our environment. She is a lobbyist for clean water at both our state and federal governments, a participant in Buckhannon’s Community Unity & Kindness Day, the Equality March, the Science March, and other awareness activities… April Keating has helped us all in our B-U community to be happier and healthier in many ways.”
Ricky Allen Roles
Ricky Allen Roles passed away at age 61 at his ranch in Silt, Colorado, on November 22, 2018. Mr. Roles was an adamant anti-fracking activist and spent many years fighting for safer oil and gas drilling and fracking regulations. He tirelessly fought to protect our earth’s sacred water and soil for the health and wellness of all living creatures. He is featured in books such as Fractivism and Collateral Damage, and documentaries including the Emmy Award winning film Split Estate and Oscar-nominated and Emmy-Award winning Gasland. He also bravely testified before Colorado’s Congress on the dangers of fracking.
Mr. Roles shared how his and his livestock’s health precipitously declined with the drilling of 19 wells on his property. He experienced respiratory, immune, and nervous system problems. Despite his health problems,
he strove to create awareness of the harmful impacts of fracking in his community and beyond. With those publications, his voice, beliefs and legacy will be heard forever.
John A. Trallo Sr.
John A. Trallo, Sr., 67, of Sonestown, Pennsylvania passed away on August 13, 2019. Mr. Trallo was a dedicated environmental activist who contributed to several groups working on pressing environmental issues such as hydraulic fracturing. He was a brilliant man who earned three college degrees and a teaching certificates in two states. He asked hard questions and was adamant in keeping government officials accountable. Some of the groups he was involved with were: Responsible Drilling Alliance (RDA), Shale Justice, The Community Environmental Legal Defense Fund (CELDF), PA Community Rights Network, and Organizations United for the Environment. Mr. Trallo left this planet a better place for future generations, and we honor his spirit by continuously working towards his noble vision.
Sponsors and Partners
The Sentinels’ program and reception requires financial support—for monetary awards, awardee travel, and many
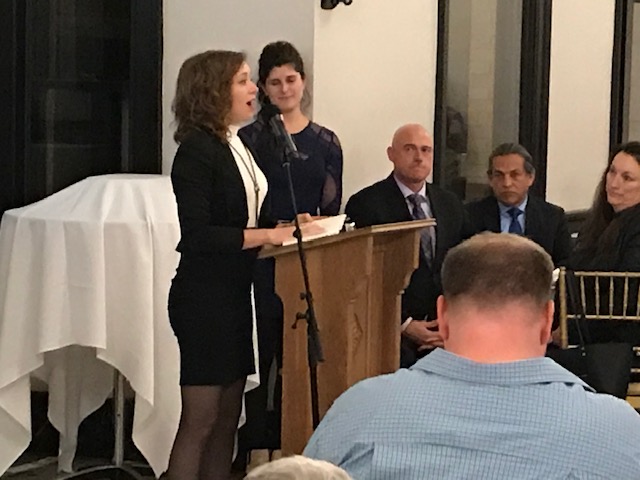
Michele Fetting of the Breathe Project and and FracTracker Board Member introducing 2019 Sentinel Award Winner Sharon Lavigne
other costs. As such, each year we call upon dedicated sponsors and partners for resources to enable this endeavor to continue. The daily, often-thankless jobs of Community Sentinels working to protecting our health and the environment deserve no less. Thank you to this year’s incredible award sponsors: The Heinz Endowments, 11th Hour Project, Center for Coalfield Justice, and Foundation for PA Watersheds.
We extend a big thank you to the following award partners: Viable Industries, Indigenous Environmental Network, Oxfam, Rootskeeper, Food & Water Watch, STAND.earth, Halt the Harm Network, Sierra Club, Ohio Valley Environmental Coalition, Choose Clean Water Coalition, Beaver County Marcellus Awareness Community, Mountain Watershed Association, Southwest Pennsylvania Environmental Health Project, Earthworks, and FracTracker Alliance.
Nominees
The following 18 people were nominated by their peers to receive this distinguished award:
Laurie Barr – Coudersport, PA
2019 Sentinel Award Winner Melissa Troutman with introducer Leanne Leiter of Earthworks
Kim Bonfardine – Elk County, PA
Kim Fraczek – New York, NY
Lisa Graves – Marcucci Washington, DC
Ron Gulla – Canonsburg, PA*
Leatra Harper – Bowling Green, OH
Maury Johnson – Greenville, WV
Theresa Landrum – Detroit, MI
Sharon Lavigne – St. James, Louisiana*
Sara Loflin – Erie, CO
Ann Pinca – Lebanon, PA
Randi Pokladnik – Uhrichsville, OH
Patricia Popple – Chippewa Falls, WI
Bev Reed – Bridgeport, OH
Allie Rosenbluth – Medford, OR*
Bob Schmetzer – South Heights, PA
Yvonne Taylor – Watkins Glen, NY
Melissa Troutman – Pittsburgh, PA*
* Denotes 2018 award recipient
Judges
Many thanks to the following judges for giving their time to review all of the nominations.
Mariah Davis – Choose Clean Water Coalition
Brenda Jo McManama – Indigenous Environmental Network
Kathleen Brophy – Oxfam
Dr. Pamela Calla – New York University
Matt Krogh – STAND.earth
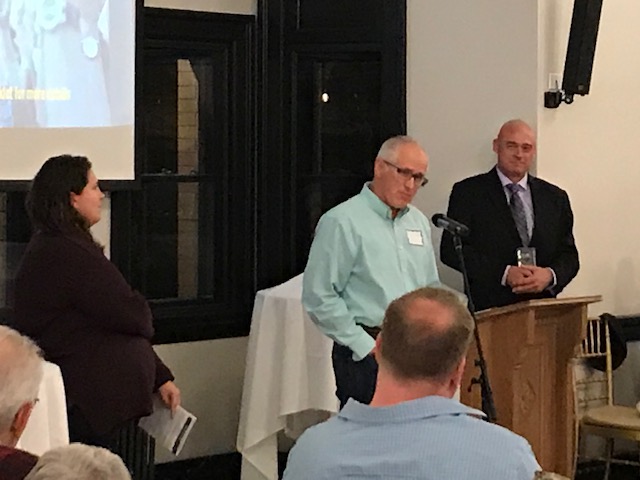
2019 Sentinel Award Winner Ron Gulla
Ethan Buckner of Earthworks introducing 2019 Sentinel Award Winner Sharon Lavigne
Keynote Speaker Andrey Rudomakha, Director of Environmental Watch on North Caucasus, with translator Kate Watters, Co-founder & Executive Director
https://www.fractracker.org/a5ej20sjfwe/wp-content/uploads/2019/10/2019-sentinel-winner-feature-2-scaled.jpg6671500FracTracker Alliancehttps://www.fractracker.org/a5ej20sjfwe/wp-content/uploads/2025/09/2025-Wordmark-Logo.pngFracTracker Alliance2019-10-29 11:26:172021-10-04 18:11:05A successful 2019 Community Sentinel Award Reception- a full summary
By Leann Leiter and Lisa Graves Marcucci Maps and data analysis by Kirk Jalbert
Highly industrialized operations like petrochemical plants inherently carry risks, including the possibility of large-scale disasters. In an effort to prepare, it is incumbent upon all stakeholders to fully understand the risk potential. Yet, the planned Shell ethane cracker and additional petrochemical operations being proposed for Western Pennsylvania are the first of their kind in our region. This means that residents and elected officials are without a frame of reference as they consider approving these operations. Officials find themselves tasked with reviewing and approving highly complicated permit applications, and the public remains uncertain of what questions to ask and scenarios to consider. Often overlooked in the decision-making process is valuable expertise from local first responders like police, fire and emergency crew members, HAZMAT teams, and those who protect vulnerable populations, like emergency room personnel, nursing home staff, and school officials.
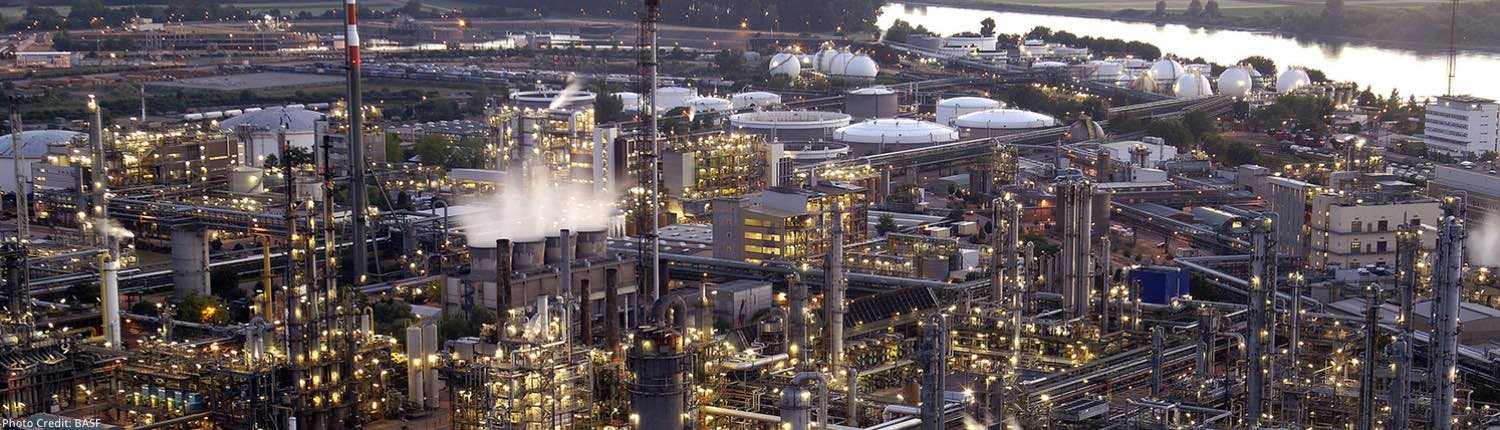
Example of cracker producing ethylene, located at BASF’s Ludwigshafen site. Photo credit: BASF
In the first article in this series , we tried to identify the known hazards associated with ethane crackers. In this article, we look more closely at how that risk could play out in Beaver County, PA and strive to initiate an important dialogue that invites valuable, local expertise.
In keeping with the first article in this series, we use the terms vulnerability and capacity. Vulnerability refers to the conditions and factors that increase the disaster impact that a community might experience, and capacity consists of the strengths that mitigate those impacts. Importantly, vulnerability and capacity frequently intertwine and overlap. We might, for example, consider a fire station to be a site of “capacity,” but if it lies within an Emergency Planning Zone (discussed more below), an explosion at the plant could render it a vulnerability. Likewise, “vulnerable” populations such as the elderly may have special skills and local knowledge, making them a source of capacity.
Emergency Planning: Learning from Louisiana
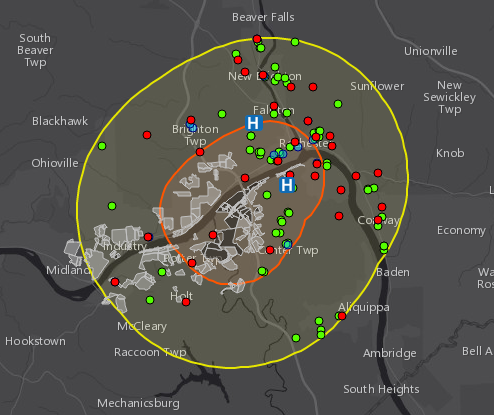
FracTracker got in touch with the Emergency Operations Center (EOC) in St. Charles Parish, Louisiana, to learn how a community already living with Shell-owned and other petrochemical facilities manages risk and disclosure. The Emergency Manager we spoke with explained that they designate a two- and a five-mile area around each new facility in their jurisdiction, like ethane crackers, during their emergency planning process. They call these areas “ emergency planning zones ” or EPZs, and they maintain records of the vulnerabilities and sites of capacity within each zone. In case of a fire, explosion, or other unplanned event at any facility, having the EPZs designated in advance allows them to mobilize first responders, and notify and evacuate everyone living, working, and attending school within the zone. Whether they activate a two- or a five-mile EPZ depends on the type of incident, and factors like wind speed and direction.
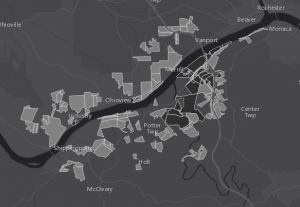
Based on those procedures, the map below shows similar likely zones for the proposed plant in Beaver County, along with sites of vulnerability and capacity.
The map helps us visualize the vulnerability and capacity of this area, relative to the proposed ethane cracker. It includes three main elements: the Shell site and parcels likely to be targeted for buildout of related facilities, two Emergency Planning Zones (EPZs) around the Shell facility, and infrastructure and facilities of the area that represent vulnerability and capacity.
Vacant parcels near the site
It is important to note that the proposed ethane cracker in Beaver County is merely the first of an influx of petrochemical spin-off facilities promised for the area, potentially occupying the various empty parcels indicated on the map above as “vacant properties” and presented in light gray in the screenshot left.
Each new facility would add its own risks and cumulative impacts to the equation. It would be impossible to project these additional risks without knowing what facilities will be built here, so in this article, we stick to what we do know – the risks already articulated by Shell, lessons learned from other communities hosting petrochemical industry in other parts of the country, and past disasters at similar facilities.
Vulnerability and Capacity in Beaver County
Red, blue, and green points on the map above and in the screenshot below stand in for hospitals like Heritage Valley Beaver; fire and emergency medical services like Vanport Volunteer Fire Company; police stations like the Beaver County Sheriff’s office; and daycares and schools like Center Grange Primary School.
Transportation routes, if impacted, could challenge evacuation. Potter Township Fire Chief Vicki Carlton pointed out that evacuations due to an event at this facility could also be complicated by the need to stay upwind, when evacuations would likely move in a downwind direction. This map lacks drinking water intakes and other essential features upon which lives depend, but which nonetheless also sit within this zone of vulnerability.
Points within EPZS
Vulnerability/capacity within 2-mile zone:
1 hospital
5 police stations
10 fire/EMS stations
23 schools/daycare facilities
47,717 residents*
When expanded to 5-mile zone:
2 hospitals
9 police stations
23 fire/EMS stations
40 schools/daycare facilities
120,849 residents*
*Note: For census tracts that are partly within a zone, a ratio is determined based on the percentage of land area in the tract within the zone. This ratio is then used to estimate the fraction of the population likely within the zone.
Stakeholders’ Right to Know
No person or community should be subjected to risk without the opportunity to be fully informed and to give meaningful input. Likewise, no group of people should have to bear a disproportionate share of environmental risks, particularly stakeholders who are already frequently disenfranchised in environmental decision-making. “Environmental justice” (EJ) refers to those simple principles, and DEP designates environmental justice areas based on communities of color and poverty indicators.
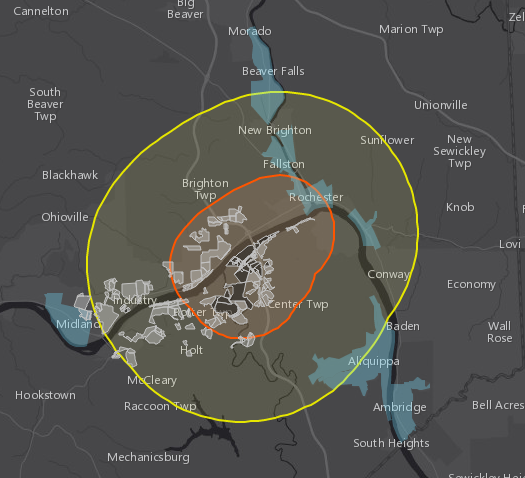
Presented as blue fields on the map and shown in the screenshot below, several state-designated EJ areas fall partially or entirely within the 2- and 5-mile EPZs (a portion of two EJ areas home to 2,851 people, and when expanded to five miles, two entire EJ areas and a portion of seven more, home to 18,679 people, respectively).
EJ Areas and Emergency Planning Zones around the Site
The basic ideas behind environmental justice have major bearing in emergency scenarios. For example, those living below the poverty line tend to have less access to information and news sources, meaning they might not learn of dangerous unexpected emissions plumes coming their way. They also may not have access to a personal vehicle, rendering them dependent upon a functioning public transportation system to evacuate in an emergency. Living below poverty level may also mean fewer resources at home for sheltering-in-place during a disaster, and having less financial resources, like personal savings, may lead to more difficult post-disaster recovery.
Local expertise
FracTracker recently consulted with the Emergency Management Director for Beaver County, Eric Brewer, and with Potter Township Fire Chief Vicki Carlton. Both indicated that their staff have already begun training exercises with Shell -including a live drill on site that simulated a fire in a work trailer. But when asked, neither reported that they had been consulted in the permit approval process. Neither had been informed of the chemicals to be held on site, and both referred to emergency planning considerations as something to come in the future, after the plant was built.
Unfortunately, the lack of input from public safety professionals during the permit approval stage isn’t unique to Beaver County. Our emergency management contact in Louisiana pointed to the same disturbing reality: Those who best understand the disaster implications of these dangerous developments and who would be mobilized to respond in the case of a disaster are not given a say in their approval or denial. This valuable local expertise – in Louisiana and in Beaver County – is being overlooked.
All Beaver County first responders who spoke with FracTracker clearly showed their willingness to perform their duties in any way that Shell’s new facility might demand, hopefulness about its safety, and a generally positive relationship with the company so far. Chief Carlton believes that the ethane cracker will be an improvement over the previous facility on the same site, the Horsehead zinc smelter, though a regional air pollution report characterizes this as a trade off of one type of dangerous pollution for another. Director Brewer pointed to the existing emergency plans for the county’s nuclear facility as giving Beaver County an important leg-up on preparedness.
But the conversations also raised concern about what the future relationship between the community and the industry will look like. Will funds be allocated to these first responders for the additional burdens brought on by new, unprecedented facilities, in what amount, and for how long into the future? Chief Carlton pointed out that until Shell’s on-site fire brigade is in place two or three years from now, her all-volunteer department would be the first line of defense in case of a fire or other incident. In the meantime, her fire company has ordered a much-needed equipment upgrade to replace a 30-year old, outdated tanker at a cost of $400,000. They are formally requesting all corporate businesses in the township, including Shell, to share the cost. Hopefully, the fire company will see this cost covered by their corporate neighbors who use their services. But further down the road? Once all is said and done, and Shell has what they need to operate unfettered, Chief Carlton wonders, “where do we stand with them?”
Waiting for disclosure of the risks
Emergency preparedness and planning should be a process characterized by transparency and inclusion of all stakeholders. However, when it comes to the Shell ethane cracker, those who will share a fence line with such operations have not yet been granted access to the full picture. Currently, the DEP allows industrial operations like the proposed ethane cracker to wait until immediately before operations begin to disclose emergency planning information, in the form of Preparedness, Prevention, and Contingency (PPC) plans. In other words, when permits are up for approval or denial prior to construction, permit applicants are not currently required to provide PPC plans, and the public and emergency managers cannot weigh the risks or provide crucial input.
Shell’s Acknowledged Risks According to public informationprovided by Shell
Sampling of Shell’s Disastrous
Petrochemical Precedents
According to Shell, possible risks of the proposed Beaver County petrochemical facility include fire, explosion, leaks, and equipment failures. More than mere potentialities, examples of each are already on the books. The above table presents a sampling. Shell also points out the increased risk of traffic accidents, not explored in this chart. It is worth noting, however, that the proposed facility, and likely spin-off facilities, would greatly increase vehicular and rail traffic.
The ethane cracker in Beaver County plant has not yet been constructed. However, Shell operates similar operations with documented risks and their own histories of emergency events. Going forward, the various governmental agencies tasked with reviewing permit applications should require industrial operations like Shell, to make this information public as part of the review and planning process. Currently they can relegate safety information to a few vague references and get a free pass to mark it as “confidential” in permit applications. Strengthening risk disclosure requirements would be a logical and basic step toward ensuring that all stakeholders – including those with special emergency planning expertise – can have input on whether those risks are acceptable before permits are approved and site prep begins.
Until regulations are tightened, we invite Shell to fulfill its own stated objective of being a “good neighbor” by being forthcoming about what risks will be moving in next door. Shell can and should take the initiative to share information about its existing facilities, as well as lessons learned from past emergencies at those sites. Instead of waiting for the post-construction, or the “implementation” stage, all stakeholders deserve disclosure of Shell’s plans to prevent and respond to emergencies now.
In our next article, we will explore the infrastructure for the proposed Shell facility, which spans multiple states, and sort out the piecemeal approval processes of building an ethane cracker in Pennsylvania.
Sincere Appreciation
Emergency Managers and First Responders in St. Charles Parish, Louisiana and Potter Township and Center Township, PA.
Lisa Hallowell, Senior Attorney at the Environmental Integrity Project, for her review of this article series and contributions to our understanding of relevant regulations.
Kirk Jalbert, in addition to maps and analysis, for contributing key points of consideration for and expertise on environmental justice.
The International League of Conservation Photographers for sharing the feature image used in this article.
The image used on our homepage of the steam cracker at BASF’s Ludwigshafen site was taken by BASF.
By Leann Leiter, Environmental Health Fellow for FracTracker Alliance and the Southwest PA Environmental Health Project and Lisa Graves Marcucci, PA Coordinator, Community Outreach of Environmental Integrity Project
With maps and analysis by Kirk Jalbert, Manager of Community-Based Research & Engagement, FracTracker Alliance
https://www.fractracker.org/a5ej20sjfwe/wp-content/uploads/2017/05/Cracker-2-Feature-iLCP.jpg400900FracTracker Alliancehttps://www.fractracker.org/a5ej20sjfwe/wp-content/uploads/2025/09/2025-Wordmark-Logo.pngFracTracker Alliance2017-05-03 13:56:332021-04-15 15:03:08Understanding in Order to Prepare: Ethane Cracker Risk and Disclosure
The 30-inch Bayou Bridge Pipeline began operations in April of 2016, with a short leg of pipeline that ran from Nederland, Texas to refineries in Lake Charles, Louisiana. But this 60-mile long pipeline, operated by Sunoco Logistics Partners, was just the first step in a much lengthier, and more controversial, 24-inch diameter pipeline project (jointly owned by Sunoco Logistics Partners, as well as Phillips 66 Partners and Energy Transfer Partners). Nonetheless, Bayou Bridge Pipeline, LLC argues that transport of crude oil by pipeline rather than by tanker or train, is the safest transportation option, as they continue to advocate and justify more pipeline construction in the name of “energy independence.” They compare its necessity to that of FedEx, a mere “delivery system”—one that would carry 280,000 barrels of light or heavy crude across the Acadiana terrain. The company building the pipeline, in fact, distances itself from problems that could result after oil starts flowing:
The pipeline is merely a delivery system, similar to FedEx, to help fill a need that already exists to ship the crude to refiners and market. We do not own the crude in the pipeline,” Alexis Daniel, of Granado Communications Group, a public relations firm in Dallas, wrote in an email response to questions posed to Energy Transfer Partners. Source
Developers hope that second phase of the proposed Bayou Bridge Pipeline will be put into operation during the second half of 2017. It would run 162 miles from Lake Charles, LA to refineries in St James, LA. It would cross the 11 Louisiana parishes and over 700 acres of fragile wetlands, and watersheds that supply drinking water for up to 300,000 people. Pump stations are planned for Jefferson Davis and St. Martin parishes. St. James is located on the western bank of the Mississippi River, about 50 miles upstream of New Orleans. In addition, the proposed pipeline crosses the state-designated Coastal Zone Boundary, an area targeted by Louisiana for special consideration relating to ecological and cultural sustainability.
Zoom in closer to the area around the Bayou Bridge Pipeline, and the National Wetlands Inventory data should appear. Use the “Bookmarks” tab to zoom in close to the refinery sites, and also to zoom back out to the full extent of the proposed Bayou Bridge Pipeline.
What’s the connection to the DAPL?
The 2010 BP Gulf oil spill resulted in $18 billion in settlements and penalties. With protests in the news about the impacts the Dakota Access Pipeline (DAPL) could pose to drinking water for the Standing Rock Sioux Reservation should another oil spill occur along the Missouri River, it’s no surprise that environmentalists are also calling for an environmental impact statement about the proposed extension of the Bayou Bridge Pipeline.
Acadiana is already criss-crossed by a dense network of pipelines leading to Gulf Coast refineries. Nonetheless, the process of building the proposed Bayou Bridge pipeline, the Atchafalaya Basin, a major watershed of the Gulf of Mexico, will see additional and significant impacts. Even if the construction process happens without a hitch, 77 acres of wetlands would be permanently affected, and 177 acres would be temporarily affected, along with the wildlife and aquatic species that live there. Within a 5-mile buffer area of the pipeline, National Wetlands Inventory has mapped over 600 square miles of forested wetlands, nearly 300 square miles of estuarine wetlands, and 63 square miles of freshwater emergent wetlands. Essential ecosystem services that the wetlands provide, absorbing floodwaters, could be compromised, leading to increased erosion and sedimentation downstream. Impacts to these wetlands could be greatly magnified into the already environmentally stressed Gulf.
The connection between DAPL and Bayou Bridge is both figurative and literal. Like most new pipelines, concerns about spills loom large in the minds of many. A new pipeline represents more money that is not being directed toward clean energy alternatives.
Energy Transfer Partners, the same company building DAPL, is also building the Bayou Bridge, which the final leg of the Dakota Access Pipeline, 1300 miles to the north. The two pipelines would be connected by a 700+-mile-long stretch of Energy Transfer Partner’s 30-inch Trunkline. This pipeline, which has been a gas transmission line, was proposed in 2012 for conversion from gas to crude transport. The project was cancelled in 2014, and reworked to use 678 miles of the original Trunkline, and also add 66 miles of new pipeline. When it is online, the flow direction of the Trunkline pipeline would reversed to accommodate the south-flowing crude.
Other unanticipated impacts
Interestingly, if crude oil transport to Gulf Coast refineries is diverted to pipelines rather than traditional rail or barge transport, some industry analysts predict that transportation using those modes of conveyance will shift more to the Atlantic and Pacific coasts.
A chance for public input
Environmental groups, including a coalition the comprises the Sierra Club, the Gulf Restoration Network, and the Louisiana Bucket Brigade, the Atchafalaya Basinkeeper, as well as concerned citizens, and landowners (some of whom already have multiple pipelines crossing their properties) are making their resistance to the pipeline heard, loud and clear about the need for a full environmental impact statement that will address the cumulative and indirect impacts of the project.
Note
In response to public outcry, the Louisiana Department of Environmental Quality has agreed to hold a public hearing about the Bayou Bridge Pipeline extension. The meeting will take place at 6 p.m. on January 12 in the Oliver Pollock Room of the Galvez Building, 602 North 5th St. in Baton Rouge.
Update, 6 February 2017. Here’s an article that features information about the January 12 public meeting, which was packed to capacity.
By Karen Edelstein, Eastern Program Coordinator, FracTracker Alliance
https://www.fractracker.org/a5ej20sjfwe/wp-content/uploads/2017/01/Louisiana-Bayou-Pipeline-Feature.jpg400900Karen Edelsteinhttps://www.fractracker.org/a5ej20sjfwe/wp-content/uploads/2025/09/2025-Wordmark-Logo.pngKaren Edelstein2017-01-03 16:20:392023-05-12 10:47:38Pipeline Under Debate in Louisiana Bayou
On September 9, 2016 a pipeline leak was detected from the Colonial Pipeline by a mine inspector in Shelby County, Alabama. It is estimated to have spilled ~336,000 gallons of gasoline, resulting in the shutdown of a major part of America’s gasoline distribution system. As such, we thought it timely to provide some data and a map on the Colonial Pipeline Project.
Figure 1. Dynamic map of Colonial Pipeline route and related infrastructure
The Colonial Pipeline was built in 1963, with some segments dating back to at least 1954. Colonial carries gasoline and other refined petroleum projects throughout the South and Eastern U.S. – originating at Houston, Texas and terminating at the Port of New York and New Jersey. This ~5,000-mile pipeline travels through 12 states and the Gulf of Mexico at one point. According to available data, prior to the September 2016 incident for which the cause is still not known, roughly 113,382 gallons had been released from the Colonial Pipeline in 125 separate incidents since 2010 (Table 1).
Table 1. Reported Colonial Pipeline incident impacts by state, between 3/24/10 and 7/25/16
State
Incidents (#)
Barrels* Released
Total Cost ($)
AL
10
91.49
2,718,683
GA
11
132.38
1,283,406
LA
23
86.05
1,002,379
MD
6
4.43
27,862
MS
6
27.36
299,738
NC
15
382.76
3,453,298
NJ
7
7.81
255,124
NY
2
27.71
88,426
PA
1
0.88
28,075
SC
9
1639.26
4,779,536
TN
2
90.2
1,326,300
TX
19
74.34
1,398,513
VA
14
134.89
15,153,471
Total**
125
2699.56
31,814,811
*1 Barrel = 42 U.S. Gallons
** The total amount of petroleum products spilled from the Colonial Pipeline in this time frame equates to roughly 113,382 gallons. This figure does not include the September 2016 spill of ~336,000 gallons.
Unfortunately, the Colonial Pipeline has also been the source of South Carolina’s largest pipeline spill. The incident occurred in 1996 near Fork Shoals, South Carolina and spilled nearly 1 million gallons of fuel into the Reedy River. The September 2016 spill has not reached any major waterways or protected ecological areas, to-date.
Additional Details
Owners of the pipeline include Koch Industries, South Korea’s National Pension Service and Kohlberg Kravis Roberts, Caisse de dépôt et placement du Québec, Royal Dutch Shell, and Industry Funds Management.
For more details about the Colonial Pipeline, see Table 2.
Table 2. Specifications of the Colonial and/or Intercontinental pipeline
https://www.fractracker.org/a5ej20sjfwe/wp-content/uploads/2016/09/ColonialPipeline-Feature.jpg400900FracTracker Alliancehttps://www.fractracker.org/a5ej20sjfwe/wp-content/uploads/2025/09/2025-Wordmark-Logo.pngFracTracker Alliance2016-09-26 13:35:032021-04-15 15:04:25A Proper Picture of the Colonial Pipeline’s Past
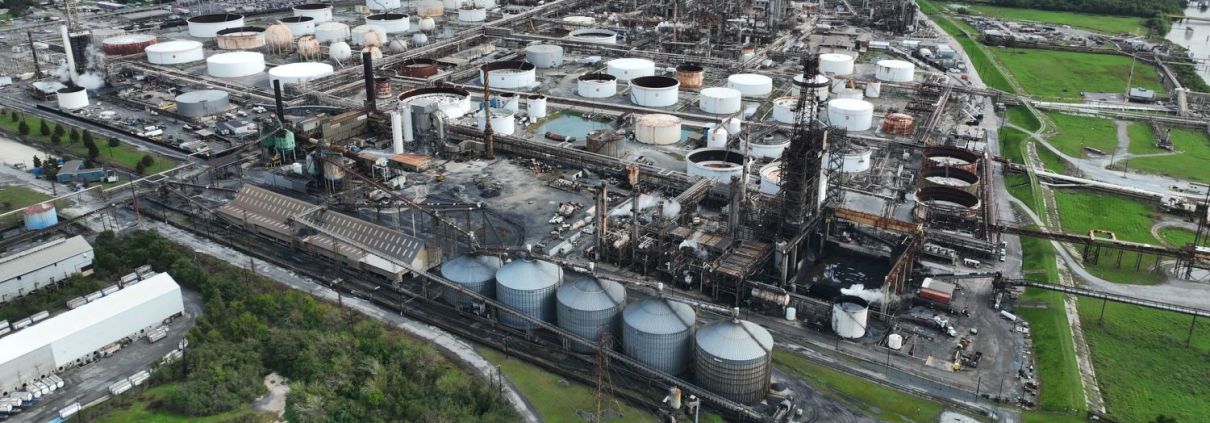 Ted Auch, FracTracker Alliance, 2024.