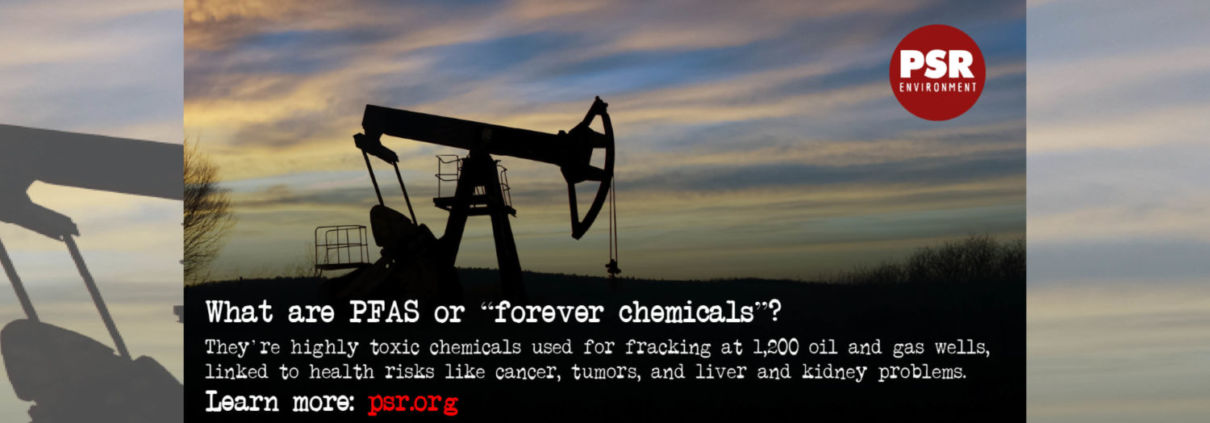
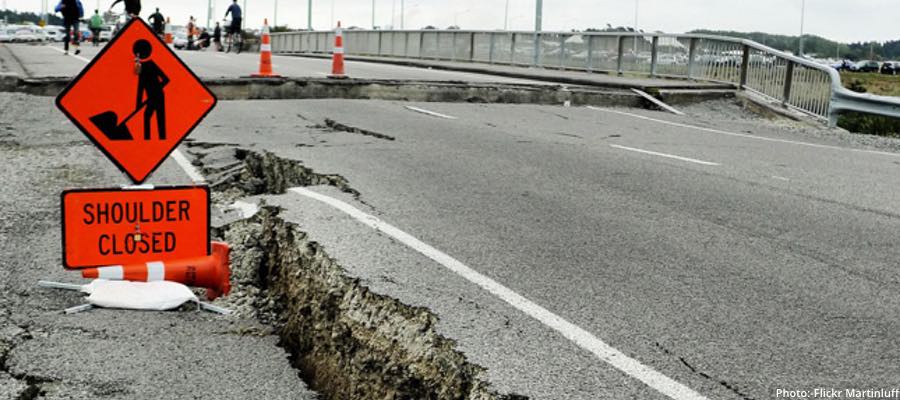
FracTracker Alliance released a new map identifying the locations of over 1,200 oil and gas wells using toxic “forever chemicals” in Arkansas, Louisiana, Oklahoma, New Mexico, Texas, and Wyoming.
By Ted Auch, PhD, Great Lakes Program Coordinator and Shannon Smith, Manager of Communications & Development
The oil and gas industry continues to use rhetoric focusing on national security and energy independence in order to advocate for legislation to criminalize climate activists. Backlash against protestors and environmental stewards has only increased since the onset of COVID-19, suggesting that industry proponents are exploiting this public health crisis to further their own dangerous and controversial policies.[1]
Industry actors contributing to the wave of anti-protest bills include American Petroleum Institute (API), IHS Markit, The American Fuel & Petrochemical Manufacturers (AFPM), and most effectively, the American Legislative Exchange Council (ALEC), by way of its primary financial backer, Koch Industries (Fang, 2014, Shelor, 2017).
ALEC is the source of the model legislation “Critical Infrastructure Protection Act” of 2017, intended to make it a felony to “impede,” “inhibit,” “impair,” or “interrupt” critical infrastructure operation and/or construction. Close approximations – if not exact replicas – of this legislative template have been passed in 11 hydrocarbon rich and/or pathway states, and 8 more are being debated in 4 additional states.
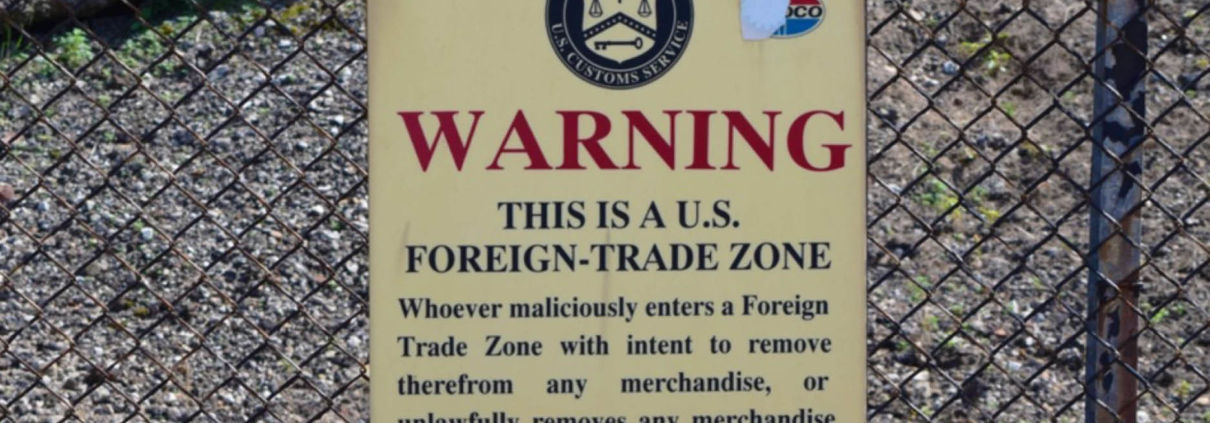
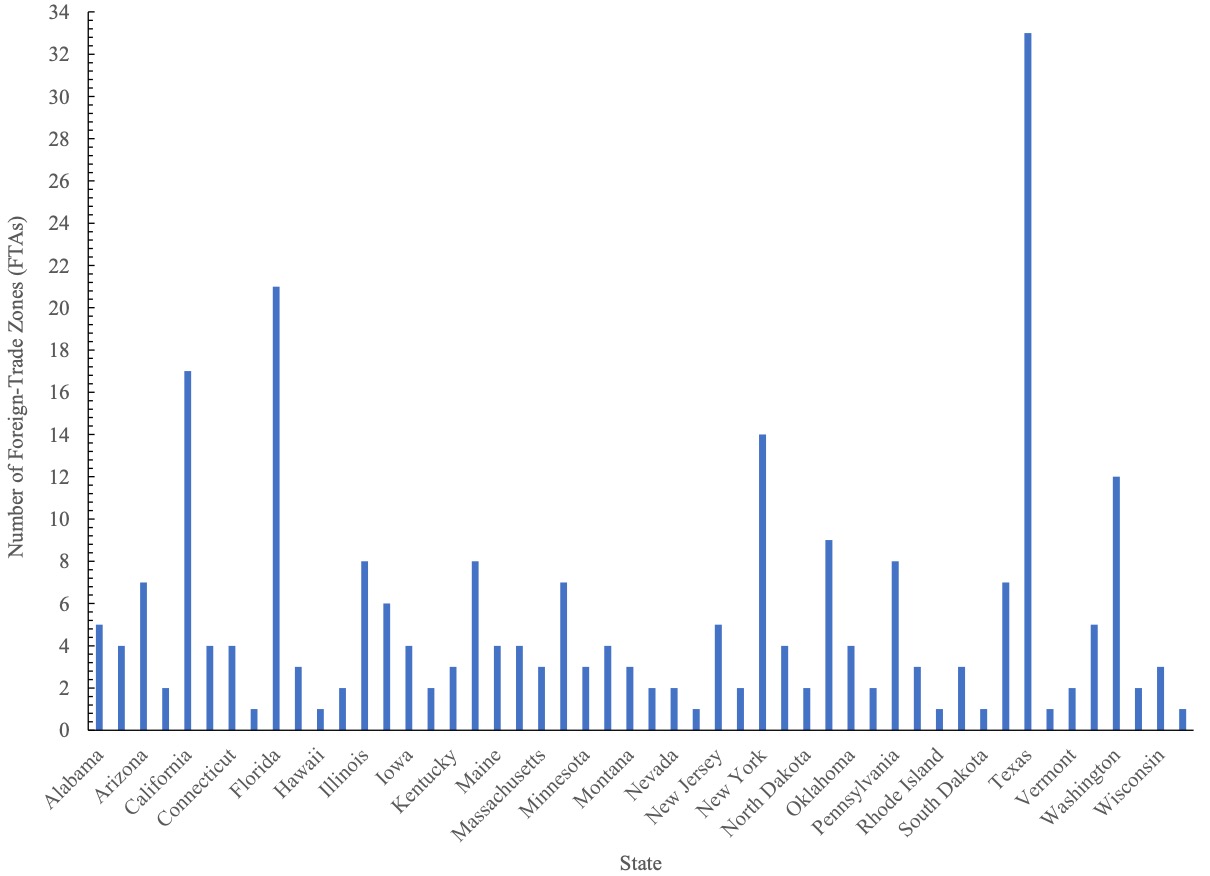
The “critical infrastructure” designation in ALEC’s “Critical Infrastructure Protection Act” is extremely broad, including over 70 pieces of infrastructure, from wastewater treatment and well pads, to ports and pipelines. However, along with the 259 Foreign Trade Zones (FTZ) (Figures 1 and 4) supervised by US Customs and Border Protection (CBP), security is of such importance because over 50% of this infrastructure is related to oil and gas. According to our analysis, there are more than 8,000 unique pieces of infrastructure that fall under this designation, with over 10% in the Marcellus/Utica states of Ohio, West Virginia, and Pennsylvania. See Figure 1 for the number of FTZ per state.
Regarding FTZ, the US Department of Homeland Security doesn’t attempt to hide their genuine nature, boldly proclaiming them “… the United States’ version of what are known internationally as free-trade zones … to serve adequately ‘the public interest’.” If there remains any confusion as to who these zones are geared toward, the US Department of Commerce’s International Administration (ITA) makes the link between FTZ and the fossil fuel industry explicit in its FTZ FAQ page, stating “The largest industry currently using zone procedures is the petroleum refining industry.” (Figure 2)
Figure 1. Number of Foreign-Trade Zones (FTZ) by state as of June 2020.
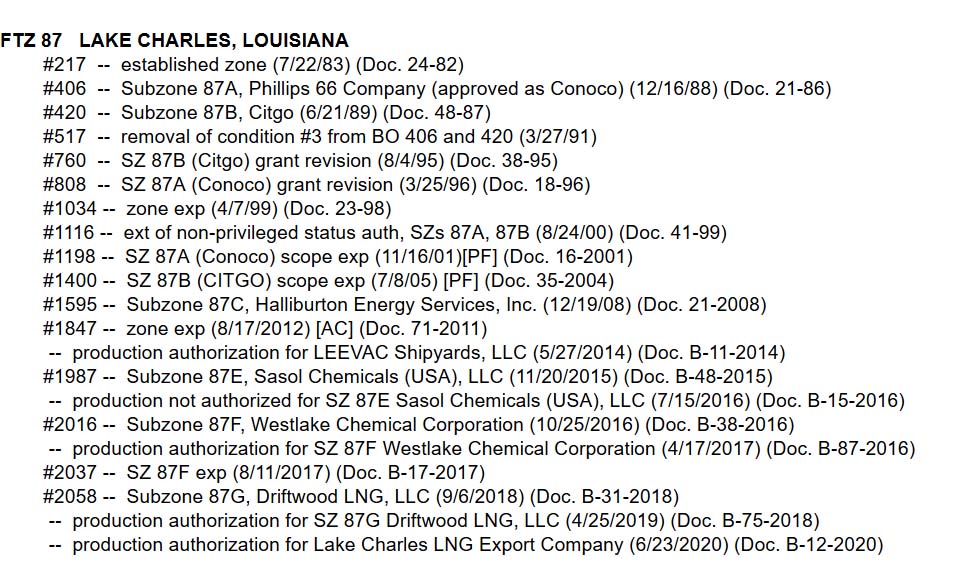
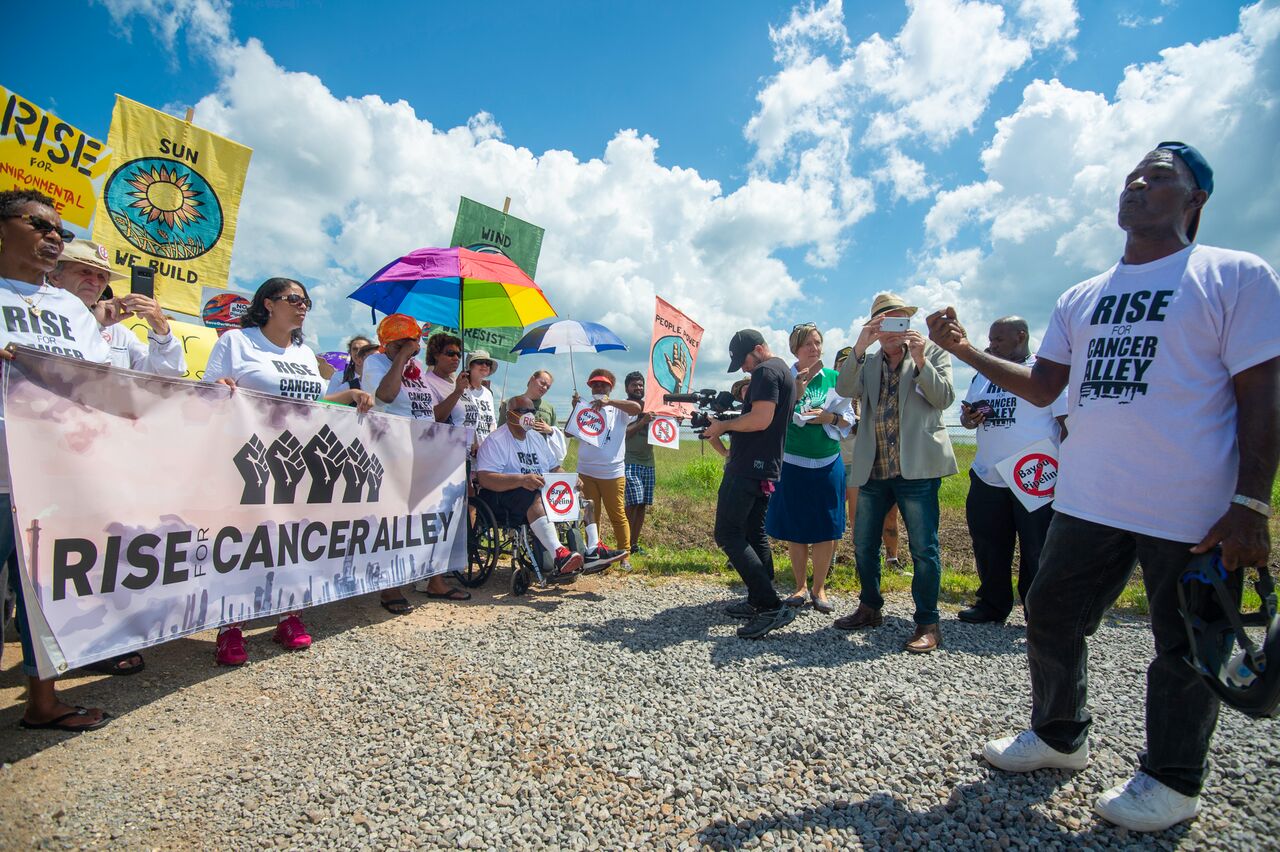
Figure 2. Foreign-Trade Zone (FTZ) Board of Actions in Zones 87 in Lake Charles, LA, 115-117 in and around Port Arthur, TX, and 122 in Corpus Christi, TX. (click on the images to enlarge)
Foreign-Trade Zone (FTZ) Board of Actions in Zone 87 in Lake Charles, Louisiana
Foreign-Trade Zone (FTZ) Board of Actions in Zones 115-117 in and around Port Arthur, Texas
Foreign-Trade Zone (FTZ) Board of Actions in Zone 122 in Corpus Christi, Texas
Much of the oil, gas, and petrochemical industries’ efforts stem from the mass resistance to the Dakota Access Pipeline (DAPL). Native American tribes and environmental groups spent months protesting the environmentally risky $3.78 billion dollar project, which began production in June 2017, after Donald Trump signed an executive order to expedite construction during his first week in office. The Standing Rock Sioux tribe also sued the US government in a campaign effort to protect their tribal lands. The world watched as Energy Transfer Partners (ETP), the company building the pipeline, destroyed Native artifacts and sacred sites, and as police deployed tear gas and sprayed protesters with water in temperatures below freezing.
ETP’s bottom line and reputation were damaged during the fight against DAPL. Besides increasingly militarized law enforcement, the oil and gas industry has retaliated by criminalizing similar types of protests against fossil fuel infrastructure. However, the tireless work of Native Americans and environmental advocates has resulted in a recent victory in March 2020, when a federal judge ordered a halt to the pipeline’s production and an extensive new environmental review of DAPL.
Just days ago, on July 6, 2020, a federal judge ruled that DAPL must shut down until further environmental review can assess potential hazards to the landscape and water quality of the Tribe’s water source. This is certainly a victory for the Standing Rock Sioux Tribe and other environmental defenders, but the decision is subject to appeal.
Since the DAPL conflict began, the industry has been hastily coordinating state-level legislation in anticipation of resistance to other notable national gas transmission pipelines, more locally concerning projects like Class II Oil and Gas Waste Injection Wells, and miles of gas gathering pipelines that transport increasing streams of waste – as well as oil and gas – to coastal processing sites.
The following “critical infrastructure” bills have already been enacted:
STATE
BILL
TITLE
DATE PASSED
West Virginia
HB 4615
NEW PENALTIES FOR PROTESTS NEAR GAS AND OIL PIPELINES
3/25/20
South Dakota
SB 151
NEW PENALTIES FOR PROTESTS NEAR PIPELINES AND OTHER INFRASTRUCTURE
3/18/20
Kentucky
HB 44
NEW PENALTIES FOR PROTESTS NEAR PIPELINES AND OTHER INFRASTRUCTURE
3/16/20
Wisconsin
AB 426
NEW PENALTIES FOR PROTESTS NEAR GAS AND OIL PIPELINES
11/21/19
Missouri
HB 355
NEW PENALTIES FOR PROTESTS NEAR GAS AND OIL PIPELINES
7/11/19
Texas
HB 3557
NEW CRIMINAL AND CIVIL PENALTIES FOR PROTESTS AROUND CRITICAL INFRASTRUCTURE
6/14/19
Tennessee
SB 264
NEW PENALTIES FOR PROTESTS NEAR GAS AND OIL PIPELINES
5/10/19
Indiana
SB 471
NEW PENALTIES FOR PROTESTS NEAR CRITICAL INFRASTRUCTURE
5/6/19
North Dakota
HB 2044
HEIGHTENED PENALTIES FOR PROTESTS NEAR CRITICAL INFRASTRUCTURE
4/10/19
Louisiana
HB 727
HEIGHTENED PENALTIES FOR PROTESTING NEAR A PIPELINE
5/30/18
Oklahoma
HB 1123
NEW PENALTIES FOR PROTESTS NEAR CRITICAL INFRASTRUCTURE
5/3/17
There are an additional eight bills proposed and under consideration in these six states:
STATE
PENDING
TITLE
DATE PROPOSED
Louisiana
HB 197
NEW PENALTIES FOR PROTESTS NEAR CRITICAL INFRASTRUCTURE
2/24/20
Minnesota
HF 3668
NEW PENALTIES FOR PROTESTS NEAR GAS AND OIL PIPELINES
2/24/20
Mississippi
HB 1243
NEW PENALTIES FOR PROTESTS NEAR CRITICAL INFRASTRUCTURE
2/19/20
Alabama
SB 45
NEW PENALTIES FOR PROTESTS NEAR GAS AND OIL PIPELINES
2/4/20
Minnesota
HF 2966
NEW PENALTIES FOR PROTESTS NEAR OIL AND GAS PIPELINES
1/31/20
Minnesota
SF 2011
NEW PENALTIES FOR PROTESTS NEAR GAS AND OIL PIPELINES
3/4/19
Ohio
SB 33
NEW PENALTIES FOR PROTESTS NEAR CRITICAL INFRASTRUCTURE
2/12/19
Illinois
HB 1633
NEW PENALTIES FOR PROTESTS NEAR CRITICAL INFRASTRUCTURE
1/31/19
Desperate Backlash Against Peaceful Protest
Activists and organizations like the American Civil Liberties Union (ACLU) are framing their opposition to such legislation as an attempt to stave off the worst Orwellian instincts of our elected officials, whether they are in Columbus or Mar-a-Lago. On the other hand, industry and prosecutors are framing these protests as terroristic acts that threaten national security, which is why sentencing comes with a felony conviction and up to ten years in prison. The view of the FBI’s deputy assistant director and top official in charge of domestic terrorism John Lewis is that, “In recent years, the Animal Liberation Front and the Earth Liberation Front have become the most active, criminal extremist elements in the United States … the FBI’s investigation of animal rights extremists and ecoterrorism matters is our highest domestic terrorism investigative priority.”
It shocked many when last week, two protesters in the petrochemical-laden “Cancer Alley” region of Louisiana were arrested and charged under the state’s felony “terrorist” law. Their crime? Placing boxes of nurdles – plastic pellets that are the building blocks of many single-use plastic products – on the doorsteps of fossil fuel lobbyists’ homes. To make matters more ridiculous, the nurdles were illegally dumped by the petrochemical company Formosa Plastics.[2] This is outrageous indeed, but is the sort of legally-sanctioned oppression that fossil fuel industry lobbyists have been successfully advocating for years.
American Fuel & Petrochemical Manufacturers (AFPM) stated in a letter of support for ALEC’s legislative efforts:
“In recent years, there has been a growing and disturbing trend of individuals and organizations attempting to disrupt the operation of critical infrastructure in the energy, manufacturing, telecommunications, and transportation industries. Energy infrastructure is often targeted by environmental activists to raise awareness of climate change and other perceived environmental challenges. These activities, however, expose individuals, communities, and the environment to unacceptable levels of risk, and can cause millions of dollars in damage … As the private sector continues to expand and maintain the infrastructure necessary to safely and reliably deliver energy and other services to hundreds of millions of Americans, policymakers should continue to consider how they can help discourage acts of sabotage … Finally, it will also hold organizations both criminally and vicariously liable for conspiring with individuals who willfully trespass or damage critical infrastructure sites.”
Those organizations deemed ‘criminally and vicariously liable’ would in some states face fines an order of magnitude greater than the actual individual, which would cripple margin-thin environmental groups around the country, and could amount to $100,000 to $1,000,000. The AFPM’s senior vice president for federal and regulatory affairs Derrick Morgan referred to these vicarious organizations as “inspiring … organizations who have ill intent, want to encourage folks to damage property and endanger lives …”
One of the most disturbing aspects of this legislation is that it could, according to the testimony and additional concerns of ACLU of Ohio’s Chief Lobbyist Gary Daniels, equate “‘impeding’ and ‘inhibiting’ the ‘operations’ of a critical infrastructure site” with acts as innocuous as Letters to the Editor, labor strikes or protests, attending and submitting testimony at hearings, or simply voicing your concern or objections to the validity of industry claims and its proposals with emails, faxes, phone calls, or a peaceful protest outside critical infrastructure that raises the concern of site security. Mr. Daniels noted in his additional written testimony that the latter, “may prove inconvenient to the site’s staff, under SB 250 they would be an F3 [Third Degree Felony], and that is without someone even stepping foot on or near the property, as physical presence is not required to be guilty of criminal mischief, as found in/defined in Sec. 2907.07(A)(7) of the bill.”
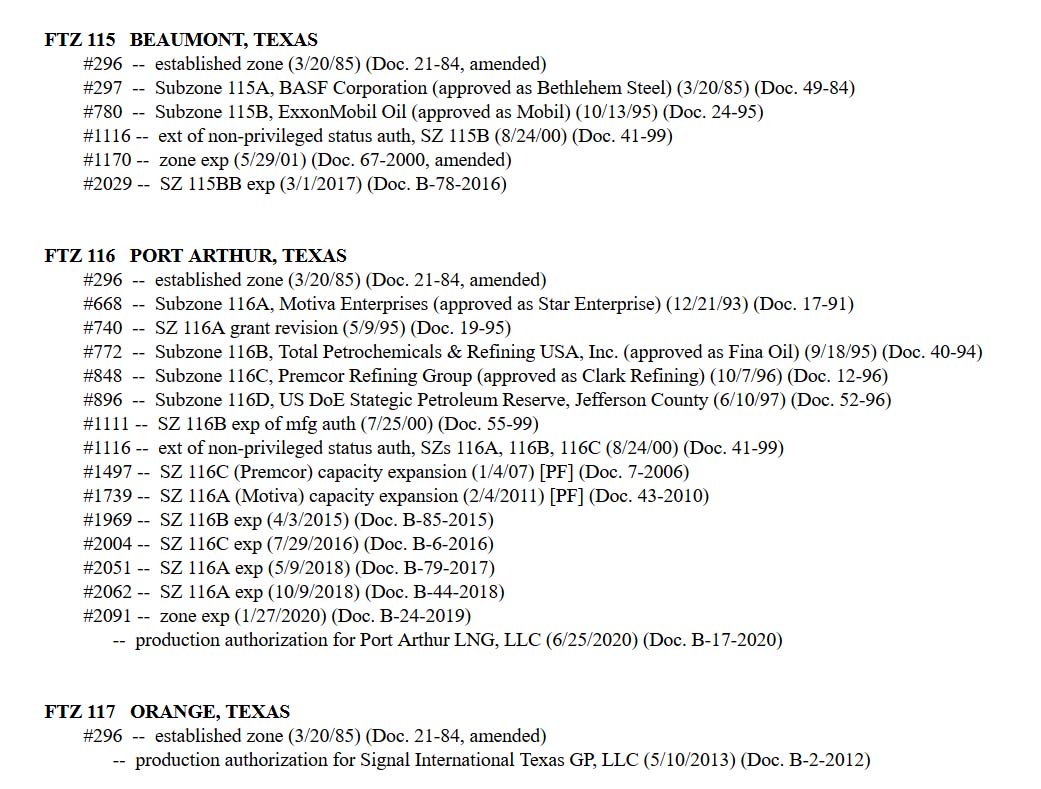
Figure 3. A rally held by the Louisiana-based nonprofit RISE St. James.
This connection, when enshrined into law, will have a chilling effect on freedom of speech and assembly, and will stop protests or thoughtful lines of questioning before they even start. As the Ohio Valley Environmental Coalition (OVEC) put it in their request for residents to ask the governor to veto the now-enacted HB 4615, such a bill is unnecessary, duplicative, deceitful, un-American, unconstitutional, and “will further crowd our jails and prisons.”
To combat such industry-friendly legislation that erodes local government control in Ohio, lawmakers like State Senator Nikki Antonio are introducing resolutions like SR 221, which would, “abolish corporate personhood and money-as-speech doctrine” made law by the Supreme Court of the United States’ rulings in Citizens United v. FEC and Buckley v. Valeo. After all, the overarching impact of ALEC’s efforts and those described below furthers privatized, short-term profit and socialized, long-term costs, and amplifies the incredibly corrosive Citizen’s United decision a little over a decade ago.
Further Criminalization of Protest, Protections for Law Enforcement
Simultaneously, there is an effort to criminalize protest activities through “riot boosting acts,” increased civil liability and decreased police liability, trespassing penalties, and new sanctions for protestors who conceal their identities (by wearing a face mask, for example).
The following bills have already been enacted:
STATE
BILL
TITLE
DATE PASSED
South Dakota
SB 189
EXPANDED CIVIL LIABILITY FOR PROTESTERS AND PROTEST FUNDERS
3/27/19
West Virginia
HB 4618
ELIMINATING POLICE LIABILITY FOR DEATHS WHILE DISPERSING RIOTS AND UNLAWFUL ASSEMBLIES
3/10/18
North Dakota
HB 1426
HEIGHTENED PENALTIES FOR RIOT OFFENCES
2/23/17
North Dakota
HB 1293
EXPANDED SCOPE OF CRIMINAL TRESPASS
2/23/17
North Dakota
HB 1304
NEW PENALTIES FOR PROTESTERS WHO CONCEAL THEIR IDENTITY
2/23/17
In addition, the following bills have been proposed and are under consideration:
STATE
PENDING
TITLE
DATE PROPOSED
Rhode Island
H 7543
NEW PENALTIES FOR PROTESTERS WHO CONCEAL THEIR IDENTITY
2/12/20
Oregon
HB 4126
HARSH PENALTIES FOR PROTESTERS WHO CONCEAL THEIR IDENTITY
1/28/20
Tennessee
SB 1750
NEW PENALTIES FOR PROTESTERS WHO CONCEAL THEIR IDENTITY
1/21/20
Ohio
HB 362
NEW PENALTIES FOR PROTESTERS WHO CONCEAL THEIR IDENTITY
10/8/19
Pennsylvania
SB 887
NEW PENALTIES FOR PROTESTS NEAR “CRITICAL INFRASTRUCTURE”
10/7/19
Massachusetts
HB 1588
PROHIBITION ON MASKED DEMONSTRATIONS
1/17/19
All the while, the Bundy clan of Utah pillage – and at times – hold our public lands hostage, and white male Michiganders enter the state capital in Lansing armed for Armageddon, because they feel that COVID-19 is a hoax. We imagine that it isn’t these types of folks that West Virginia State Representatives John Shott and Roger Hanshaw had in mind when they wrote and eventually successfully passed HB 4618, which eliminated police liability for deaths while dispersing riots and unlawful assemblies.
Contrarily, South Dakota’s SB 189, or “Riot Boosting Act,” was blocked by the likes of US District Judge Lawrence L. Piersol, who wrote:
“Imagine that if these riot boosting statutes were applied to the protests that took place in Birmingham, Alabama, what might be the result? … Dr. King and the Southern Christian Leadership Conference could have been liable under an identical riot boosting law.”
FracTracker collaborated with Crude Accountability on a report documenting increasing reprisals against environmental activists in the US and Eurasia. Read the Report.
Figure 4. Photo of US Treasury Department signage outlining the warning associated with BP’s Whiting, IN, oil refinery designated a Foreign Trade Zone (FTZ). Photo by Ted Auch July 15th, 2015
In all fairness to Mr. Emanuel, he was referring to the Obama administration’s support for the post-2008 bipartisan Wall Street bailout. However, it is critical that we acknowledge the push for critical infrastructure legislation has been most assuredly bipartisan, with Democratic Governors in Kentucky, Louisiana, and Wisconsin signing into law their versions on March 16th of this year, in May of 2018, and in November of 2019, respectively.
Related Legislation in Need of Immediate Attention
In Columbus, Ohio, there are several pieces of legislation being pushed in concert with ALEC-led efforts. These include the recently submitted HB 362, that would “create the crime of masked intimidation.” Phil Plummer and George F. Lang sponsor the bill, with the latter being the same official who introduced HB 625, a decidedly anti-local control bill that would preempt communities from banning plastic bags. Most of the general public and some of the country’s largest supermarket chains have identified plastic bag bans as a logical next step as they wrestle with their role in the now universally understood crimes plastics have foisted on our oceans and shores. As Cleveland Scene’s Sam Allard wrote, “bill mills” and their willing collaborators in states like Ohio cause such geographies to march “boldly, with sigils flying in the opposite direction” of progress, and a more renewable and diversified energy future.
With respect to Plummer and Lang’s HB 362, two things must be pointed out:
1) It is eerily similar to North Dakota’s HB 1304 that created new penalties for protestors who conceal their identity, and
So, when elected officials as far away as Columbus copy and paste legislation passed in the aftermath of the DAPL resistance efforts, it is clear the message they are conveying, and the audience(s) they are trying to intimidate.
Plummer and Lang’s HB 362 would add a section to the state’s “Offenses Against the Public Peace,” Chapter 2917, that would in part read:
No person shall wear a mask or disguise in order to purposely do any of the following:
(A) Obstruct the execution of the law;
(B) Intimidate, hinder, or interrupt a person in the performance of the person’s legal duty; or
(C) Prevent a person from exercising the rights granted to them by the Constitution or the laws of this state.
Whoever violates this proposed section is guilty of masked intimidation. Masked intimidation is a first degree misdemeanor. It was critical for the DAPL protestors to protect their faces during tear gas and pepper spray barrages, from county sheriffs and private security contractors alike.
At the present moment, masks are one of the few things standing between COVID-19 and even more death. Given these realities, it is stunning that our elected officials have the time and/or interest in pushing bills such as HB 362 under the thin veil of law and order.
But judging by what one West Virginia resident and former oil and gas industry draftsman,[3] wrote to us recently, elected officials do not really have much to lose, given how little most people think of them:
“Honestly, it doesn’t seem to matter what we do. The only success most of us have had is in possibly slowing the process down and adding to the cost that the companies incur. But then again, the increase in costs probably just gets passed down to the consumers. One of the biggest drawbacks in my County is that most, if not all, of the elected officials are pro drilling. Many of them have profited from it.”
The oil, gas, and petrochemical industries are revealing their weakness by scrambling to pass repressive legislation to counteract activists. But social movements around the world are determined to address interrelated social and environmental issues before climate chaos renders our planet unlivable, particularly for those at the bottom of the socioeconomic ladder. We hope that by shining a light on these bills, more people will become outraged enough to join the fight against antidemocratic legislation.
This is Part I of a two-part series on concerning legislation related to the oil, gas, and petrochemical industries. Part II focuses on bills that would weaken environmental regulations in Ohio, Michigan, and South Dakota.
By Ted Auch, PhD, Great Lakes Program Coordinator and Shannon Smith, Manager of Communications & Development
[1] See Naomi Klein’s concept of the Shock Doctrine for similar trends.
[2] The community-based environmental organization RISE St. James has been working tirelessly to prevent Formosa Plastics from building one of the largest petrochemical complexes in the US in their Parish. Sharon Lavigne is a leading member of RISE St. James, and is an honored recipient of the 2019 Community Sentinel Award for Environmental Stewardship. Read more on Sharon’s work with RISE St. James here.
[3] This individual lives in Central West Virginia, and formerly monitored Oil & Gas company assets in primarily WV, PA, NY, VA, MD & OH, as well as the Gulf Coast. Towards the end of this individual’s career, they provided mapping support for the smart pigging program, call before you dig, and the pipeline integrity program.
FracTracker Alliance has released a new national map, filled with energy and petrochemical data. Explore the map, continue reading to learn more, and see how your state measures up!
This map has been updated since this blog post was originally published, and therefore statistics and figures below may no longer correspond with the map
The items on the map (followed by facility count in parenthesis) include:
For oil and gas wells, view FracTracker’s state maps.
Transportation & Storage
Natural gas compressor stations (1,367) – Facilities built along a pipeline route that pressurize natural gas to keep it flowing through the pipeline.
Crude oil rail terminals (94) – Rail terminals that load and unload crude oil (liquid hydrocarbons that have yet to be processed into higher-value petroleum products).
Liquefied natural gas import/export terminals (8) – Facilities that can a) liquefy natural gas so it can be exported as LNG (liquefied natural gas) and/or b) re-gasify LNG so it can be used as natural gas. Natural gas is transported in a liquid state because it takes up less space as a liquid than as a gas.
Natural Gas Underground Storage (486) – Locations where natural gas is stored underground in aquifers, depleted gas fields, and salt formations.
Petroleum Product Terminals (1,484) – Terminals with a storage capacity of 50,000 barrels or more and/or the ability to receive volumes from tanker, barge, or pipeline. Petroleum products include products “produced from the processing of crude oil and other liquids at petroleum refineries, from extraction of liquid hydrocarbons at natural gas processing plants, and from production of finished petroleum products at blending facilities.”
Petroleum Ports (242) – A port that can import and/or export 200,000 or more short tons of petroleum products a year.
Natural gas import/export pipeline facility (54) – A facility where natural gas crosses the border of the continental United States.
Pipelines
Crude oil pipelines – major crude oil pipelines, including interstate truck lines and selected intrastate lines, but not including gathering lines.
Natural gas liquid pipelines – Also referred to as hydrocarbon gas liquid pipelines, they carry the heavier components of the natural gas stream which are liquid under intense pressure and extreme cold, but gas in normal conditions.
Natural gas pipelines– Interstate and intrastate natural gas pipelines. Due to the immensity of this pipeline network and lack of available data, this pipeline layer in particular varies in degree of accuracy.
Petroleum Product Pipelines – Major petroleum product pipelines.
Recent Pipeline Projects – Pipeline projects that have been announced since 2017. This includes projects in various stages, including under construction, complete, planned or canceled. Click on the pipeline for the status.
Processing & Downstream
Natural Gas Processing Plants (478) – Plants that separate impurities and components of the natural gas stream.
Chemical plants (36) – Includes two types of chemical plants – petrochemical production and ammonia manufacturing – that report to EPA’s Greenhouse Gas Reporting Program.
Ethylene Crackers (30) – Also referred to as ethane crackers, these petrochemical complexes that converts ethane (a natural gas liquid) into ethylene. Ethylene is used to make products like polyethylene plastic.
Petroleum Refineries (135) – A plant that processes crude oil into products like petroleum naphtha, diesel fuel, and gasoline.
Power Plants (9,414) – Electric generating plants with a capacity of at least one megawatt, sorted by energy source.
Wind Turbines (63,003) – Zoom in on wind power plants to see this legend item appear.
Natural Resources
Shale Plays (45) – Tight oil and gas shale plays, which are formations where oil and gas can be extracted.
Major Rivers
Solar Energy Potential – Potential solar energy generation, in kilowatt-hours per square meter per day – averaged annually.
This map is by no means exhaustive, but is exhausting. It takes a lot of infrastructure to meet the energy demands from industries, transportation, residents, and businesses – and the vast majority of these facilities are powered by fossil fuels. What can we learn about the state of our national energy ecosystem from visualizing this infrastructure? And with increasing urgency to decarbonize within the next one to three decades, how close are we to completely reengineering the way we make energy?
Key Takeaways
Natural gas accounts for 44% of electricity generation in the United States – more than any other source. Despite that, the cost per megawatt hour of electricity for renewable energy power plants is now cheaper than that of natural gas power plants.
The state generating the largest amount of solar energy is California, while wind energy is Texas. The state with the greatest relative solar energy is not technically a state – it’s D.C., where 18% of electricity generation is from solar, closely followed by Nevada at 17%. Iowa leads the country in relative wind energy production, at 45%.
The state generating the most amount of energy from both natural gas and coal is Texas. Relatively, West Virginia has the greatest reliance on coal for electricity (85%), and Rhode Island has the greatest percentage of natural gas (92%).
With 28% of total U.S. energy consumption for transportation, many of the refineries, crude oil and petroleum product pipelines, and terminals on this map are dedicated towards gasoline, diesel, and other fuel production.
Petrochemical production, which is expected to account for over a third of global oil demand growth by 2030, takes the form of chemical plants, ethylene crackers, and natural gas liquid pipelines on this map, largely concentrated in the Gulf Coast.
Electricity generation
The “power plant” legend item on this map contains facilities with an electric generating capacity of at least one megawatt, and includes independent power producers, electric utilities, commercial plants, and industrial plants. What does this data reveal?
In terms of the raw number of power plants – solar plants tops the list, with 2,916 facilities, followed by natural gas at 1,747.
In terms of megawatts of electricity generated, the picture is much different – with natural gas supplying the highest percentage of electricity (44%), much more than the second place source, which is coal at 21%, and far more than solar, which generates only 3% (Figure 1).
Figure 1. Electricity generation by source in the United States, 2019. Data from EIA.
This difference speaks to the decentralized nature of the solar industry, with more facilities producing less energy. At a glance, this may seem less efficient and more costly than the natural gas alternative, which has fewer plants producing more energy. But in reality, each of these natural gas plants depend on thousands of fracked wells – and they’re anything but efficient.
The cost per megawatt hour of electricity for a renewable energy power plants is now cheaper than that of fracked gas power plants. A report by the Rocky Mountain Institute, found “even as clean energy costs continue to fall, utilities and other investors have announced plans for over $70 billion in new gas-fired power plant construction through 2025. RMI research finds that 90% of this proposed capacity is more costly than equivalent [clean energy portfolios, which consist of wind, solar, and energy storage technologies] and, if those plants are built anyway, they would be uneconomic to continue operating in 2035.”
The economics side with renewables – but with solar, wind, geothermal comprising only 12% of the energy pie, and hydropower at 7%, do renewables have the capacity to meet the nation’s energy needs? Yes! Even the Energy Information Administration, a notorious skeptic of renewable energy’s potential, forecasted renewables would beat out natural gas in terms of electricity generation by 2050 in their 2020 Annual Energy Outlook.
This prediction doesn’t take into account any future legislation limiting fossil fuel infrastructure. A ban on fracking or policies under a Green New Deal could push renewables into the lead much sooner than 2050.
In a void of national leadership on the transition to cleaner energy, a few states have bolstered their renewable portfolio.
Figure 2. Electricity generation state-wide by source, 2019. Data from EIA.
One final factor to consider – the pie pieces on these state charts aren’t weighted equally, with some states’ capacity to generate electricity far greater than others. The top five electricity producers are Texas, California, Florida, Pennsylvania, and Illinois.
Transportation
In 2018, approximately 28% of total U.S. energy consumption was for transportation. To understand the scale of infrastructure that serves this sector, it’s helpful to click on the petroleum refineries, crude oil rail terminals, and crude oil pipelines on the map.
Transportation Fuel Infrastructure. Data from EIA.
The majority of gasoline we use in our cars in the US is produced domestically. Crude oil from wells goes to refineries to be processed into products like diesel fuel and gasoline. Gasoline is taken by pipelines, tanker, rail, or barge to storage terminals (add the “petroleum product terminal” and “petroleum product pipelines” legend items), and then by truck to be further processed and delivered to gas stations.
China leads the world in this movement. In 2018, just over half of the world’s electric vehicles sales occurred in China. Analysts predict that the country’s oil demand will peak in the next five years thanks to battery-powered vehicles and high-speed rail.
In the United States, the percentage of electric vehicles on the road is small but growing quickly. Tax credits and incentives will be important for encouraging this transition. Almost half of the country’s electric vehicle sales are in California, where incentives are added to the federal tax credit. California also has a “Zero Emission Vehicle” program, requiring electric vehicles to comprise a certain percentage of sales.
We can’t ignore where electric vehicles are sourcing their power – and for that we must go back up to the electricity generation section. If you’re charging your car in a state powered mainly by fossil fuels (as many are), then the electricity is still tied to fossil fuels.
Petrochemicals
Many of the oil and gas infrastructure on the map doesn’t go towards energy at all, but rather aids in manufacturing petrochemicals – the basis of products like plastic, fertilizer, solvents, detergents, and resins.
Natural gas processing plants separate components of the natural gas stream to extract natural gas liquids like ethane and propane – which are transported through the natural gas liquid pipelines. These natural gas liquids are key building blocks of the petrochemical industry.
Ethane crackers process natural gas liquids into polyethylene – the most common type of plastic.
The chemical plants on this map include petrochemical production plants and ammonia manufacturing. Ammonia, which is used in fertilizer production, is one of the top synthetic chemicals produced in the world, and most of it comes from steam reforming natural gas.
As we discuss ways to decarbonize the country, petrochemicals must be a major focus of our efforts. That’s because petrochemicals are expected to account for over a third of global oil demand growth by 2030 and nearly half of demand growth by 2050 – thanks largely to an increase in plastic production. The International Energy Agency calls petrochemicals a “blind spot” in the global energy debate.
Petrochemical development off the coast of Texas, November 2019. Photo by Ted Auch, aerial support provided by LightHawk.
Investing in plastic manufacturing is the fossil fuel industry’s strategy to remain relevant in a renewable energy world. As such, we can’t break up with fossil fuels without also giving up our reliance on plastic. Legislation like the Break Free From Plastic Pollution Act get to the heart of this issue, by pausing construction of new ethane crackers, ensuring the power of local governments to enact plastic bans, and phasing out certain single-use products.
“The greatest industrial challenge the world has ever faced”
Mapped out, this web of fossil fuel infrastructure seems like a permanent grid locking us into a carbon-intensive future. But even more overwhelming than the ubiquity of fossil fuels in the US is how quickly this infrastructure has all been built. Everything on this map was constructed since Industrial Revolution, and the vast majority in the last century (Figure 3) – an inch on the mile-long timeline of human civilization.
Figure 3. Global Fossil Fuel Consumption. Data from Vaclav Smil (2017)
In fact, over half of the carbon from burning fossil fuels has been released in the last 30 years. As David Wallace Wells writes in The Uninhabitable Earth, “we have done as much damage to the fate of the planet and its ability to sustain human life and civilization since Al Gore published his first book on climate than in all the centuries—all the millennia—that came before.”
What will this map look like in the next 30 years?
A recent report on the global economics of the oil industry states, “To phase out petroleum products (and fossil fuels in general), the entire global industrial ecosystem will need to be reengineered, retooled and fundamentally rebuilt…This will be perhaps the greatest industrial challenge the world has ever faced historically.”
Is it possible to build a decentralized energy grid, generated by a diverse array of renewable, local, natural resources and backed up by battery power? Could all communities have the opportunity to control their energy through member-owned cooperatives instead of profit-thirsty corporations? Could microgrids improve the resiliency of our system in the face of increasingly intense natural disasters and ensure power in remote regions? Could hydrogen provide power for energy-intensive industries like steel and iron production? Could high speed rail, electric vehicles, a robust public transportation network and bike-able cities negate the need for gasoline and diesel? Could traditional methods of farming reduce our dependency on oil and gas-based fertilizers? Could zero waste cities stop our reliance on single-use plastic?
Of course! Technology evolves at lightning speed. Thirty years ago we didn’t know what fracking was and we didn’t have smart phones. The greater challenge lies in breaking the fossil fuel industry’s hold on our political system and convincing our leaders that human health and the environment shouldn’t be externalized costs of economic growth.
https://www.fractracker.org/a5ej20sjfwe/wp-content/uploads/2020/02/National-map-feature-3.png400900Erica Jacksonhttps://www.fractracker.org/a5ej20sjfwe/wp-content/uploads/2025/09/2025-Wordmark-Logo.pngErica Jackson2020-02-28 17:35:142022-05-02 15:21:42National Energy and Petrochemical Map
The Great Plains has become the unconventional oil & gas industry’s dumping ground, prompting questions about the security and resilience of the bread basket and the underlying Ogalalla Aquifer
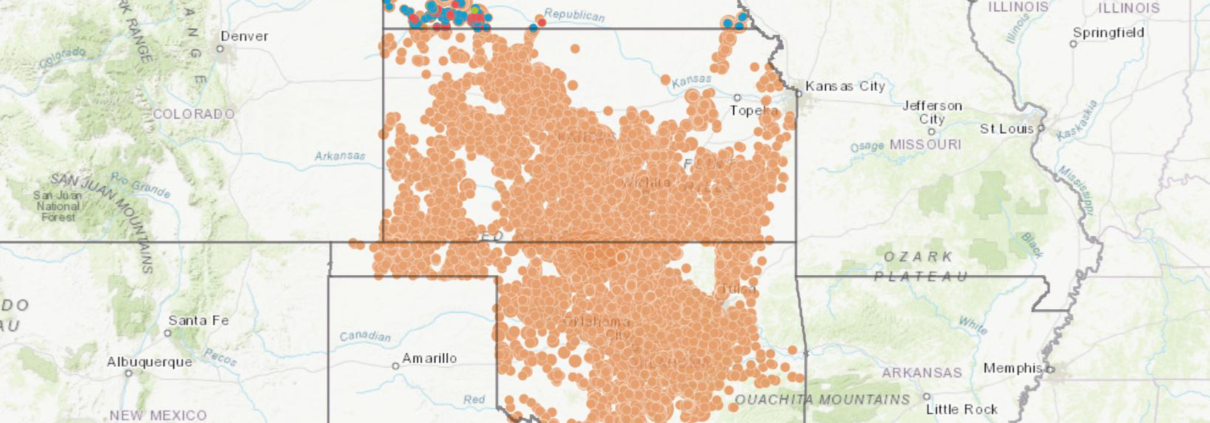
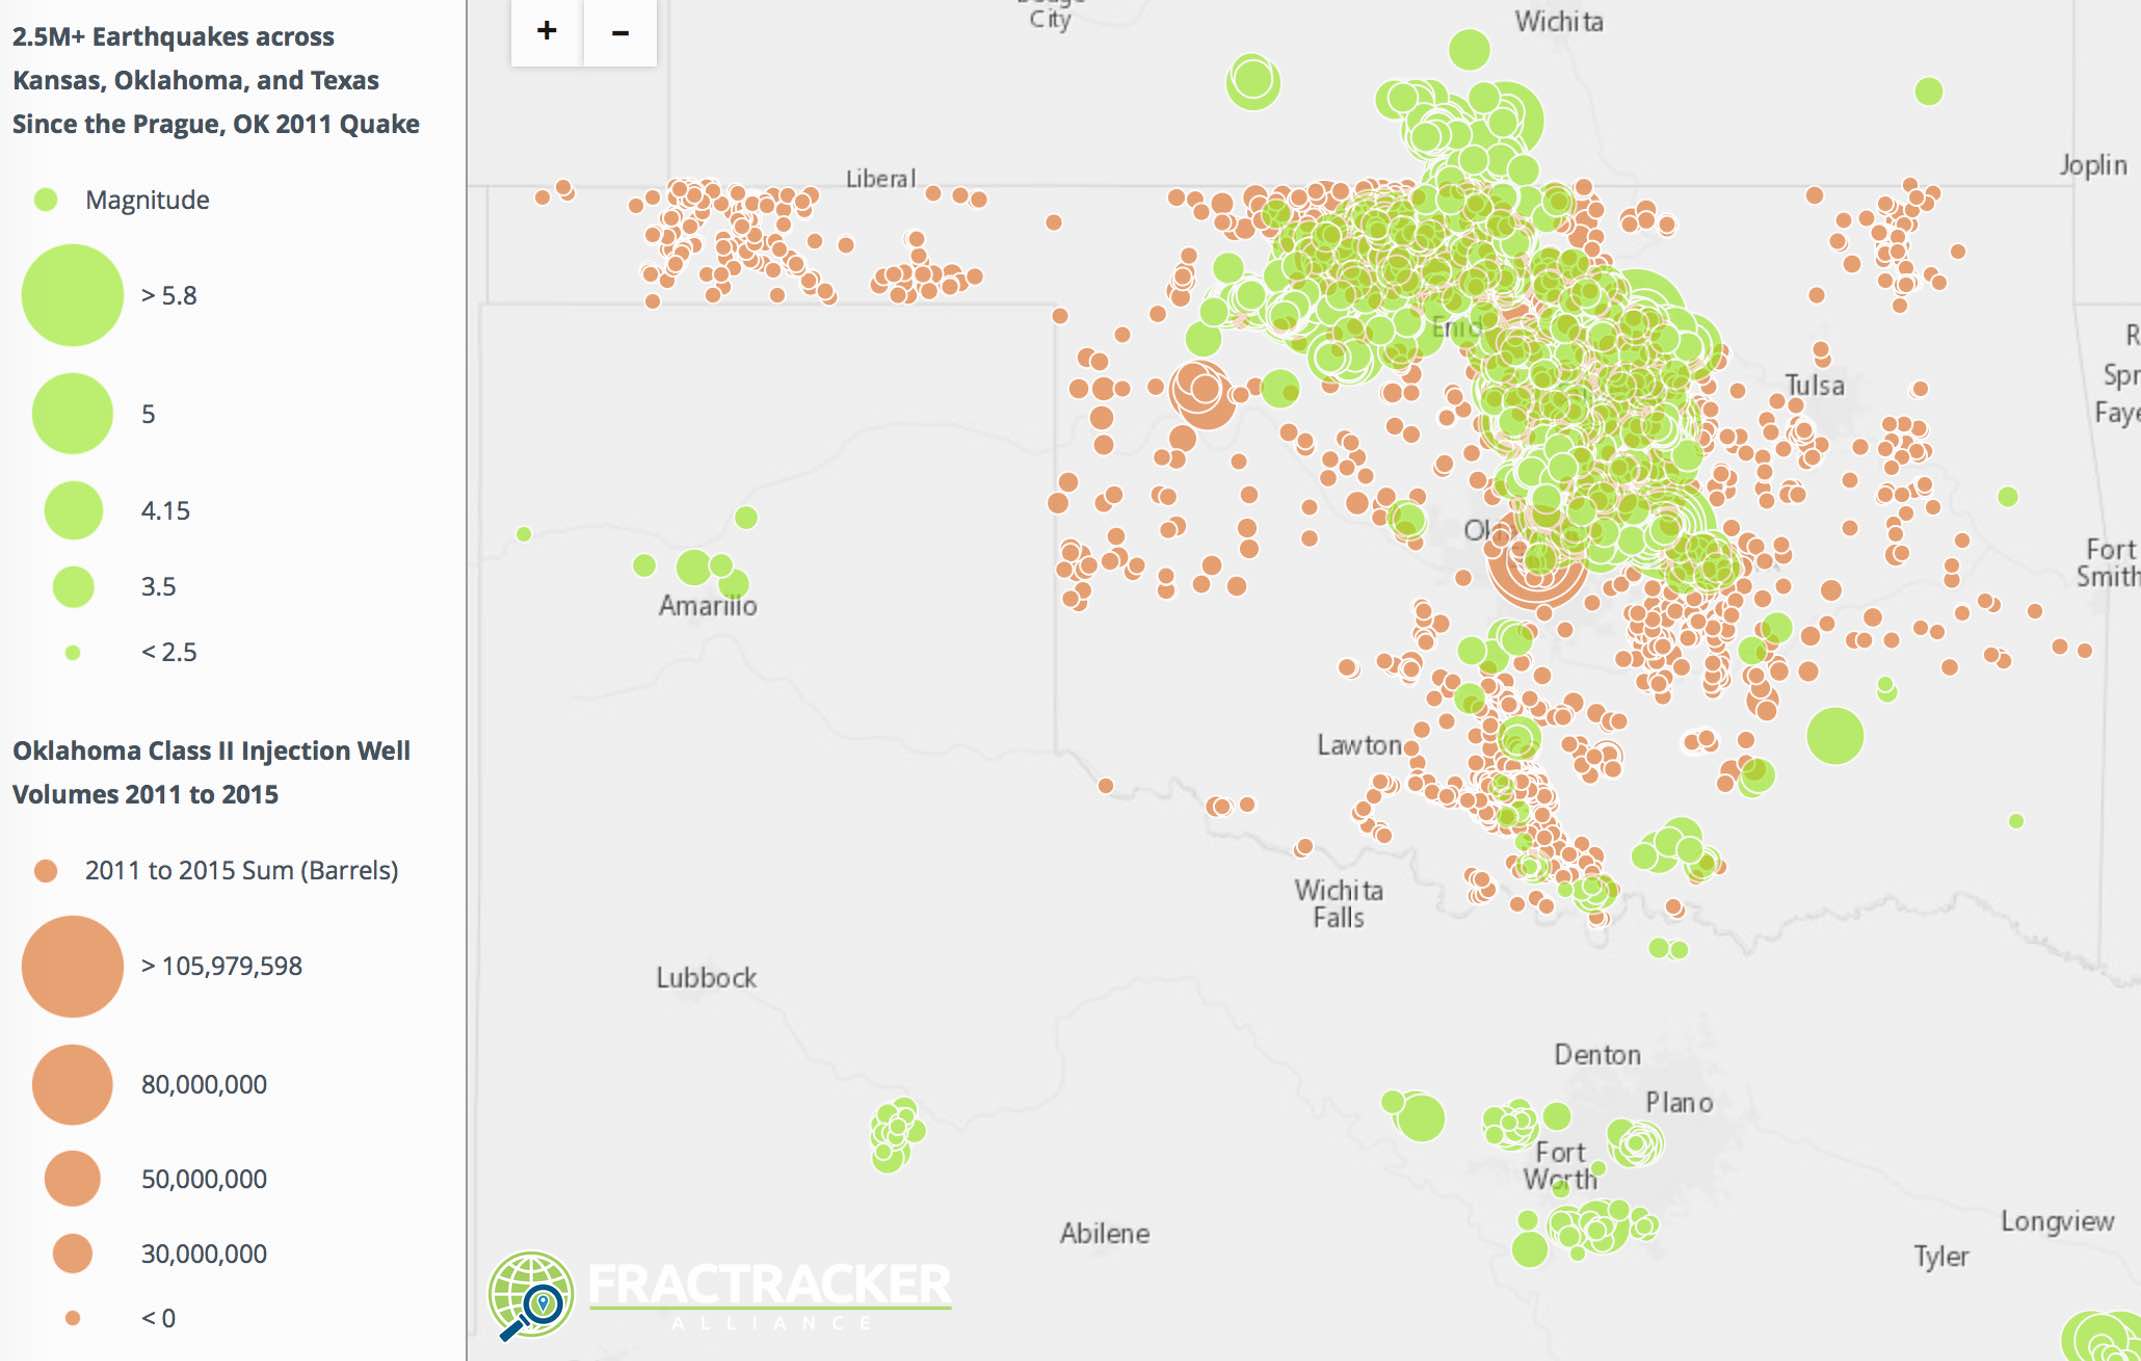
Back in December of 2016, FracTracker analyzed the growing link between injection wells that dispose fracking waste and “induced seismicity” [1], or human-caused earthquakes. Our compiled maps from this analysis (including Figure 1 below) show seismic activity in Kansas and Oklahoma along with Class II injection well volumes up through 2015.
Figure 1. Earthquakes and Class II Injection Well Activity at the Kansas-Oklahoma Border
This link was given acute attention at that time as a result of the magnitude 5.8 earthquake in Pawnee, Oklahoma on September 3rd, 2016, followed closely by a 4.5 earthquake on November 1st. The industry’s increased production of waste came home to roost 5 days later when a magnitude 5.0 quake struck a mile west of the “Cushing Hub,” the largest commercial crude oil storage center in North America. The Cushing Hub is capable of storing 54 million barrels of crude – the equivalent of 2.8 times the U.S. daily oil refinery capacity and 3.1 times the daily oil refinery capacity of all of North America.
Sunflower State of Affairs
Since we published this analysis and associated maps, Class II injection wells have been in the news several times across the Great Plains. An investigation by KSN News found that the Kansas Corporation Commission (KCC) improperly permitted over 2,000 Class II injection wells. The KCC stated that public comment periods for well proposals lasted just 15 days, instead of the correct number of 30 days. This amounts to 42% and 28% of the state’s active and total inventory of oil and gas waste receiving wells approved with inaccurate public notices.
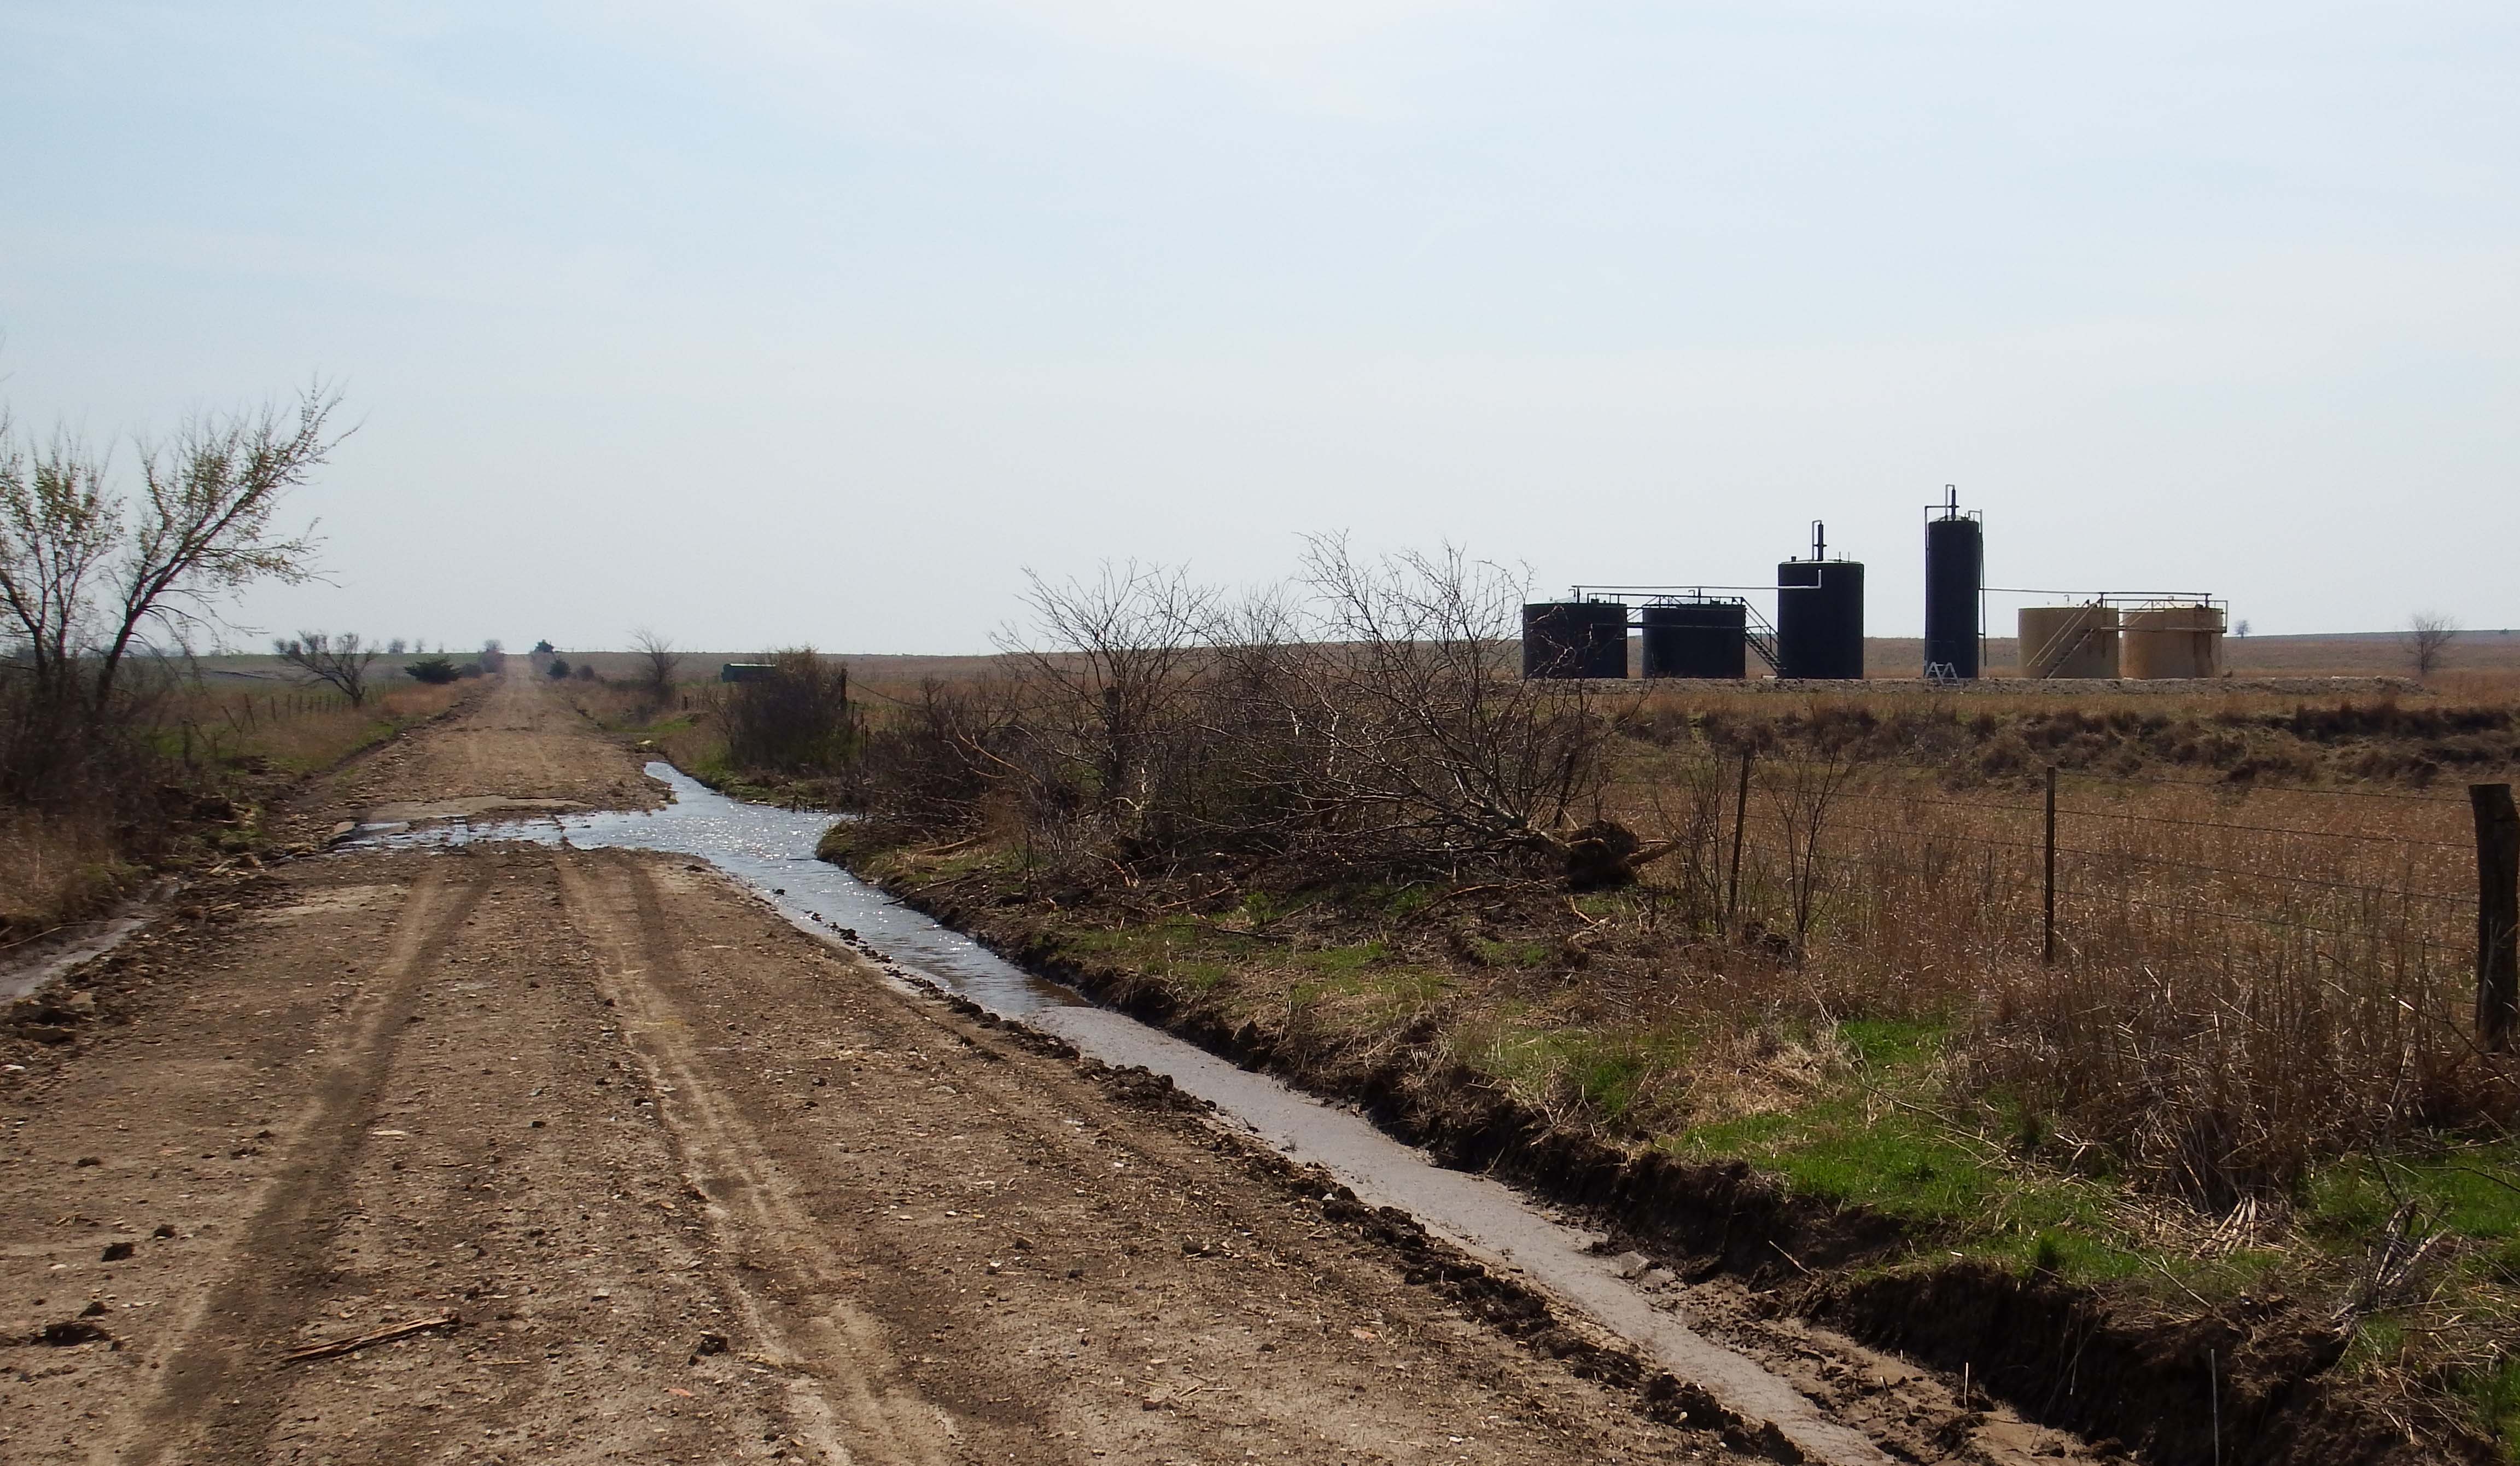
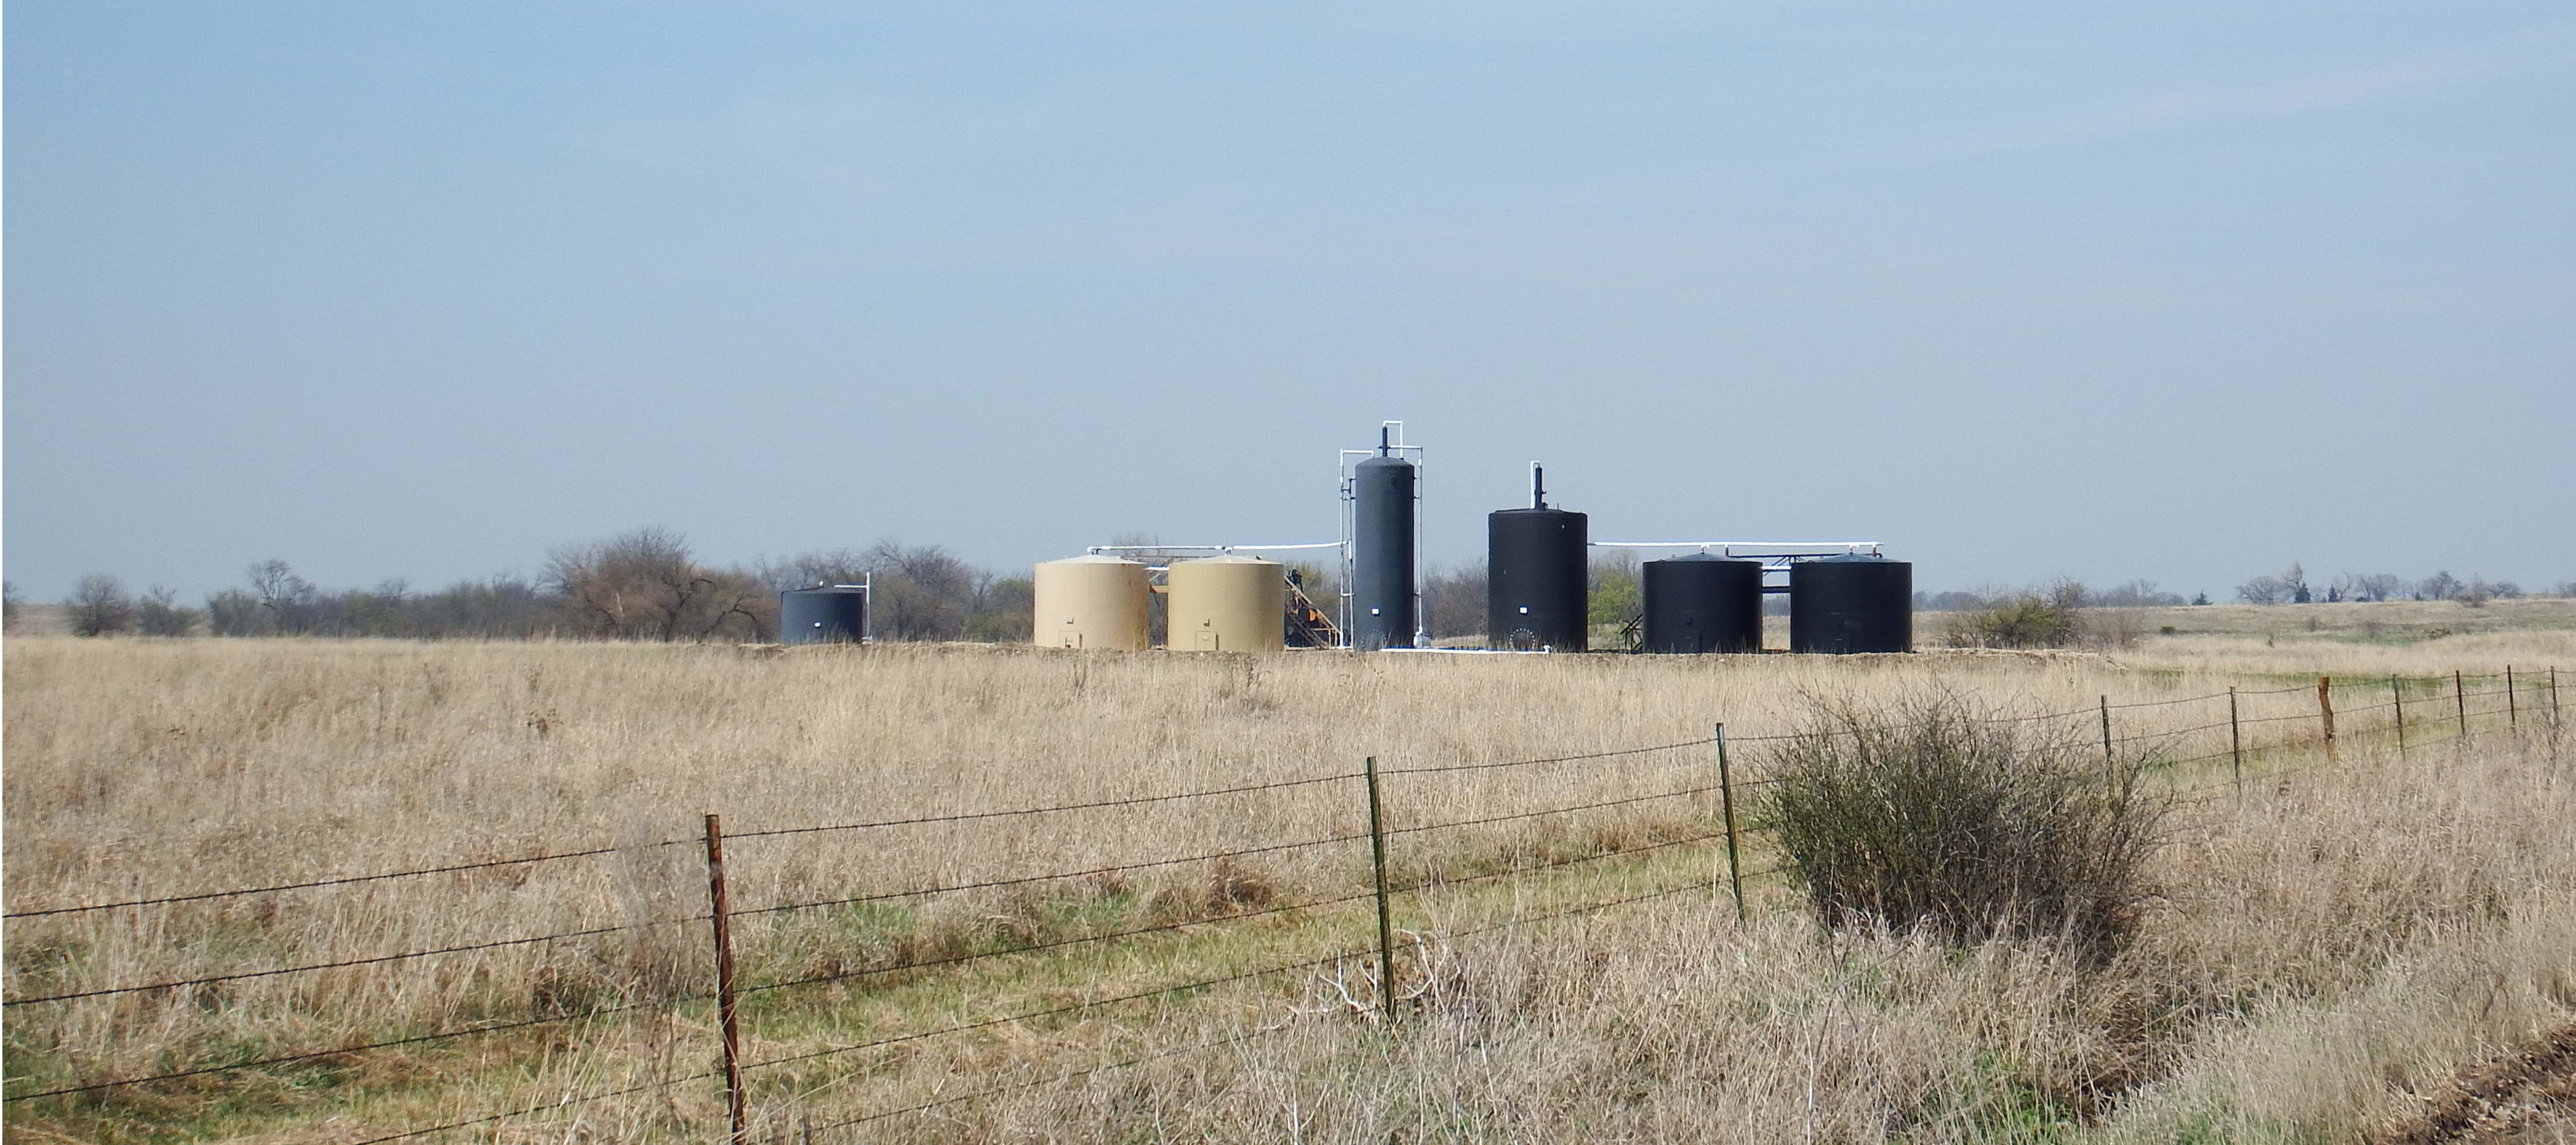
Quail Oil & Gas LC’s Class II Salt Water Disposal (SWD) well, Morris County, KS near Diamond Creek (Photo Courtesy of Karla jo Grimmett at South 500 photography)
According to Cindy Hoedel, a freelance journalist in Kansas, “the KCC responded to the investigation findings… by ruling that no remedy was needed and closing the docket.”
“The significance is they are choking us off in terms of giving us less and less time to try to mount a protest, to submit any kind of comment, and that’s a lot,” Cindy Hoedel, a Matfield Green resident who has complained about earthquakes in her area, said… “These notices get published in these tiny little newspapers, and sometimes it might take us 15 days before we find it”
As Ms. Hoedel wrote in an email when I asked her to comment on issues relating to Kansas’ Class II injection wells:
“The Republican controlled Kansas Legislature is trying to fend off several proposed bills that would reform the KCC (the regulatory body that oversees the permitting of Class II underground injection control wells). Citizen challenges of individual applications for disposal and EOR [enhanced oil recovery] wells continue, with the KCC moving more aggressively than in the past to dismiss protestants before a hearing is held. Some of these dismissals are being challenged in appellate court. The activists’ view is that EPA, the SWDA [Safe Water Drinking Act]and Congress clearly intend for the public to be able to participate in the regulatory process; instead, KCC has written regulations that are effectively barriers to participation… Activists have questions about the large number of EOR wells being applied for in Kansas and what their true purpose is, given the insignificant amounts of oil being produced compared to high volumes of injected fluids. Another concern is that the injection well earthquakes in Oklahoma and Kansas continue, yet KCC refuses to add regs that would address seismic risk in permit applications. There is also a problem with harassment of citizens exercising their right to protest – Scott Yeargain and I were both turned in to the Kansas AG’s office by a KCC staffer on the bogus claim that we were practicing law without a license because we helped explain the convoluted process to other protesters.”
Grapes of Wrath
Meanwhile, across the border, Oklahoma City and its surrounding suburbs have become the San Francisco of the Great Plains, with regular earthquake swarms (including many that exceed magnitude 4.0). According to Think Progress reporter Samantha Page, despite the damages and lawsuits caused by these earthquakes, “for years, the state was slow to respond, while Gov. Mary Fallin (R) and others questioned the link to human activity.”
Eventually, by the end of 2016, the Oklahoma Corporation Commission responded by implementing a ‘traffic light’ protocol, in which operations are paused or stopped altogether following earthquakes of certain magnitudes. For a time, the EPA demanded a moratorium on disposal across Class II wells injecting into the Arbuckle formation in “high seismically active focus areas.”
Chad Warmington, president of the Oklahoma Oil and Gas Association, said that this response by the EPA is “a stellar example of the inefficiency of the federal government…It’s akin to a newspaper telling us today the football scores from games played 15 months ago.”
In reporting on the industry’s response, journalist Paul Monies, buried the lead when he pointed out the following in his second to last paragraph:
“Wastewater recycling remains an expensive option compared to the low costs of disposal wells in Oklahoma. While operators can inject wastewater into formations other than the Arbuckle, Hatfield said other formations don’t accept water as easily and are at shallower depths.”
The Map
Our second stab at mapping the scale and scope of Class II injection wells across the Great Plains is slightly different than our first effort in a few ways:
This iteration includes Class II Salt Water Disposal (SWD) Injection Wells in Nebraska, Oklahoma, and Kansas on one map. Clicking on a well reveals its location, well name, operator, and the volume of wastewater disposed. Volumes are presented annually for Nebraska and monthly for 2011 to 2017 for Oklahoma and Kansas. We also present annual sums for Oklahoma from 2006 to 2010.
The map shows Arkansas and Platte River Basin boundaries, which contain the entire inventory of OK, NE, and KS Class II wells.
Finally, we’ve includedUS Forest Service Robert G. Bailey’s Ecoregions to give a sense for the types of ecosystems threatened by the O&G industry’s demand for suitable waste disposal sites
View Map Full Screen | To view the legend on this map, click the “layers” icon on the top left of the screen
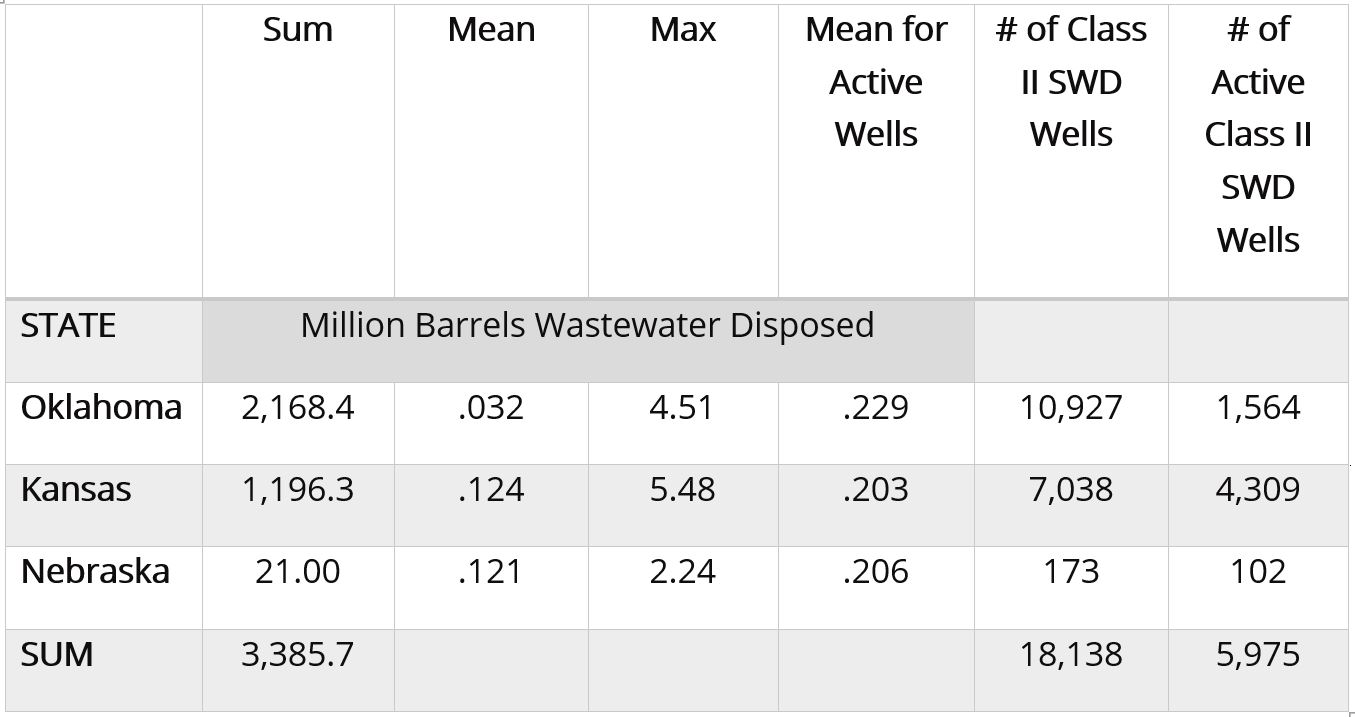
Table 1, below, breaks down the volumes of oil and gas wastewater disposed in Oklahoma, Kansas and Nebraska. Volumes are measured in million barrels, with one barrel equivalent to 42 gallons. The number of Class II SWD (salt water disposal) injection wells in these states is separated to show the total number of wells permitted verse the number of wells that were active (receiving waste).
Table 1. Class II injection well volumes in 2017
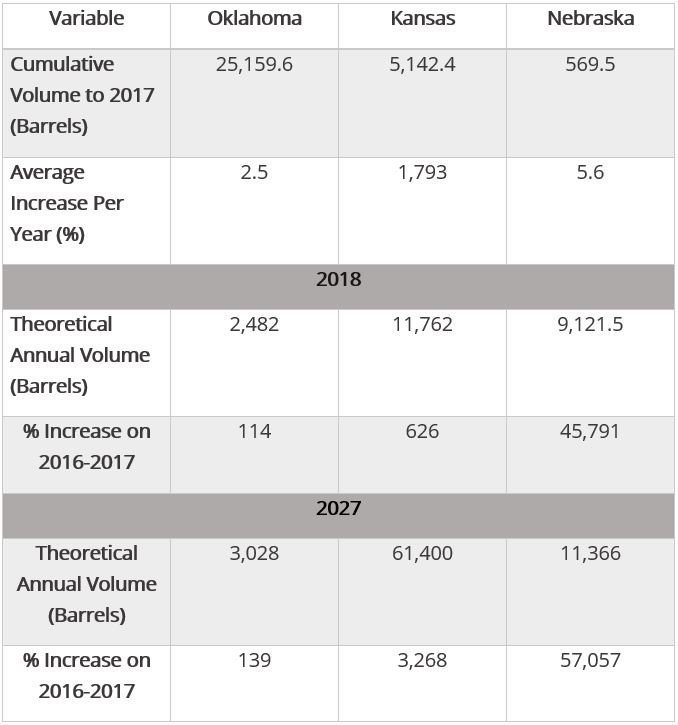
In total, 3,385,700,000 barrels of wastewater were disposed in 5,975 injection wells in these three states in 2017. The volume of wastewater disposed has increased in recent years (Table 2).
Table 2. Cumulative Class II injection well volumes to 2017, annual percent changes, and likely 2018 and 2027 volumes
In Table 2, the theoretical annual volumes for 2018 and 2027 are predictions based on the average of linear, exponential, and polynomial models.
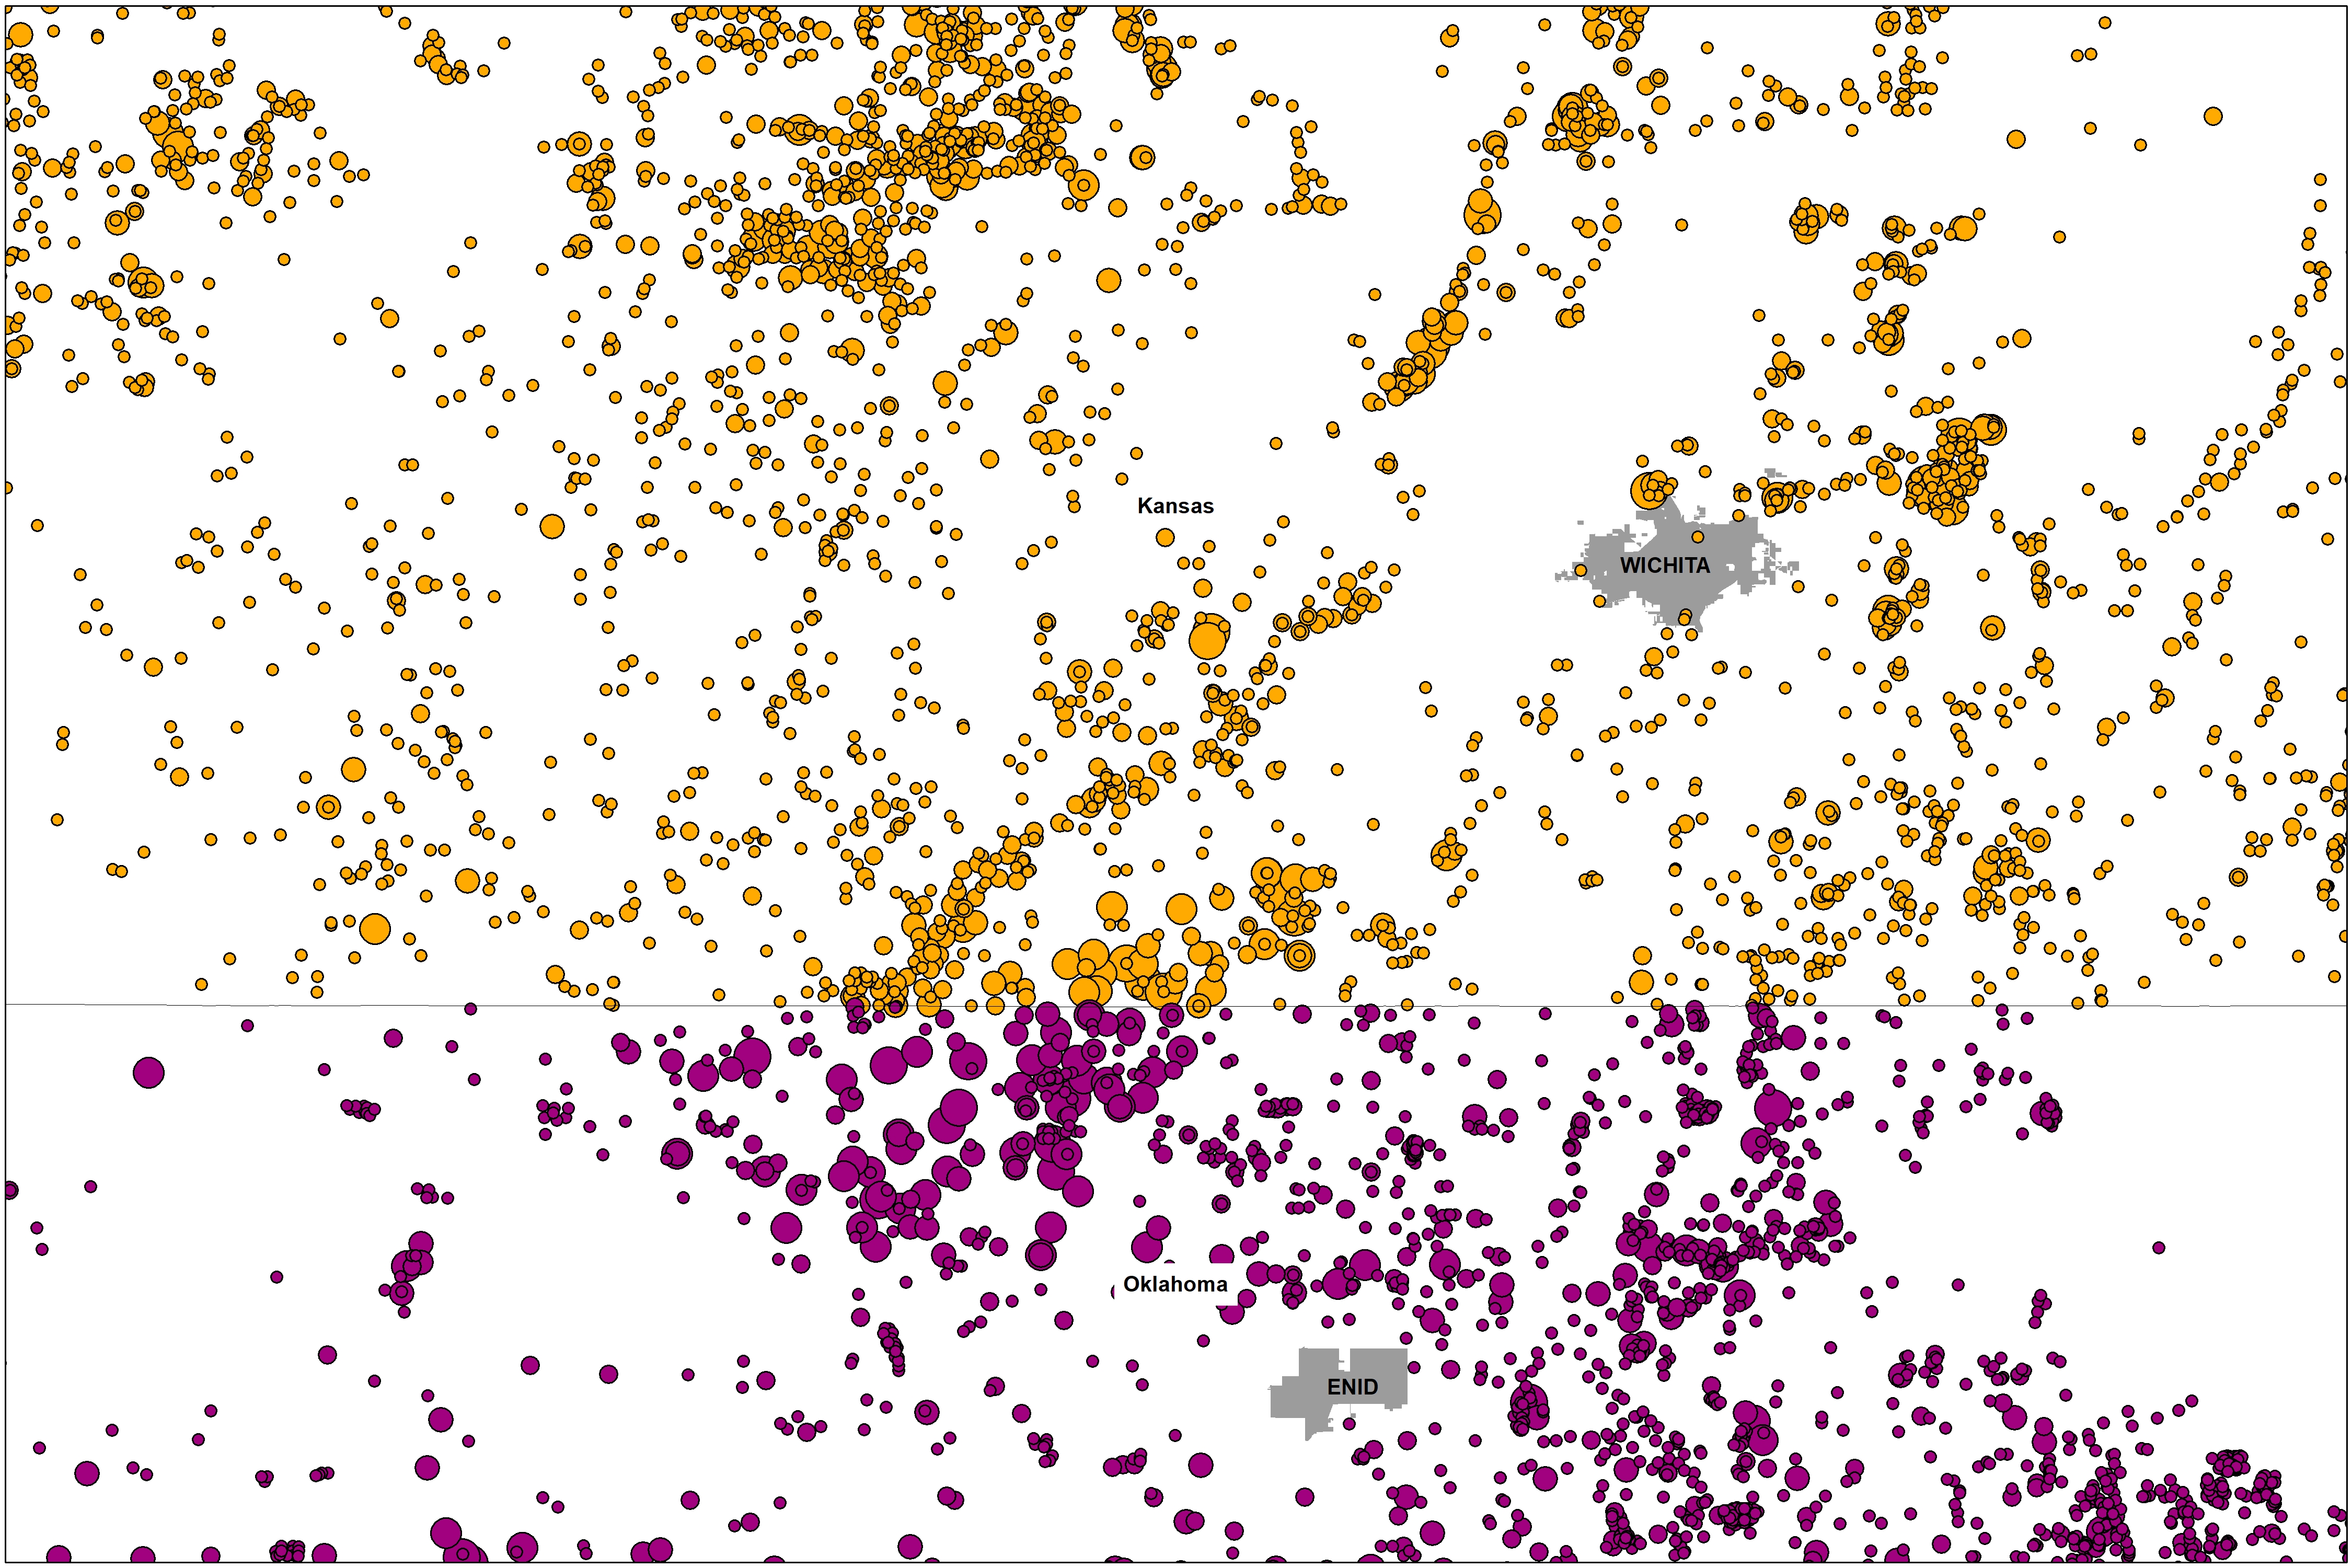
The Kansas-Oklahoma Border
It is critical that we analyze the Great Plains fracking waste ecosystem across state lines. There are several reasons for this, including the proximity of Kansas’ most active Class II wells to the Oklahoma border (Figure 2) and the potential for the KCC to use enhanced oil recovery wells in Kansas to dispose of Oklahoma’s fracking waste.
Figure 2. Class II injection well volumes for 2017 along the Kansas-Oklahoma border.
Collaboration between front line communities, non-profits like FracTracker Alliance, and groups like the Kansas Water Advocacy Team (WAT) will be crucial to understanding the impacts of waste disposal writ large. It seems like the “food vs energy” nexus has come to a head in the heart of the U.S. Bread Basket. We’ll continue to highlight and map the issues associated with this topic in the coming months and years.
Data Download Links
The following links contain the data used in the above tables and map, for use in excel and with Geographic Information Systems (GIS).
Guest article by Dakota Raynes, Co-Organizer of Stop Fracking Payne County (OK)
President Trump recently tapped Oklahoma Attorney General Scott Pruitt to head the Environmental Protection Agency (EPA), even though Pruitt is a self-proclaimed “leading advocate against the EPA’s activist agenda.” Pruitt is currently opposing investigation of Exxon Mobile’s handling of climate-change science based on the belief that climate change science is not yet settled and “debate should be encouraged in classrooms, public forums, and the halls of Congress.” Senate confirmation hearings regarding Pruitt’s nomination are currently ongoing – many questions have focused on Pruitt’s legacy as AG of OK and what that tells us about actions he might take as head of the EPA.
Pruitt’s Past as AG
Elected in 2010, Pruitt’s six-year tenure illuminates the full extent of the troubling stances he takes. For instance, he has fought against the overturn of DOMA, same-sex marriage rights, granting legal status to undocumented immigrants, the Affordable Care Act, access to safe and affordable birth control and abortions, and Dodd-Frank Wall Street reform. These actions demonstrate Pruitt’s inability to accept or implement procedures, policies, and programs supported by a majority of US residents, members of the nations’ highest courts, and even his own colleagues.
A Focus on Environmental Issues
More specifically related to environmental issues, he has openly criticized the EPA in congressional hearings and op-ed pieces. Due to his belief that the EPA frequently abuses its authority, Pruitt’s office has filed 14 antiregulatory lawsuits against the EPA. Investigative reporters uncovered that in 13 of these cases co-litigators included companies that had contributed significant amounts of money to Pruitt and/or Pruitt-affiliated political action committees (PACs). He also routinely joins lawsuits against other states. For example, Pruitt and five other Attorneys General challenged a California law banning the sale of eggs laid by hens living in cramped conditions, but a US District Judge ruled they lacked legal standing because they were representing the economic interests of a few industrial egg producers rather than the interests of their broader constituents.
Several such lawsuits are still pending, which legal experts and others claim presents a conflict of interest should Pruitt become the new Director of the EPA. When asked specifically about this issue during Senate confirmation hearings, Pruitt refused to recuse himself from the lawsuits, saying he would leave such a decision up to the EPA’s legal counsel team. Notably, across the course of his six-years as AG, Pruitt’s office has distributed more than 700 news releases announcing the office’s actions, his speeches and public appearances, and efforts to challenge federal regulations. More than 50 of these releases promoted the office’s efforts to sue the EPA, but not once has a release described actions the office has taken to enforce environmental laws or to hold violators accountable for their actions.
Potential Conflicts of Interest
In OK, Pruitt has made many choices, that when viewed together, strongly suggest that his loyalties reside with the industries that have donated hundreds of thousands of dollars to his election campaigns rather than with the people he is sworn to protect. Here is a short list of the most troubling examples:
Pruitt’s predecessor had filed suit against Tyson, Cargill, and a number of other poultry producers in OK due to inappropriate disposal of an estimated 300,000 tons of animal waste per year, which was causing toxic algae blooms along the Illinois River. But shortly after his election, Pruitt dropped the case, citing a need for more research. Some have questioned whether his decision was impacted by the fact that the poultry industry had donated at least $40,000 to his campaign that year.
In 2013, he created a coalition of 9 Attorneys General, major energy CEOs, and their lawyers and brought them all to OK for a strategizing session regarding how to stop government and citizen responses to the ills of the oil and gas industry; it was an all-expenses paid event funded by Mercatus, a right-wing think tank favored by the Koch brothers.
Notably, the energy industry is Pruitt’s second largest campaign contributor. When he came up for re-election in 2013, he chose Harold Hamm (CEO of Continental Resources, one of the largest oil companies in OK) to co-chair his campaign. Shortly after winning reelection in 2014, Pruitt joined forces with key industry players including Oklahoma Gas and Electric and the Domestic Energy Producers Alliance (chaired by Hamm) to file several antiregulatory lawsuits, which include attempts to block the Clean Power Plan and Waters of the US rule.
Pruitt has also served as leader of the Republican Association of Attorneys General, which has collected at least $4.2 million in donations from fossil-fuel related companies since 2013.
Recently, local investigative reporters discovered that Pruitt’s office failed to follow a state law requiring state agencies to disclose spending on outside attorneys. Their examination illuminated that Pruitt has spent more than $1 million on legal fees since FY2012 – a total that does not include costs directly related to lawsuits against the EPA or the Affordable Care Act.
Induced-Seismicity and Wastewater Disposal
Map of Oklahoma Class II Injection Wells and Volumes 2011 to 2015 (Barrels). Click image to explore a full screen, dynamic map.
Oklahoma recently became the earthquake capital of the world due to a phenomenon referred to as injection-induced seismicity. While OK has not historically been known as a seismically active area, thousands of tremors have shaken the state since the shale gas boom began.
Several researchers have used geospatial analysis to demonstrate how these quakes are caused by the high-pressure injection of oil and gas industry wastes such as the flowback and produced water created by the unconventional oil and gas production process known as hydraulic fracturing. The map above shows where injection wells (tan dots) are located and where earthquakes (green dots) occurred from 2011-2015.
Oklahomans have been harmed by the implicitly pro-fracking stance Pruitt has taken, as evidenced by his lack of action regarding induced seismicity – as well as air, water, and soil contamination due to oil and gas industry activities. Several people, including Johnson Bridgewater (Director of OK Chapter of the Sierra Club) have noted that:
There are various places where the attorney general’s office could have stepped in to fix this overall problem…Its job is to protect citizens. Other states were proactive and took these issues on…[yet] Pruitt has been completely silent in the face of a major environmental problem for the state and its taxpayers.
Specifically, the AG’s office could have responded to the legal question of whether the state could limit or ban transport of fracking-related wastewater, sent by other states for disposal in underground injection wells in OK.
He also did nothing to address the phenomenally low earthquake insurance claim approval rate; after the 5.8M quake shook Pawnee in September of 2016, 274 earthquake damage claims were filed but only 4 paid out. Estimates of statewide approval rates generally suggest that approximately 1% of claimants receive funds to aid repairs.
Lastly, there are a number of class action lawsuits against a variety of industry actors regarding earthquake damages, yet Pruitt’s office has not entered any of these as an intervenor even though AGs in other states have done so.
Pruitt not at fault?
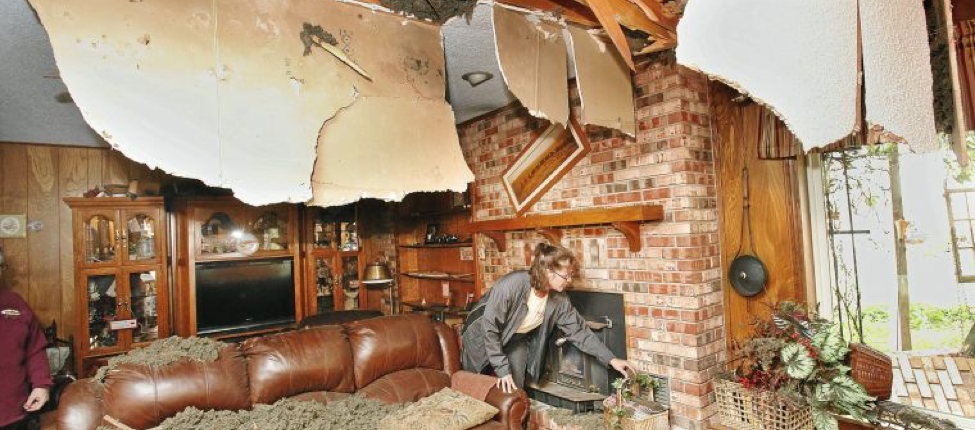
Earthquake damage. Photo Credit: Jim Beckel/The Oklahoman
Pruitt was recently called out by investigative reporters who used open-records requests to reveal that letters, briefs, and lawsuits that he submitted were written in whole or in part by leading energy firms such as Devon (another of OK’s largest oil and gas companies). Pruitt’s response was that he had done nothing wrong, nothing even potentially problematic. Rather, he said, of course he was working closely with industry and isn’t that what he should be doing. Some would argue that as AG what he should be doing is working closely with the people of Oklahoma, especially those whose homes, lives, and livelihoods have crumbled under the weight of attempting to repair earthquake damage due to industry activities.
Historical AG Influence
It is important to remember, though, that what’s happening with Pruitt is not isolated. Rather, as several long-time reporters have noted, increased attention to developing beneficial relationships with AGs is a result of historical processes.
About 20 years ago more than 40 state AGs banded together to challenge the tobacco industry, which led to a historic $206 billion settlement decision. Later, Microsoft, the pharmaceutical industry, and the financial services industry each faced similar multistate challenges regarding the legality or illegality of particular business practices.
As some AGs began hiring outside law firms to investigate and sue corporations, industry leaders realized that AGs’ actions were far more powerful and immediate than those of legislative bodies. So, they began a heretofore unprecedented campaign to massively increase their influence at this level.
Several people have critiqued the ways in which such actions undermine democratic processes, prompt troubling questions about ethics, and negatively impact attorney generals’ abilities to fulfill their duties to the state and its residents.
A Mission at Risk
Those of us on the frontlines here in OK have seen just how powerful such coalitions can be, how much sway they can have on local and state officials, how they destabilize people’s faith and trust in the systems that are supposed to protect them, and how coalitions undercut people’s hope and desire to be civically engaged. The mission of the US Environmental Protection Agency is to protect human health and the environment. If confirmed to lead the EPA, it is very likely Pruitt will prioritize his relationships with industry over the health and welfare of the people and environment he’s directed to protect.
Footnotes
To learn more about induced seismicity read an exclusive FracTracker two-part series from former VTSO researcher Ariel Conn: Part I and Part II. Additionally, the USGS has created an Induced Earthquakes landing page as part of their Earthquake Hazards Program.
https://www.fractracker.org/a5ej20sjfwe/wp-content/uploads/2017/01/Pruitt-Feature.jpg400900Guest Authorhttps://www.fractracker.org/a5ej20sjfwe/wp-content/uploads/2025/09/2025-Wordmark-Logo.pngGuest Author2017-01-23 10:15:082021-04-15 15:03:49“Polluting Pruitt:” A Wolf to Guard the Hen House?
By Ted Auch, Great Lakes Program Coordinator, FracTracker Alliance In collaboration with Caleb Gallemore, Assistant Professor in International Affairs, Lafayette University
The September 3rd magnitude 5.8 earthquake in Pawnee, Oklahoma, is the most violent example of induced seismicity, or “man-made” earthquakes, in U.S. history, causing Oklahoma governor Mary Fallin to declare a state of emergency. This was followed by a magnitude 4.5 earthquake on November 1st prompting the Oklahoma Corporation Commission (OCC) and U.S. EPA to put restrictions on injection wells within a 10-mile radius of the Pawnee quake.
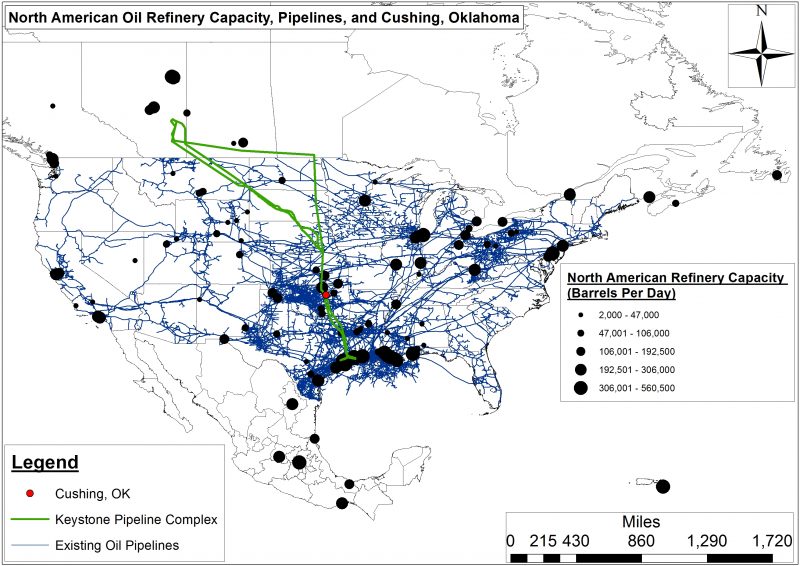
And then on Sunday, November 6th, a magnitude 5.0 earthquake shook central Oklahoma about a mile west of the Cushing Hub, the largest commercial crude oil storage center in North America capable of storing 54 million barrels of crude. This is the equivalent of 2.8 times the U.S. daily oil refinery capacity and 3.1 times the daily oil refinery capacity of all of North America. This massive hub in the North American oil landscape also happens to be the southern terminus of the controversial Keystone pipeline complex, which would transport 590,000 barrel per day over more than 2,000 miles (Fig. 1). Furthermore, this quake demonstrated the growing connectivity between Class II injection well associated induced seismicity and oil transport/storage in the heart of the US version of Saudi Arabia’s Ghawar Oil Fields. This increasing connectivity between O&G waste, production, and processing (i.e., Hydrocarbon Industrial Complex) will eventually impact the wallets of every American.
Figure 1. The Keystone Pipeline would transport 590,000 bpd over more than 2,000 miles.
This latest earthquake caused Cushing schools to close. Magellan Midstream Partners, the major pipeline and storage facility operator in the region, also shut down in order to “check the integrity of our assets.” Compounding concerns about induced seismicity, the Cushing Hub is the primary price settlement point for West Texas Intermediate that, along with Brent Crude, determines the global price of crude oil and by association what Americans pay for fuel at the pump, at their homes, and in their businesses.
Given the significant increase in seismic activity across the U.S. Great Plains, along with the potential environmental, public health, and economic risks at stake, we thought it was time to compile an inventory of Class II injection well volumes. Because growing evidence points to the relationship between induced seismicity and oil and gas waste disposal, our initial analysis focuses on Oklahoma and Kansas. The maps and the associated data downloads in this article represent the first time Class II injection well volumes have been compiled in a searchable and interactive fashion for any state outside Ohio (where FracTracker has compiled class II volumes since 2010). Oklahoma and Kansas Class II injection well data are available to the public, albeit in disparate formats and diffuse locations. Our synthesis makes this data easier to navigate for concerned citizens, policy makers, and journalists.
Induced Seismicity Past, Present, and Future
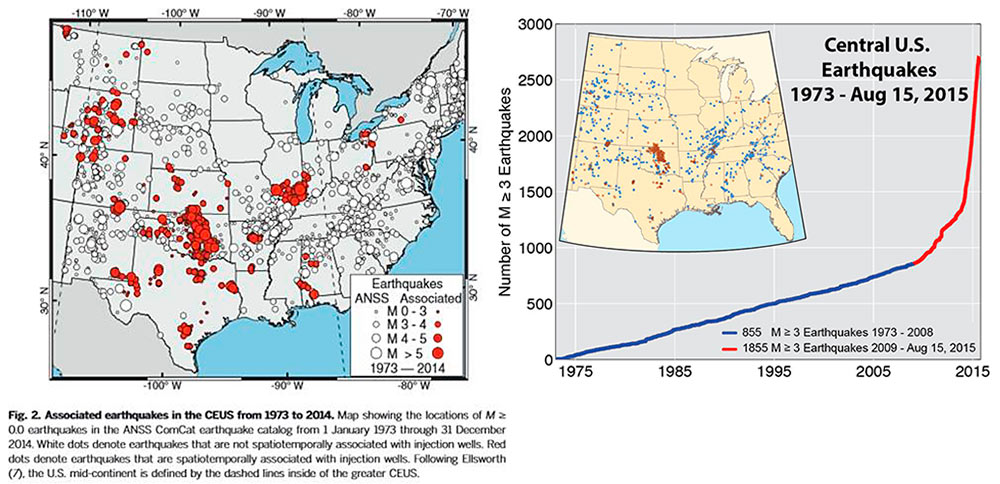
Figure 2. Central U.S. earthquakes 1973-August 15, 2015 according to the U.S. Geological Survey (Note: Based on our analysis this exponential increasing earthquakes has been accompanied by a 300 feet per quarter increase in the average depth of earthquakes across Oklahoma, Kansas, and Texas).
Oklahoma, along with Arkansas, Kansas, Ohio, and Texas, is at the top of the induced seismicity list, specifically with regard to quakes in excess of magnitude 4.0. However, as the USGS and Virginia Tech Seismological Observatory (VTSO)[1] have recently documented, an average of only 21 earthquakes of magnitude 3.0 or greater occurred in the Central/Eastern US between 1973 and 2008. This trend jumped to an average of 99 between 2009 and 2013. In 2014 there were a staggering 659 quakes. The exponential increase in induced seismic events can be seen in Figure 2 from a recent USGS publication titled “High-rate injection is associated with the increase in U.S. mid-continent seismicity,” where the authors note:
“An unprecedented increase in earthquakes in the U.S. mid-continent began in 2009. Many of these earthquakes have been documented as induced by wastewater injection…We find that the entire increase in earthquake rate is associated with fluid injection wells. High-rate injection wells (>300,000 barrels per month) are much more likely to be associated with earthquakes than lower-rate wells.”
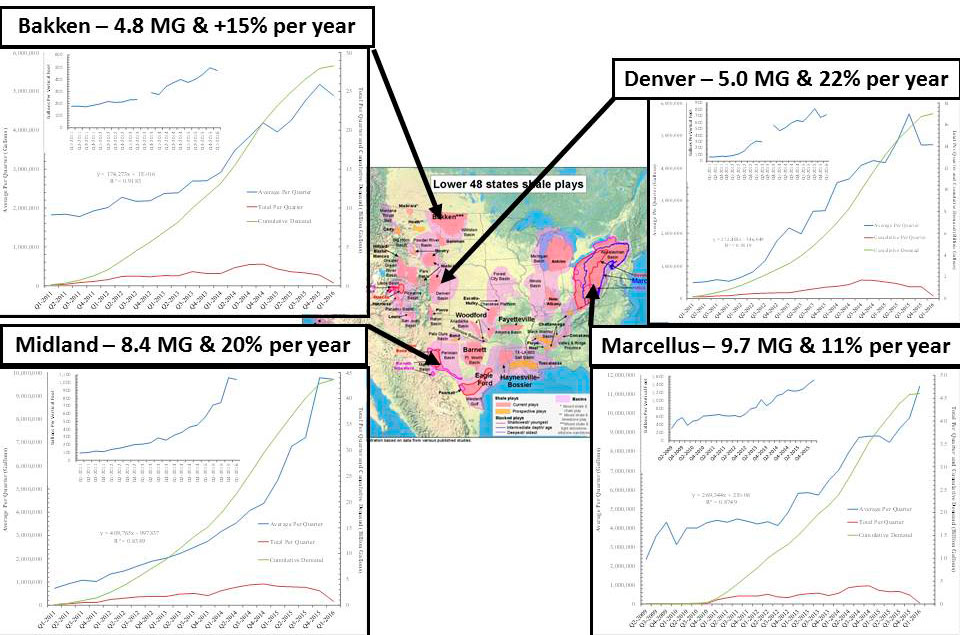
Figure 3. Average freshwater demand per hydraulically fractured well across four U.S. shale plays and the annual percent increase in each of those plays.
This trend suggests that induced seismicity is the new normal and will likely increase given that: 1) freshwater demand per hydraulically fractured well is rising all over the country, from 11-15% per year in the Marcellus and Bakken to 20-22% in the Denver and Midland formations, 2) the amount of produced brine wastewater parallels these increases almost 1-to-1, and 3) the unconventional oil and gas industry is using more and more water as they begin to explore the periphery of primary shale plays or in less productive secondary and tertiary plays (Fig. 3).
Oklahoma
The September, 2016, Pawnee County Earthquake
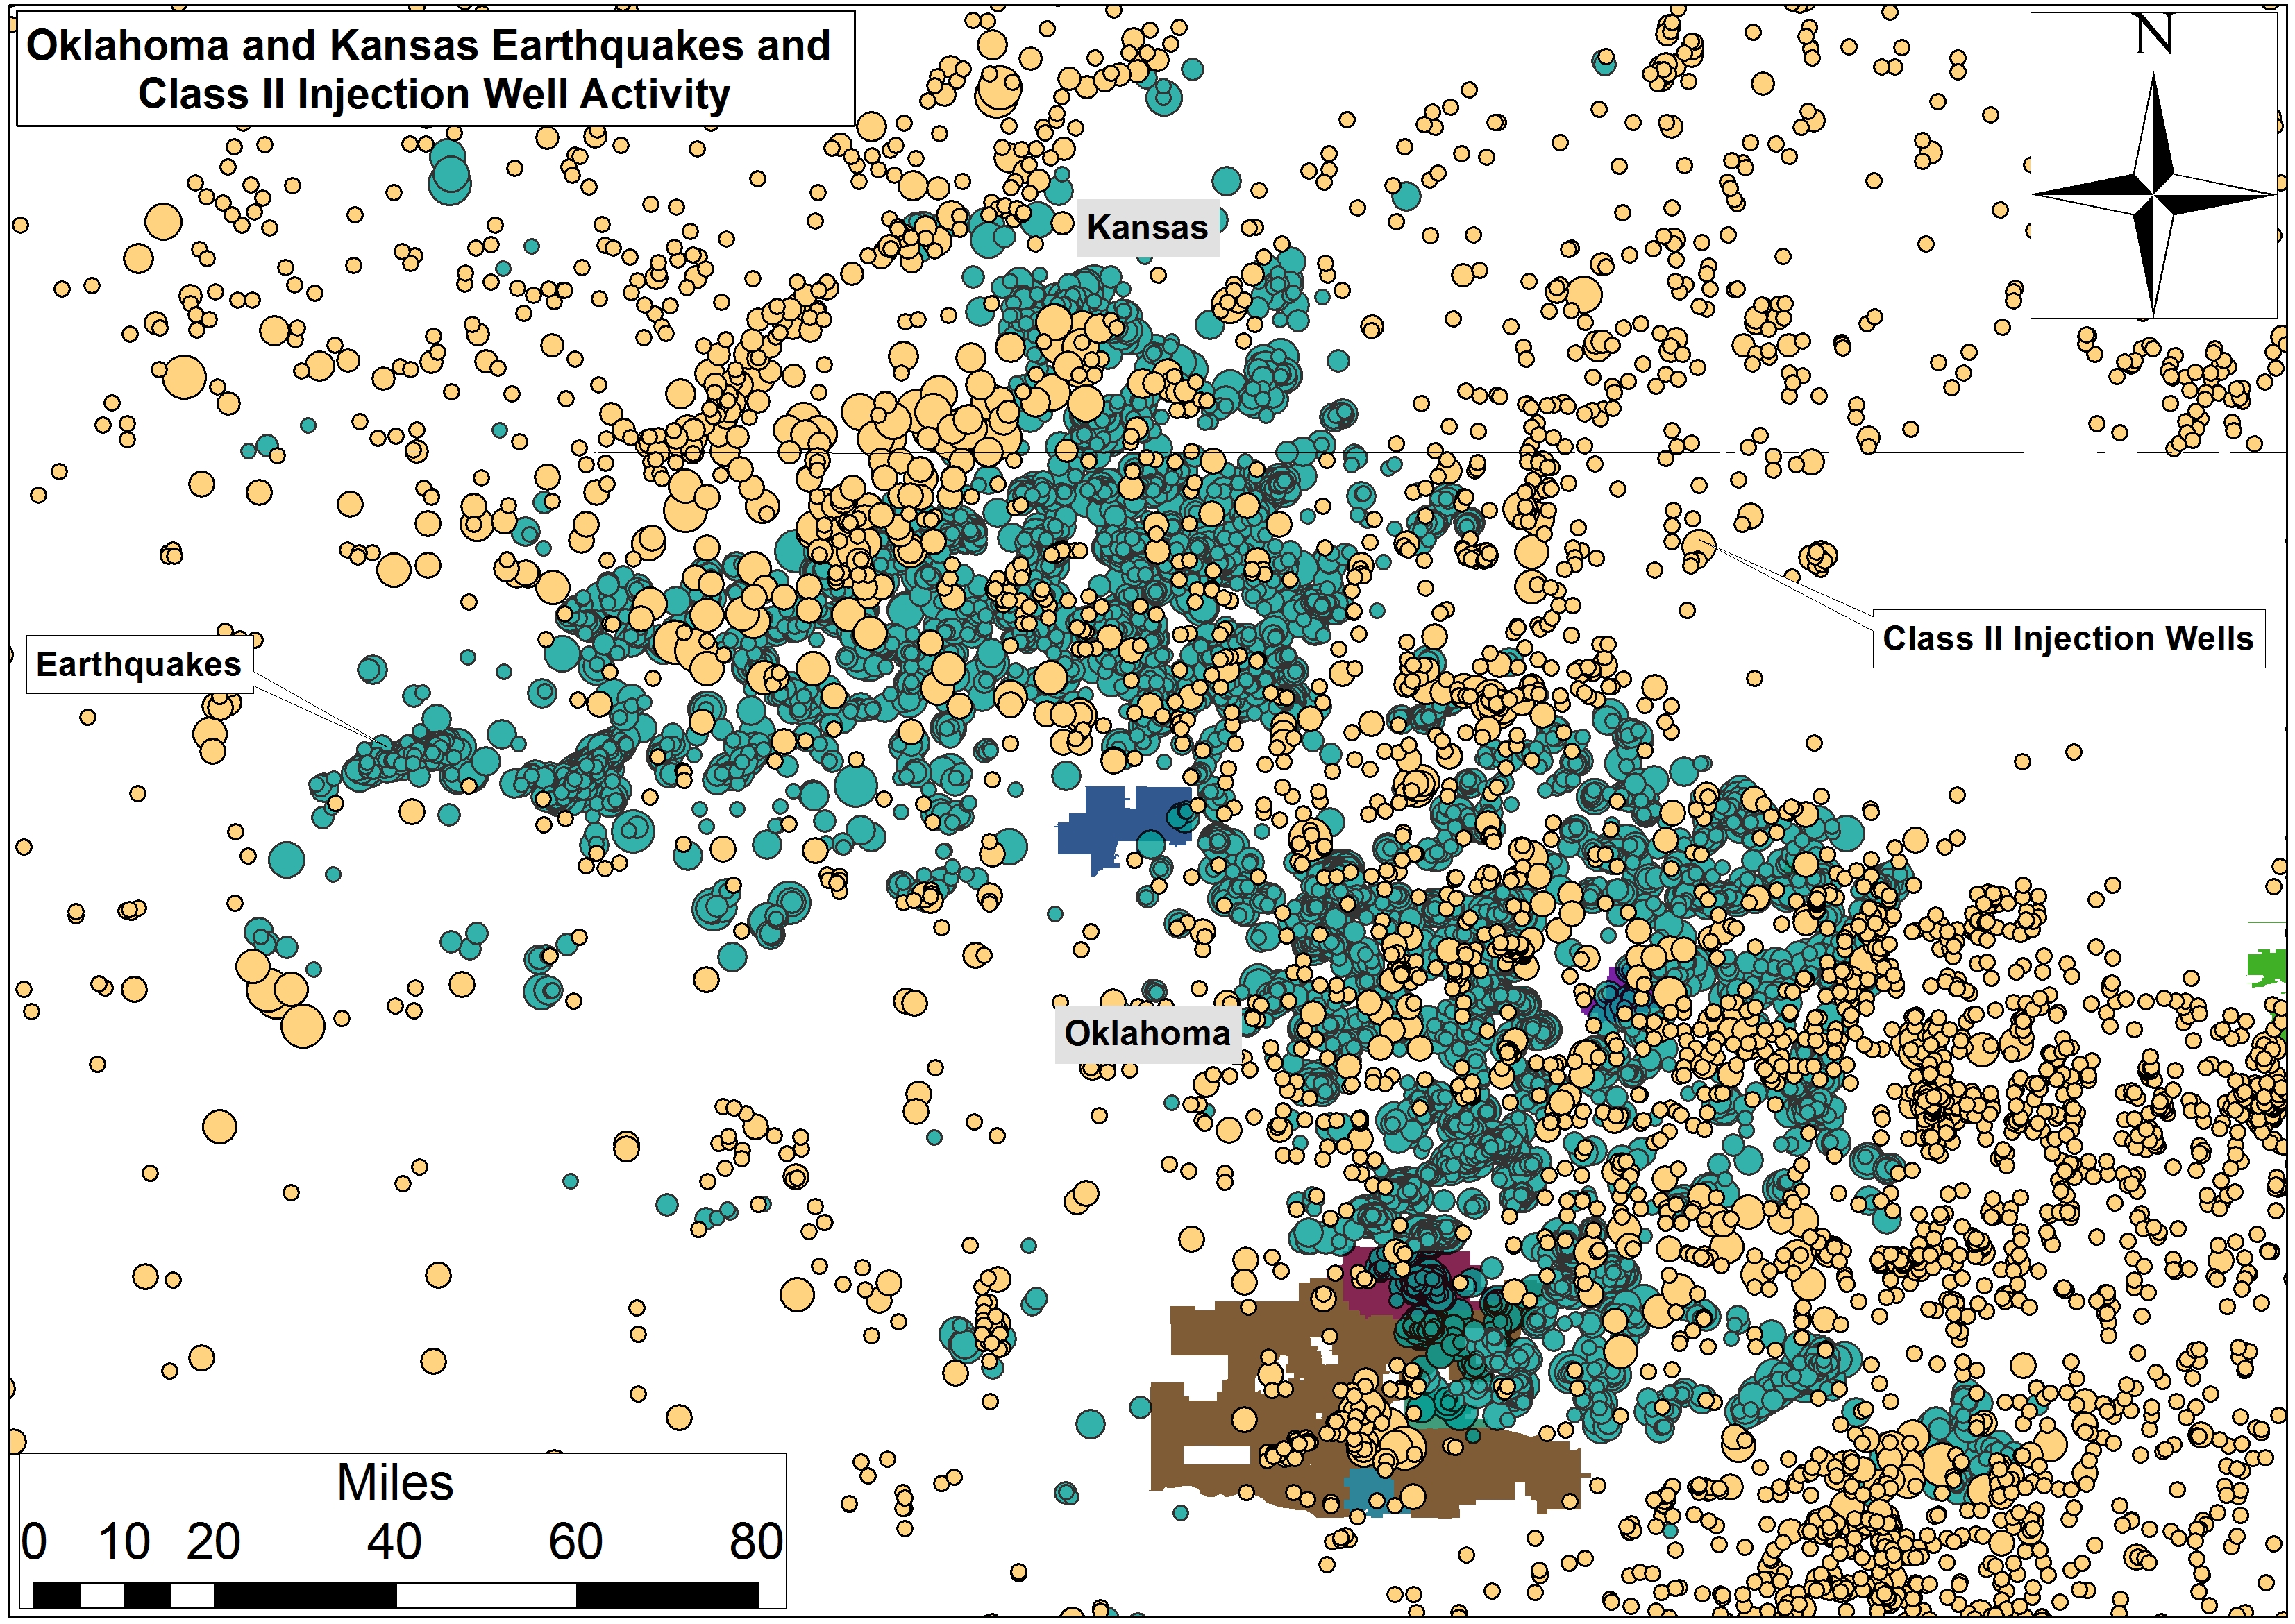
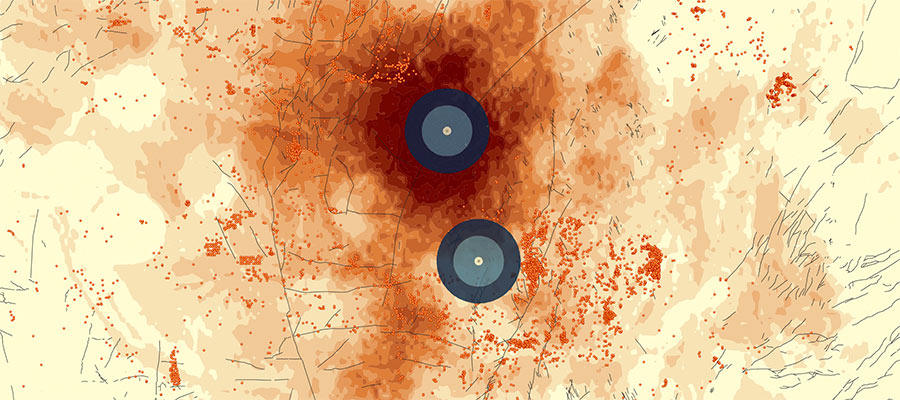
This first map focuses on the September, 2016 Pawnee, OK Magnitude 5.8 earthquake that many people believe was caused by injecting high volume hydraulic fracturing (HVHF) waste into class II injection wells in Oklahoma and Kansas. This map includes all Oklahoma and Kansas Class II injection wells as well as Oklahoma’s primary geologic faults and fractures.
Oklahoma and Kansas Class II injection wells and geologic faults
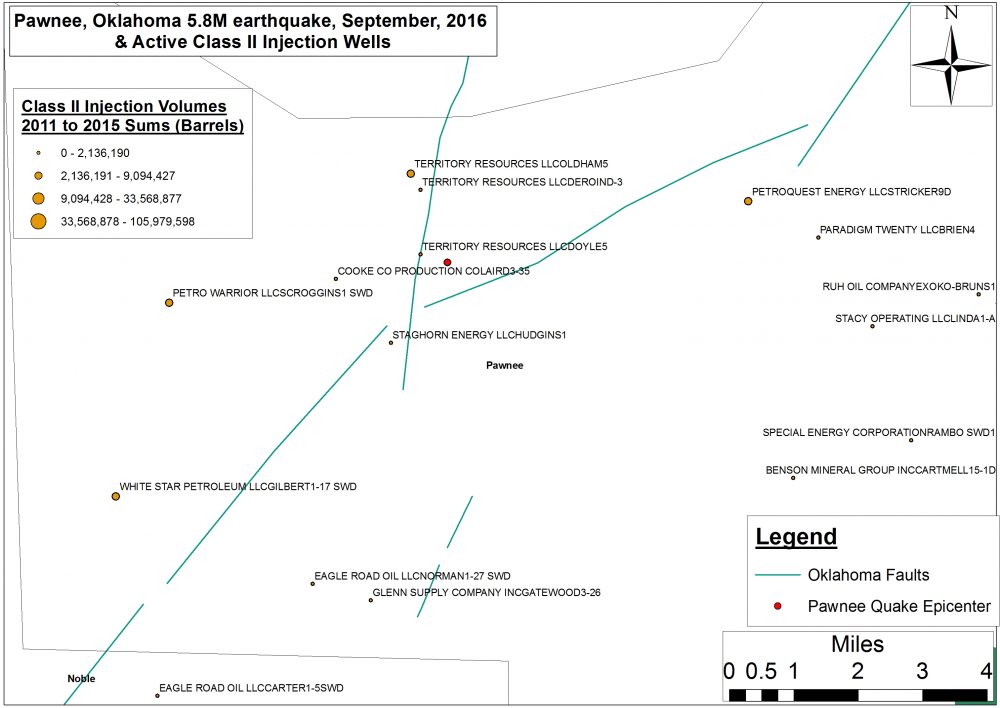
Figure 4. The September, 2016 Pawnee, Oklahoma 5.8M earthquake, neighboring active Class II injection wells, underlying geologic faults and fractures.
Of note on this map is the geological connectivity across Oklahoma resulting from the state’s 129 faults and fractures. Also present are several high volume wells including Territory Resources LLC’s Oldham #5 (1.45 miles from the epicenter, injecting 257 million gallons between 2011 and 2014) and Doyle #5 wells (0.36 miles from the epicenter, injecting 61 million gallons between 2011 and 2015), Staghorn Energy LLC’s Hudgins #1 well (1.43 miles from the epicenter, injecting 11 million gallons between 2011 and 2015 into the Red Fork formation), and Cooke Co Production Co.’s Laird #3-35 well (1.41 miles from the epicenter, injecting 6.5 million gallons between 2011 and 2015). Figure 4 shows a closeup view of these wells relative to the location of the Pawnee quake.
Class II Salt Water Disposal (SWD) Injection Well Volumes
This second map includes annual volumes of disposed wastewater across 10,297 Class II injection wells in Oklahoma between 2011 and 2015 (Note: 2015 volumes also include monthly totals). Additionally, we have included Oklahoma’s geologic faults and fractures for context given the recent uptick in Oklahoma and Kansas’ induced seismicity activity.
Annual volumes of class II injection wells disposal in Oklahoma (2011-2015)
Maximum volume to date (for a single Class II injection well): 105,979,598 barrels, or 4,080,214,523 gallons (68,003,574 gallons per month), for the New Dominion, LLC “Chambers #1” well in Oklahoma County.
Total Volume to Date: 10,655,395,179 barrels or 410,232,714,392 gallons (6,837,211,907 gallons per month).
Mean volume to date across the 10,927 Class II injection wells: approximately 975,144 barrels per well or 37,543,044 gallons (625,717 gallons per month).
This map also includes 632 Class II wells injecting waste into the Arbuckle Formation which is believed to be the primary geological formation responsible for the 5.0 magnitude last week in Cushing.
Below is an inventory of monthly oil and gas waste volumes (barrels) disposed across 4,555 Class II injection wells in Kansas between 2011 and 2015. This map will be updated in the Spring of 2017 to include 2016 volumes. A preponderance of this data comes from 2015 with a scattering of volume reports across Kansas between 2011 and 2014.
Monthly Class II injection wells volumes in Kansas (2011-2015)
Maximum volume to date (for a single Class II injection well): 9,016,471 barrels, or 347,134,134 gallons (28,927,845 gallons per month), for the Sinclair Prairie Oil Co. “H.J. Vohs #8” well in Rooks County. This is a well that was initially permitted and completed between 1949 and 1950.
Total Volume to date: 1,060,123,330 barrels or 40,814,748,205 gallons (3,401,229,017 gallons per month).
Mean volume to date across the 4,555 Class II injection wells: approximately 232,738 barrels per well or 8,960,413 gallons (746,701 gallons per month).
Table 1. Summary of Class II SWD Injection Well Volumes across Kansas and Oklahoma
Sum
Average
Maximum
No. of Class II
SWD Wells
Barrels
Sum To Date
Per Year
Sum To Date
Per Year
Kansas*
4,555
1.06 BB
232,738
…
9.02 MB
…
Oklahoma**
10,927
10.66 BB
975,143
195,029
105.98 MB
21.20 MB
* Wells in the counties of Barton (279 wells), Ellis (397 wells), Rooks (220 wells), Russell (199 wells), and Ness (187 wells) account for 29% of Kansas’ active Class II wells.
** Wells in the counties of Carter (1,792 wells), Creek (946 wells), Pontotoc (684 wells), Seminole (476 wells), and Stephens (1,302 wells) account for 48% of Oklahoma’s active Class II wells.
Conclusion
If the U.S. EPA’s Underground Injection Control (UIC) estimates are to be believed, the above Class II volumes account for 19.3% of the “over 2 billion gallons of brine…injected in the United States every day,” and if the connectivity between injection well associated induced seismicity and oil transport/storage continues to grow, this issue will likely impact the lives of every American.
Given how critical the Cushing Hub is to US energy security and price stability one could easily argue that a major accident there could result in a sudden disruption to fuel supplies and an exponential increase in “prices at the pump” that would make the 240% late 1970s Energy Crisis spike look like a mere blip on the radar. The days of $4.15 per gallon prices the country experienced in the summer of 2008 would again become a reality.
In sum, the risks posed by Class II injection wells and are not just a problem for insurance companies and residents of rural Oklahomans and Kansans, induced seismic activity is a potential threat to our nation’s security and economy.
[1] To learn more about Induced Seismicity read an exclusive FracTracker two-part series from former VTSO researcher Ariel Conn: Part I and Part II. Additionally, the USGS has created an Induced Earthquakes landing page as part of their Earthquake Hazards Program.
https://www.fractracker.org/a5ej20sjfwe/wp-content/uploads/2016/11/OK_KS_InjectionWellVolumes_header.jpg400900Ted Auch, PhDhttps://www.fractracker.org/a5ej20sjfwe/wp-content/uploads/2025/09/2025-Wordmark-Logo.pngTed Auch, PhD2016-12-21 09:00:152021-04-15 15:04:18Oklahoma and Kansas Class II Injection Wells and Earthquakes
Now, seismologists from around the country — including Oklahoma — are convinced that these earthquakes are the result of human activity, also known as induced or triggered seismicity. Yet many people, especially those in the oil industry, still refute such an argument. Just what is the science that has seismologists so convinced that the earthquakes are induced and not natural?
Hidden Faults
Over the last billion years (give or take a couple hundred million), colliding tectonic plates have created earthquake zones, just as we see today in California, Japan, Chile and Nepal. As geologic processes occurred, these zones shifted and moved and were covered up, and the faults that once triggered earthquakes achieved a state of equilibrium deep in the basement rocks of the earth’s crust. But the faults still exist. If the delicate balance that keeps these fault systems stable ever shifts, the ancient faults can still move, resulting in earthquakes. Because these inactive faults are so deep, and because they can theoretically exist just about anywhere, they’re incredibly difficult to map or predict – until an earthquake occurs.
Thanks to historic reports of earthquakes in the central and eastern United States, we know there are some regions, far away from tectonic plate boundaries, that occasionally experience large earthquakes. Missouri and South Carolina, for example, suffered significant and damaging earthquakes in the last 200 hundred years, yet these states lie nowhere near a plate boundary. We know that fault zones exist in these locations, but we have no way of knowing about dormant faults in regions of the country that haven’t experienced earthquakes in the last couple hundred years.
What is induced seismicity?
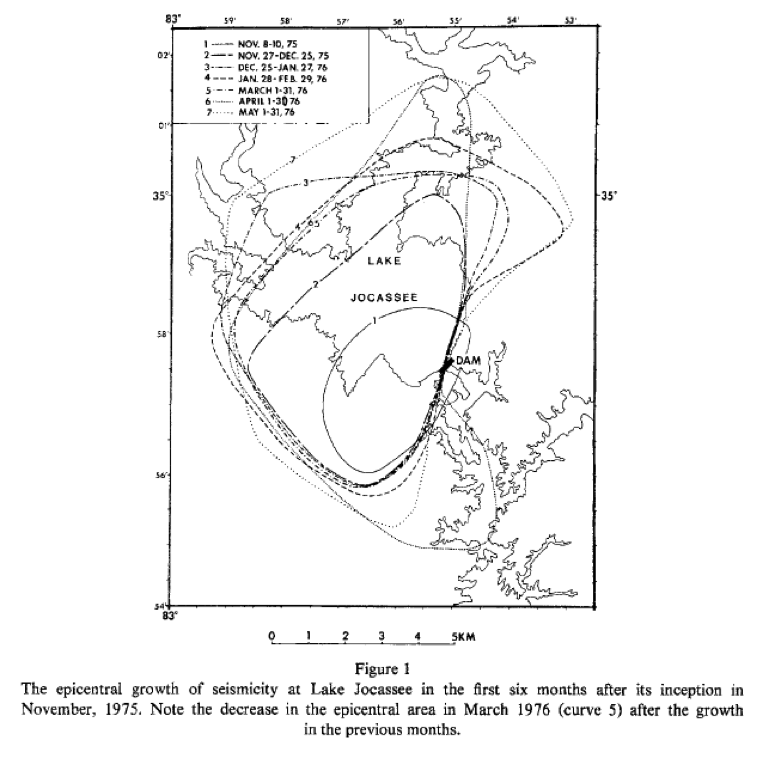
As early as the 1930s, seismologists began to suspect that extremely large volumes of water could impact seismic activity, even in those regions where earthquakes weren’t thought to occur. Scientists found that after certain reservoirs were built and filled with water, earthquake swarms often followed. This didn’t happen everywhere, and when it did, the earthquakes were rarely large enough to be damaging. These quakes were large enough to be felt, however, and they represented early instances of human activity triggering earthquakes.[1]
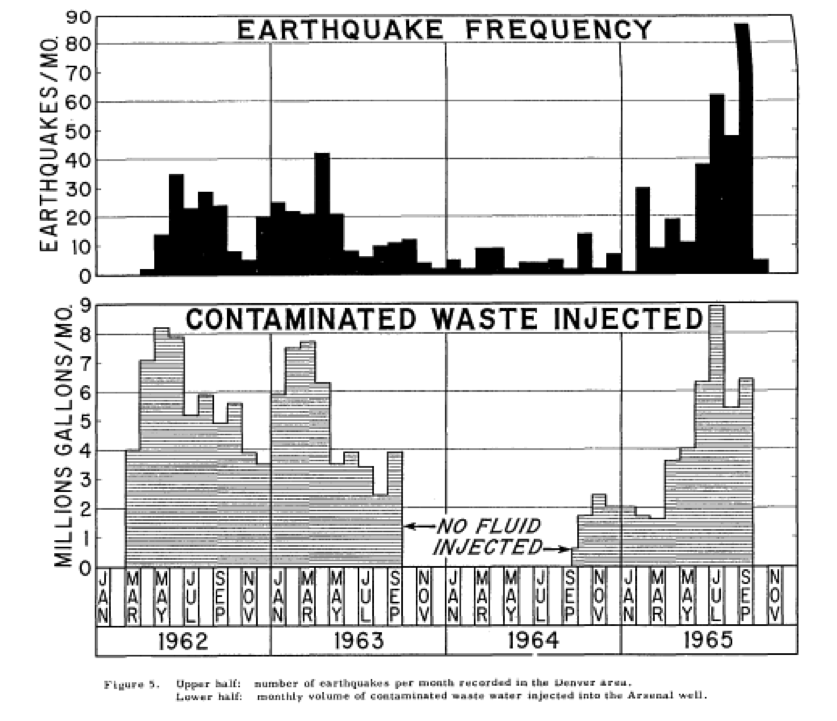
Research into induced seismicity really picked up in the 1960s. The most famous example of man-made earthquakes occurred as a result of injection well activity at the Rocky Mountain Arsenal. The arsenal began injecting wastewater into a disposal well 12,000 feet deep in March of 1962, and by April of that year, people were feeling earthquakes. Researchers at the arsenal tracked the injections and the earthquakes. They found that each time the arsenal injected large volumes of water (between 2 and 8 million gallons per month, or 47,000 to 190,000 barrels), earthquakes would start shaking the ground within a matter of weeks (Figure 1).
Figure 1. Rocky Mountain Arsenal fluid injection correlated to earthquake frequency
Figure 2. South Carolina experienced induced earthquakes after filling a reservoir
When the injections ended, the earthquakes also ceased, usually after a similar time delay, but some seismicity continued for a while. The well was active for many years, and the largest earthquake thought to be induced by the injection well actually occurred nearly a year and a half after injection officially ended. That earthquake registered as a magnitude 5.3. Scientists also noticed that over time, the earthquakes moved farther and farther away from the well.
Research at a reservoir in South Carolina produced similar results; large volumes of water triggered earthquake swarms that spread farther from the reservoir with time (Figure 2).
When people say we’ve known for decades that human activity can trigger earthquakes, this is the research they’re talking about.
Why now? Why Oklahoma?
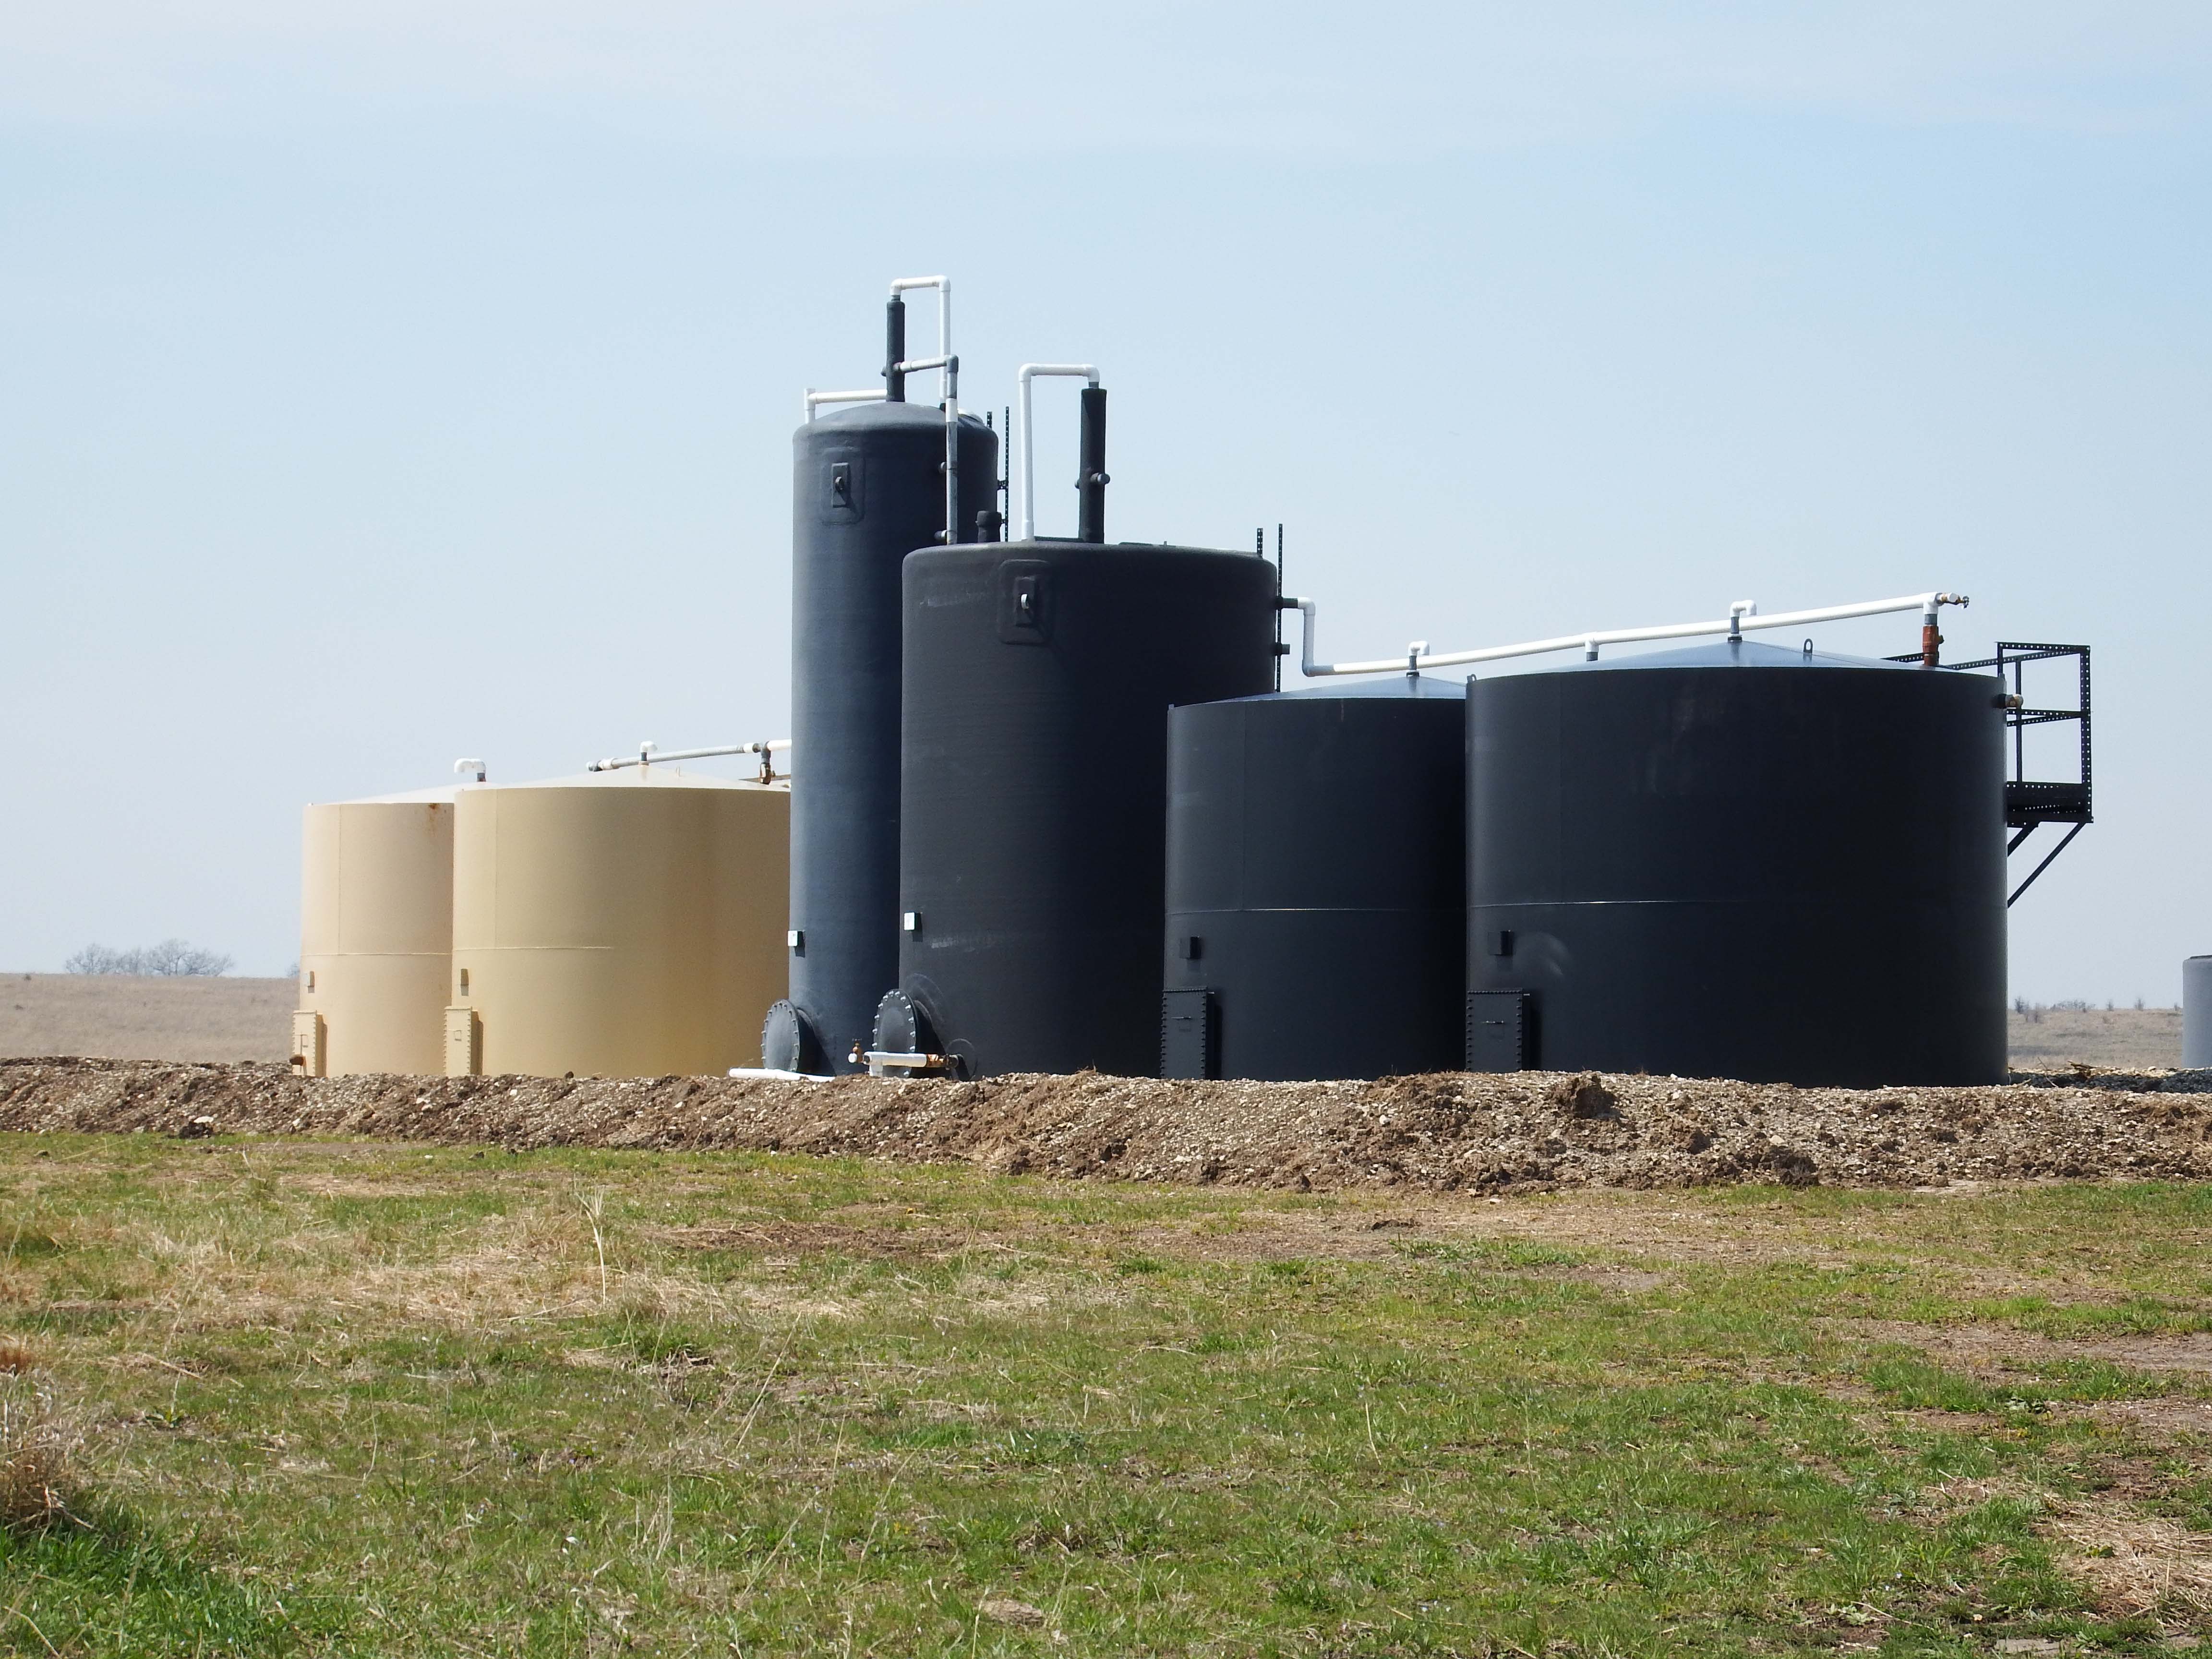
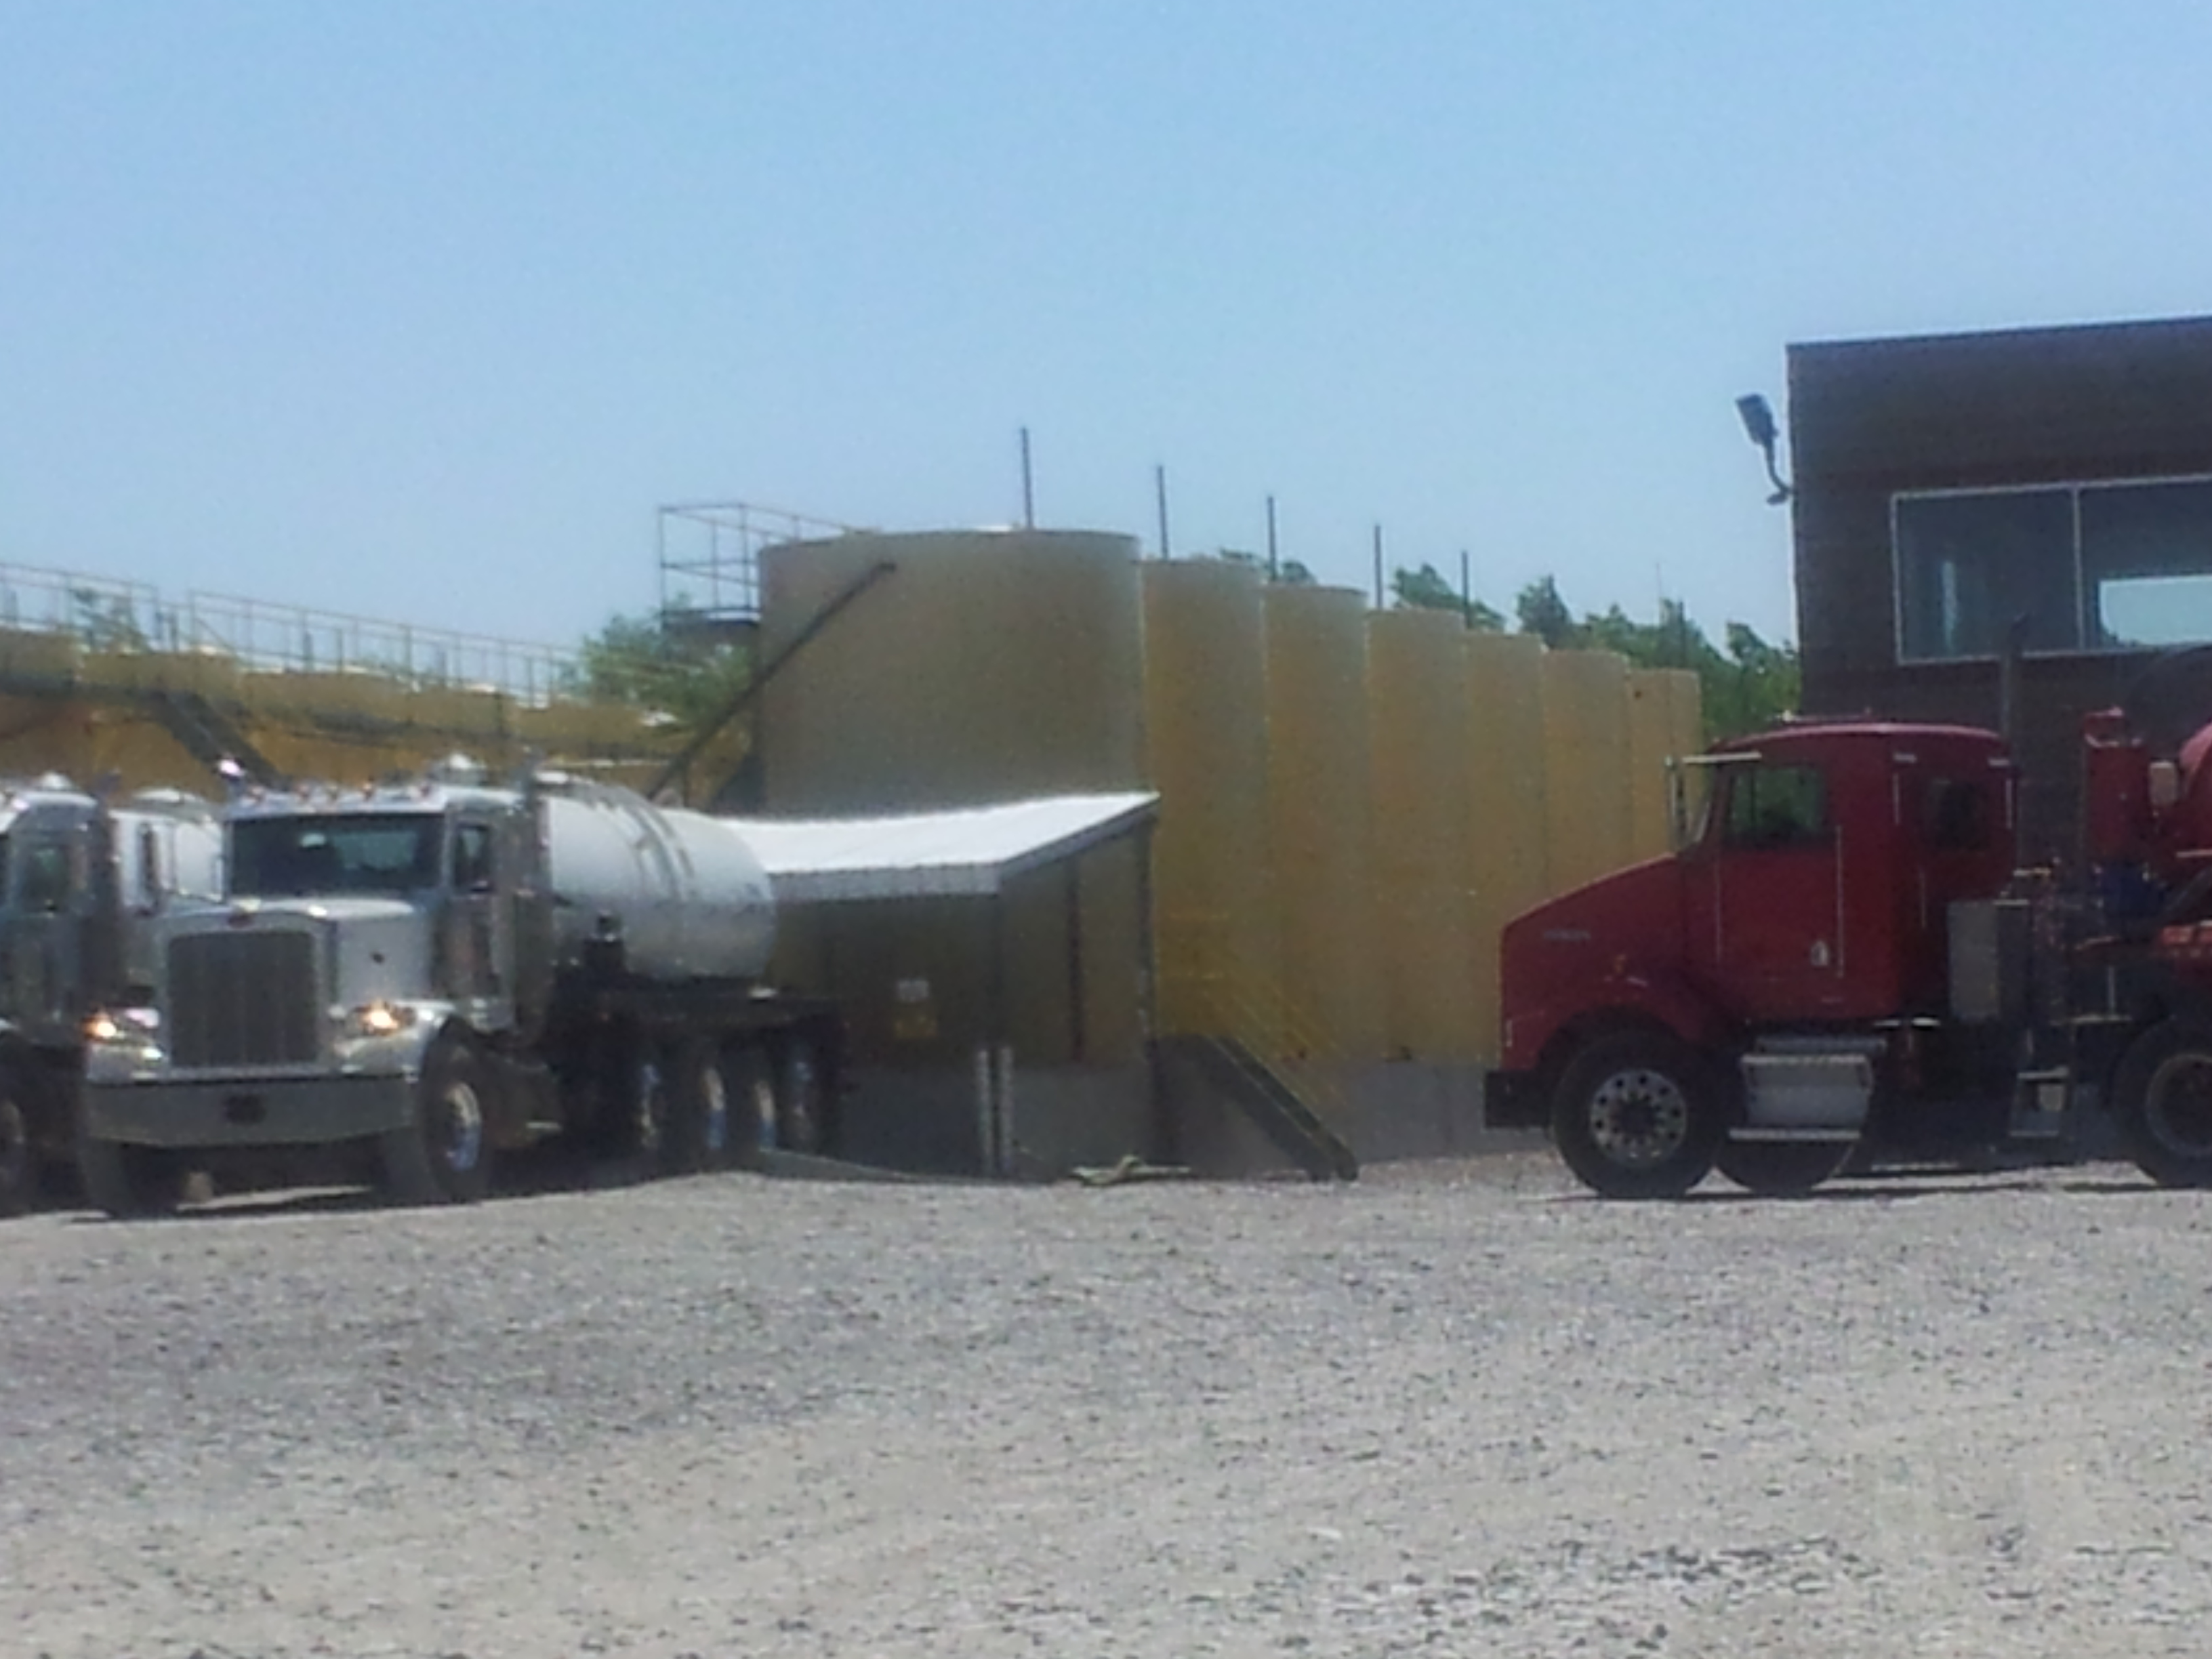
Injection Well in Ohio. Photo by Ted Auch
Seismologists have known conclusively and for quite a while that wastewater injection wells can trigger earthquakes, yet people have also successfully injected wastewater into tens of thousands of wells across the country for decades without triggering any earthquakes. So why now? And why in Oklahoma?
The short answers are:
At no point in history have we injected this much water this deep into the ground, and
It’s not just happening in Oklahoma.
One further point to clarify: General consensus among seismologists is that most of these earthquakes are triggered by wastewater disposal wells and not by hydrofracking (or fracking) wells. That may be a point to be contested in a future article, but for now, the largest induced earthquakes we’ve seen have been associated with wastewater disposal wells and not fracking. This distinction is important when considering high-pressure versus high-volume wells. A clear connection between high-pressure wells and earthquakes has not been satisfactorily demonstrated in our research at the Virginia Tech Seismological Observatory (VTSO) (nor have we seen it demonstrated elsewhere, yet). High-volume wastewater disposal wells, on the other hand, have been connected to earthquakes.
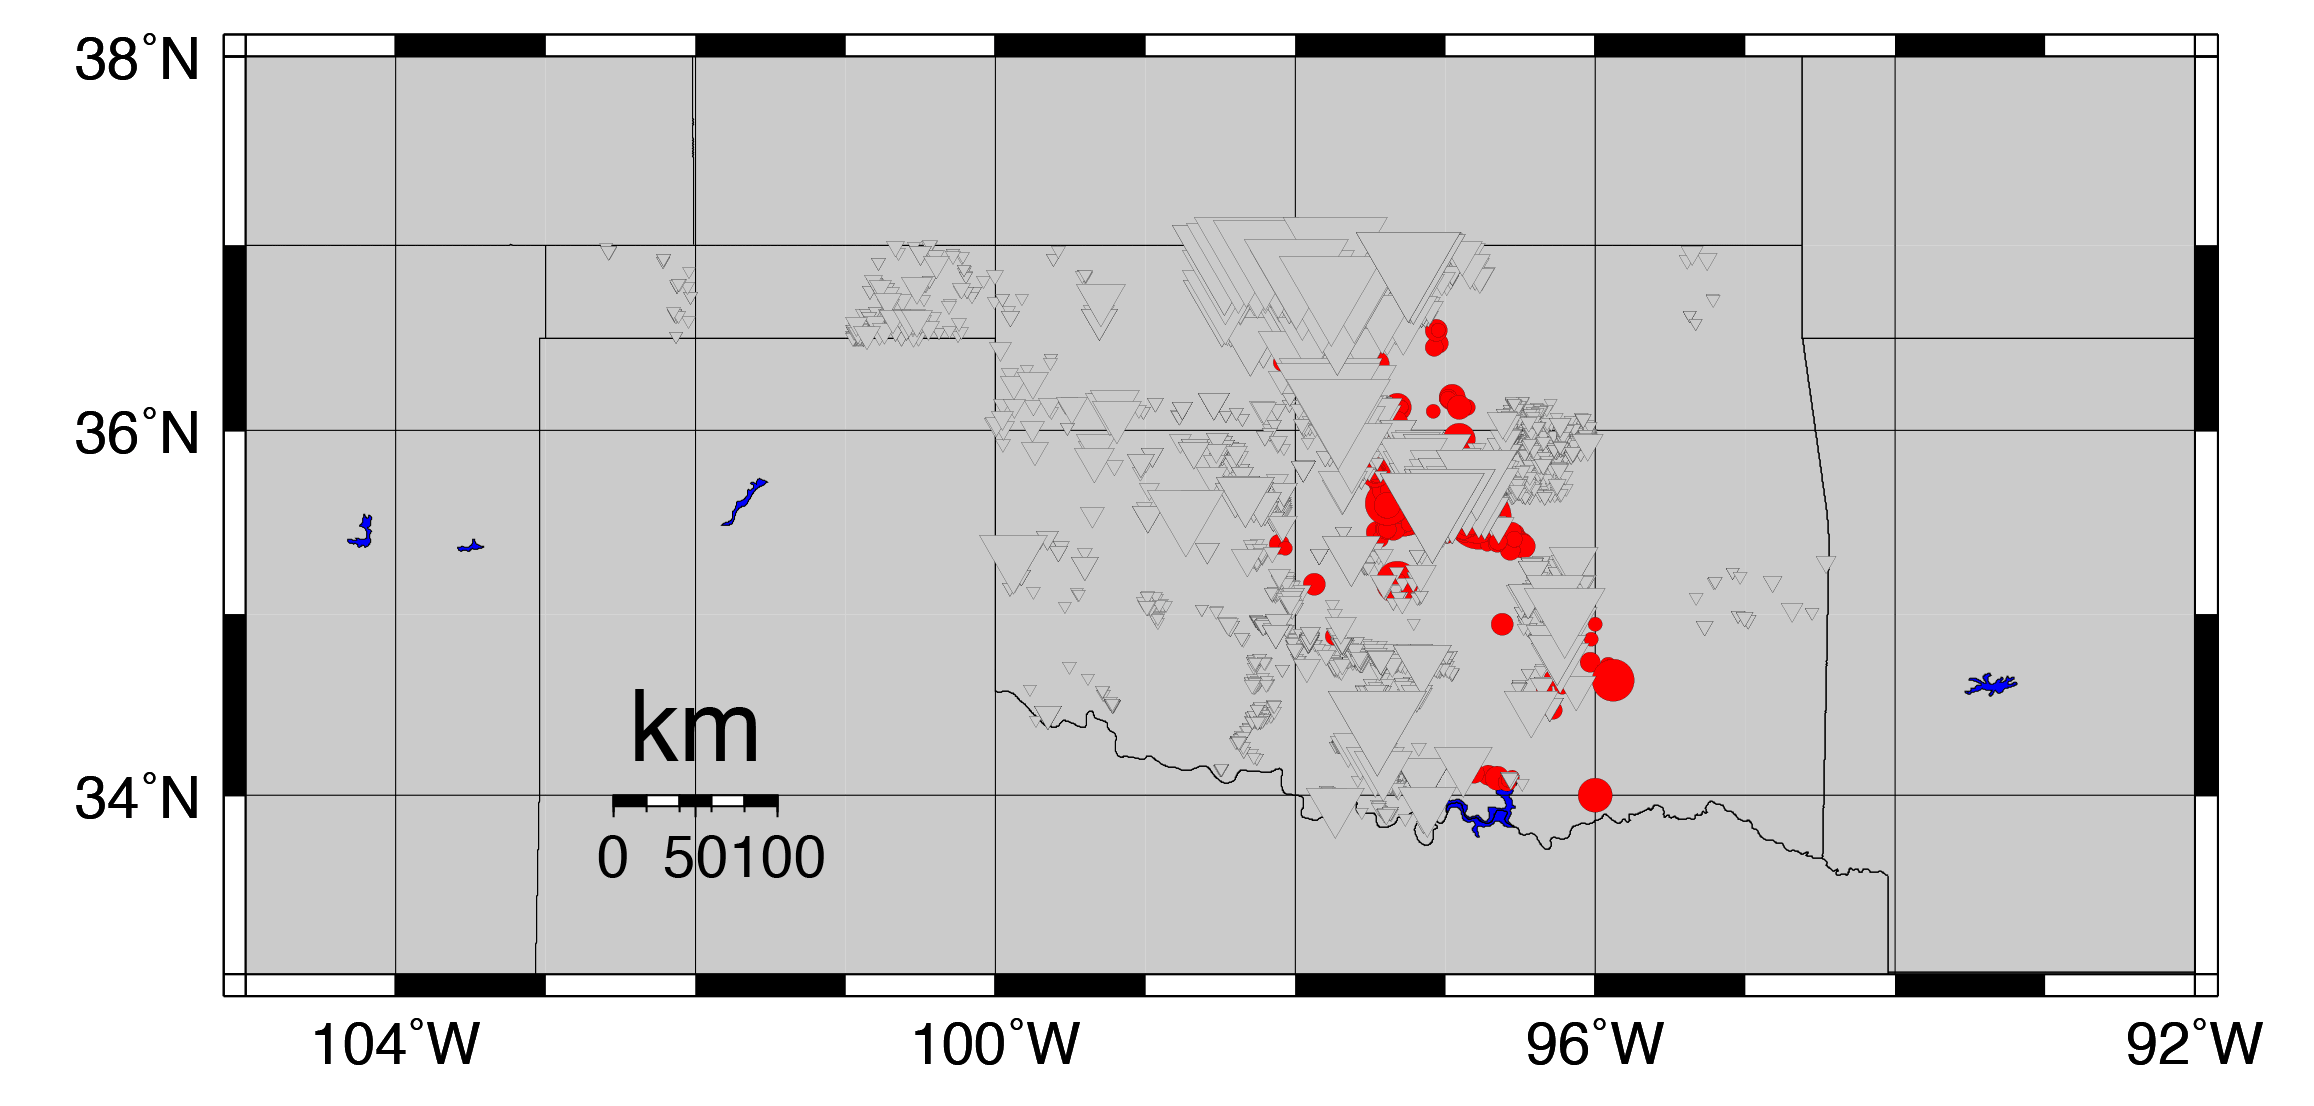
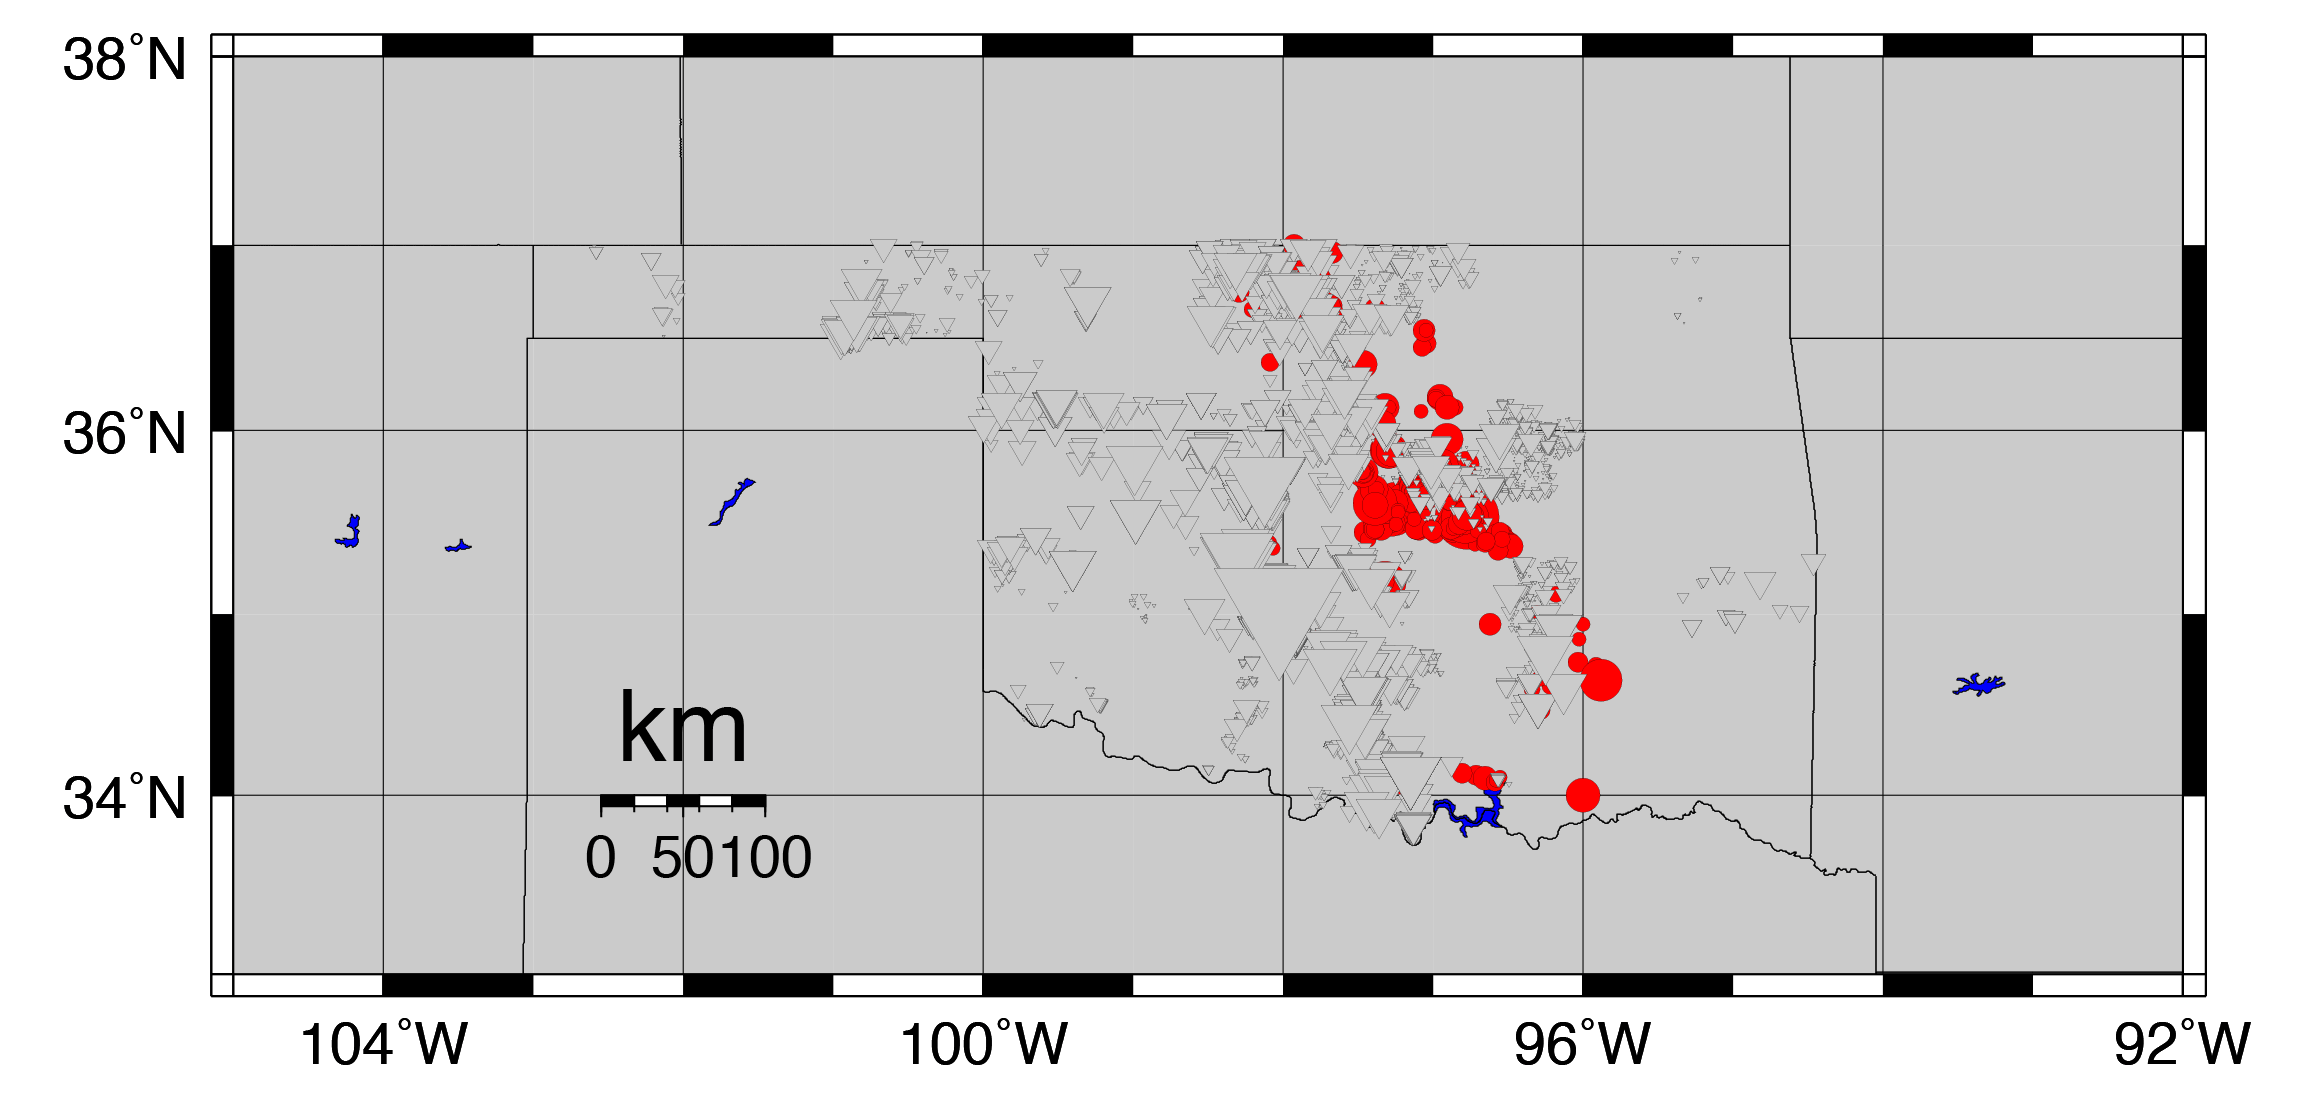
At the VTSO, we looked at about 8,000 disposal wells in Oklahoma that we suspected might be connected to induced seismicity. Of those, over 7,200 had maximum allowed injection rates of less than 10,000 barrels per month, which means the volume is low enough that they’re unlikely to trigger earthquakes. Of the remaining 800 wells, only 300 had maximum allowed injection rates of over 40,000 barrels per month — and up to millions of barrels per year for some wells. These maximum rates are on par with the injection rates seen at the Rocky Mountain Arsenal, and our own plots indicate a correlation between high-volume injection wells and earthquakes (Figure 3-4).
Figure 3. Triangles represent wastewater injection wells scaled to reflect maximum volume rates. Wells with high volumes are located near earthquakes.
Figure 4. Triangles represent wastewater injection wells scaled to reflect maximum pressure. Wells with high pressures are not necessarily near earthquakes.
This does not mean that all high-volume wells will trigger earthquakes, or that lower-volume wells are always safe, but rather, it’s an important connection that scientists and well operators should consider.
Starting in 2008 and 2009, with the big oil and gas plays in Oklahoma, a lot more fluid was injected into a lot more wells. As the amount of fluid injected in Oklahoma has increased, so too have the number of earthquakes. But Oklahoma is not the only state to experience this phenomenon. Induced earthquakes have been recorded in Arkansas, Colorado, Kansas, New Mexico, Ohio, West Virginia and Texas.
In the last four years, Arkansas, Kansas, Ohio and Texas have all had “man-made” earthquakes larger than magnitude 4, which is the magnitude at which damage begins to occur. Meanwhile, in that time period, Colorado experienced its second induced earthquake that registered larger than magnitude 5. Oklahoma may have the most induced and triggered earthquakes, but the problem is one of national concern.
[1] Induced seismicity actually dates back to the late 1800s with mining, but the connection to high volumes of fluid was first recognized in the 1930s. However, the extent to which it was documented is unknown.


