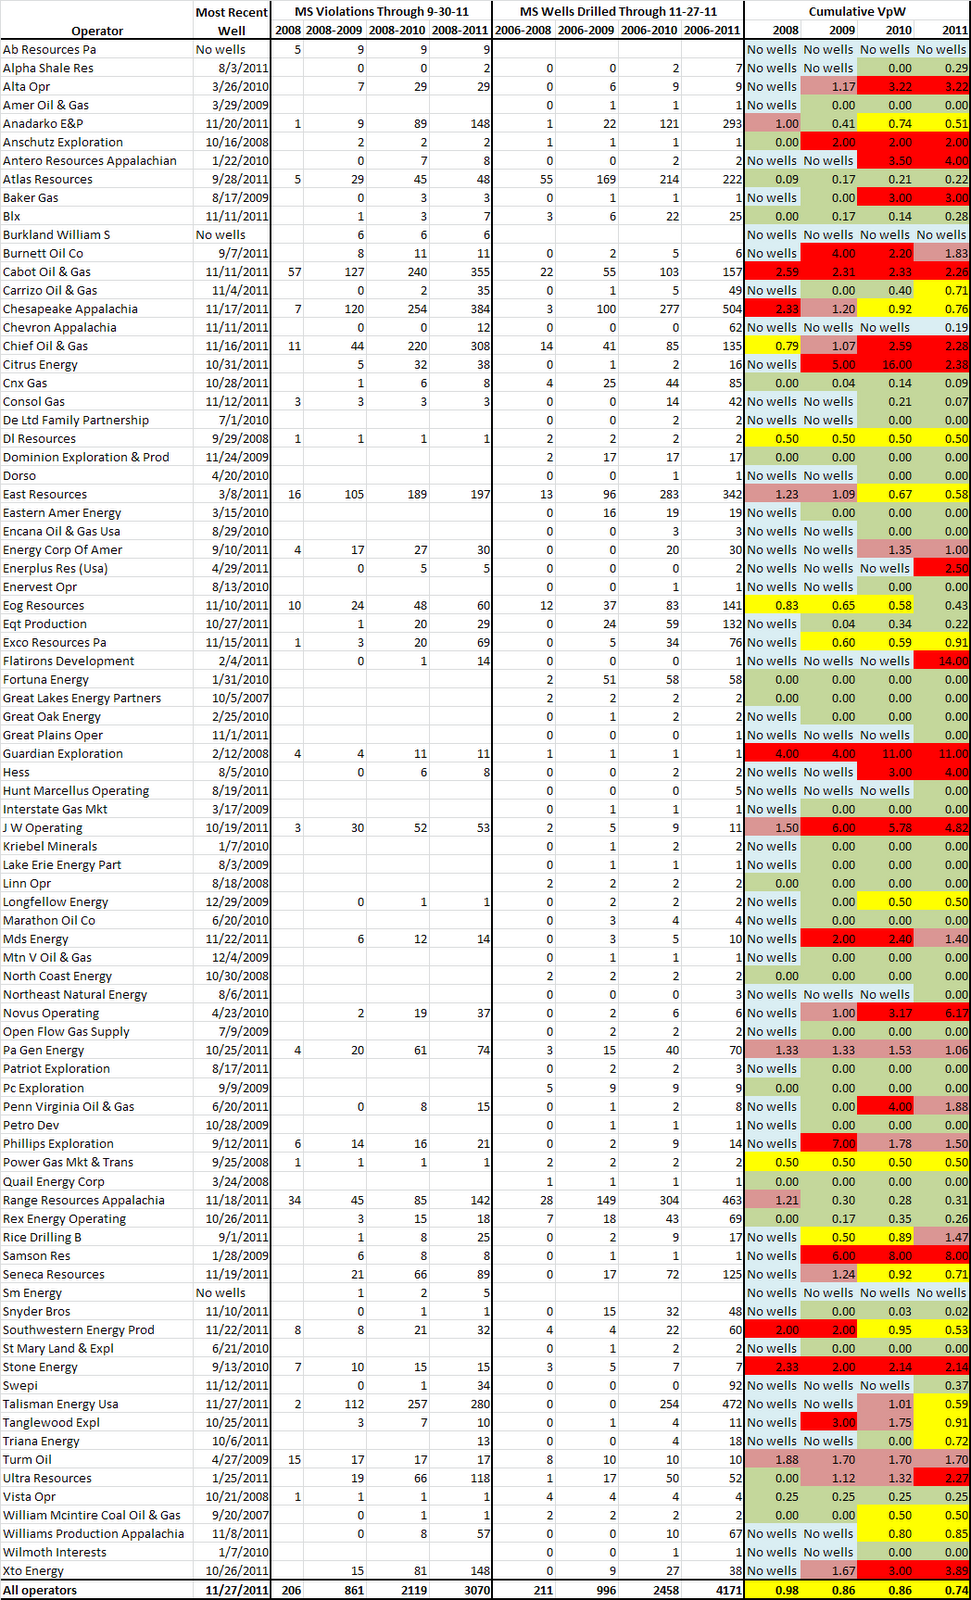
Tag Archive for: Pennsylvania

PA environment chief now must approve any shale-drilling citations

Repost from Philadelphia Inquirer

In an unprecedented policy shift, inspectors in Pennsylvania have been ordered to stop issuing violations against drillers without prior approval from Gov. Corbett’s new environmental chief.The change, ordered last week in response to complaints by the drilling industry and its supporters in the Pennsylvania legislature, dismayed ground-level staff in the Department of Environmental Protection and drew a chorus of outrage from environmental advocates. Read more.

May 3, 2011 Update: The DEP has completely rolled back the need for the chief’s approval prior to citing violations. Read more.

Municipal Level Census Data Now on FT’s DataTool

2010 Municipal Population in Pennsylvania (small)
Municipal level census data in Pennsylvania for the year 2010. Click the image to see a larger, dynamic snapshot.

Municipal level census data is now available to visualize or download from FracTracker’s DataTool. Categories of note include:

  • 2010 US Census count
  • 2000 US Census count
  • Net change from 2000 to 2010
  • Percent change from 2000 to 2010

Among other uses, this dataset allows for some basic explorations of how the Marcellus Shale industry affects communities throughout the Commonwealth.

Pennsylvania population and Marcellus Shale gas production by municipality. For information on a specific municipality, please zoom in and click the “i” button in the blue circle, then the map feature of your choice. Please click on the gray compass rose and double carat (^) to hide those menus.

Without doing any serious number crunching, this map shows that gas from the Marcellus Shale is being extracted in more sparsely populated areas of the state. Let’s take a closer look at Southwestern Pennsylvania.

Southwestern Pennsylvania population and Marcellus Shale gas production by municipality. For information on a specific municipality, please zoom in and click the “i” button in the blue circle, then the map feature of your choice. Please click on the gray compass rose and double carat (^) to hide those menus.

Note the ring of Marcellus Shale production around the heavily populated municipalities surrounding Pittsburgh.

We can also take a look to see whether the Marcellus Shale gas industry had any obvious effect on populations in Pennsylvania.


Population change and the Marcellus Shale in Pennsylvania. Please zoom in and click the “i” button in the blue circle, then the map feature of your choice. Please click on the gray compass rose and double carat (^) to hide those menus.

Areas with the most population loss are white, and those with the largest gains are black. In addition, municipalities with Marcellus Shale production in the last half of 2010 are outlined in red, while those without are outlined in blue. With a cursory look, it appears that the areas with Marcellus Shale production are actually more likely to lose population–a topic that merits further analysis.

The municipal spatial data is from PennDOT (via PASDA), while the population data is of course from the US Census Bureau.

Groups Announce Legal Action to Stop Sewage Plants from Dumping Gas Drilling Wastewater in PA Rivers

FOR IMMEDIATE RELEASE

Groups Announce Legal Action to Stop Sewage Plants from
Dumping Gas Drilling Wastewater in Pennsylvania Rivers

— McKeesport and Franklin Twp. plants targeted —

(Pittsburgh) – Clean Water Action and Three Rivers Waterkeeper served legal noticestoday on two sewer authorities that have been discharging Marcellus Shale gas drillingwastewater into the Monongahela River watershed south of Pittsburgh. The noticesdetail violations of the federal Clean Water Act by the facilities, primarily for dischargingwastewater without a permit. Both EPA and the Pennsylvania DEP were notified as wellof the legal action. This is the first time a legal action has been filed to stop the currentdischarge of Marcellus drilling wastewater.

The two sewer authorities targeted are the Municipal Authority of the City of McKeesport inAllegheny County and the Franklin Township Sewer Authority, located in Greene County.McKeesport discharges up to 100,000 gallons per day of Marcellus drilling wastewater intothe Monongahela River. Franklin Twp. discharges up to 50,000 gallons per day into TenMile Creek, a tributary of the Monongahela River. The Monongahela supplies drinkingwater for nearly a half million people, including a portion of the City of Pittsburgh.

“We cannot wait any longer to rely on the state and EPA to act,” stated Myron Arnowitt,PA State Director for Clean Water Action. “These sewage plants have been illegallydischarging gas drilling wastewater into our rivers since 2008 without a permit as requiredby the Clean Water Act. They should immediately stop accepting gas drilling wastewaterand if they want to accept it, they should apply for a permit to do so,” Arnowitt stated.

“Our rivers have made a miraculous recovery over the past few decades, thanks – in largepart – to laws that protect the public’s right to clean rivers and safe drinking water. Theselaws are public health laws and their strict enforcement has a direct, positive effect on thehealth of our rivers, our communities, and our citizens,” stated Ned Mulcahy, ExecutiveDirector for Three Rivers Waterkeeper. “We demand that these facilities stop acceptingtruck after truck of this wastewater and that the DEP and EPA take all necessary actionsto ensure that our rivers, our drinking water, and our communities are protected from thehealth hazards posed by improper treatment and illegal discharges,” Mulcahy stated.

Pennsylvania DEP has previously issued consent orders with both facilities that purportto allow the sewage plants to accept and discharge Marcellus wastewater. Arnowittstated, “DEP’s consent orders are private deals that are negotiated without public input.

The public is not notified and there are no public hearings as there would be if they appliedfor a Clean Water Act permit to discharge appropriately treated Marcellus wastewater. Ifthis wastewater is as safe as the gas industry says it is, lets have a public process so wecan see what the impact really is,” stated Arnowitt.

Water samples recently taken by University of Pittsburgh researchers downstream ofarea wastewater plants have shown elevated levels of numerous contaminants found inMarcellus wastewater including: total dissolved solids, chlorides, bromides, barium, andstrontium.

Although DEP had previously issued in 2010 strict wastewater treatment standards formost oil and gas wastewater sources, the new rule grandfathered all existing plants thatare currently discharging Marcellus wastewater. No plants in Pennsylvania that arecurrently discharging Marcellus wastewater are capable of removing contaminants to thelevel required by the 2010 wastewater rule.

EPA Region III Administrator Shawn Garvin sent a letter this week to Acting DEPSecretary Krancer concerning Marcellus wastewater discharge permits. The letter readin part, “These permits do not now include critical provisions necessary for effectiveprocessing and treatment of wastewaters from drilling operations.”

The legal action that is being filed today is the first step in what is referred to as a citizensuit under the Clean Water Act. When government agencies fail to address violations ofthe Clean Water Act this federal law allows any citizen to sue for enforcement of the law.The filing today is the legally required “Notice of Intent” informing all parties of the Clean Water Act violations at issue.

The legal filing from Clean Water Action and Three Rivers Waterkeeper can bedownloaded here.

Clean Water Action has more than 120,000 members statewide in Pennsylvania and isthe nation’s largest grassroots group focused on water, energy and environmental health.Clean Water Action’s 1 million members, participate in Clean Water Action’s programs forclean, safe and affordable water, prevention of health-threatening pollution, and creation ofenvironmentally-safe jobs and businesses. Clean Water Action’s nonpartisan campaignsempower people to make democracy work.

The mission of Three Rivers Waterkeeper is to ensure that communities throughoutSouthwestern Pennsylvania have safe water to drink, clean rivers to enjoy, and themeans necessary to defend their right to both. To accomplish this mission, Three RiversWaterkeeper will engage in education and outreach, work with communities and theirleaders, partner with government actors and NGOs, patrol the rivers, monitor water quality,and hold polluters accountable under the law.

CONTACT:
Myron Arnowitt, Clean Water Action, 412-592-1283
Ned Mulcahy, Three Rivers Waterkeeper, 412-589-4720
###

PA Marcellus Shale Production by Municipality

Average 6 month MS Well Production by Municipality (small)Marcellus Shale production by municipality. The darker red municipalities have higher production, illustrating that gas production in these gas wells comes in “hot spots”, particularly in the northeast and in the southwest.

It is no secret that there is money to be made in the natural gas industry, not only for the industry, but for those leasing their mineral rights as well. Pennsylvania law requires that a royalty of at least one eighth of the wellhead price of gas be paid to the owner of the land’s mineral rights.

And yet, we continue to hear stories, such as the one about Ron Gulla, who leased his land, which was subsequently damaged by drilling operations, all for apparently no money. How can this be? According to Mr. Gulla, it was because his gas was “wet gas” which needs to be processed. The DEP website makes no such distinction. Just to be sure, I called the Harrisburg office of the Bureau of Oil and Gas Management. Their response was that wet or dry, the drilling operators are required to pay at least one eighth of the wellhead price of gas as a royalty fee.

Is it possible that after all the drilling and hydraulic fracturing and dead fish and ruined farm that there was just no gas produced from that well?

First of all, let’s find Mr. Gulla’s former community. We know from the story referenced above that he was from Hickory in Washington County. In terms of this map, that places him in the middle of Mount Pleasant Township, so let’s take a closer look at what’s going on in that area.


Average six month gas production for Mount Pleasant Township in Washington County, PA, by municipality. Production values are from 7-1-10 to 12-31-10. Click the gray compass rose and double carat(^) to hide those menus.

If you click on the “i” button in the blue circle, then the red shape in the middle of the screen, we can learn quite a bit about gas production in Mount Pleasant Township. For example, we know that there were 94 wells in the township, each producing an average of 57.8 million cubic feet of gas in the six month period of July to December 2010, for an estimated minimum royalty check of just over $30,000. That’s a lot of gas and a lot of money. So where was Mr. Gulla’s?


Average six month gas production for Mount Pleasant Township in Washington County, PA, by municipality and by well. Production values are from 7-1-10 to 12-31-10. Click the gray compass rose and double carat(^) to hide those menus.

If the statewide trend is one of hotspots, at the township level, we are now looking at hotspots within hotspots. While many wells in Mount Pleasant Township produced over 300 million cubic feet of gas in the six month period, many others produced very little. And if Mount Pleasant is a moderately high producer of Marcellus Shale gas, and Chartiers Township to the southeast is a heavyweight, it makes it all the more curious that Cecil Township to the northeast and Smith Township to the northwest have no Marcellus Shale activity at all.

So maybe you have a neighbor who hit the jackpot with the Marcellus Shale gas boom, but does that mean that you will?


Average six month minimum royalty fees by township. Note the large number of municipalities with low or no royalty averages, and the very high dollar amounts in some other communities. Click on the gray compass rose and double carat (^) to hide those menus.

From this map, you can get an idea of what the average six month well royalty check might be for a well in your community. The figures for this map are based on the production values, above, times 0.125 times the average wellhead price of gas in 2010. But as we’ve seen in Mount Pleasant, there are some holes where the gas just doesn’t flow.

After taking this to another level of complexity, the lesson is pretty much the same as before: There is money to be made in the Marcellus Shale gas extraction industry–sometimes. As Mr. Gulla’s story reminds us, there are hardships as well. The DEP issued 9,370 oil and gas violations in a period of less than four years. Things can and sometimes do go wrong, and even when they don’t, around the clock industrial action for months on end in your backyard may be at odds with your bucolic lifestyle, or that of your neighbors.

So if you leased your land, would you cash in? At best, you can look at the numbers and play the odds, but there’s only one way to find out for sure.

Updated Pennsylvania Marcellus Shale Production Information

Updated Marcellus Shale well production data for the period between July 1, 2010 and December 31, 2010 is now available on the DEP website and FracTracker’s DataTool. This data is self-reported by the drilling operators, and includes production in the following categories:

  • Natural Gas: Production in thousands of cubic feet (Mcf)
  • Condensate: Production in barrels
  • Oil: Production in barrels

Let’s take a look at some of the numbers.

Gas Production and Well Status

Table 1: Production notes and values for Pennsylvania Marcellus Shale wells, July 1 2009 to June 30, 2010

Table 2: Production notes and values for Pennsylvania Marcellus Shale wells, July 1 2010 to December 31, 2010

Although gas production is the focus of the six month production report, there is enough useful data to learn a few other things about the industry as well:

  • As with the waste report, there is more production reported in the last half of 2010 than the entire preceding year. Although there are more producing wells, my suspicion is that the real reason is poor reporting for the July 2009 to June 2010 report.
  • As corroborating evidence of poor reporting, the earlier report includes significant production from wells that are “Not yet drilled”. This issue has been corrected for the last half of 2010.
  • Only 26 Marcellus Shale wells are reported as plugged. This is fairly impressive, as the earliest Marcellus well in Pennsylvania was from 2006.
  • Over half of the Marcellus Shale wells which have been permitted in Pennsylvania have not yet been drilled. Almost all of these are horizontal wells.

Gas, Condensate, and Oil Production

Table 3: Gas, condensate, and oil production values for Pennsylvania Marcellus Shale wells, July 1 2009 to June 30, 2010

Table 4: Gas, condensate, and oil production values for Pennsylvania Marcellus Shale wells, July 1 2010 to December 31, 2010

The Marcellus Shale is well known as a gas producing black shale formation, but condensate and oil are also produced from these wells in Pennsylvania. There are a couple of trends of note here as well:

  • Although the more recent report is for only half the length of time as the older one, this cannot account for the tenfold decrease in oil production.
  • The amount of condensate nearly doubled, despite the fact that the reporting period was only half as long.
  • Almost all oil and condensate production now comes from horizontal wells.

Location

Now let’s take a look at the geographical distribution of this data. Here, in rapid succession, are the data in table, chart, and map formats:

Table 5: Pennsylvania Marcellus Shale production by county, July 1, 2010 to December 31, 2010

Chart 1: Pennsylvania Marcellus Shale gas production by county, July 1, 2010 to December 31, 2010


PA Marcellus Shale Oil, Gas, and Condensate Production, July 1, 2010 to December 31, 2010. Please click the gray compass rose and double carat (^) to hide those menus.

There are a couple of key points about the location information as well:

  • Although Washington county is one of several major producers of natural gas, the vast majority of the Marcellus Shale oil and condensate production in the Commonwealth comes from that county.
  • The leading producers in the state by county are (percentage of statewide total in parentheses):
    1. Bradford (25.7%)
    2. Susquehanna (23.7%)
    3. Washington (14.2%)
    4. Greene(12.3%)
    5. Tioga (8.8%)


Marcellus Shale natural gas, condensate, and oil production in Southwestern Pennsylvania, July 1, 2010 to December 31, 2010

Production by Operator

Table 6: Natural gas produced by operator in Pennsylvania’s Marcellus Shale formation, 7-1-10 to 12-31-10.

Chart 2: Natural gas produced by operator in Pennsylvania’s Marcellus Shale formation, 7-1-10 to 12-31-10.

The leading producers in the state by operator are (percentage of statewide total in parentheses):

  1. Chesapeake Appalachia Llc (18.8%)
  2. Talisman Energy Usa Inc (18.1%)
  3. Cabot Oil & Gas Corp (15.3%)
  4. Range Resources Appalachia Llc (12.6%)
  5. Atlas Resources Llc (5.6%)

Updated Pennsylvania Marcellus Shale Waste Information

Total Waste Produced by Marcellus Shale Well (small)Mixed total of waste produced by Marcellus Shale gas wells between July 1 and December 31, 2010. For more information on specific wells, click the blue “i” button, then click on one of the purple dots.

Self reported Marcellus Shale waste data for the period between July 1 and December 31, 2010 is now available on the DEP website and FracTracker’s DataTool in the following categories:

  • Basic Sediment (in barrels): Sludge that collects at the bottom of storage tanks and pits
  • Brine (in barrels): These are naturally occurring pockets of saltwater that are encountered in the drilling process.
  • Drill Cuttings (in tons): This is composed of the layers of earth that the drill passes through on the way to the target formation.
  • Drilling (in barrels): The main function of drilling fluid is to maintain the proper pressure in the well
  • Frac Fluid (in Barrels): This is what is injected into the well during the hydraulic fracturing process, much of which tends to flow back out.
  • Servicing Fluid (in Barrels): Waste produced by one of a variety of post-production services performed on a well.
  • Spent Lubricant (in Barrels): This lubricates the drill bit

I have also pivoted the data to establish how much waste is transported to the various disposal locations.


Locations accepting Pennsylvania’s Marcellus Shale waste. Please click on the gray compass rose and double carat (^) to hide those menus.

I have a few initial observations about the waste production data:

  • The totals for waste production in every category except Basic Sediment are higher for the six month period from than they were for the one year period ending on June 30, 2010. This increase almost certainly reflects better reporting rather than a dramatic increase in waste production in the last half of 2010.
  • There are some obvious inaccuracies in the map of the facilities receiving Pennsylvania’s Marcellus Shale waste. There is no reason that this waste would be shipped to Texas or Alabama, for example. Those locations are most likely corporate addresses of the waste facilities.
  • Despite the fact that companies are supposed to report both addresses and latitude and longitude of the receiving facilities, not all of the facilities receiving waste are on this map. The list of addresses appeared to be more complete, so that is what was used for mapping purposes. If you download the full dataset, addresses in Pennsylvania, New York, Ohio, West Virinia, Maryland, and New Jersey are given as recipients of Pennsylvania’s Marcellus Shale waste.

PA Fish and Boat Commission Targets Gas Extraction as Resource Threat

Archived

This article has been archived and is provided for reference purposes only.


Wastewater Facilities Accepting Marcellus Shale Brine and Major Drainage Basins. Click the map for a larger, dynamic view.

By Conrad Dan Volz, DrPH, MPH.
Director and Principal Investigator of the Center for Healthy Environments and Communities

Management Plans by the Pennsylvania Fish and Boat Commission (PFBC) have been released for public comment for the 3 major drainages in Pennsylvania:

Public meetings on each of these draft plans are underway and dates and times and places of future meetings for each basin are now available on the PFBC website.

The PFBC has as its goal of these management plans – to protect, conserve and enhance the aquatic resources of and provide fishing and boating opportunities. The PFBC also has an important role in investigating releases of brine water from oil and gas extraction operations. Mr. John Arway the Executive Director of the PFBC just published in the January / February Edition of Pennsylvania Angler and Boater a very sobering assessment of water withdrawals and permitted pollution of Pennsylvania waterways by NPDES permit holders. He states that end users of municipal water are paying increased costs for water purification because of companies that are allowed to pollute receiving waters. This is a very courageous statement and I concur wholly with him on this. His complete statement can be found here.

Below are presented excerpts from the PFBC Draft Three Rivers Management Plan that pertains to Marcellus Shale gas extraction. Most important is their statement in the draft plan that in 2008, several wastewater treatment plants located along the Monongahela River were accepting frac-flowback water from multiple sources. Unable to completely treat this water, plant outflows caused a temporary spike in conductivity (readings as high as 1,200 μS/cm) and total dissolved solids (TDS readings as high as 900 mg/L) in the Monongahela River during October and November 2008. Other passages related to Marcellus are:

  • “In June 2010, the Monongahela River was named number nine of the top ten America’s Most Endangered Rivers by American Rivers primarily because of continuing threats from water pollution impacts from natural gas extraction activities in the Marcellus Shale.”
  • “Since 2008, PADEP Southwest Regional Office in Pittsburgh has directed a comprehensive
    water quality monitoring investigation of the Monongahela River related to impacts from disposal of contaminated frac-flowback water from Marcellus Shale drilling sites. This office has also surveyed fish, mussel, and invertebrate assemblages of the Allegheny and Monongahela Rivers as well as collected water quality and sediment quality samples and evaluated riparian and instream habitats for the U.S. Environmental Protection Agency’s (USEPA) Environmental
    Monitoring and Assessment Program for Great Rivers Ecosystems (EMAP-GRE). PADEP will
    provide PFBC information and results of Allegheny and Monongahela EMAP-GRE when the
    project is complete (in 2011).”
  • “Marcellus Shale is a unit of Devonian-age sedimentary rock found throughout the Appalachian
    Plateau. Named for a distinctive outcrop located near the village of Marcellus, New York,
    Marcellus Shale contains a massive and largely untapped natural gas reserve, which has high
    economic potential (trillions of dollars) given its proximity to high-demand markets in the eastern United States. Using horizontal drilling and hydraulic fracturing techniques, numerous Marcellus Shale wells have been installed within the upper Ohio River basin for exploitation of natural gas.”
  • “With any resource extraction operation, there are environmental consequences. For Marcellus
    Shale drilling, most issues involve the transport, treatment, and disposal of contaminated frac flowback water, a byproduct of hydraulic fracturing. In 2008, several wastewater treatment
    plants located along the Monongahela River were accepting frac-flowback water from multiple
    sources. Unable to completely treat this water, plant outflows caused a temporary spike in
    conductivity (readings as high as 1,200 μS/cm) and total dissolved solids (TDS readings as high
    as 900 mg/L) in the Monongahela River during October and November 2008.”
  • “Some Monongahela River tributaries continue to be disturbed by modern industries, such as longwall mining and Marcellus Shale drilling, including Dunkard Creek and Tenmile Creek. Major tributary streams of the upper Ohio River include Chartiers Creek (one of the most disturbed streams in the basin from numerous perturbations), Raccoon Creek (a recovering stream), and the Beaver River system.”

PA DEP Upgrades Drilled Well Data Distribution

The Pennsylvania DEP now has a linkto download all of the drilled wells from the Spud Report in Excel file format (1). This is a major upgrade over their previous system of posting online tables for each month, not only for the ease of access, but also because it contains complete location information, which previously had to be obtained elsewhere by matching the American Petroleum Institute (API) number with an external dataset; an imperfect system which resulted in thousands of wells between 1998 and 2010 for which location information could not be found.


Drilled wells in Pennsylvania in 2011. Click the gray compass rose and double carat (^) tabs for a complete view.

In addition, it utilizes the full API number. For example, in well number 37-005-30663-01-01, the initial 37 is the state code for Pennsylvania, and the 005 is the county code for Armstrong County.

  1. The Spud Date is the day that drilling begins on a particular well.
  2. API county codes, as well as a variety of other codes used by the PA DEP are explained here.

How is PA handling shale gas wastewater?


Jim Riggio, plant manager for the Beaver Falls Municipal
Authority, shows a sample of solid materials removed from
the Beaver River during treatment Dec. 15 at his plant.

On January 3rd, Associated Press writer, David Caruso, criticized the efforts underway in Pennsylvania to protect surface waters from shale gas drilling wastewater – especially because in most other states the primary means of disposal is deep well injection.

On January 4th, both the Marcellus Shale Coalition (the industry’s PR group) and DEP Secretary John Hanger defended the Commonwealth’s actions and current regulations.

What do you think?

Do you want to know where shale gas wastewater is permitted to be disposed of into surface waters near you? Below is a snapshot that I made in August 2010 using FracTracker’s DataTool of the facilities within PA that are permitted to receive shale gas drilling wastewater:


To learn more about a particular site, click on the inspect button in the gray toolbar – the “i” – and then click on a red diamond. A white box will pop up. Within that box, click on “view” to see who operates these facilities and how much wastewater per day they are permitted to receive. (“MGD” stands for Million Gallons Per Day. “GPD” means Gallons Per Day.)

And finally, here are two blog posts written by CHEC staff about the challenges facing our surface waters – and potentially our health – as a result of both fresh water withdrawals and wasterwater disposal: