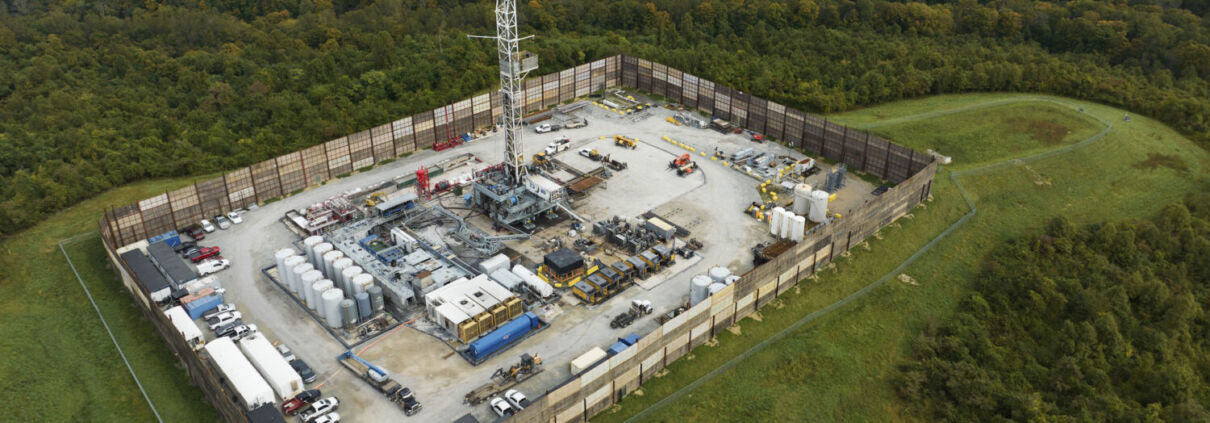
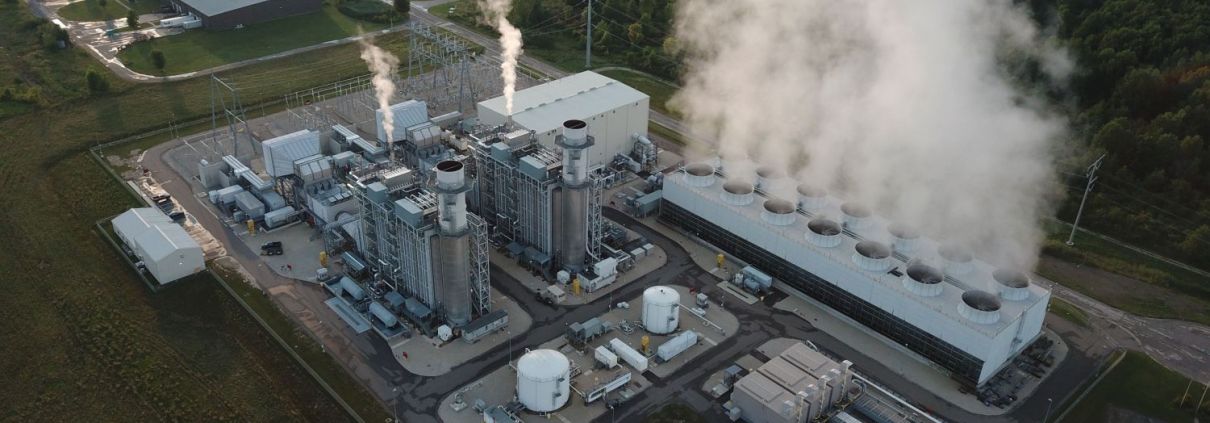
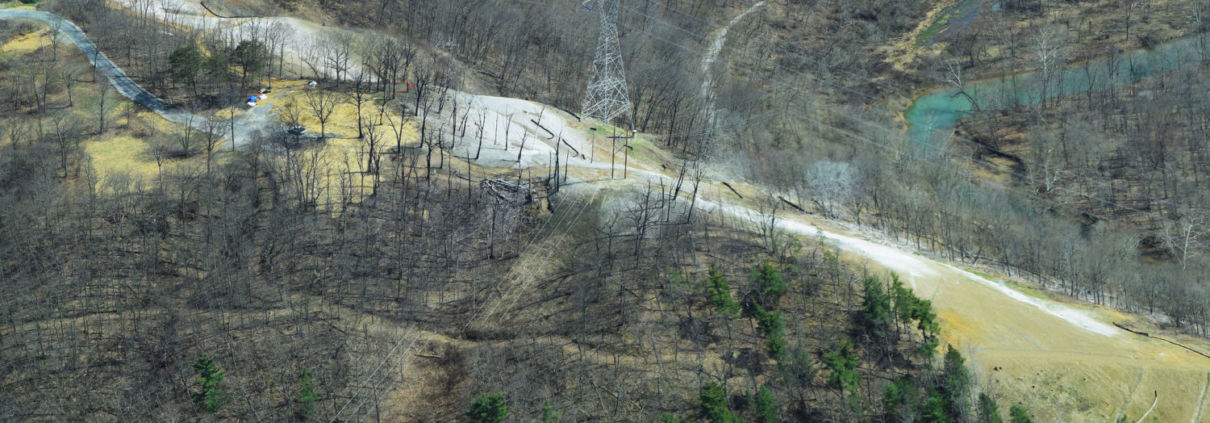
Fracking has been raised as an issue that could determine the outcome of the 2020 US presidential election. Republican candidates have cited erroneous figures of how many fracking jobs exist in Pennsylvania, and have falsely claimed that Democratic presidential candidate Joe Biden and running mate Kamala Harris seek to ban fracking. And while the Democratic candidates have made suggestive comments in the past, they have made their position clear. As Senator Harris stated in the vice presidential debate: “I will repeat, and the American people know, that Joe Biden will not ban fracking. That is a fact.”
The debate around this issue is not on whether or not fracking should be banned– something neither party advocates– but rather around the facts. Republican candidates have inflated the extent of fracking jobs by up to 3500 percent. But the natural gas industry and the fracking boom have failed to deliver the job growth and prosperity that was predicted by proponents a decade ago. In reality, the total number of jobs in the natural gas industry in Pennsylvania never reached more than 30,000 over the last five years and is now less with the industry’s economic decline.
The total number of jobs in the natural gas industry in Pennsylvania never reached more than 30,000 over the last five years and is now less with the industry’s economic decline.
The debate should not be around the facts- those are already firmly established. The debate should be around how to best support fossil fuel workers in the inevitable transition to cleaner energy. What does a just transition that supports workers and the climate look like?
Pipeline construction in the Loyalsock Watershed, PA. Photo by Barb Jarmoska.
Stay in the know
Learn more about fracking and the 2020 presidential election
FracTracker Alliance and The Breathe Project have compiled a fact sheet to help us answer this question based on where Pennsylvania currently stands.
As unconventional oil and natural gas extraction operations have expanded throughout the United States over the past decade, the harmful health and environmental effects of fracking have become increasingly apparent and are supported by a steadily growing number of scientific studies and reports. Although some uncertainties remain around the exact exposure pathways, it is clear that issues associated with fracking negatively impact public health and the surrounding environment.
This map contains numerous data layers that help understand unconventional drilling activity in PA. View the map details below to learn more, or click on the map to explore the dynamic version of this data.
Straight Talk on the Future of Jobs in Pennsylvania (September 2020)
The Breathe Project and FracTracker Alliance have crafted the following messaging for refuting the conflated job numbers being touted by pro-fossil fuel organizations and political candidates regarding fracking and jobs in Pennsylvania that, in some cases, has inflated natural gas jobs in the state by 3500 percent.
The natural gas industry and the fracking boom have failed to deliver the job growth and prosperity that was predicted by proponents a decade ago. The total number of jobs in the natural gas industry in Pennsylvania never reached more than 30,000 over the last five years and is now less with the industry’s economic decline.
FACT: The Pa. Dept. of Labor and Industry (DLI) reported that direct employment in natural gas development totaled 19,623 in 2016. This was down from 28,926 total natural gas development jobs in 2015. This includes jobs in drilling, extraction, support operations and pipeline construction and transportation. (StateImpact, 2016)
Pa. DLI calculated the employment figures using data from six data classifications at the U.S. Bureau of Labor Statistics — specifically, the North American Industry Classification System (NAICS) codes for cured petroleum and natural gas extraction, natural gas liquid extraction, drilling oil and gas wells, support activities for oil and gas operations, oil and gas pipeline and related structures and pipeline transportation of natural gas. (Natural Gas Intel, 2016)
Inflated estimates of fracking-related jobs in Pennsylvania under previous Gov. Tom Corbett included regulators overseeing the industry as gas jobs, truck drivers, and those working in highway construction, steel mills, coal-fired power plants, sewage treatment plants, and others. Pa. Gov. Tom Wolf’s administration revised the way gas industry jobs were calculated to reflect a more accurate depiction of jobs in the sector.
FACT: Food & Water Watch calculated that there were 7,633 jobs pre-boom (2001 – 2006), which rose to 25,960 oil and gas industry jobs post-boom (2016 – 2018). (FWW, March 2020)
Food & Water Watch created a more accurate model using a definition that encompasses only jobs directly involved with domestic oil and gas production, specifically: oil and gas extraction; support activities for oil and gas operations; drilling oil and gas wells; oil and gas pipeline construction; and pipeline transportation.
FACT: The Food & Water Watch analysis also reports that misleadingly broad definitions in industry-supported job reports overstated the industries’ scope. The industry analysis included broad swaths of manufacturing industries including “fertilizer manufacturing,” convenience store workers, and gas station workers, which accounted for nearly 35 percent of all oil and gas jobs in their analysis. (FWW, PwC at 5 and Table 4 at 9, 2019)
FACT: As a point of comparison, in 2019, close to 1 million state residents were working in healthcare, 222,600 in education, and over 590,000 in local and state government. (Pennsylvania Bureau of Labor Statistics, July, 2020)
FACT: To forecast fracking-related job growth, the American Petroleum Institute used a model with exaggerated multipliers and faulty assumptions, such as the amount of purchases made from in-state suppliers, and it double counted jobs, leading to wildly optimistic estimates. (Ohio River Valley Institute, August 2020)
FACT: In addition, many of the jobs claimed in a 2017 American Chemistry Council Appalachian petrochemical economic impact study would arise in plastics manufacturing, which raises two concerns. First, both the ACC study and subsequent reports by the U.S. Department of Energy assume that 90% of the ethylene and polyethylene produced by imagined Appalachian cracker plants would be shipped out of the region to be used in manufacturing elsewhere in the country and the world. Of the 10% that would presumably stay in the region, much or most of it would serve to replace supplies that the region’s plastics manufacturers currently source from the Gulf Coast. (Ohio River Valley Institute, August 2020)
The fracking and petrochemical industries create unsustainable boom and bust cycles that do not holistically improve local economies.
FACT: Economic analyses show that the oil and gas industry is a risky economic proposition due to the current global oversupply of plastics, unpredictable costs to the industry, a lower demand for plastics, and increased competition. The analyses call into question industry’s plans to expand fracking and gas infrastructure in the region. (IEEFA, August 2020)
FACT: Plans to build petrochemical plants in Beaver County, Pennsylvania and Belmont, Ohio, for the sole purpose of manufacturing plastic nurdles will not be as profitable as originally portrayed. (IEEFA Report, June 2020)
A clean energy economy is the only way forward.
FACT: The Dept. of Energy’s U.S. Energy and Employment Report (2017) and E2 Clean Jobs Pennsylvania Report (2020) shows that clean energy jobs in Pennsylvania employ twice as many people as the fossil fuel industry prior to the pandemic.
FACT: The 4-state region of Ohio, West Virginia, Kentucky and Pennsylvania has formed a coalition of labor, policy experts and frontline community leaders called Reimagine Appalachia. This coalition is in the process of addressing the vast number of jobs in renewable and clean energy industries in a report that will be published this fall.
Reimagine Appalachia seeks major federal funding packages that will create jobs, rebuild infrastructure and addresses climate change that will ensure that no one is left behind going forward.
The Breathe Project is a coalition of citizens, environmental advocates, public health professionals and academics using the best available science and technology to improve air quality, eliminate climate pollution and make our region a healthy, prosperous place to live.
FracTracker Alliance is a 501(c)3 organization that maps, analyzes, and communicates the risks of oil, gas, and petrochemical development to advance just energy alternatives that protect public health, natural resources, and the climate.
Feature image of construction of the Royal Dutch Shell cracker plant in Beaver County, Pennsylvania, October 2019. Ted Auch, FracTracker Alliance.
https://www.fractracker.org/a5ej20sjfwe/wp-content/uploads/2020/10/TAuch_Plastics-Cracker_Construction-Shell-BeaverCounty_PA_Oct2019-Feature.jpg16673750Shannon Smithhttps://www.fractracker.org/a5ej20sjfwe/wp-content/uploads/2019/10/Fractracker-Color-Logo.jpgShannon Smith2020-10-28 16:40:362020-11-03 14:59:04Fracking and the 2020 Presidential Election
In this article, we’ll take a look at the current trend in “re-branding” incineration as a viable option to deal with the mountains of garbage generated by our society. Incineration can produce energy for electricity, but can the costs—both economically, and ecologically—justify the benefits? What are the alternatives?
Changes in our waste stream
In today’s world of consumerism and production, waste disposal is a chronic problem facing most communities worldwide. Lack of attention to recycling and composting, as well as ubiquitous dependence on plastics, synthetics, and poorly-constructed or single-use goods has created a waste crisis in the United States. So much of the waste that we create could be recycled or composted, however, taking extraordinary levels of pressure off our landfills. According to estimates in 2017 by the US Environmental Protection Agency (EPA), over 30 percent of municipal solid waste is made up of organic matter like food waste, wood, and yard trimmings, almost all of which could be composted. Paper, glass, and metals – also recyclable – make up nearly 40 percent of the residential waste stream. Recycling plastic, a material which comprises 13% of the waste stream, has largely been a failed endeavor thus far.
Why say NO to incinerators?
They are bad for the environment, producing toxic chlorinated byproducts like dioxins. Incineration often converts toxic municipal waste into other forms, some of which are even more toxic than their precursors.
They often consume more energy than they produce and are not profitable to run.
They add CO2 to the atmosphere.
They promote the false narrative that we can “get something” from our trash
They detract from the conversation about actual renewable energy sources like wind power, solar power, and geothermal energy that will stop the acceleration of climate chaos.
Nevertheless, of the approximately 400 million tons of plastic produced annually around the world, only about 10% of it is recycled. The rest winds up in the waste stream or as microfragments (or microplastics) in our oceans, freshwater lakes, and streams.
According to an EPA fact sheet, by 2017, municipal solid waste generation increased three-fold compared with 1960. In 1960, that number was 88.1 million tons. By 2017, this number had risen to nearly 267.8 million tons. Over that same period, per-capita waste generation rose from 2.68 pounds per person per day, to 4.38 pounds per person per day, as our culture became more wed to disposable items.
The EPA provides a robust “facts and figures” breakdown of waste generation and disposal here. In 2017, 42.53 million tons of US waste was shipped to landfills, which are under increasing pressure to expand and receive larger and larger loads from surrounding area, and, in some cases, hundreds of miles away.
How are Americans doing in reducing waste?
On average, in 2017, Americans recycled and composted 35.2% of our individual waste generation rate of 4.51 pounds per person per day. While this is a notable jump from decades earlier, much of the gain appears to be in the development of municipal yard waste composting programs. Although the benefits of recycling are abundantly clear, in today’s culture, according to a PEW Research Center report published in 2016, just under 30% of Americans live in communities where recycling is strongly encouraged. An EPA estimate for 2014 noted that the recycling rate that year was only 34.6%, nationwide, with the highest compliance rate at 89.5% for corrugated boxes.
Figure 3. Percent of Americans who report recycling and re-use behaviors in their communities, via Pew Research center
Historically, incineration – or burning solid waste – has been one method for disposing of waste. And in 2017, this was the fate of 34 million tons—or nearly 13%– of all municipal waste generated in the United States. Nearly a quarter of this waste consisted of containers and packaging—much of that made from plastic. The quantity of packaging materials in the combusted waste stream has jumped from only 150,000 tons in 1970 to 7.86 million tons in 2017. Plastic, in its many forms, made up 16.4% of all incinerated materials, according to the EPA’s estimates in 2017.
Figure 4: A breakdown of the 34.03 tons of municipal waste incinerated for energy in the US in 2017
What is driving the abundance of throw-away plastics in our waste stream?
Sadly, the answer is this: The oil and gas industry produces copious amounts of ethane, which is a byproduct of oil and gas extraction. Plastics are an “added value” component of the cycle of fossil fuel extraction. FracTracker has reported extensively on the controversial development of ethane “cracker” plants, which chemically change this extraction waste product into feedstock for the production of polypropylene plastic nuggets. These nuggets, or “nurdles,” are the building blocks for everything from fleece sportswear, to lumber, to packaging materials. The harmful impacts from plastics manufacturing on air and water quality, as well as on human and environmental health, are nothing short of stunning.
FracTracker has reported extensively on this issue. For further background reading, explore:
A report co-authored by FracTracker Alliance and the Center for Environmental Integrity in 2019 found that plastic production and incineration in 2019 contributed greenhouse gas emissions equivalent to that of 189 new 500-megawatt coal power plants. If plastic production and use grow as currently planned, by 2050, these emissions could rise to the equivalent to the emissions released by more than 615 coal-fired power plants.
Just another way of putting fossil fuels into our atmosphere
Incineration is now strongly critiqued as a dangerous solution to waste disposal as more synthetic and heavily processed materials derived from fossils fuels have entered the waste stream. Filters and other scrubbers that are designed to remove toxins and particulates from incineration smoke are anything but fail-safe. Furthermore, the fly-ash and bottom ash that are produced by incineration only concentrate hazardous compounds even further, posing additional conundrums for disposal.
Incineration as a means of waste disposal, in some states is considered a “renewable energy” source when electricity is generated as a by-product. Opponents of incineration and the so-called “waste-to-energy” process see it as a dangerous route for toxins to get into our lungs, and into the food stream. In fact, Energy Justice Network sees incineration as:
… the most expensive and polluting way to make energy or to manage waste. It produces the fewest jobs compared to reuse, recycling and composting the same materials. It is the dirtiest way to manage waste – far more polluting than landfills. It is also the dirtiest way to produce energy – far more polluting than coal burning.
Municipal waste incineration: bad environmentally, economically, ethically
Waste incineration has been one solution for disposing of trash for millennia. And now, aided by technology, and fueled by a crisis to dispose of ever-increasing trash our society generates, waste-to-energy (WTE) incineration facilities are a component in how we produce electricity.
But what is a common characteristic of the communities in which WTEs are sited? According to a 2019 report by the Tishman Environmental and Design Center at the New School, 79% of all municipal solid waste incinerators are located in communities of color and low-income communities. Incinerators are not only highly problematic environmentally and economically. They present direct and dire environmental justice threats.
Waste-to-Energy facilities in the US, existing and proposed
Activate the Layers List button to turn on Environmental Justice data on air pollutants and cancer occurrences across the United States. We have also included real-time air monitoring data in the interactive map because one of the health impacts of incineration includes respiratory illnesses. These air monitoring stations measure ambient particulate matter (PM 2.5) in the atmosphere, which can be a helpful metric.
What are the true costs of incineration?
These trash incinerators capture energy released from the process of burning materials, and turn it into electricity. But what are the costs? Proponents of incineration say it is a sensible way to reclaim or recovery energy that would otherwise be lost to landfill disposal. The US EIA also points out that burning waste reduces the volume of waste products by up to 87%.
The down-side of incineration of municipal waste, however, is proportionally much greater, with a panoply of health effects documented by the National Institutes for Health, and others.
Dioxins (shown in Figures 6-11) are some of the most dangerous byproducts of trash incineration. They make up a group of highly persistent organic pollutants that take a long time to degrade in the environment and are prone to bioaccumulation up the food chain.
Dioxins are known to cause cancer, disrupt the endocrine and immune systems, and lead to reproductive and developmental problems. Dioxins are some of the most dangerous compounds produced from incineration. Compared with the air pollution from coal-burning power plants, dioxin concentrations produced from incineration may be up to 28 times as high.
Federal EPA regulations between 2000 and 2005 resulted in the closure of nearly 200 high dioxin emitting plants. Currently, there are fewer than 100 waste-to-energy incinerators operating in the United States, all of which are required to operate with high-tech equipment that reduces dioxins to 1% of what used to be emitted. Nevertheless, even with these add-ons, incinerators still produce 28 times the amount of dioxin per BTU when compared with power plants that burn coal.
Even with pollution controls required of trash incinerators since 2005, compared with coal-burning energy generation, incineration still releases 6.4 times as much of the notoriously toxic pollutant mercury to produce the equivalent amount of energy.
Energy Justice Network, furthermore, notes that incineration is the most expensive means of managing waste… as well as making energy. This price tag includes high costs to build incinerators, as well as staff and maintain them — exceeding operation and maintenance costs of coal by a factor of 11, and nuclear by a factor of 4.2.
Figure 12. Costs of incineration per ton are nearly twice that of landfilling. Source: National Solid Waste Management Association 2005 Tip Fee Survey, p. 3.
Energy Justice Network and others have pointed out that the amount of energy recovered and/or saved from recycling or composting is up to five times that which would be provided through incineration.
Figure 13. Estimated power plant capital and operating costs. Source: Energy Justice Network
The myth that incineration is a form of “renewable energy”
Waste is a “renewable” resource only to the extent that humans will continue to generate waste. In general, the definition of “renewable” refers to non-fossil fuel based energy, such as wind, solar, geothermal, wind, hydropower, and biomass. Synthetic materials like plastics, derived from oil and gas, however, are not. Although not created from fossil fuels, biologically-derived products are not technically “renewable” either.
Biogenic materials you find in the residual waste stream, such as food, paper, card and natural textiles, are derived from intensive agriculture – monoculture forests, cotton fields and other “green deserts”. The ecosystems from which these materials are derived could not survive in the absence of human intervention, and of energy inputs from fossil sources. It is, therefore, more than debatable whether such materials should be referred to as renewable.
Although incineration may reduce waste volumes by up to 90%, the resulting waste-products are problematic. “Fly-ash,” which is composed of the light-weight byproducts, may be reused in concrete and wallboard. “Bottom ash” however, the more coarse fraction of incineration—about 10% overall—concentrates toxins like heavy metals. Bottom-ash is disposed of in landfills or sometimes incorporated into structural fill and aggregate road-base material.
How common is the practice of using trash to fuel power plants?
Trash incineration accounts for a fraction of the power produced in the United States. According to the United States Energy Information Administration, just under 13% of electricity generated in the US comes from burning of municipal solid waste, in fewer than 65 waste-to-energy plants nation-wide. Nevertheless, operational waste-to-incineration plants are found throughout the United States, with a concentration east of the Mississippi.
According to EnergyJustice.net’s count of waste incinerators in the US and Canada, currently, there are:
88 operating
41 proposed
0 expanding
207 closed or defeated
Figure 14. Locations of waste incinerators that are already shut down. Source: EnergyJustice.net)
Precise numbers of these incinerators are difficult to ascertain, however. Recent estimates from the federal government put the number of current waste-to-energy facilities at slightly fewer: EPA currently says there are 75 of these incinerators in the United States. And in their database, updated July 2020, the United States Energy Information Administration (EIA), lists 63 power plants that are fueled by municipal solid waste. Of these 63 plants, 40—or 66%—are in the northeast United States.
Regardless, advocates of clean energy, waste reduction, and sustainability argue that trash incinerators, despite improvements in pollution reduction over earlier times and the potential for at least some electric generation, are the least effective option for waste disposal that exists. The trend towards plant closure across the United States would support that assertion.
Let’s take a look at the dirty details on WTE facilities in three states in the Northeastern US.
Review of WTE plants in New York, Pennsylvania, and New Jersey
A. New York State
Operational WTE Facilities
In NYS, there are currently 11 waste-to-energy facilities that are operational, and two that are proposed. Here’s a look at some of them:
The largest waste-to-energy facility in New York State, Covanta Hempstead Company (Nassau County), was built in 1989. It is a 72 MW generating plant, and considered by Covanta to be the “cornerstone of the town’s integrated waste service plan.”
According to the Environmental Protection Agency’s ECHO database, this plant has no violations listed. Oddly enough, even after drawing public attention in 2009 about the risks associated with particulate fall-out from the plant, the facility has not been inspected in the past 5 years.
Other WTE facilities in New York State include the Wheelabrator plant located in Peekskill (51 MW), Covanta Energy of Niagara in Niagara Falls (32 MW), Convanta Onondaga in Jamesville (39 MW), Huntington Resource Recovery in Suffolk County (24.3 MW), and the Babylon Resource Recovery Facility also in Suffolk County (16.8 MW). Five additional plants scattered throughout the state in Oswego, Dutchess, Suffolk, Tioga, and Washington Counties, are smaller than 15 MW each. Of those, two closed and one proposal was defeated.
Closed / Defeated Facilities
The $550 million Corinth American Ref-Fuel, was proposed for Corinth, New York. It was designed to take 1.27 million tons of New York City waste/year, even more than what is planned for the CircularEnerG plant. It was defeated ~2004. Population of 864 in immediate vicinity of plant, 98% white, income $59K.
Fire Island, Saltaire Incinerator closed. Took 12 tons/day. It was opened in 1965s, but not designed to produce energy, just burn trash. There was a population of 317 in immediate vicinity of plant, 93% white, income $123K.
The Long Beach incinerator processed 200 tons per day of solid waste. This plant was operating in 1988, but closed in 1996.
The Albany Steam Plant closed in 1994. When it was operational, it took in 340-600 tons of trash per day. Environmental justice issues were plentiful at this plant, with over 99% of the area as African American, according to the LA Times coverage of the issue.
CircularEnerG, was a 50 MW plant proposed in Romulus, on the former Seneca Army Depot, in the middle of largely white Seneca County, New York. However, the nearest large population to the proposed site was the 1500-prisoner capacity Five Points Correctional facility, swaying the demographics to nearly 52% African American in the highest impact zone. More broadly, the facility was in the heart of the Finger Lakes wine region, known for its extraordinary scenery, clean lakes, and award-winning wines. This facility was broadly opposed by nearly all the surrounding municipalities and counties, and mired in controversy about improper procedures and a designation by a local zoning officer as a “renewable” source of energy in its early filing papers.
Local advocacy groups, Seneca Lake Guardian (an affiliate of the Waterkeeper Network), and the Finger Lakes Wine Business Coalition worked exhaustively with the legal group, Earthjustice, to stop the project.
Figure 15. Map of regional governments and organizations opposed to construction of Romulus waste-to-energy incinerator in New York State
In March 2019, after state lawmakers, along with Governor Andrew Cuomo came out against the trash incinerator, the special use permit application for the facility was withdrawn.
Plans were also in development for a garbage-to-gas plant in the Hudson River community of Stony Point, New York. The company, New Planet Energy, had hoped to construct the gasification plant that would accept 4,500 tons of waste daily, brought in each day by approximately 400 trucks, according to an article in Lohud, May 1, 2018. However, the owner of the property eventually backed out of the proposal shortly after the publication of the article, following an uptick in criticism about the project about environmental and traffic safety concerns. This property is also currently an active Superfund site.
Proposed WTE Facilities
In New York State, there are currently two proposed WTE facilities.
New York State has rejected the designation for WTE facilities since 2011. As of the latest reports, the company is pushing ahead with its plans, despite the widespread dislike for the project. A bill in the State Legislature has been introduced to block the project. Green Waste Energy has been proposed for Rensselaer, NY. This trash-burning gasification plant would accept 2500 tons of trash per day. However, in August 2020, the New York State Department of Environmental Conservation (DEC) denied the air quality permit for the facility. The developers may appeal this decision.
In New Windsor, NY, a project called W2E Orange County has been under consideration. Most recent news coverage of this project was three and a half years ago, so it is possible this project is not moving forward. The parent company of the project, Ensorga, appears to have contracted its operations to West Virginia.
B. Pennsylvania
Operational WTE Facilities
In Pennsylvania, six WTE facilities are currently operating. Two have been closed, and six defeated.
Proposed WTE Facilities
In Pennsylvania, there are currently no WTEs under consideration for construction.
Closed WTE Facilities
Chester Resource Recovery #1 was used from the late 1950s to 1979. The neighborhood is over 64% African American. This was one of three incinerators used here.
Westmoreland County WTE plant, which opened in 1986 and burned 25 tons of solid municipal waste per day, has been closed due to financial unviability, and lack of need for the steam that was produced, according to a report drafted in 1997. It was located in a densely populated area, and provided steam to a nursing home, jail, and low-income housing.
Defeated WTE Facility Proposals
Elroy trash-to-steam plant was located in a densely populated section of Franconia Township, Montgomery County, Pennsylvania. It was to handle 360 tons of waste per day and was located on the grounds of a rendering plant. The application for this plant was withdrawn in June, 1989. Citizens for a Clean Environment successfully defeated this project.
The Plasma Gasification Incinerator, located in Hazle Township, Pennsylvania, was proposed to burn 4,000 tons of trash per day. The median income in the immediate vicinity of the site is $46K. The application for this project was withdrawn.
The Pittston Trash Incinerator in a very low-income area of Luzerne County, Pennsylvania, was designed to burn 3,000 tons of trash per day. This project was defeated.
The $65 million Delta Thermo Muncy facility, which would have burned municipal waste and sewage sludge, was defeated in December, 2016. Citizens in the Energy Justice Network and Stop the Muncy Waste Incinerator organized and passed a set-back ordinance that made it impossible for the plant to locate there. This proposed plant, would have been located in Lycoming County, Pennsylvania. The plan there was to decompose trash and sewage through a hydrothermal technique to create pellets, which would then be burned to yield energy.
Originally proposed in 2007, the $49 million Delta Thermo Allentown plant has been fought for many years by Allentown Residents for Clean Air. If built, it would generate 2 MW of energy, and receive 100 tons of municipal waste each day and 50 tons of sewage sludge. The plant is located in a densely-populated, predominately Hispanic neighborhood. There has been no news on this project in over four years, so this project appears to have been defeated.
Glendon Energy proposed building an incinerator in Northampton County, Pennsylvania. This proposal was also defeated.
C. New Jersey
Operational WTE Facilities
And in New Jersey, there are currently four operating WTE facilities. Essex County Resource Recovery Facility, is New Jersey’s largest WTE facility. It opened in 1990, houses three burners, and produces 93 MW total.
Three WTE facilities are currently proposed in New Jersey. Jefferson Renewable Energy Trash Incinerator (Jersey City, New Jersey) is designed to produce 90 MW of power, accepting 3,200 tons/day solid waste, plus 800 tons/day construction/demo waste.
Delta Thermo Sussex is designed to burn both municipal solid waste and sewage sludge. And DTE Paterson would accept 205 tons of waste/day. The price tag to build this small facility is not so small: $45 million.
Closed WTE Facilities
Two WTE plants in New Jersey are no longer in operation. These include Fort Dix, which opened in 1986 and burned 80 tons of trash per day; and Atlantic County Jail, which opened in 1990 and burned 14 tons of trash per day.
Throw-aways, burn-aways, take-aways
Looming large above the arguments about appropriate siting, environmental justice, financial gain, and energy prices, is a bigger question:
How can we continue to live on this planet at our current rates of consumption, and the resultant waste generation?
The issue here is not so much about the sources of our heat and electricity in the future, but rather “How MUST we change our habits now to ensure a future on a livable planet?”
Professor Paul Connett (emeritus, St. Lawrence University), is a specialist in the build-up of dioxins in food chains, and the problems, dangers, and alternatives to incineration. He is a vocal advocate for a “Zero Waste” approach to consumption, and suggests that every community embrace these principles as ways to guide a reduction of our waste footprint on the planet. The fewer resources that are used, the less waste is produced, mitigating the extensive costs brought on by our consumptive lifestyles. Waste-to-energy incineration facilities are just a symptom of our excessively consumptive society.
Dr. Connett suggests these simple but powerful methods to drastically reduce the amount of materials that we dispose — whether by incineration, landfill, or out the car window on a back-road, anywhere in the world:
Source separation
Recycling
Door-to-door collection
Composting
Building Reuse, Repair and Community centers
Implementing waste reduction Initiatives
Building Residual Separation and Research centers
Better industrial design
Economic incentives
Interim landfill for non-recyclables and biological stabilization of other organic materials
Connett’s Zero Waste charge to industry is this: “If we can’t reuse, recycle, or compost it, industry shouldn’t be making it.” Reducing our waste reduces our energy footprint on the planet.
In a similar vein, FracTracker has written about the potential for managing waste through a circular economics model, which has been successfully implemented by the city of Freiburg, Germany. A circular economic model incorporates recycling, reuse, and repair to loop “waste” back into the system. A circular model focuses on designing products that last and can be repaired or re-introduced back into a natural ecosystem.
This is an important vision to embrace. Every day. Everywhere.
For more in-depth and informative background on plastic in the environment, please watch “The Story of Plastic” (https://www.storyofplastic.org/). The producers of the film encourage holding group discussions after the film so that audiences can actively think through action plans to reduce plastic use.
https://www.fractracker.org/a5ej20sjfwe/wp-content/uploads/2020/10/Waste-to-Energy-facilities-in-the-US-feature-.jpg16673750Karen Edelsteinhttps://www.fractracker.org/a5ej20sjfwe/wp-content/uploads/2019/10/Fractracker-Color-Logo.jpgKaren Edelstein2020-10-19 15:11:492020-10-20 17:32:13Incinerators: Dinosaurs in the world of energy generation
Fracking has been raised as an issue that could determine the outcome of the 2020 US presidential election. Republican candidates have cited erroneous figures of how many fracking jobs exist in Pennsylvania, and have falsely claimed that Democratic presidential candidate Joe Biden and running mate Kamala Harris seek to ban fracking. And while the Democratic candidates have made suggestive comments in the past, they have made their position clear. As Senator Harris stated in the vice presidential debate: “I will repeat, and the American people know, that Joe Biden will not ban fracking. That is a fact.”
The debate around this issue is not on whether or not fracking should be banned– something neither party advocates– but rather around the facts. Republican candidates have inflated the extent of fracking jobs by up to 3500 percent. But the natural gas industry and the fracking boom have failed to deliver the job growth and prosperity that was predicted by proponents a decade ago. In reality, the total number of jobs in the natural gas industry in Pennsylvania never reached more than 30,000 over the last five years and is now less with the industry’s economic decline.
The total number of jobs in the natural gas industry in Pennsylvania never reached more than 30,000 over the last five years and is now less with the industry’s economic decline.
The debate should not be around the facts- those are already firmly established. The debate should be around how to best support fossil fuel workers in the inevitable transition to cleaner energy. What does a just transition that supports workers and the climate look like?
FracTracker Alliance and The Breathe Project have compiled a fact sheet to help us answer this question based on where Pennsylvania currently stands.
Straight Talk on the Future of Jobs in Pennsylvania (September 2020)
The Breathe Project and FracTracker Alliance have crafted the following messaging for refuting the conflated job numbers being touted by pro-fossil fuel organizations and political candidates regarding fracking and jobs in Pennsylvania that, in some cases, has inflated natural gas jobs in the state by 3500 percent.
The natural gas industry and the fracking boom have failed to deliver the job growth and prosperity that was predicted by proponents a decade ago. The total number of jobs in the natural gas industry in Pennsylvania never reached more than 30,000 over the last five years and is now less with the industry’s economic decline.
FACT: The Pa. Dept. of Labor and Industry (DLI) reported that direct employment in natural gas development totaled 19,623 in 2016. This was down from 28,926 total natural gas development jobs in 2015. This includes jobs in drilling, extraction, support operations and pipeline construction and transportation. (StateImpact, 2016)
Pa. DLI calculated the employment figures using data from six data classifications at the U.S. Bureau of Labor Statistics — specifically, the North American Industry Classification System (NAICS) codes for cured petroleum and natural gas extraction, natural gas liquid extraction, drilling oil and gas wells, support activities for oil and gas operations, oil and gas pipeline and related structures and pipeline transportation of natural gas. (Natural Gas Intel, 2016)
Inflated estimates of fracking-related jobs in Pennsylvania under previous Gov. Tom Corbett included regulators overseeing the industry as gas jobs, truck drivers, and those working in highway construction, steel mills, coal-fired power plants, sewage treatment plants, and others. Pa. Gov. Tom Wolf’s administration revised the way gas industry jobs were calculated to reflect a more accurate depiction of jobs in the sector.
FACT: Food & Water Watch calculated that there were 7,633 jobs pre-boom (2001 – 2006), which rose to 25,960 oil and gas industry jobs post-boom (2016 – 2018). (FWW, March 2020)
Food & Water Watch created a more accurate model using a definition that encompasses only jobs directly involved with domestic oil and gas production, specifically: oil and gas extraction; support activities for oil and gas operations; drilling oil and gas wells; oil and gas pipeline construction; and pipeline transportation.
FACT: The Food & Water Watch analysis also reports that misleadingly broad definitions in industry-supported job reports overstated the industries’ scope. The industry analysis included broad swaths of manufacturing industries including “fertilizer manufacturing,” convenience store workers, and gas station workers, which accounted for nearly 35 percent of all oil and gas jobs in their analysis. (FWW, PwC at 5 and Table 4 at 9, 2019)
FACT: As a point of comparison, in 2019, close to 1 million state residents were working in healthcare, 222,600 in education, and over 590,000 in local and state government. (Pennsylvania Bureau of Labor Statistics, July, 2020)
FACT: To forecast fracking-related job growth, the American Petroleum Institute used a model with exaggerated multipliers and faulty assumptions, such as the amount of purchases made from in-state suppliers, and it double counted jobs, leading to wildly optimistic estimates. (Ohio River Valley Institute, August 2020)
FACT: In addition, many of the jobs claimed in a 2017 American Chemistry Council Appalachian petrochemical economic impact study would arise in plastics manufacturing, which raises two concerns. First, both the ACC study and subsequent reports by the U.S. Department of Energy assume that 90% of the ethylene and polyethylene produced by imagined Appalachian cracker plants would be shipped out of the region to be used in manufacturing elsewhere in the country and the world. Of the 10% that would presumably stay in the region, much or most of it would serve to replace supplies that the region’s plastics manufacturers currently source from the Gulf Coast. (Ohio River Valley Institute, August 2020)
The fracking and petrochemical industries create unsustainable boom and bust cycles that do not holistically improve local economies.
FACT: Economic analyses show that the oil and gas industry is a risky economic proposition due to the current global oversupply of plastics, unpredictable costs to the industry, a lower demand for plastics, and increased competition. The analyses call into question industry’s plans to expand fracking and gas infrastructure in the region. (IEEFA, August 2020)
FACT: Plans to build petrochemical plants in Beaver County, Pennsylvania and Belmont, Ohio, for the sole purpose of manufacturing plastic nurdles will not be as profitable as originally portrayed. (IEEFA Report, June 2020)
A clean energy economy is the only way forward.
FACT: The Dept. of Energy’s U.S. Energy and Employment Report (2017) and E2 Clean Jobs Pennsylvania Report (2020) shows that clean energy jobs in Pennsylvania employ twice as many people as the fossil fuel industry prior to the pandemic.
FACT: The 4-state region of Ohio, West Virginia, Kentucky and Pennsylvania has formed a coalition of labor, policy experts and frontline community leaders called Reimagine Appalachia. This coalition is in the process of addressing the vast number of jobs in renewable and clean energy industries in a report that will be published this fall.
Reimagine Appalachia seeks major federal funding packages that will create jobs, rebuild infrastructure and addresses climate change that will ensure that no one is left behind going forward.
The Breathe Project is a coalition of citizens, environmental advocates, public health professionals and academics using the best available science and technology to improve air quality, eliminate climate pollution and make our region a healthy, prosperous place to live.
FracTracker Alliance is a 501(c)3 organization that maps, analyzes, and communicates the risks of oil, gas, and petrochemical development to advance just energy alternatives that protect public health, natural resources, and the climate.
Feature image of construction of the Royal Dutch Shell cracker plant in Beaver County, Pennsylvania, October 2019. Ted Auch, FracTracker Alliance.
https://www.fractracker.org/a5ej20sjfwe/wp-content/uploads/2020/10/TAuch_Plastics-Cracker_Construction-Shell-BeaverCounty_PA_Oct2019-Feature.jpg16673750Shannon Smithhttps://www.fractracker.org/a5ej20sjfwe/wp-content/uploads/2019/10/Fractracker-Color-Logo.jpgShannon Smith2020-10-14 11:54:592020-10-28 16:41:09Straight Talk on the Future of Fracking Jobs in Pennsylvania
FracTracker Alliance has released a new mapof drilling fluid spills along the Mariner East 2 pipeline route, showing 320 spills from its construction since 2017. Of those, a combined 147 incidents have released over 260,000 gallons of drilling fluid into Pennsylvania waterways.
The unpermitted discharge of drilling fluid, considered “industrial waste,” into waters of the Commonwealth violates The Clean Streams Law.
What you need to know:
Sunoco’s installation of the Mariner East 2 pipeline has triggered 320 incidences of drilling mud spills since 2017, releasing between 344,590 – 405,990 gallons of drilling fluid into the environment. View an interactive map and see a timeline of these incidents.
Construction has caused between 260,672 – 266,223 gallons of drilling fluid to spill into waterways, threatening the health of ecosystems and negatively affecting the drinking water of many residents.
There have been 36 spills since Pennsylvania entered a statewide shutdown on March 16th, 2020, in response to the COVID-19 pandemic. These spills released over 10,000 gallons of drilling fluid — most of which poured into Marsh Creek Lake in Marsh Creek State Park. See a map of this incident.
While the total reported volume of drilling fluid released into the environment from the pipeline’s construction is between 344,590 – 405,990 gallons, the actual total is larger, as there are 28 spills with unknown volumes. Spills of drilling mud are also referred to as “inadvertent returns,” or “frac-outs.”
Most of these spills occurred during implementation of horizontal directional drills (HDD). HDDs are used to install a pipeline under a waterway, road, or other sensitive area. This technique requires large quantities of drilling fluid (comprising water, bentonite clay, and chemical additives), which when spilled into the environment, can damage ecosystems and contaminate drinking water sources.
ME2 Background
The Mariner East 2 pipeline project is part of the Mariner East pipeline system, which carries natural gas liquids (NGLs) extracted by fracked wells in the Ohio River Valley east, to the Marcus Hook Facility in Delaware County, Pennsylvania. The NGLs will then go to Europe to be turned into plastic. Explore FracTracker’s other resources on this project:
There have been 36 spills since the Commonwealth shutdown statewide on March 16th, 2020, leaks that have jeopardized drinking water sources, putting communities at even higher risk during the COVID-19 pandemic.
On August 11th, construction caused a 15-foot wide and eight-foot deep subsidence event in the wetland (Figure 1). This caused drilling fluid to flow underground and contaminate groundwater, while also “adversely impacting the functions and values of the wetland.” Thirty-three acres of the lake are now closed to boating, fishing, and other uses of the lake — an extra blow, given the solace state parks have provided to many during this pandemic.
Figure 1. This HDD crossing in Upper Uwchlan Township, Chester County, caused over 8,000 gallons of drilling mud to spill into waterways. However, installation of the parallel 16-inch pipeline also caused spills at this same location in 2017.
A plume of drilling mud, captured here on video, entered the Marsh Creek Lake and settled on the lake bottom.
Upper Uwchlan Reroute
Last week, the PA DEP ordered Sunoco to suspend work on this HDD site and to implement a reroute using a course Sunoco had identified as an alternative in 2017:
“A 1.01 mile reroute to the north of the HDD is technically feasible. This would entail adjusting the project route prior to this HDD’s northwest entry/exit point to proceed north, cross under the Pennsylvania Turnpike, then proceed east for 0.7 miles parallel to the turnpike, cross Little Conestoga Road, then turn south, cross under the turnpike, and then reintersect the existing project route just east of this HDD’s southeast entry/exit point. There is no existing utility corridor here, however; therefore, this route would create a Greenfield utility corridor and would result in encumbering previously unaffected properties. The route would still cross two Waters of the Commonwealth and possible forested wetlands, and would pass in near proximity or immediately adjacent to five residential home sites. Both crossings of the turnpike would require “mini” HDDs or direct pipe bores to achieve the required depth of cover under the highway. Considered against the possibility of additional IRs [inadvertent returns] occurring on the proposed HDD, which are readily contained and cleaned up with minimal affect to natural resources, the permanent taking of the new 4 easement and likely need to use condemnation against previously unaffected landowners results in SPLP’s opinion that managing the proposed HDD is the preferred option.”
Based on that description, the route could follow the general direction of the dashed line in Figure 2:
Figure 2. Possible reroute of Mariner East 2 Pipeline shown with dashed line
The August incident likely surprised no one, as it was not the first spill at this location, and Sunoco’s own assessment acknowledged that this HDD crossing came with “a moderate to high risk of drilling fluid loss and IRs.”
Residents also sounded alarm bells for this drilling site. The proposal for just this location garnered over 200 public comments, all of which called on the DEP to deny Sunoco’s permit for drilling in this area. Many implored the DEP to consider the alternate route Sunoco must now use.
George Alexander, a Delaware County resident who runs a blog on this pipeline, the Dragonpipe Diary, says, “Sunoco/Energy Transfer continues to demonstrate in real time that they cannot build the Mariner Pipelines without inflicting harm upon our communities … The Marsh Creek situation is reminiscent of the damage to another favorite Pennsylvania lake, Raystown Lake in Huntingdon County.”
In 2017, Sunoco spilled over 200,000 gallons of drilling fluid into Raystown Lake, and released millions more underground. The spill caked acres of the lakebed with a coating of mud, hurting aquatic life and limiting recreational access to the lake. Sunoco failed to report the spills when they occurred, and the DEP fined the company $1.95 million for the incident. The fine is one of many Sunoco has incurred, including a $12.6 million penalty in February 2018 for permit violations, and more recently, a $355,636 penalty for drilling fluid discharges into waterways across eight counties.
The fracking boom triggered investment in projects to convert the fracked gas to plastic, leading to an oversupply in the global market. The industry made ambitious plans based on the price of plastic being $1/pound. Now, in 2020, the price is 40 – 60 cents per pound. If the Mariner East 2 pipeline is brought online, it likely will not be as profitable as its operators expected.
The poor finances of the oil and gas industry have led to the demise of several pipeline projects over the last few months. Phillips 66 announced in March it was deferring two pipelines — the Liberty Pipeline, which would transport crude oil from Wyoming to Oklahoma — and the Red Oak Pipeline system, planned to cross from Oklahoma to Texas. Kinder Morgan expressed uncertainty for its proposed Texas Permian Pass pipeline, and Enterprise Products Partners cancelled its Midland-to-ECHO crude oil pipeline project. The Atlantic Coast Pipeline also was cancelled this past July by Duke Energy and Dominion Energy, following “an unacceptable layer of uncertainty and anticipated delays,” and the Williams Constitution pipeline was also abandoned after years of challenges. In fact, the EIA recently reported that more pipeline capacity has been cancelled in 2020 than new capacity brought in service.
Will the Mariner East 2 be the next to fall?
Before you go
A note from the Safety 7: The Safety 7 are seven residents of Delaware and Chester Counties who are challenging Sunoco before the [Pennsylvania Public Utility Commission]. If you are outraged at the ongoing threat to our communities from this dangerous, destructive pipeline, please consider donating to the Safety 7 Legal fund … Our next hearing begins September 29, and funds from your support are urgently needed. This motion is representative of the kind of legal work we need, if we are to prevail in protecting our communities from this dangerous pipeline project. Please contribute today if you are able, and please share this appeal widely and let your friends and family know why this case matters to you!
https://www.fractracker.org/a5ej20sjfwe/wp-content/uploads/2020/09/ME2FeatureImage.jpg8331875Erica Jacksonhttps://www.fractracker.org/a5ej20sjfwe/wp-content/uploads/2019/10/Fractracker-Color-Logo.jpgErica Jackson2020-09-17 11:20:062020-09-28 15:22:31Mariner East 2 Causes Dozens of Spills Since Lockdown Began, Over 300 in Total
New Fortress Energy plans to build a liquefied natural gas (LNG) plant in Wyalusing, Pennsylvania, but residents in close proximity to the extensive facility and those along the transportation routes are pushing back due to health and safety concerns.
Overview
North America has an excess of fracked gas. The price of gas continues to plummet, due largely to an oversupply that exceeds market demand from Americans who want to enjoy their so-called “energy independence.” According to the United States Energy Information Administration (EIA), there is almost 18% more stored gas at the end of 2019 as there was at the end of 2018, translating to an increase of over 500 billion cubic feet over the course of a year.
What was once a promised economic boom to many communities has given way to bust. This is due, in part, to less production across the fracking fields, to the cancellation of numerous pipelines, and to the lack of domestic markets for fracked gas.
As costs for wind, solar, and grid-scale battery storage continue to drop, people are increasingly less reliant on fossil fuels. Aside from underground storage, what can industry do with all that excess product so industry has a justification to keep drilling?
Rather than cutting back on production, industry chooses to relieve domestic over-saturation by sending the gas off-shore for export.
While gas is typically moved from source to consumer via pipelines, transporting gas long distances overseas presents a technical challenge. Industry chooses to compress the gas under pressure or cryogenics so that it takes up less space. Liquefied natural gas, or LNG, is simply super-cooled methane, stored at minus 260 degrees Fahrenheit.
A new LNG project in northern Pennsylvania
A little more than a year ago, New Fortress Energy announced plans to invest $800 million to develop a liquefied natural gas plant along the scenic Susquehanna River in the Bradford County, Pennsylvania community of Wyalusing. In this quiet community of fewer than 600 people, formerly open fields and woodland are slated to be converted into massive LNG complex spanning 260 acres. The plant would produce approximately 3.6 million gallons of LNG each day.
Located on the site of the proposed LNG project is a historic marker, memorializing the pre-Colonial settlement of Friedenshütten. Here, indigenous Mahican, Lenape, and Haudenosaunee converts to Christianity lived with Moravian missionaries. The village was active between 1765 and 1772. According to Katherine Faull of Bucknell University “the Friedenshütten mission was dissolved in 1772, ostensibly because of the uncertainty of the land deals that had been made with the Cayuga who had jurisdiction over that part of Pennsylvania.” Portions of the settlement structure area visible in the 1768 map (Figure 1) are 700 feet from the New Fortress methane liquefaction buildings.
Figure 1. Map by Georg Wenzel Golkowsky, 1768 (TS Mp.213.13, Unity Archives, Herrnhut)
New Fortress Energy has plans to cut a 50-foot-wide stormwater drainage ditch directly through this historic site. Construction of the plant would reportedly create up to 500 temporary jobs, and 50 permanent ones.
Figure 2. Aerial view of site preparation work at the New Fortress LNG plant site. Source: Ted Auch, FracTracker Alliance
The site plan for the new facility, developed in October 2018, includes large gas engines, a liquefaction facility, a hydrocarbon impoundment basin, LNG storage and pumps, a gas treatment facility, transformers, and tanker staging areas. Some features are sited within 500 feet of the railroad.
Figure 3. Proposed site plan of the New Fortress LNG facility in Wyalusing, Pennsylvania. Map by FracTracker Alliance.
An air quality plan for the New Fortress LNG facility was approved in July, 2019. Although construction was well underway starting in spring 2019, work is currently paused on the site. New Fortress has not indicated when work would resume, but expects the construction process to span two to 2.5 years.
Where to, after Wyalusing?
Without an adequate market for the gas in the United States, LNG is destined for shipping overseas in specially-designed LNG carrier ships. In 2018, according to US government data reported in rigzone.com:
“….28 countries in total received LNG exports during 2018. However, just ten countries accounted for 82 percent of the U.S. LNG direct tanker exports that year and the top four markets shared 187 shipments between them. South Korea, the top destination, received 73 cargoes in all, followed by Mexico with 53, Japan with 37 and lastly China with 24. Of the remainder, Jordan, Chile, India, Turkey, Spain, Argentina, and Brazil took only a small number of shipments each. In addition to the standard large shipments of LNG in dedicated tankers, small shipments of LNG in special containers known as ISOs were sent to the Bahamas and Barbados.”
Presently, plans are in the works for the construction of a new LNG export facility in Gibbstown, New Jersey, located just downstream from Philadelphia on the Delaware River. The Gibbstown site was formerly the home of Dupont Repauno Works, where dynamite was manufactured from 1880 to 1954. Later, the main products made there were commodity chemicals such as nitric acid. The proposed export terminal design includes two 43-foot-deep docks that would accommodate LNG tankers.
The advocacy organization “Empower NJ” provides a comprehensive description here of the proposed expansion of the deepwater LNG export terminal at Gibbstown. LNG delivered to the site would be stored in an old underground cavern previously used by Dupont. While dredging for a single dock at Gibbstown was approved by the Delaware River in 2019, new plans to build two more loading berths at a second dock are now under consideration.
Modes of transportation from Wyalusing to Gibbstown
In collaboration with Delaware Riverkeeper Network (DRN), FracTracker looked at potential overland routes for how the LNG produced in Wyalusing would reach the nearest export terminal in Gibbstown, New Jersey, a distance of 200 or more miles away.
While transportation by rail of liquefied natural gas had not been permitted by federal regulations, a significant change in rules occurred in June 2020. Under pressure from the current administration in Washington, DC, the Pipeline and Hazardous Materials Safety Administration (PHMSA) issued a final rule that authorized the bulk transportation of LNG by rail.
Plans on how to deliver the LNG from the plant in Wyalusing to the export terminal in Gibbstown, New Jersey have not been finalized, and could be by roadway or railway, or both. According to the Wilkes-Barre, Pennsylvania-based Citizen’s Voice:
In its assessment, PHMSA concluded that transporting LNG via roadways carries the same inherent risks as railways, but there is a higher likelihood of an accident because of the larger number of trucks needed compared to train cars.
The DOT-113 tank cars New Fortress received approval for can carry nearly 30,700 gallons of LNG — three times more than a single tanker truck. But, because train cars carry significantly more LNG and are transported together along railways, an incident “could lead to higher consequences,” according to the environmental assessment.
How much risk?
Because there is little to no precedent of transporting such high volumes of liquefied natural gas on roads or railroads, the extent of the disaster that could occur from a leak or crash is generally unknown. However, Delaware Riverkeeper has cited research warning about the unique characteristics of supercooled gas if it rapidly expands and spreads across terrain:
“….transport of LNG has unique safety hazards, exposing those along this particular rail route to unprecedented and unjustifiable risk. An LNG release boils furiously into a flammable vapor cloud 600 times larger than the storage container. An unignited ground-hugging vapor cloud can move far distances,[1] and exposure to the vapor can cause extreme freeze burns. If in an enclosed space, it asphyxiates, causing death.1 If ignited, the fire is inextinguishable; the fire is so hot that second-degree burns can occur within 30 seconds for those exposed within a mile. An LNG release can cause a Boiling Liquid Expanding Vapor Explosion.[2] The explosive force of LNG is similar to a thermobaric explosion – a catastrophically powerful bomb. The 2016 U.S. Emergency Response Guidebook advises fire chiefs initially to immediately evacuate the surrounding 1-mile area.[3] No federal field research has shown how far the vapor cloud can move chiefs initially to immediately evacuate the surrounding 1-mile area.[4] No federal field research has shown how far the vapor cloud can move…”
You can read Delaware Riverkeeper’s full statement of the organization’s opposition to the transportation of LNG in rail cars here.
Visualizing the routes
FracTracker mapped the most likely transport routes by road and by rail, along with demographic information (Figures 5 – 9). In collaboration with DRN, we also assessed minority and low-income population density along each route, using the Environmental Protection Agency (EPA)’s environmental justice (EJ) screening dataset, EJSCREEN. “Minority” as defined by the United States Census data used by EPA, refers to individuals who reported their race and ethnicity as something other than “non-Hispanic White” alone.
On average, around 21% of the population along the truck routes, and about 25% of the population along the train routes, is part of an EJ community. EJ communities are those that are disproportionately impacted by environmental hazards and with increased vulnerability to said hazards. Due to systemic racism, injustice, and poverty, EJ communities tend to have higher proportions of residents who are low-income and/or minorities.
Total Population
Minority Population
Low-Income Population
Truck Route A
612,747
123,071 (20%)
122,830 (20%)
Truck Route B
929,236
207,924 (22%)
183,420 (20%)
Rail Route A
1,649,638
477,816 (29%)
392,577 (24%)
Rail Route B
1,947,544
479,500 (25%)
411,536 (21%)
Figure 4. Demographics of Environmental Justice (EJ) communities along New Fortress Energy’s liquified natural gas (LNG) transportation routes in the eastern United States.
Click here to view this map fullscreen, in its own window.
And click through the tabs below to see static images of the various routes.
Rail Route A
Figure 5. Rail Route A passes within 2 miles of a population of 1,649,638. 29% (477,816 individuals) are minorities, and 24% (392,577 individuals) are low income, according to 2010 US Census data compiled by the Environmental Protection Agency as part of their EJSCREEN program. Map made by FracTracker Alliance and published by Delaware Riverkeeper Network.
Rail Route B
Figure 6. Rail Route B passes within 2 miles of a population of 1,947,544. 25% (479,500 individuals) are minorities, and 21% (411,536 individuals) are low income, according to 2010 US Census data compiled by the Environmental Protection Agency as part of their EJSCREEN program. Map made by FracTracker Alliance and published by Delaware Riverkeeper Network.
Rail Route A Detail
Figure 7. Detail of Rail Route A close to proposed export terminal, and showing minority population density within 2 miles of the route. Map made by FracTracker Alliance and published by Delaware Riverkeeper Network.
Rail Route B Detail
Figure 8. Detail of Rail Route B close to proposed export terminal, and showing population density within 2 miles of the route. Map made by FracTracker Alliance and published by Delaware Riverkeeper Network.
Truck Route A
Figure 9. Truck Route A passes within 2 miles of a population of 612,747. 20% (123,071 individuals) are minorities, and 20% (122,830 individuals) are low income, according to 2010 US Census data compiled by the Environmental Protection Agency as part of their EJSCREEN program. Map made by FracTracker Alliance and published by Delaware Riverkeeper Network.
Truck Route B
Figure 10. Truck Route B passes within 2 miles of a population of 929,236. 22% (207,924 individuals) are minorities, and 20% (183,420 individuals) are low income, according to 2010 US Census data compiled by the Environmental Protection Agency as part of their EJSCREEN program. Map made by FracTracker Alliance and published by Delaware Riverkeeper Network.
Truck Route A Detail
Figure 11. Detail of Truck Route A close to proposed export terminal, and showing minority population density within 2 miles of the route.
Truck Route B Detail
Figure 12. Detail of Truck Route B close to proposed export terminal, and showing minority population density within 2 miles of the route. Map made by FracTracker Alliance and published by Delaware Riverkeeper Network.
Growing municipal and regulatory opposition to transport of LNG through communities
Municipal opposition against the plan to construct the LNG facility at Wyalusing is mounting. On Wednesday, September 2, 2020, the Borough Council of Clarks Summit, Pennsylvania (Lackawanna County) voted in opposition to the New Fortress Energy LNG project. Their resolution asked the Delaware River Basin Commission to vote to disapprove Dock 2, the cargo destination of the LNG trucks and trains that will be traversing Lackawanna County with their hazardous content.
And in most recent news, on September 10, the Delaware River Basin Commission (DRBC) voted to delay approving an application to expand the port facilities at Gibbstown, NJ that would have enabled LNG tankers to dock there. In this important turn of events, the representatives from New York, Delaware and New Jersey voted for the delay, while the Pennsylvania representative abstained, and the Federal representative from the US Army Corps of Engineers voted to deny it. The vote was preceded by a comment period in which the public expressed unanimous desire to stop the project, citing impacts to human and environmental health, as well as impacts from methane on climate catastrophe.
In the upcoming months, prior to when they meet again until December, the DRBC will more deeply consider the details of the application. Until that time, forward progress on the LNG plant and the export terminal is effectively halted.
In conclusion
As communities start to consider the impacts to health and safety posed by massive fossil fuel infrastructure—whether that is pipelines, compressor stations, drilling operations, or rail and road transport—clean energy alternatives like solar, wind, and geothermal become the sensible option for all. We applaud the elected officials in Clarks Summit for their vote early this month, and look forward to more following suit.
To stay up to date on the regional pushback against LNG and engage your voice in resistance, learn more at protectnorthernpa.org or sign-up to become an E-activist with Delaware Riverkeeper Network.
Feature photo by Ted Auch, FracTracker Alliance, with aerial support by Lighthawk
[1] “Immediate ignition with liquid still on the ground could cause the spill to develop into a pool fire and present a radiant heat hazard. If there is no ignition source, the LNG will vaporize rapidly forming a cold gas cloud that is initially heavier than air, mixes with ambient air, spreads and is carried downwind.” P. 10 “Methane in vapor state can be an asphyxiant when it displaces oxygen in a confined space.” P. 11. SP 20534 Special Permit to transport LNG by rail in DOT-113C120W rail tank cars. Final Environmental Assessment. Docket No. PHMSA-2019-0100. December 5, 2019. P. 10.
[2] “LNG tank BLEVE is possible in some transportation scenarios.” Sandia National Laboratories, “LNG Use and Safety Concerns (LNG export facility, refueling stations, marine/barge/ferry/rail/truck transport)”, Tom Blanchat, Mike Hightower, Anay Luketa. November 2014. https://www.osti.gov/servlets/purl/1367739 P. 23.
https://www.fractracker.org/a5ej20sjfwe/wp-content/uploads/2020/09/Aerial-view-of-site-preparation-work-at-the-New-Fortress-LNG-plant-site.jpg11743100Karen Edelsteinhttps://www.fractracker.org/a5ej20sjfwe/wp-content/uploads/2019/10/Fractracker-Color-Logo.jpgKaren Edelstein2020-09-15 10:13:212020-09-15 10:13:21LNG development puts Wyalusing, Pennsylvania in the cross-hairs
By Emma Vieregge, FracTracker Summer 2020 Environmental and Health Fellow
Overview
Unconventional oil and natural gas development, or “fracking,” began in Pennsylvania in the early 2000s. Since then, over 12,000 unconventional wells have been drilled in the state, and over 15,000 violations have been documented at unconventional well sites. As fracking operations continue to expand, increasing numbers of residents have experienced significant health impacts and irreparable damage to their property. Southwest Pennsylvania in particular has been heavily impacted, with high concentrations of oil and gas infrastructure developed in Washington, Greene, and Fayette Counties.
Fracking operations have led to declining air quality, water and soil contamination, and drastic changes to the physical landscape including deforestation, habitat fragmentation, road construction, and damaged farmland. While the volume of scientific literature about the physical and mental health impacts of fracking is rising, few studies exist that specifically focus on residents’ perceptions of the changing physical landscape. The primary goal of this qualitative study was to identify residents’ attitudes about the changing physical landscape resulting from fracking operations. Furthermore, how have these landscape changes affected residents’ engagement with the outdoors and their overall health?
Mental health, green spaces, and a changing landscape
Many scientific studies have documented the relationship between fracking developments and mental health, and between mental health and access to green spaces and engagement with the outdoors. Peer-reviewed studies have looked at heavily fracked communities across the US, many of which focus on Pennsylvania residents. Methods typically involve one-on-one interviews, larger focus groups, surveys, or a combination of the three, to identify how living amongst oil and gas operations takes a toll on everyday life. These studies have found an increase in stress and anxiety, feelings of powerlessness against the oil and gas industry, social conflicts, sleep disturbances, and reduced life satisfaction. Additionally, residents have experienced disruptions in their sense of place and social identity. For a summary of published research about the mental health impacts from fracking, click here.
A healthy strategy many choose to cope with stress and anxiety is engagement in outdoor recreation. Having easily accessible “green spaces,” or land that is partly or completely covered with grass, trees, shrubs, or other vegetation such as parks and conservation areas have been shown to promote physical and mental health. Many scientific studies have identified significantly fewer symptoms of depression, anxiety, and stress in populations with higher levels of neighborhood green space.1 Additionally, green spaces can aid recovery from mental fatigue and community social cohesion.2 3 However, residents in Southwestern Pennsylvania may slowly see their access to green spaces and opportunities for outdoor recreation decline due to the expansion of fracking operations. Figure 1 below shows a visual representation of the interconnected relationship between fracking, access to green spaces, and negative mental health impacts.
Figure 1. The interconnected relationship between fracking operations, landscape changes and decreasing access to outdoor recreation, and negative mental health impacts.
In the last 10-15 years, fracking operations in Southwest Pennsylvania have exploded. The development of new pipelines, access roads, well pads, impoundments, and compressor stations is widespread and altering the physical landscape. Figure 2 below illustrates just one of many examples of landscape disruption caused from fracking operations.
Figure 2. Examples of changes in the physical landscape caused from fracking operations in Greene County (A) and Washington County (B), Pennsylvania. Images taken from Google Earth.
Additionally, this time-slider map (Figure 3) illustrates a larger scale view of landscape changes in Greene County, Pennsylvania in a region just east of Waynesburg.
Figure 3. Time-slider map of a region in Greene County, PA where the left portion of the map is imagery from 2005, and the right portion of the map is from 2017. Active oil and gas wells are indicated by a blue pin, and compressor stations are in green.
Study design
A qualitative study was conducted to answer the following research questions:
What are residents’ perception of the landscape changes brought about by fracking?
Have these landscape changes caused any mental health impacts?
Have changes to the physical landscape from oil and gas operations resulting in any changes in engagement with outdoor recreation?
To better understand these topics, residents living in Southwestern Pennsylvania were recruited to participate in one-on-one phone interviews, and an online survey was also distributed throughout the FracTracker Alliance network. Recruitment for the one-on-one phone interviews was accomplished through FracTracker’s social media, and email blasts through other partnering organizations such as Halt the Harm Network, People Over Petro, and the Clean Air Council. Similarly, the online survey was shared on FracTracker’s social media and also distributed through our monthly newsletter. Since this was not a randomized sample to select participants, these results should not be generalized to all residents living near oil and gas infrastructure. However, this study identifies how certain individuals have been impacted by the changing landscape brought about by fracking operations.
Eight residents completed phone interviews, all of whom resided in Washington County, PA. Residents were first asked how long they have lived in their current home, and if there was oil and gas infrastructure on or near their property. Oil and gas infrastructure was defined as well pads, compressor stations, pipelines, ponds or impoundments, or access roads. Next, residents were asked if they had any health concerns regarding fracking operations and gave personal accounts of how fracking operations have altered the physical landscape near their home and in their surrounding community. For those with agricultural land, additional questions were asked about fracking’s impact on residents’ ability to use their farmland. Lastly, residents were asked questions focused on engagement in outdoor recreation and if fracking had any impact on outdoor recreation opportunities. NVivo, a qualitative analysis software, was used identify emergent themes throughout the interviews,
In addition to the interviews, an online survey was also made available.The main purpose of the survey was to gauge where concerns about landscape changes from fracking operations fell in relation to other oil and gas impacts (i.e. air pollution, water contamination, excess noise and traffic, and soil contamination). Nine responses were recorded, and the results are discussed below. However, if you would like to add your thoughts, you can find the survey at https://www.surveymonkey.com/r/Z5DCWBD.
Main findings and emergent themes
Various emergent themes surrounding the oil and gas industry’s impact on public health and the environment were identified throughout the resident interviews. Residents shared their personal experiences and how they have been directly impacted by fracking operations, especially with reference to the changing physical landscape surrounding their homes and throughout their communities. Participants’ time of residence in Washington County ranged from 3 years to their entire life, and all participants had oil and gas infrastructure (well pad, pipelines, impoundment, access roads, or compressor station) on or next to their property.
Changes to the physical landscape and residents’ attitudes toward the altered environment
The first overarching theme was changes to the physical landscape and residents’ attitudes toward the altered environment. All interview participants expressed concerns about the changes to the physical landscape on or surrounding their property, especially regarding access roads and well pads. Although one participant mentioned that widening the township road in order to make room for fracking trucks benefited the local community, the majority of participants expressed frustration about the construction of access roads, excessive truck traffic, noise, and dust from the unpaved access roads. One individual stated, “My main concern is the dust from the road. I’m constantly breathing that in, and it’s all over my shed, on the cars, the inside of the house, the outside of the house.” Multiple participants discussed the oil and gas operations disrupting what was once peaceful farmland with beautiful scenery (see an example in Figure 4 below). Another individual stated, “And of course, the noise is just unbearable. They don’t stop…the clanging on the pipe, the blow off with the wells, pumps running, generators, trucks coming down the hill with their engine brakes on, blowing their horn every time they want another truck to move.”
Figure 4. Aerial view of oil and gas infrastructure next to a home in Scenery Hill, PA. Image courtesy of Lois Bower-Bjornson from the Clean Air Council.
Impacts to outdoor recreation activities
Impacts to outdoor recreation activities such as hunting, fishing, and hiking were another recurring theme throughout the interviews. Again, a majority of participants believed their opportunities to partake in outdoor recreation have been limited since fracking operations began in their area.
Among the top concerns was deteriorating air quality and increasing numbers of ozone action days, or days when the air quality index (AQI) for ozone reaches an unhealthy level for sensitive populations. Various participants expressed concerns about letting their children outside due to harmful air emissions and odors originating from well pads or compressor stations. Excessive truck traffic was also a safety concern that was mentioned, especially for those individuals with access roads on or neighboring their property.
Additionally, one individual noted landscape changes in areas commonly used for hiking stating, “You might be hiking along a trail and then realize that you’re no longer on the trail. You’re actually on a pipeline cut. Or you’ll get confused while you’re hiking because you’ll intersect with a road that was developed for a well pad, and it’s not on your map.” Along with hiking, participants also noted a change in hunting and fishing opportunities since fracking moved into the region. Concerns were expressed regarding harvesting any fish or wild game due to possible contamination from fracking chemicals, especially near watersheds with known chemical spills.
Going for a hike and immersing oneself in nature is a healthy way to unwind and relieve stress. However, a rising number of well pads and compressor stations are put in place near parks, hiking trails, and state game lands throughout Southwest Pennsylvania (Figure 5). Participants expressed concerns about feeling unable to escape oil and gas infrastructure, even when visiting these recreational areas. As one individual mentioned, “It really does change your experience of the outdoors. And, you know, it’s an area that’s supposed to be a protected natural area. Then you know you can’t really get away. Even there in public lands far away from buildings and roads. And you can’t really get away from it.”
Figure 5. A map of active oil and gas well pads and compressor stations in Washington County, Pennsylvania. Map layers also indicate wells pads and compressor stations within 1 mile of a park, hiking trail, ball park, or state game land.
But what are the mental health impacts that result from the changing physical landscape brought about by fracking? Aside from the physical health effects caused by fracking activity — such as respiratory illnesses from air pollution or skin irritation from contaminated well water — these landscape changes have taken a toll on participants’ mental health as well.
Sentimental value and emotional distress
Many participants described the sentimental value of their property, and the beautiful scenery surrounding their generational family farms. But after fracking began on neighboring property, witnessing their tranquil family farm suddenly become surrounded by dusty access roads, excessive truck traffic, noise, and deteriorating air quality took a serious emotional and mental toll. When asked about the impact of the changing landscape, one participant stated, “It’s the emotional part of watching her childhood farm being destroyed while she is trying to do everything she can to rebuild it to the way it used to be.”
An additional emergent theme surrounding fracking landscape changes was surrounding agricultural impacts. Participants with agricultural land were asked additional questions about fracking’s impacts on their ability to use their farmland. One individual noted that one of their fields was now unusable due to large rocks and filter fabrics left from construction of a well pad, and redirected runoff uphill of their fields. The loss of productive farmland has further contributed to the mental and emotional stress. One participant added, “Our house is ruined, our health is ruined, and our farms are ruined.” In addition to agricultural impacts on large farms, multiple participants also mentioned concerns about their smaller-scale gardens, citing uncertainty about the impacts of air pollution and soil contamination on their produce.
Feelings of powerlessness and social tension
Some participants mentioned feelings of powerlessness against the oil and gas industry. Many families were not consulted prior to fracking operations beginning adjacent to their property. In some cases, this has resulted in significant declines in property values, leaving residents with no financial means to escape oil and gas activity. It is important to note that many residents are given temporary financial incentives to allow fracking on their land. However, to some, the monetary compensation failed to make up for the toll fracking took on their physical and mental health. Lastly, some participants also mentioned feeling stress and anxiety from the social tension resulting from fracking. Debates about the restrictions and regulations on fracking have divided many communities, leading to conflicts and social tensions between once-amiable neighbors.
Survey results
In addition to the interviews, an online survey was distributed to gain more insight as to where concerns about the changing physical landscape fell in relation to other effects associated with oil and gas development (such as poor air quality, water or soil contamination, truck traffic, and noise).
Nine individuals responded to the survey, all of whom indicated having oil and gas infrastructure within five miles of their home. All respondents also indicated that they participated in a wide variety of outdoor recreation activities such as hiking, wildlife viewing/photography, camping, hunting, and fishing.
Interestedly, only five respondents stated they felt fracking had a negative impact on their health, three responded they were unsure, and one responded no. However, all participants felt fracking had a negative impact on their surrounding environment. When discussing outdoor recreation, eight of nine respondents stated they felt fracking limited their access to outdoor recreation opportunities.
Next, respondents indicated that the level of concern related to the changing landscape brought about by fracking was equal to concerns about air pollution, water and soil contamination, noise, and truck traffic (using a 5-point likert scale). Lastly, one respondent stated that they closed their outdoor recreation tourism business due to blowdown emission (the release of gas from a pipeline to the atmosphere in order to relieve pressure in the pipe so that maintenance or testing can take place) and noise from fracking operations.
Conclusion and future directions
In summary, fracking operations have deeply impacted these individuals living in Washington County, Pennsylvania. Not only do residents experience deteriorating air quality, water contamination, and physical health effects, but the mental and emotional toll of witnessing multigenerational farms become forever changed can be overbearing. Other mental health impacts included rising social tensions, feelings of powerlessness, and continuous emotional distress. Fracking operations continue to change the physical landscape, tarnishing Southwest Pennsylvania’s natural beauty and threatening access to outdoor recreation opportunities. Unfortunately, those not living in the direct path of fracking operations struggle to grasp the severity of fracking’s impact on families living with oil and gas infrastructure on or near their property. More widespread awareness of fracking’s impacts is needed to educate communities and call for stricter enforcement of regulations for the oil and gas industry. As one resident summed up their experiences,
“Engines are running full blast, shining lights, and just spewing toxins out there. And you can’t get away from it. You just can’t. You can’t drink the water. You can’t breathe the air. You can’t farm the ground. And you’re stuck here.”
Hopefully, shedding light on residents’ experiences such as these will bring policymakers to reconsider fracking regulations to minimize the impact on public health and the surrounding environment.
By Emma Vieregge, FracTracker Summer 2020 Environmental and Health Fellow
Acknowledgements
The 2020 Environmental Health Fellowship was made possible by the Community Foundation for the Alleghenies and the Heinz Endowments.
Many thanks to all participants who took the time to share their experiences with me, Lois Bower-Bjornson with the Clean Air Council, Jessa Chabeau at the Southwest Pennsylvania Environmental Health Project, and the FracTracker team for all of their feedback and expertise.
Feature image courtesy of Lois Bower-Bjornson from the Clean Air Council.
References:
1 Beyer, K., Kaltenbach, A., Szabo, A., Bogar, S., Nieto, F., & Malecki, K. (2014). Exposure to Neighborhood Green Space and Mental Health: Evidence from the Survey of the Health of Wisconsin. International Journal of Environmental Research and Public Health,11(3), 3453-3472. doi:10.3390/ijerph110303453
2 Berman, M. G., Kross, E., Krpan, K. M., Askren, M. K., Burson, A., Deldin, P. J., . . . Jonides, J. (2012). Interacting with nature improves cognition and affect for individuals with depression. Journal of Affective Disorders,140(3), 300-305. doi:10.1016/j.jad.2012.03.012
3 Maas, J., Dillen, S. M., Verheij, R. A., & Groenewegen, P. P. (2009). Social contacts as a possible mechanism behind the relation between green space and health. Health & Place,15(2), 586-595. doi:10.1016/j.healthplace.2008.09.006
https://www.fractracker.org/a5ej20sjfwe/wp-content/uploads/2020/08/Fracking-SW-PA-feature-Lois-Bower-Bjornson.jpg16673750Guest Authorhttps://www.fractracker.org/a5ej20sjfwe/wp-content/uploads/2019/10/Fractracker-Color-Logo.jpgGuest Author2020-08-20 11:07:572020-10-21 15:59:30Landscape Changes and Mental Health Impacts in Southwestern Pennsylvania Communities: A Qualitative Study
In this special one-day fundraiser event, two intrepid FracTracker teams will build and share a live virtual map as we travel throughout the Ohio River Valley Region documenting oil, gas, and its effects on our health, climate, and environment.
How many sites can we visit in one day? What will we find?
We’ll share our findings to build awareness about the plight of this region—and so many other places victimized by this rogue industry. Plus, viewers will gain a firsthand understanding of how FracTracker turns data into real-world impact.
Proceeds will benefit the ongoing work of FracTracker to decarbonize our economy and promote environmental justice.
Whether you are able to contribute financially at this time or not, we hope you’ll join us on this virtual journey. You’ll see regular video updates along the way as we share our progress, and watch as a story map is updated throughout the day.
Join our team of explorers in spirit and pledge your support! We’re excited to share this journey with you.
https://www.fractracker.org/a5ej20sjfwe/wp-content/uploads/2020/08/FracTracker-in-the-Field-promotion5.jpg45008000FracTracker Alliancehttps://www.fractracker.org/a5ej20sjfwe/wp-content/uploads/2019/10/Fractracker-Color-Logo.jpgFracTracker Alliance2020-08-14 12:44:552020-08-24 14:43:04FracTracker in the Field: Building a Live Virtual Map
By Ted Auch, PhD, Great Lakes Program Coordinator and Shannon Smith, Manager of Communications & Development
The oil and gas industry continues to use rhetoric focusing on national security and energy independence in order to advocate for legislation to criminalize climate activists. Backlash against protestors and environmental stewards has only increased since the onset of COVID-19, suggesting that industry proponents are exploiting this public health crisis to further their own dangerous and controversial policies.[1]
Industry actors contributing to the wave of anti-protest bills include American Petroleum Institute (API), IHS Markit, The American Fuel & Petrochemical Manufacturers (AFPM), and most effectively, the American Legislative Exchange Council (ALEC), by way of its primary financial backer, Koch Industries (Fang, 2014, Shelor, 2017).
ALEC is the source of the model legislation “Critical Infrastructure Protection Act” of 2017, intended to make it a felony to “impede,” “inhibit,” “impair,” or “interrupt” critical infrastructure operation and/or construction. Close approximations – if not exact replicas – of this legislative template have been passed in 11 hydrocarbon rich and/or pathway states, and 8 more are being debated in 4 additional states.
The “critical infrastructure” designation in ALEC’s “Critical Infrastructure Protection Act” is extremely broad, including over 70 pieces of infrastructure, from wastewater treatment and well pads, to ports and pipelines. However, along with the 259 Foreign Trade Zones (FTZ) (Figures 1 and 4) supervised by US Customs and Border Protection (CBP), security is of such importance because over 50% of this infrastructure is related to oil and gas. According to our analysis, there are more than 8,000 unique pieces of infrastructure that fall under this designation, with over 10% in the Marcellus/Utica states of Ohio, West Virginia, and Pennsylvania. See Figure 1 for the number of FTZ per state.
Regarding FTZ, the US Department of Homeland Security doesn’t attempt to hide their genuine nature, boldly proclaiming them “… the United States’ version of what are known internationally as free-trade zones … to serve adequately ‘the public interest’.” If there remains any confusion as to who these zones are geared toward, the US Department of Commerce’s International Administration (ITA) makes the link between FTZ and the fossil fuel industry explicit in its FTZ FAQ page, stating “The largest industry currently using zone procedures is the petroleum refining industry.” (Figure 2)
Figure 1. Number of Foreign-Trade Zones (FTZ) by state as of June 2020.
Figure 2. Foreign-Trade Zone (FTZ) Board of Actions in Zones 87 in Lake Charles, LA, 115-117 in and around Port Arthur, TX, and 122 in Corpus Christi, TX. (click on the images to enlarge)
Foreign-Trade Zone (FTZ) Board of Actions in Zone 87 in Lake Charles, Louisiana
Foreign-Trade Zone (FTZ) Board of Actions in Zones 115-117 in and around Port Arthur, Texas
Foreign-Trade Zone (FTZ) Board of Actions in Zone 122 in Corpus Christi, Texas
Much of the oil, gas, and petrochemical industries’ efforts stem from the mass resistance to the Dakota Access Pipeline (DAPL). Native American tribes and environmental groups spent months protesting the environmentally risky $3.78 billion dollar project, which began production in June 2017, after Donald Trump signed an executive order to expedite construction during his first week in office. The Standing Rock Sioux tribe also sued the US government in a campaign effort to protect their tribal lands. The world watched as Energy Transfer Partners (ETP), the company building the pipeline, destroyed Native artifacts and sacred sites, and as police deployed tear gas and sprayed protesters with water in temperatures below freezing.
ETP’s bottom line and reputation were damaged during the fight against DAPL. Besides increasingly militarized law enforcement, the oil and gas industry has retaliated by criminalizing similar types of protests against fossil fuel infrastructure. However, the tireless work of Native Americans and environmental advocates has resulted in a recent victory in March 2020, when a federal judge ordered a halt to the pipeline’s production and an extensive new environmental review of DAPL.
Just days ago, on July 6, 2020, a federal judge ruled that DAPL must shut down until further environmental review can assess potential hazards to the landscape and water quality of the Tribe’s water source. This is certainly a victory for the Standing Rock Sioux Tribe and other environmental defenders, but the decision is subject to appeal.
Since the DAPL conflict began, the industry has been hastily coordinating state-level legislation in anticipation of resistance to other notable national gas transmission pipelines, more locally concerning projects like Class II Oil and Gas Waste Injection Wells, and miles of gas gathering pipelines that transport increasing streams of waste – as well as oil and gas – to coastal processing sites.
The following “critical infrastructure” bills have already been enacted:
STATE
BILL
TITLE
DATE PASSED
West Virginia
HB 4615
NEW PENALTIES FOR PROTESTS NEAR GAS AND OIL PIPELINES
3/25/20
South Dakota
SB 151
NEW PENALTIES FOR PROTESTS NEAR PIPELINES AND OTHER INFRASTRUCTURE
3/18/20
Kentucky
HB 44
NEW PENALTIES FOR PROTESTS NEAR PIPELINES AND OTHER INFRASTRUCTURE
3/16/20
Wisconsin
AB 426
NEW PENALTIES FOR PROTESTS NEAR GAS AND OIL PIPELINES
11/21/19
Missouri
HB 355
NEW PENALTIES FOR PROTESTS NEAR GAS AND OIL PIPELINES
7/11/19
Texas
HB 3557
NEW CRIMINAL AND CIVIL PENALTIES FOR PROTESTS AROUND CRITICAL INFRASTRUCTURE
6/14/19
Tennessee
SB 264
NEW PENALTIES FOR PROTESTS NEAR GAS AND OIL PIPELINES
5/10/19
Indiana
SB 471
NEW PENALTIES FOR PROTESTS NEAR CRITICAL INFRASTRUCTURE
5/6/19
North Dakota
HB 2044
HEIGHTENED PENALTIES FOR PROTESTS NEAR CRITICAL INFRASTRUCTURE
4/10/19
Louisiana
HB 727
HEIGHTENED PENALTIES FOR PROTESTING NEAR A PIPELINE
5/30/18
Oklahoma
HB 1123
NEW PENALTIES FOR PROTESTS NEAR CRITICAL INFRASTRUCTURE
5/3/17
There are an additional eight bills proposed and under consideration in these six states:
STATE
PENDING
TITLE
DATE PROPOSED
Louisiana
HB 197
NEW PENALTIES FOR PROTESTS NEAR CRITICAL INFRASTRUCTURE
2/24/20
Minnesota
HF 3668
NEW PENALTIES FOR PROTESTS NEAR GAS AND OIL PIPELINES
2/24/20
Mississippi
HB 1243
NEW PENALTIES FOR PROTESTS NEAR CRITICAL INFRASTRUCTURE
2/19/20
Alabama
SB 45
NEW PENALTIES FOR PROTESTS NEAR GAS AND OIL PIPELINES
2/4/20
Minnesota
HF 2966
NEW PENALTIES FOR PROTESTS NEAR OIL AND GAS PIPELINES
1/31/20
Minnesota
SF 2011
NEW PENALTIES FOR PROTESTS NEAR GAS AND OIL PIPELINES
3/4/19
Ohio
SB 33
NEW PENALTIES FOR PROTESTS NEAR CRITICAL INFRASTRUCTURE
2/12/19
Illinois
HB 1633
NEW PENALTIES FOR PROTESTS NEAR CRITICAL INFRASTRUCTURE
1/31/19
Desperate Backlash Against Peaceful Protest
Activists and organizations like the American Civil Liberties Union (ACLU) are framing their opposition to such legislation as an attempt to stave off the worst Orwellian instincts of our elected officials, whether they are in Columbus or Mar-a-Lago. On the other hand, industry and prosecutors are framing these protests as terroristic acts that threaten national security, which is why sentencing comes with a felony conviction and up to ten years in prison. The view of the FBI’s deputy assistant director and top official in charge of domestic terrorism John Lewis is that, “In recent years, the Animal Liberation Front and the Earth Liberation Front have become the most active, criminal extremist elements in the United States … the FBI’s investigation of animal rights extremists and ecoterrorism matters is our highest domestic terrorism investigative priority.”
It shocked many when last week, two protesters in the petrochemical-laden “Cancer Alley” region of Louisiana were arrested and charged under the state’s felony “terrorist” law. Their crime? Placing boxes of nurdles – plastic pellets that are the building blocks of many single-use plastic products – on the doorsteps of fossil fuel lobbyists’ homes. To make matters more ridiculous, the nurdles were illegally dumped by the petrochemical company Formosa Plastics.[2] This is outrageous indeed, but is the sort of legally-sanctioned oppression that fossil fuel industry lobbyists have been successfully advocating for years.
American Fuel & Petrochemical Manufacturers (AFPM) stated in a letter of support for ALEC’s legislative efforts:
“In recent years, there has been a growing and disturbing trend of individuals and organizations attempting to disrupt the operation of critical infrastructure in the energy, manufacturing, telecommunications, and transportation industries. Energy infrastructure is often targeted by environmental activists to raise awareness of climate change and other perceived environmental challenges. These activities, however, expose individuals, communities, and the environment to unacceptable levels of risk, and can cause millions of dollars in damage … As the private sector continues to expand and maintain the infrastructure necessary to safely and reliably deliver energy and other services to hundreds of millions of Americans, policymakers should continue to consider how they can help discourage acts of sabotage … Finally, it will also hold organizations both criminally and vicariously liable for conspiring with individuals who willfully trespass or damage critical infrastructure sites.”
Those organizations deemed ‘criminally and vicariously liable’ would in some states face fines an order of magnitude greater than the actual individual, which would cripple margin-thin environmental groups around the country, and could amount to $100,000 to $1,000,000. The AFPM’s senior vice president for federal and regulatory affairs Derrick Morgan referred to these vicarious organizations as “inspiring … organizations who have ill intent, want to encourage folks to damage property and endanger lives …”
One of the most disturbing aspects of this legislation is that it could, according to the testimony and additional concerns of ACLU of Ohio’s Chief Lobbyist Gary Daniels, equate “‘impeding’ and ‘inhibiting’ the ‘operations’ of a critical infrastructure site” with acts as innocuous as Letters to the Editor, labor strikes or protests, attending and submitting testimony at hearings, or simply voicing your concern or objections to the validity of industry claims and its proposals with emails, faxes, phone calls, or a peaceful protest outside critical infrastructure that raises the concern of site security. Mr. Daniels noted in his additional written testimony that the latter, “may prove inconvenient to the site’s staff, under SB 250 they would be an F3 [Third Degree Felony], and that is without someone even stepping foot on or near the property, as physical presence is not required to be guilty of criminal mischief, as found in/defined in Sec. 2907.07(A)(7) of the bill.”
Figure 3. A rally held by the Louisiana-based nonprofit RISE St. James.
This connection, when enshrined into law, will have a chilling effect on freedom of speech and assembly, and will stop protests or thoughtful lines of questioning before they even start. As the Ohio Valley Environmental Coalition (OVEC) put it in their request for residents to ask the governor to veto the now-enacted HB 4615, such a bill is unnecessary, duplicative, deceitful, un-American, unconstitutional, and “will further crowd our jails and prisons.”
To combat such industry-friendly legislation that erodes local government control in Ohio, lawmakers like State Senator Nikki Antonio are introducing resolutions like SR 221, which would, “abolish corporate personhood and money-as-speech doctrine” made law by the Supreme Court of the United States’ rulings in Citizens United v. FEC and Buckley v. Valeo. After all, the overarching impact of ALEC’s efforts and those described below furthers privatized, short-term profit and socialized, long-term costs, and amplifies the incredibly corrosive Citizen’s United decision a little over a decade ago.
Further Criminalization of Protest, Protections for Law Enforcement
Simultaneously, there is an effort to criminalize protest activities through “riot boosting acts,” increased civil liability and decreased police liability, trespassing penalties, and new sanctions for protestors who conceal their identities (by wearing a face mask, for example).
The following bills have already been enacted:
STATE
BILL
TITLE
DATE PASSED
South Dakota
SB 189
EXPANDED CIVIL LIABILITY FOR PROTESTERS AND PROTEST FUNDERS
3/27/19
West Virginia
HB 4618
ELIMINATING POLICE LIABILITY FOR DEATHS WHILE DISPERSING RIOTS AND UNLAWFUL ASSEMBLIES
3/10/18
North Dakota
HB 1426
HEIGHTENED PENALTIES FOR RIOT OFFENCES
2/23/17
North Dakota
HB 1293
EXPANDED SCOPE OF CRIMINAL TRESPASS
2/23/17
North Dakota
HB 1304
NEW PENALTIES FOR PROTESTERS WHO CONCEAL THEIR IDENTITY
2/23/17
In addition, the following bills have been proposed and are under consideration:
STATE
PENDING
TITLE
DATE PROPOSED
Rhode Island
H 7543
NEW PENALTIES FOR PROTESTERS WHO CONCEAL THEIR IDENTITY
2/12/20
Oregon
HB 4126
HARSH PENALTIES FOR PROTESTERS WHO CONCEAL THEIR IDENTITY
1/28/20
Tennessee
SB 1750
NEW PENALTIES FOR PROTESTERS WHO CONCEAL THEIR IDENTITY
1/21/20
Ohio
HB 362
NEW PENALTIES FOR PROTESTERS WHO CONCEAL THEIR IDENTITY
10/8/19
Pennsylvania
SB 887
NEW PENALTIES FOR PROTESTS NEAR “CRITICAL INFRASTRUCTURE”
10/7/19
Massachusetts
HB 1588
PROHIBITION ON MASKED DEMONSTRATIONS
1/17/19
All the while, the Bundy clan of Utah pillage – and at times – hold our public lands hostage, and white male Michiganders enter the state capital in Lansing armed for Armageddon, because they feel that COVID-19 is a hoax. We imagine that it isn’t these types of folks that West Virginia State Representatives John Shott and Roger Hanshaw had in mind when they wrote and eventually successfully passed HB 4618, which eliminated police liability for deaths while dispersing riots and unlawful assemblies.
Contrarily, South Dakota’s SB 189, or “Riot Boosting Act,” was blocked by the likes of US District Judge Lawrence L. Piersol, who wrote:
“Imagine that if these riot boosting statutes were applied to the protests that took place in Birmingham, Alabama, what might be the result? … Dr. King and the Southern Christian Leadership Conference could have been liable under an identical riot boosting law.”
FracTracker collaborated with Crude Accountability on a report documenting increasing reprisals against environmental activists in the US and Eurasia. Read the Report.
Figure 4. Photo of US Treasury Department signage outlining the warning associated with BP’s Whiting, IN, oil refinery designated a Foreign Trade Zone (FTZ). Photo by Ted Auch July 15th, 2015
In all fairness to Mr. Emanuel, he was referring to the Obama administration’s support for the post-2008 bipartisan Wall Street bailout. However, it is critical that we acknowledge the push for critical infrastructure legislation has been most assuredly bipartisan, with Democratic Governors in Kentucky, Louisiana, and Wisconsin signing into law their versions on March 16th of this year, in May of 2018, and in November of 2019, respectively.
Related Legislation in Need of Immediate Attention
In Columbus, Ohio, there are several pieces of legislation being pushed in concert with ALEC-led efforts. These include the recently submitted HB 362, that would “create the crime of masked intimidation.” Phil Plummer and George F. Lang sponsor the bill, with the latter being the same official who introduced HB 625, a decidedly anti-local control bill that would preempt communities from banning plastic bags. Most of the general public and some of the country’s largest supermarket chains have identified plastic bag bans as a logical next step as they wrestle with their role in the now universally understood crimes plastics have foisted on our oceans and shores. As Cleveland Scene’s Sam Allard wrote, “bill mills” and their willing collaborators in states like Ohio cause such geographies to march “boldly, with sigils flying in the opposite direction” of progress, and a more renewable and diversified energy future.
With respect to Plummer and Lang’s HB 362, two things must be pointed out:
1) It is eerily similar to North Dakota’s HB 1304 that created new penalties for protestors who conceal their identity, and
So, when elected officials as far away as Columbus copy and paste legislation passed in the aftermath of the DAPL resistance efforts, it is clear the message they are conveying, and the audience(s) they are trying to intimidate.
Plummer and Lang’s HB 362 would add a section to the state’s “Offenses Against the Public Peace,” Chapter 2917, that would in part read:
No person shall wear a mask or disguise in order to purposely do any of the following:
(A) Obstruct the execution of the law;
(B) Intimidate, hinder, or interrupt a person in the performance of the person’s legal duty; or
(C) Prevent a person from exercising the rights granted to them by the Constitution or the laws of this state.
Whoever violates this proposed section is guilty of masked intimidation. Masked intimidation is a first degree misdemeanor. It was critical for the DAPL protestors to protect their faces during tear gas and pepper spray barrages, from county sheriffs and private security contractors alike.
At the present moment, masks are one of the few things standing between COVID-19 and even more death. Given these realities, it is stunning that our elected officials have the time and/or interest in pushing bills such as HB 362 under the thin veil of law and order.
But judging by what one West Virginia resident and former oil and gas industry draftsman,[3] wrote to us recently, elected officials do not really have much to lose, given how little most people think of them:
“Honestly, it doesn’t seem to matter what we do. The only success most of us have had is in possibly slowing the process down and adding to the cost that the companies incur. But then again, the increase in costs probably just gets passed down to the consumers. One of the biggest drawbacks in my County is that most, if not all, of the elected officials are pro drilling. Many of them have profited from it.”
The oil, gas, and petrochemical industries are revealing their weakness by scrambling to pass repressive legislation to counteract activists. But social movements around the world are determined to address interrelated social and environmental issues before climate chaos renders our planet unlivable, particularly for those at the bottom of the socioeconomic ladder. We hope that by shining a light on these bills, more people will become outraged enough to join the fight against antidemocratic legislation.
This is Part I of a two-part series on concerning legislation related to the oil, gas, and petrochemical industries. Part II focuses on bills that would weaken environmental regulations in Ohio, Michigan, and South Dakota.
By Ted Auch, PhD, Great Lakes Program Coordinator and Shannon Smith, Manager of Communications & Development
[1] See Naomi Klein’s concept of the Shock Doctrine for similar trends.
[2] The community-based environmental organization RISE St. James has been working tirelessly to prevent Formosa Plastics from building one of the largest petrochemical complexes in the US in their Parish. Sharon Lavigne is a leading member of RISE St. James, and is an honored recipient of the 2019 Community Sentinel Award for Environmental Stewardship. Read more on Sharon’s work with RISE St. James here.
[3] This individual lives in Central West Virginia, and formerly monitored Oil & Gas company assets in primarily WV, PA, NY, VA, MD & OH, as well as the Gulf Coast. Towards the end of this individual’s career, they provided mapping support for the smart pigging program, call before you dig, and the pipeline integrity program.
For the past two years, a grand jury empaneled by Pennsylvania Attorney General Josh Shapiro has been investigating what they see as an oil and gas industry that has run amok. The Attorney General admonished the Pennsylvania Department of Environmental Protection (DEP) and to a lesser degree, the Department of Health (DOH), both of which they claim have conducted insufficient oversight of the industry, allowing serious problems to happen over and over again since the arrival of fracking in the Marcellus Shale sixteen years ago.
Mr. Shapiro claims that Pennsylvania should know better, as it is still dealing with the health and environmental impacts of mining and oil and gas operations that have been shuttered for decades. In fact, it was almost 50 years ago that the state Environmental Rights Amendment was adopted to the Pennsylvania constitution by a nearly 4 to 1 margin of Pennsylvania voters. It states:
Article I, Section 27: The people have a right to clean air, pure water, and to the preservation of the natural, scenic, historic and esthetic values of the environment. Pennsylvania’s public natural resources are the common property of all the people, including generations yet to come. As trustee of these resources, the Commonwealth shall conserve and maintain them for the benefit of all the people.
As a part of the state’s constitution, it is a fundamental part of the law of the land.
Criminal Charges
The Attorney General said that the grand jury heard hundreds of hours of expert testimony and impacted residents, and charges have already been issued against two companies – Range Resources and Cabot.
These moves are not without their critics, however. Range Resources pleaded no contest to charges of environmental crimes at several sites, which was compounded by a pattern of not informing local residents about the mishaps and potential impacts. In one of these cases, the grand jury found that the company became aware of a contamination event stemming from a shredded liner in a wastewater impoundment, for which they proceeded to do nothing about for three years, resulting in a contaminated aquifer. The company was further accused of falsifying laboratory data related to the case to affect the outcome of related civil suits.
For all of incidents reviewed, the company was slapped with a modest $50,000 fine, and agreed to a $100,000 contribution to a watershed group in the area. This can hardly be considered a deterrent; for a multi-billion dollar company in an industry where each well costs millions of dollars to drill, this amounts to nearly nothing beyond the routine cost of doing business.
Cabot’s charges stem from an infamous incident in 2008 in Dimock Township, Susquehanna County, that was highlighted in the movie GasLand. One of the wells exploded, and soon afterwards, neighbors began to notice contamination of their well water. Contaminants included methane, arsenic, barium, DEHP, glycol compounds, manganese, phenol, and sodium – a toxic cocktail consistent with hydraulic fracturing operations. As is common with many drilling contamination events, residents lost their water supplies and began to experience a series of health effects from the chemicals that they were exposed to. To this day, Cabot denies responsibility.
Obviously, it is difficult to put an entire corporation in jail, but some hold that employees who engaged in negligence or subterfuge certainly could be, or perhaps executives who oversaw or authorized such activities. Another possible outcome would include placing serious restrictions on the offending companies’ activities within the Commonwealth. As a means of comparison, please take a moment to browse through a list of operators that are banned from drilling activities in Texas. Honestly, this may take a few moments, because there are so many of them. One wonders what it would take ban a company from drilling in Pennsylvania.
But the focus of the Attorney General’s presentation was on the government’s shortcomings. Case after case of water contamination, gumming up expensive well pumps, and making water undrinkable. Many people had similar health complaints, including rashes, respiratory issues, nosebleeds, as well as pet and livestock health concerns and deaths. Mr. Shapiro’s question was clear: how were these problems were allowed to keep happening?
There is a 2020 grand jury seated as we speak, so this is certainly not the end of the story.
This map of 15,164 unconventional violations in Pennsylvania speaks to the issues presented in the report.
The grand jury developed a list of suggestions to move forward. They include:
Enact a 2,500-foot setback from homes to well sites. This is a very large increase over the current 500-foot standard, which Mr. Shapiro says is clearly insufficient to protect Pennsylvanians, as is evidenced by 16 years of documented problems.
Disallow secret injections of chemicals in hydraulic fracturing fluids. As FracTracker learned in our project with Partnership for Policy Integrity, companies injected 13,632 secret chemicals into over 2,500 wells in Pennsylvania just five years.
Enact common-sense toxic waste transportation, so that first responders and the public at large can find out when oil and gas waste has been transported. We find it interesting that the Attorney General chose the words “toxic waste” rather than “residual waste,” which we consider to be a loophole term that was invented to sidestep more stringent regulations.
Gathering lines for fracking wells need to be regulated based on risk, not size.
Reporting for air pollution needs to be aggregated by site, rather than reporting dozens of emission sources separately. This will allow researchers to better understand the cumulative risk at such locations.
A comprehensive public health study of the effects of exposure to contaminated air and water from fracking operations must be conducted. The Attorney General notes that the Department of Health has agreed with this recommendation, and preparations to conduct this study are underway.
The revolving door between regulators and industry must be stopped. Mr. Shapiro notes that at the very least, this cozy relationship creates an appearance of impropriety, which in itself erodes the public trust. He then went on to mention an instance where an operator hired seven former DEP office employees all at once.
The Attorney General’s office does not have original jurisdiction on environmental crimes, and must wait for a referral from a district attorney or the DEP. The DEP has not been making such referrals, considering civil penalties and fines to be sufficient. The Attorney General disagrees, and wants to hear directly from the people of Pennsylvania. To that end, a hotline has been setup.
Mr. Shapiro then proceeded to take DEP to task for its response to the investigation itself. The Department refused to send top staff to testify, he said, fighting with the grand jury investigation every step of the way. They then attempted to mislead the public, saying that they had no opportunity for input. What’s more, the Attorney General said that they spewed industry talking points, claiming that hundreds of hours of testimony were based on hearsay, and that a variety of the serious health impacts experienced by Pennsylvanians were, “not significant.”
In contrast, the Department of Health sent Secretary Rachel Levine to participate in the proceedings, who saw this as an opportunity to uncover her department’s shortcomings with respect to fracking over the past 16 years, and to forge a path forward in which they could do a better job in upholding their obligations.
While Mr. Shapiro characterized the response from DOH as earnest, DEP received no such accolades. “The DEP – let me be clear,” he said, “they need to clean up their act.”
By Matt Kelso, Manager of Data & Technology, FracTracker Alliance
Challenges have plagued Shell’s construction of the Falcon Pipeline System through Pennsylvania, Ohio, and West Virginia, according to documents from the Pennsylvania Department of Environmental Protection (DEP) and the Ohio Environmental Protection Agency (EPA).
Records show that at least 70 spills have occurred since construction began in early 2019, releasing over a quarter million gallons of drilling fluid. Yet the true number and volume of spills is uncertain due to inaccuracies in reporting by Shell and discrepancies in regulation by state agencies.
A drilling fluid spill from Falcon Pipeline construction near Moffett Mill Road in Beaver County, PA. Source: Pennsylvania DEP
Releases of drilling fluid during Falcon’s construction include inadvertent returns and losses of circulation – two technical words used to describe spills of drilling fluid that occur during pipeline construction.
Drilling fluid, which consists of water, bentonite clay, and chemical additives, is used when workers drill a borehole horizontally underground to pull a pipeline underneath a water body, road, or other sensitive location. This type of installation is called a HDD (horizontal directional drill), and is pictured in Figure 1.
Figure 1. An HDD operation – Thousands of gallons of drilling fluid are used in this process, creating the potential for spills. Click to expand. Source: Enbridge Pipeline
Here’s a breakdown of what these types of spills are and how often they’ve occurred during Falcon pipeline construction, as of March, 2020:
Loss of circulation
Definition: A loss of circulation occurs when there is a decrease in the volume of drilling fluid returning to the entry or exit point of a borehole. A loss can occur when drilling fluid is blocked and therefore prevented from leaving a borehole, or when fluid is lost underground.
Cause: Losses of circulation occur frequently during HDD construction and can be caused by misdirected drilling, underground voids, equipment blockages or failures, overburdened soils, and weathered bedrock.
Construction of the Falcon has caused at least 49 losses of circulation releasing at least 245,530 gallons of drilling fluid. Incidents include:
15 losses in Ohio – totaling 73,414 gallons
34 losses in Pennsylvania – totaling 172,116 gallons
Inadvertent return
Definition: An inadvertent return occurs when drilling fluid used in pipeline installation is accidentally released and migrates to Earth’s surface. Oftentimes, a loss of circulation becomes an inadvertent return when underground formations create pathways for fluid to surface. Additionally, Shell’s records indicate that if a loss of circulation is large enough, (releasing over 50% percent of drilling fluids over 24-hours, 25% of fluids over 48-hours, or a daily max not to exceed 50,000 gallons) it qualifies as an inadvertent return even if fluid doesn’t surface.
Cause: Inadvertent returns are also frequent during HDD construction and are caused by many of the same factors as losses of circulation.
Construction of the Falcon has caused at least 20 inadvertent returns, releasing at least 5,581 gallons of drilling fluid. These incidents include:
18 inadvertent returns in Pennsylvania – totaling 5,546 gallons
2,639 gallons into water resources (streams and wetlands)
2 inadvertent returns Ohio – totaling 35 gallons
35 gallons into water resources (streams and wetlands)
However, according to the Ohio EPA, Shell is not required to submit reports for losses of circulation that are less than the definition of an inadvertent return, so many losses may not be captured in the list above. Additionally, documents reveal inconsistent volumes of drilling mud reported and discrepancies in the way releases are regulated by the Pennsylvania DEP and the Ohio EPA.
Very few of these incidents were published online for the public to see; FracTracker obtained information on them through a public records request. The map below shows the location of all known drilling fluid releases from that request, along with features relevant to the pipeline’s construction. Click here to view full screen, and add features to the map by checking the box next to them in the legend. For definitions and additional details, click on the information icon.
Our investigation into these incidents began early this year when we received an anonymous tip about a release of drilling fluids in the range of millions of gallons at the SCIO-06 HDD over Wolf Run Road in Jefferson County, Ohio. The source stated that the release could be contaminating drinking water for residents and livestock.
Working with Clean Air Council, Fair Shake Environmental Legal Services, and DeSmog Blog, we quickly discovered that this spill was just the beginning of the Falcon’s construction issues.
Documents from the Ohio EPA confirm that there were at least eight losses of circulation at this location between August 2019 and January 2020, including losses of unknown volume. The SCIO-06 HDD location is of particular concern because it crosses beneath two streams (Wolf Run and a stream connected to Wolf Run) and a wetland, is near groundwater wells, and runs over an inactive coal mine (Figure 2).
Figure 2. Losses of circulation that occurred at the SCIO-06 horizontal directional drill (HDD) site along the Falcon Pipeline in Jefferson County Ohio. Data Sources: OH EPA, AECOM
According to Shell’s survey, the coal mine (shown in Figure 2 in blue) is 290 feet below the HDD crossing. A hazardous scenario could arise if an HDD site interacts with mine voids, releasing drilling fluid into the void and creating a new mine void discharge.
A similar situation occurred in 2018, when EQT Corp. was fined $294,000 after the pipeline it was installing under a road in Forward Township, Pennsylvania hit an old mine, releasing four million gallons of mine drainage into the Monongahela River.
The Ohio EPA’s Division of Drinking and Ground Waters looked into the issues around this site and reported, “GIS analysis of the pipeline location in Jefferson Co. does not appear to risk any vulnerable ground water resources in the area, except local private water supply wells. However, the incident location is above a known abandoned (pre-1977) coal mine complex, mapped by ODNR.”
While we cannot confirm if there was a spill in the range of millions of gallons as the source claimed, the reported losses of circulation at the SCIO-06 site total over 60,000 gallons of drilling fluid. Additionally, on December 10th, 2019, the Ohio EPA asked AECOM (the engineering company contracted by Shell for this project) to estimate what the total fluid loss would be if workers were to continue drilling to complete the SCIO-06 crossing. AECOM reported that, in a “very conservative scenario based on the current level of fluid loss…Overall mud loss to the formation could exceed 3,000,000 gallons.”
Despite this possibility of a 3 million+ gallon spill, Shell resumed construction in January, 2020. The company experienced another loss of circulation of 4,583 gallons, reportedly caused by a change in formation. However, in correspondence with a resident, Shell stated that the volume lost was 3,200 gallons.
Whatever the amount, this January loss of circulation appears to have convinced Shell that an HDD crossing at this location was too difficult to complete, and in February 2020, Shell decided to change the type of crossing at the SCIO-06 site to a guided bore underneath Wolf Run Rd and open cut trench through the stream crossings (Figure 3).
Figure 3. The SCIO-06 HDD site, which may be changed from an HDD crossing to an open cut trench and conventional bore to cross Wolf Run Rd, Wolf Run stream (darker blue), an intermittent stream (light blue) and a wetland (teal). Click to expand.
An investigation by DeSmog Blog revealed that Shell applied for the route change under Nationwide Permit 12, a permit required for water crossings. While the Army Corps of Engineers authorized the route change on March 17th, one month later, a Montana federal court overseeing a case on the Keystone XL pipeline determined that the Nationwide Permit 12 did not meet standards set by federal environmental laws – a decision which may nullify the Falcon’s permit status. At this time, the ramifications of this decision on the Falcon remain unclear.
Inconsistencies in Reporting
In looking through Shell’s loss of circulation reports, we noted several discrepancies about the volume of drilling fluid released for different spills, including those that occurred at the SCIO-06 site. As one example, the Ohio EPA stated an email about the SCIO-06 HDD, “The reported loss of fluid from August 1, 2019 to August 14, 2019 in the memo does not appear to agree with the 21,950 gallons of fluid loss reported to me during my site visit on August 14, 2019 or the fluid loss reported in the conference call on August 13, 2019.”
In addition to errors on Shell’s end, our review of documents revealed significant confusion around the regulation of drilling fluid spills. In an email from September 26, 2019, months after construction began, Shell raised the following questions with the Ohio EPA:
when a loss of circulation becomes an inadvertent return – the Ohio EPA clarifies: “For purposes of HDD activities in Ohio, an inadvertent return is defined as the unintended return of any fluid to the surface, as well as losses of fluids to underground formations which exceed 50-percent over a 24-hour period and/or 25-percent loss of fluids or annular pressure sustained over a 48-hour period;”
when the clock starts for the aforementioned time periods – the Ohio EPA says the time starts when “the drill commences drilling;”
whether Shell needs to submit loss of circulation reports for losses that are less than the aforementioned definition of an inadvertent return – the Ohio EPA responds, “No. This is not required in the permit.”
How are these spills measured?
A possible explanation for why Shell reported inconsistent volumes of spills is because they were not using the proper technology to measure them.
Shell’s “Inadvertent Returns from HDD: Assessment, Preparedness, Prevention and Response Plan” states that drilling rigs must be equipped with “instruments which can measure and record in real time, the following information: borehole annular pressure during the pilot hole operation; drilling fluid discharge rate; the spatial position of the drilling bit or reamer bit; and the drill string axial and torsional loads.”
In other words, Shell should be using monitoring equipment to measure and report volumes of drilling fluid released.
Despite that requirement, Shell was initially monitoring releases manually by measuring the remaining fluid levels in tanks. After inspectors with the Pennsylvania DEP realized this in October, 2019, the Department issued a Notice of Violation to Shell, asking the company to immediately cease all Pennsylvania HDD operations and implement recording instruments. The violation also cited Shell for not filing weekly inadvertent return reports and not reporting where recovered drilling fluids were disposed.
In Ohio, there is no record of a similar request from the Ohio EPA. The anonymous source that originally informed us of issues at the SCIO-6 HDD stated that local officials and regulatory agencies in Ohio were likely not informed of the full volumes of the industrial waste releases based on actual meter readings, but rather estimates that minimize the perceived impact.
While we cannot confirm this claim, we know a few things for sure: 1) there are conflicting reports about the volume of drilling fluids spilled in Ohio, 2) according to Shell’s engineers, there is the potential for a 3 million+ gallon spill at the SCIO-06 site, and 3) there are instances of Shell not following its permits with regard to measuring and reporting fluid losses.
The inconsistent ways that fluid losses (particularly those that occur underground) are defined, reported, and measured leave too many opportunities for Shell to impact sensitive ecosystems and drinking water sources without being held accountable.
What are the impacts of drilling fluid spills?
Drilling fluid is primarily composed of water and bentonite clay (sodium montmorillonite), which is nontoxic. If a fluid loss occurs, workers often use additives to try and create a seal to prevent drilling fluid from escaping into underground voids. According to Shell’s “Inadvertent Returns From HDD” plan, it only uses additives that meet food standards, are not petroleum based, and are consistent with materials used in drinking water operations.
However, large inadvertent returns into waterways cause heavy sedimentation and can have harmful effects on aquatic life. They can also ruin drinking water sources. Inadvertent returns caused by HDD construction along the Mariner East 2 pipeline have contaminated many water wells.
Losses of circulation can impact drinking water too. This past April in Texas, construction of the Permian Highway Pipeline caused a loss that left residents with muddy well water. A 3 million gallon loss of circulation along the Mariner East route led to 208,000 gallons of drilling mud entering a lake, and a $2 million fine for Sunoco, the pipeline’s operator.
Our Falcon Public EIA Project found 240 groundwater wells within 1/4 mile of the pipeline and 24 within 1,000 ft of an HDD site. The pipeline also crosses near surface water reservoirs. Drilling mud spills could put these drinking water sources at risk.
But when it comes to understanding the true impact of the more than 245,000+ gallons of drilling fluid lost beneath Pennsylvania and Ohio, there are a lot of remaining questions. The Falcon route crosses over roughly 20 miles of under-mined land (including 5.6 miles of active coal mines) and 25 miles of porous karst limestone formations (learn more about karst). Add in to the mix the thousands of abandoned, conventional, and fracked wells in the region – and you start to get a picture of how holey the land is. Where or how drilling fluid interacts with these voids underground is largely unknown.
Other Drilling Fluid Losses
In addition to the SCIO-04 HDD, there are other drilling fluid losses that occurred in sensitive locations.
In Robinson Township, Pennsylvania, over a dozen losses of circulation (many of which occurred over the span of several days) released a reported 90,067 gallons of drilling fluid into the ground at the HOU-04 HDD. This HDD is above inactive surface and underground mines.
The Falcon passes through and near surface drinking water sources. In Beaver County, Pennsylvania, the pipeline crosses the headwaters of the Ambridge Reservoir and the water line that carries out its water for residents in Beaver County townships (Ambridge, Baden, Economy, Harmony, and New Sewickley) and Allegheny County townships (Leet, Leetsdale, Bell Acres, and Edgeworth). The group Citizens to Protect the Ambridge Reservoir, which formed in 2012 to protect the reservoir from unconventional oil and gas infrastructure, led efforts to stop Falcon Construction, and the Ambridge Water Authority itself called the path of the pipeline “not acceptable.”In response to public pressure, Shell did agree to build a back up line to the West View Water Authority in case issues arose from the Falcon’s construction.
Unfortunately, a 50-gallon inadvertent return was reported at the HDD that crosses the waterline (Figure 4), and a 160 gallon inadvertent return occurred in Raccoon Municipal Park within the watershed and near its protected headwaters (Figure 5). Both of these releases are reported to have occurred within the pipeline’s construction area and not into waterways.
Figure 4) HOU-10 HDD location on the Falcon Pipeline, where 50 gallons were released on the drill pad on 7/9/2019
Figure 5) SCIO-05 HDD location on the Falcon Pipeline, where 160 gallons were released on 6/10/19, within the pipeline’s LOD (limit of disturbance)
Farther west, the pipeline crosses through the watershed of the Tappan Reservoir, which provides water for residents in Scio, Ohio and the Ohio River, which serves over 5 million people.
A 35- gallon inadvertent return occurred at a conventional bore within the Tappan Lake Protection Area, impacting a wetland and stream. We are not aware of any spills impacting the Ohio River.
Pipelines in a Pandemic
This investigation makes it clear that weak laws and enforcement around drilling fluid spills allows pipeline construction to harm sensitive ecosystems and put drinking water sources at risk. Furthermore, regulations don’t require state agencies or Shell to notify communities when many of these drilling mud spills occur.
The problem continues where the 97-mile pipeline ends – at the Shell ethane cracker. In March, workers raised concerns about the unsanitary conditions of the site, and stated that crowded workspaces made social distancing impossible. While Shell did halt construction temporarily, state officials gave the company the OK to continue work – even without the waiver many businesses had to obtain.
The state’s decision was based on the fact it considered the ethane cracker to “support electrical power generation, transmission and distribution.” The ethane cracker – which is still months and likely years away from operation – does not currently produce electrical power and will only provide power generation to support plastic manufacturing.
This claim continues a long pattern of the industry attempting to trick the public into believing that we must continue expanding oil and gas operations to meet our country’s energy needs. In reality, Shell and other oil and gas companies are attempting to line their own pockets by turning the country’s massive oversupply of fracked gas into plastic. And just as Shell and state governments have put the health of residents and workers on the line by continuing construction during a global pandemic, they are sacrificing the health of communities on the frontlines of the plastic industry and climate change by pushing forward the build-out of the petrochemical industry during a global climate crisis.
This election year, while public officials are pushing forward major action to respond to the economic collapse, let’s push for policies and candidates that align with the people’s needs, not Big Oil’s.
By Erica Jackson, Community Outreach & Communications Specialist, FracTracker Alliance
https://www.fractracker.org/a5ej20sjfwe/wp-content/uploads/2020/06/FalconPipelineFrontPage.jpg8963125Erica Jacksonhttps://www.fractracker.org/a5ej20sjfwe/wp-content/uploads/2019/10/Fractracker-Color-Logo.jpgErica Jackson2020-06-16 11:47:062020-06-18 12:11:30Falcon Pipeline Construction Releases over 250,000 Gallons of Drilling Fluid in Pennsylvania and Ohio
A Digital Atlas Exploring the Environmental Impacts of a Decade of Unconventional Natural Gas Extraction in the Loyalsock Creek Watershed
Fig. 1. Appalachia Midstream SVC LLC , Cherry Compressor Station in Cherry, Sullivan County, PA. (FLIR camera footage by Earthworks, July 2020)
An Introduction to the Loyalsock Creek Watershed
Nestled in Pennsylvania’s scenic Endless Mountains region, the Loyalsock Creek flows 64 miles from its headwaters in Wyoming County near the Sullivan County line, to a peaceful confluence with the West Branch Susquehanna River at Montoursville, east of Williamsport in Lycoming County. The lively, clear water drains 495 square miles, journeying through thick forests of the Allegheny Plateau over a landscape prized for rugged outdoor recreation, bucolic wooded respites, and quaint villages.
Local place names reflect the Munsee-Lenape, Susquehannock, and Iroquois peoples who called the area home at the time of early colonial settlement. The name Loyalsock stems from the native word Lawi-sahquick, meaning “middle creek.”
A favorite for angling, swimming, and whitewater paddling, the waterway supports a notorious resident – the aquatic eastern hellbender, the largest salamander in North America. In 2018, the Pennsylvania Department of Conservation and Natural Resources (DCNR) crowned the Loyalsock “River of the Year,” a program honoring the state’s premier rivers and streams and encouraging their stewardship.
Fig 2. Loyalsock Watershed Overview Map. (FracTracker Alliance, July 2020)
Contents
Click on the section title to jump to that section
A Wealth of Public Lands and Recreational Opportunity
Public Lands
Nearly one third of the Loyalsock watershed consists of state-owned public lands, including the 780-acre Worlds End State Park; 37,519 acres of state game lands; and, 65,939 acres of the Loyalsock State Forest. The State Forest encompasses two Natural Areas, Tamarack Run (201 acres) and Kettle Creek Gorge (774 acres), as well as a 1935-acre portion of Kettle Creek Wild Area.
Worlds End State Park was originally purchased by the state in 1929 in an attempt to allow the area to recover from clear-cutting. The land was significantly improved due to the work of the Civilian Conservation Corps in the 1930s. There is some uncertainty about the historical name of the region, and as a result, the park was renamed Whirl’s End in 1936, but reverted to Worlds End in 1943.
The area is a deep gorge cut by water rushing over millions of years through the Loyalsock Creek, over sedimentary formations known as the Sullivan Highlands. The gorge reaches 800 feet deep in some locations, where the fossilized remnants of 350-million-year-old lungfish burrows can be found.
Current amenities include 70 tent camping sites, 19 cabins, as well as group camping options accommodating up to 90 campers. A small swimming area on Loyalsock Creek is open in the summer months, and the Creek is also used for boating and fishing.
The Tamarack Run Natural Area protects one of the few enclaves of the tamarack tree, a species of larch common in Canada, but relatively rare as far south as the Loyalsock watershed.
The Kettle Creek Gorge Natural Area follows the path of Falls Run, which as the name suggests, contains numerous majestic waterfalls, including Angel Falls, which drops around 70 feet. The Natural Area is buffered by the Kettle Creek Wild Area. Kettle Creek is a Class A Wild Trout stream, meaning that natural populations of trout are sufficient in quantity and size to support fishing activities.
Fig. 3. A view of Loyalsock Creek from the High Rock Trail in Worlds End State Park. (Brook Lenker, FracTracker Alliance, August 2019)
Fig. 4. Tubing on Loyalsock Creek. (Brook Lenker, FracTracker Alliance, August 2019)
Relaxing on the Water
The Loyalsock watershed contains 909 miles of streams, with more than 395 miles (43%) classified as high quality (358 miles) or exceptional value (37 miles). The watershed contains 10,573 acres of wetlands, including 4,844 acres of forested wetlands, 3,261 acres of riverine wetlands, 1,013 acres of freshwater ponds, 761 acres of lakes, and 694 acres of emergent wetlands.
Another popular recreation spot within the Loyalsock watershed is Rose Valley Lake, a 389-acre artificial reservoir managed by the Pennsylvania Fish and Boat Commission. The lake contains a variety of fish, including bigmouth bass, bluegill, and walleye. Boating is restricted to electric motors and unpowered craft, making the area an idyllic getaway.
Trails
There are 238 miles of trails in the watershed, accommodating a variety of uses, including hiking, biking, horseback riding, cross-country skiing, and snowmobiles. Some notable examples include:
over 90 miles of snowmobile trails in the Loyalsock State Forest and Worlds End State Park;
most of the 64-mile-long Loyalsock Trail, showcasing numerous waterfalls;
the Double Run Ski Trail, providing cross-country opportunities in the Loyalsock State Forest;
and the 19-mile Loyalsock State Forest Bridle Trail for equestrian pursuits.
The Loyalsock Watershed also contains the entirety of state Game Lands #134 and #298, as well as parts of six others, including Game Lands #12, #13, #36, #57, #66, and #133. Not only hunting locations, these tracts preserve habitat for importantbird and mammal species, provide opportunities forbirding, and offer a variety of outdooreducation resources.
Commercial Opportunities
There are also privately-owned recreational opportunities in the region. A portion of the historicEagles Mere Country Club has provided golf and other activities for over 100 years. Eagles Mere Lake, just south of the watershed boundary,provides recreation opportunities for members of the privately-held Eagles Mere Association. At the south of the lake is the regionally-famous Eagles MereTobaggan Slide, where riders race down a specialized track at speeds up to 45 miles per hour, when winters are cold enough for sufficient ice conditions – a fleeting situation due to climate change.
A few miles to the east of Eagles Mere lies a cluster of lakes that surround the borough of Laporte, in Sullivan County. The largest of these lakes is Lake Mokoma, administered by the Lake Mokoma Association. Participation in the Association is limited to those who own residences or vacation homes in Sullivan County.
Fig. 5. Hiking trail in the Loyalsock State Forest. (FracTracker Alliance, July, 2020)
Fig. 6. An interactive map of recreation opportunities in the Loyalsock Watershed. (FracTracker Alliance, July 2020)
Note: Wetland data presented are from the National Wetlands Inventory (NWI), which is a geographically comprehensive dataset compiled by the US Fish and Wildlife Service from aerial photographs, but not a complete or accurate depiction of regulated wetlands for site-specific purposes. A relatively newer wetland mapping dataset for Pennsylvania appears to identify more areas of potential wetlands than NWI. Nevertheless, the NWI and other available map sources generally underestimate actual wetland coverage in Pennsylvania. Accurate wetland mapping requires the application of technical criteria in the field to identify the site-specific vegetation, soil, and hydrology indicators that define regulated wetlands (25 Pa. Code 105.451).
Stream data presented are from the Pennsylvania DEP Designated Use listing (25 Pa. Code 93.9), which is based on the National Hydrography Dataset. Some streams have updated designations of their existing water uses as depicted on other DEP datasets. Available electronic datasets and topographic maps do not display all permanent or intermittent streams included as Regulated Waters of the Commonwealth (25 Pa. Code 105.1). It is possible to map additional streams with the help of existing photo-based digital elevation models, although use of that technique was beyond the scope of this informational project. Such streams would add significantly to the total mileage, but they have not yet been acknowledged by the Pennsylvania DEP, and therefore are not included in the DEP’s inventories of high quality, exceptional value, or other streams.
The datasets used in this map collection can be found by following the links in the Details section of each map, found near the top-left corner of the page.
Fracking comes to the Loyalsock
Figures 7-9. Aerial imagery of unconventional oil and gas infrastructure in the Loyalsock State Forest. (Ted Auch, FracTracker Alliance, with aerial assistance from Lighthawk. June, 2020)
On November 17, 2009, Inflection Energy began drilling the Ultimate Warrior I well in Upper Fairfield Township, Lycoming County. In quick succession came Pennsylvania General Energy, Chesapeake Appalachia, Chief Oil & Gas, Anadarko E&P, Alta Resources (ARD), and Southwestern Production (SWN), all of which drilled a well by the end of 2010. It was a veritable invasion on the watershed, one that ushered in a dramatic change from a mostly agrarian landscape, to one with heavy industrial presence.
Residents have to deal with constant construction of well pads, pipelines, compressor stations, and staging grounds. Since each drilled well requires thousands of truck trips, enormous traffic jams are common, with each idling engine spewing diesel exhaust into the once clean air. The noise of drilling and fracking continues into the night, and bright flaring of gasses at wells and other facilities disrupts sleep schedules, and may contribute to serious health issues as well.
Fig. 10. An interactive map of the impacts of the unconventional oil and gas industry to the Loyalsock Creek Watershed. Note: Pipelines may be only partially depicted due to data limitations. (FracTracker Alliance, 2020)
Fracking is a nuisance and a risk in the best of times, but the Marcellus boom in the Loyalsock watershed has been notably problematic. The most frequent violations in the watershed are casing and cementing infractions, for which the “operator conducted casing and cementing activities that failed to prevent migration of gas or other fluids into sources of fresh groundwater.” This particular violation has been reported 47 times in the watershed, although there are dozens of additional casing and cementing issues that are similarly worded (see appendix). Erosion and sediment violations have also been commonplace, and these can have significant impacts on stream system health.
Improperly contained waste pits have leached toxic waste into the ground. A truck with drilling mud containing 103,000 milligrams per liter of chlorides – about five times more than ocean water – was driving down the road with an open valve, spewing fluids over a wide area. Some spills sent plumes of pollution directly into streams.
Fig. 11. Diesel truck traffic carrying fracking equipment in the Loyalsock watershed. (FracTracker Alliance, June, 2020)
Fig. 12. Diesel exhaust spewing from fracking equipment. (Barb Jarmoska)
Fig. 13. Fracking is a heavily industrial activity. Many of these sites in the Loyalsock Creek watershed are immediately adjacent to homes. (Barb Jarmoska)
Fig. 14. Open pits used to be permitted for temporary storage of oil and gas waste. Here, the liner is not properly covering the bottom-right corner, sludge is piled up past the liner in the top-right corner, and temporary fencing is failing in numerous locations. (Barb Jarmoska)
In short, it has been a mess. Altogether, there have been 631 violations issued for 317 unconventional wells drilled in the Loyalsock, an average of two violations per well.
The Pennsylvania Department of Environmental Protection (DEP) issues violations on pipelines as well, but we are unable to match pipeline violations to a specific location, so there is no way to know which ones occurred in the Loyalsock watershed.
We also know that pipeline construction is a process filled with mishaps. Specifically, there is a technique for drilling a pipeline segment underneath existing obstacles – such as streams and roads – known as horizontal directional drilling (HDD). These HDD sites frequently bleed large quantities of drilling mud into the ground or surface water. When these leaks surface, these spills are known euphemistically as “inadvertent returns.” Sometimes, the same phenomenon occurs but the fluid drains instead to an underground cavity, referred to as “loss of circulation.” We do not have data on either category for pipelines in the Loyalsock watershed. However, the DEP has published inadvertent returns for the Mariner East II route to the south, and when combining spills impacting the water and ground, these occur at a rate of about two spills for every three miles of installed pipe. Many of these releases are measured in thousands of gallons.
Unfortunately, drilling and all related activity continue in the Loyalsock Creek watershed. As the industry has proven incapable of conducting these activities in an unsullied manner that is protective of the environment and the health of nearby residents, we can expect the litany of errors to continue to grow.
A Brief Timeline of Infractions
In 2016, a major incident was reported to the Pipeline and Hazardous Materials Safety Administration (PHMSA), a federal agency under the Department of Transportation (DOT). On October 21, a Sunoco pipeline ruptured, spilling 55,000 gallons of gasoline into Wallis Run, a tributary of Loyalsock Creek. The eight-inch pipeline burst when high winds and heavy floods triggered mudslides, sweeping away at least two homes and leaving flooded roads impassable. Water suppliers and national and state agencies advised locals to conserve water, and the DEP and water supplier American Water shut down intake valves until they had measured contamination levels in three water supplies serving thousands of people downstream, including populations in Lewisburg, Milton, and Gamble Township.
Limited access to the area delayed identifying the source of the rupture, though Sunoco shut off the pipeline that runs from Reading to Buffalo, NY. When waters receded, Sunoco officials replaced the broken pipe, which they said was broken by debris from a washed out bridge ten feet upstream. The pipeline was buried five feet below the creek, but heavy rains exposed it.
Agency authorities later found that heavy rains had flushed out much of the pollution, though they recorded the highest levels in the Loyalsock Creek. While this is obviously a weather-related event, local residents questioned the placement of a hazardous liquids pipeline crossing at such a volatile location, noting that the same pipeline had been exposed, (although not breached), just five years earlier.
Sunoco tops the list of U.S. crude oil spills. Sunoco and their subsidiaries reported 527 hazardous liquids pipeline incidents between 2002 and 2017, incidents that released over 87,000 barrels of hazardous liquids, according to Greenpeace USA and Waterkeeper Alliances’ 2018 report on Energy Transfer Partners (ETP) & Sunoco’s History of Pipeline Spills. Sunoco and its subsidiary ETP are developing the Dakota Access Pipeline, the Mariner East pipeline, and the Permian Express pipeline, sites that have already seen construction errors causing leaks and spills.
The area suffered another heavy spill in 2017, when a well operated by Colorado-based Inflection Energy leaked over 63,000 gallons of natural gas drilling waste into a Loyalsock Creek tributary. The spill occurred when waste was being transferred from one container to another, a neglect of the contracted worker who had fallen asleep. DEP spokesman Neil Shader said the waste – called “flowback” – was filtered and treated, but this brine can contain chemicals, metals, salts, and other inorganic materials that can pollute soil and groundwater. Carol Parenzan, at the time serving as Middle Susquehanna’s Riverkeeper, said many residents are supplied by well water, and were not alerted of the spill until a local began investigating and calling local and state authorities.
Fig. 16. At the Chesapeake Appalachia LLC Manning Well Site and Lambert Farms Well Site, the emissions sources appear to be engines or combustion devices. (FLIR camera footage by Earthworks, July 2020)
One of Earthworks’ trained and certified thermographers visited the Loyalsock watershed and surrounding area in mid-July with a FLIR optical gas imaging (OGI) camera. This industry standard tool can make visible pollutants that are typically invisible to the human eye, but that still pose significant risks to health and the environment–including 20 volatile organic compounds, such as the carcinogens benzene and toluene, and methane, a greenhouse gas 86 times more potent than carbon dioxide.
Water is the lifeblood of the Loyalsock watershed, as it is in any basin. However, in the Loyalsock, water is of particular importance. As we have seen, recreation opportunities in the area are defined by water, including fantastic fishing streams and lakes, meandering trails passing many waterfalls, various boating sites, and inviting swimming holes. For one reason or others, most visitors come to the Loyalsock to enjoy these natural aquatic locations.
Perhaps the most important water assets are underground aquifers. The majority of the watershed is rural, and private wells for potable household water are typical. Even the municipal water supply for the Borough of Montoursville is fed by groundwater, including five wells and an artesian spring.
Contamination
For a region so dependent on surface water for tourism, commercial activities, and groundwater for drinking supplies, the arrival of fracking is a significant concern. Unfortunately, spills and other violations are common at well pads and related infrastructure, with over 631 violations in the watershed since 2010.
Even pipelines that are not yet operational can have impacts on the waterways in the Loyalsock Creek watershed. In September 2012, for example, a “significant amount” of sediment and mud spilled into the Loyalsock Creek during the construction of Central New York Oil and Gas’ Marc I pipeline project. Such incidents introduce silt and clay into waterways, fine sediments that have the potential to deplete aquatic fauna. These types of episodes have received considerably more attention since this event, and it turns out that they are quite common during pipeline construction. For example, the Mariner East pipeline has had hundreds of these so-called inadvertent returns, many of which directly affected the waters of the Commonwealth.
Fig. 17.Trucks withdrawing water for drilling-related activities at the Forksville Heritage Freshwater Station, operated by Chief Oil & Gas. Photo from FracTracker mobile app report.
Fig. 18.The average amount of water used per well in the Loyalsock Watershed has increased over time. In recent years, several wells exceeded 30 million gallons (FracTracker Alliance, 2020).
In addition to contamination concerns, unconventional oil and gas wells are extremely thirsty operations. FracTracker has analyzed wells in the watershed using the industry’s chemical registry site FracFocus. Of the 274 wells in the watershed reporting to FracFocus between January 2011 and April 2020, 38 did not include a value for total water usage. These wells were all fracked on or before September 13, 2012, when the registry was still in its early phase and its use was not well standardized. Two wells fracked in 2018 by Pennsylvania General Energy had very low water consumption figures, with one reporting 2,100 gallons, and the other reporting 6,636 gallons. These two reports appear to be erroneous, and so these wells were removed from our analysis.
Of the remaining 234 wells in the data repository, one reported using less than one million gallons, although it came close, with 925,606 gallons. Another 63 wells used between one and five million gallons, 137 wells used between five and ten million gallons, 25 wells used between ten and 20 million gallons, and eight used more than 20 million gallons. The average consumption was 7,739,542 gallons, while the maximum value was for Alta Resources’ Alden Evans A 2H well, which used 34,024,513 gallons of water.
The well’s operator has a tremendous impact on the total amount of water usage reported on FracFocus in the Loyalsock watershed.
However, it is worth noting that time factors into this analysis. None of the three companies averaging less than five million gallons of water per well – including Anadarko, Atlas, and Southwestern – have records after 2014, and water consumption has increased dramatically since then. Still, Alta’s average of nearly 24.7 million gallons per well stands out, with more than twice the amount of water consumed per well, compared to the next highest user.
Altogether, the wells on the FracFocus registry in the Loyalsock watershed consumed over 1.8 billion gallons of water, enough water to supply nearly 36,000 households for a year, assuming an average of 138 gallons per household, per day. This is a real need in the United States, as a 2019 report by DigDeep and US Water Alliance estimated that there were two million people in the U.S. without running water in their homes.
Operator
Average Gallons per Well
Alta Resources
24,658,871
Anadarko Petroleum Corporation
3,320,469
Atlas Energy, L.P.
4,926,427
Chesapeake Operating, Inc.
6,572,047
Chief Oil & Gas
8,537,475
Inflection Energy (PA) LLC
7,716,069
Pennsylvania General Energy
11,680,249
Seneca Resources Corporation
8,410,013
Southwestern Energy
2,355,864
Fig. 19.Total amount of water usage reported by oil and gas operators in the Loyalsock watershed. (FracFocus, 2020)
Fig. 20. An interactive map of oil and gas related water sites in the Loyalsock Creek Watershed. (FracTracker Alliance, 2020)
Between January 2011 and April 2020, two conventional wells and 297 unconventional wells combined to produce 7,017,102 barrels (294.7 million gallons) of liquid waste, and 340,856 tons (681.7 million pounds) of solid waste.
Fig. 21. Liquid oil and gas waste produced in the Loyalsock Creek watershed, in barrels. Note that 2020 includes data from January to April only. (FracTracker Alliance, July 2020)
Fig. 22. Solid oil and gas waste produced in the Loyalsock Creek watershed, in tons. Note that 2020 includes data from January to April only. (FracTracker Alliance, July, 2020)
This averages out to 23,469 barrels (985,680 gallons) and 1,140 tons (2,279,973 pounds) per well drilled in the basin, and most of these wells are active and continue to produce waste. Many of these wells have generated waste quantities in great excess of these averages.
Unlike gas production, which tends to drop off precipitously after the first year, liquid waste production remains at an elevated level for years. For example, the Brooks Family A-201H well, the well reporting the largest quantity of liquid waste in the basin, produced 1,499 barrels in 2017, 28,847 barrels in 2018, 35,143 barrels in 2019, and 23,829 barrels in the first four months of 2020. The volumes from this well increase substantially each year.
For all wells in the watershed reporting liquid waste between 2018 and 2019, waste totals decreased by almost 42%. While a significant decrease, these 237 wells still generated 829,267 barrels (34.8 million gallons) of waste in 2019, and some have been generating waste since at least 2011. Wells will continue to produce waste until they are permanently plugged, but unfortunately, there are plans for more drilling in the watershed. There are 17 active status wells that have been permitted and not yet drilled. Important to remember is that fracking waste is often radioactive, and laden with salt, chemicals, and other contaminants, making it a hazardous product to transport, treat, or dispose.
Fig. 23. Cumulative liquid waste totals produced by oil and gas wells in Loyalsock Creek watershed between January 2011 and April 2020. (FracTracker Alliance, July, 2020)
Fig. 24. An interactive map of oil and gas waste generated in the Loyalsock Creek Watershed between January 2011 and May 2020. (FracTracker Alliance, July, 2020)
On a sunny Friday in June 2020, a group of 18 FracTracker staff members and volunteers gathered in the Loyalsock watershed to document activities and infrastructure related to unconventional oil and gas activities. FracTracker’s Matt Kelso used a variety of data from the DEP to prepare maps depicting an array of infrastructure, including 317 drilled wells on 110 different pads, five compressor stations, a compressed natural gas truck terminal, and 24 water facilities related to oil and gas extraction – including five surface water withdrawal sites and 19 storage reservoirs. He then divided an area of about 496 square miles into five sections, and at least two participants were assigned to explore each section.
Using the FracTracker mobile app, cameras, and other documentation tools, the group was able to verify the location of 91 infrastructure sites, including well pads, compressor stations, pipelines, water withdrawal sites and reservoirs, as well as significant truck traffic. As they made their way over the rural back roads, many participants were struck by the juxtaposition of a breathtaking landscape and peaceful farmlands with imposing, polluting fracking sites.
The day was also documented by Rachel McDevitt from StateImpact Pennsylvania, a reporting project of NPR member stations, as well as the filmmakers Justin Grubb, Alex Goatz, and Michael Clark from Running Wild Media.
With the geolocated photos and site descriptions documented on this day, FracTracker was able to compile this story atlas to serve as an educational tool for concerned residents of the Loyalsock.
You can find these reports and many more by downloading the FracTracker app on your iOS or Android device, or by going to the web app at https://app.fractracker.org/.
Fig. 25. FracTracker’s Executive Director Brook Lenker addresses the gathering of volunteers, media members, and FracTracker staff at Canfield Island Heritage Trail Park on documentation day. (FracTracker Alliance, June, 2020)
Fig. 26 FracTracker’s Matt Kelso explains the maps he made of different sections in the Loyalsock Watershed. (FracTracker Alliance, June, 2020)
Fig. 27 Running Wild Media’s filmmaker captures the introduction to the documentation day by FracTracker staff. These filmmakers tagged along for additions to a film about the eastern hellbender, to be released in spring 2021. (FracTracker Alliance, June, 2020)
Fig. 28. A compressor station is seen across a field of wildflowers, somewhere in the Loyalsock Watershed. (FracTracker Alliance, June, 2020)
Fig. 29. Volunteers stand outside gated infrastructure in the watershed on the documentation field day. (FracTracker Alliance, June, 2020)
Fig. 30. A pipeline path cutting through forest in the Loyalsock watershed. (FracTracker Alliance, June, 2020)
Fig. 31. Grass has grown to cover a pipeline path traversing a hillside in the Loyalsock. (FracTracker Alliance, June, 2020)
Click on various elements in te map to see visualizations such as videos, FLIR camera footage, gifs, and photos.
Fig. 32. An interactive map of community-led documentation of oil and gas related impacts in the Loyalsock Creek Watershed. (FracTracker Alliance, 2020)
Barb Jarmoska is a lifelong environmental and social justice activist with property adjacent to the Loyalsock State Forest that has been in her family for five generations. She has witnessed a dramatic and devastating transformation of the pristine area surrounding her home as the fracking industry moved into what they consider the Marcellus Sacrifice Zone.
This is Barb’s account, in her own words:
“For me, the door to the woods is the door to the temple,” wrote poet Mary Oliver. I understand those words, they are part of my lifetime of lived experience in the Loyalsock watershed.
I am a retired special-ed teacher and a business owner – a mother and a grandmother – and someone who treasures and reveres the rapidly dwindling wild places in Penns Woods.
Where my front yard ends, the Loyalsock State Forest (LSF) begins. Access to my property is via a no-outlet gravel road that dead-ends in the Forest.
In 1933, my grandfather bought 20 acres with an old cabin and barn bordering what is now the LSF.
As a child, I didn’t miss indoor plumbing or air conditioning in that cabin beside the Loyalsock Creek where we spent our summers. I now live on the land year-round, in a home I built in 2007, before I had ever heard the words Marcellus Shale. I have indoor plumbing now, but still no desire for air conditioning, preferring to rely on open windows and big shade trees.
The memories my family has made on this land are priceless, and my grandchildren are the fifth generation to run in the meadow, swim and fish in the creek, climb the trees, and play in the nearby woods of the PA Wilds. In our increasingly transient society, roots this deep are precious and rare.
My appalled, angry, and admittedly frightened response to the gas industry invasion of the Loyalsock watershed began in 2010, when a parade of trucks spewing diesel fumes rumbled up the no-outlet road I live on, enroute to leased COP tracts in the LSF.
That dirt trail that we loved to hike was the first thing to go. Dump trucks carrying fist-sized gravel and heavy equipment transformed the forest trail into a road – gated off and posted with trespass warnings carrying severe penalties. In my neighborhood, as in so many places in the watershed, land that legally belongs to the citizens now carries grim warnings of the consequences of trespassing.
When the drilling and fracking equipment passed my driveway, the ground shook. Oftentimes, I had to wait 15 or 20 minutes just to leave – or come home. There was a flag car pretty much permanently blocking my driveway for a while. I also walked out for the mail one day and found a porta-potty had been set up on my land. No one thought to ask permission. They just put it on my property – a few yards from my mailbox.
Life in my Loyalsock watershed neighborhood has forever changed at the hands of industry permitted to remove millions of gallons of water for fracking from the Loyalsock – the beautiful Creek that carries the designation “Exceptional Value”. Named PA’s River of the Year in 2018, the Loyalsock Creek begins in the endless mountain region of the PA Wilds, and travels 64 miles on its way to the West Branch of the Susquehanna River.
The beloved Loyalsock Creek provides recreation for hundreds of fishermen, kayakers, inner-tubers, swimmers, and summer cabin dwellers – offering clear water that to this day supports abundant fish, amphibians, birds, and wildlife – clear water the gas industry now pumps out by the millions of gallons, to be mixed with toxic chemicals and forced at great pressure through boreholes a mile deep and miles long, to release methane trapped in the Marcellus Shale.
In 2018, about two miles from my home, an estimated 55,000 gallons of “produced water” spilled from a well pad ironically named TLC. This toxic fluid ran downhill into a tributary and directly into the Loyalsock Creek. On its approximately two-mile path, the chemicals flooded a little tributary that runs through a rural neighborhood where children play in the water. Frightened residents gathered to question DEP about the safety of their private drinking water wells, and they expressed concern over the tadpoles and frogs, and in the deeper, shady pools – native trout they were used to seeing.
Pennsylvania lawmakers could obey the Constitution, protect the watershed, and choose a way forward that leads to a future of renewable energy and well-paying green jobs for Pennsylvania citizens, as well as the promise of a brighter future for our children and grandchildren.
Time is running out.
I look at my grandchildren and believe that such a shift of consciousness and political will is truly their last, great hope.
Keep It Wild
-By Barb Jarmoska
What Does the Future Hold?
On its own, climate change brings with it a wave of new and/or intensified challenges to PA’s state forests, parks, and natural areas. Flooding and erosion, insect-borne illnesses, invasive species, and changes to plant and animal life are ongoing issues the state’s natural resource managers have to consider as the climate changes. These interactive stressors will continue to disrupt ecosystem function, processes, and services; result in the loss of biodiversity and shifts in forest compositions; and negatively impact industries and communities reliant on Penns Woods.
Over the past 110 years, PA’s average temperature has increased nearly two degrees Fahrenheit, and the Commonwealth has also seen a gradual uptick in annual precipitation, but a decline in and shorter span of snow cover. As ranges shift, the state will see the distribution and abundance of native plants and animals change, a pattern that will continue to accelerate.
Penns Woods are home to over 100 species of trees. Oak/hickory forests contain primarily oaks, maples, and hickories, with an understory of rhododendrons and blueberry bushes. Northern hardwood forests are composed of black cherry, maples, American beech, and birch, with understories of ferns, striped maple and beech brush. But the composition of PA’s forests are changing. Smithsonian’s Conservation Biology Institute compared colonial-era data to recent U.S. Forest Service data, and found that maples have increased by as much as 20%, but beeches, oaks and chestnuts – important foliage for wildlife – have declined. The presence of pine trees has been more volatile, seeing increases in some areas, and decreases in others.
Overall, PA’s forests are becoming more unsustainable, conditions compounded by misaligned harvesting, suburban sprawl, insect infestations, and disease. These impacts trickle down to the wildlife that call Penns Woods home. PA’s Natural Heritage Program has begun to compile this Environmental Review List, to identify threatened and endangered species, species of special concern, and rare and significant ecological features.
One of the most notable among these is North America’s largest salamander, the eastern hellbender, designated PA’s official amphibian in April 2019. This salamander is a great indicator of clean and well-oxygenated water, as it requires fast-flowing, freshwater habitat with large rock deposits to thrive. Originally dispersed across the Appalachians from Georgia to New York, the eastern hellbender’s population has suffered greatly from the impacts of pollution, erosion and sedimentation, dams, and amphibious fungal disease.
These salamanders can reach lengths up to two feet, and live for as long as 50 years, so their presence is a key indicator of long-term stream and riparian health. Western Pennsylvania Conservancy has monitored their habitats throughout PA since 2007. Though named the state’s official amphibian, this title does not incorporate its special protection.
Fig. 33. An aerial view of the Loyalsock Creek. (Ted Auch, FracTracker Alliance, June 2020)
In its recent Loyalsock State Forest Resource Management Plan (SFRMP), PA DCNR states that “Natural gas development…especially at the scale seen in the modern shale-gas era, can affect a variety of forest resources, uses, and values, such as:
• recreational opportunities,
• the forest’s wild character and scenic beauty, and
• plant and wildlife habitat.”
Despite extensive areas marred by well pads and other fracking infrastructure, the Loyalsock watershed retains resplendent beauty and pastoral character. Natural resources have endured spills, leaks, habitat fragmentation, deforestation, and increases in impervious buildout related to the gas industry. While a global pandemic and cascading company debts have diminished extraction activities, the region remains vulnerable to future attempts to drill more — on both private and public lands.
Indicative of the omnipresent threats, Pennsylvania General Energy Company, LLC (PGE) intends to develop a substantial pipeline corridor across the Loyalsock Valley. According to PA DEP public records, the project includes the construction of the Shawnee Pipeline, with over 15,000 linear feetof an existing eight-inch diametergas pipeline to be replaced with a 16-inch pipeline. It will be supplemented by the Shawnee Pipeline Phase 2, encompassing an additional 189 linear feet of gas pipeline.
Arranged to accompany the pipelines is a temporary waterline to extend from planned pump stations on both sides of the Loyalsock Creek, to a proposed impoundment site within Loyalsock State Forest.
The company envisions cofferdams and trenches to cross the Loyalsock Creek. Other streams and wetlands will also be traversed, further degrading and endangering these vulnerable resources. Visible scarring from the pipeline cut is a major concern adding to the diminishment of the valley’s lush, green slopes. Methods exist to minimize the visibility of such development, but no one knows if PGE will follow those practices, or if regulators will require this of them. Some believe the project portends more fracking — with ceaseless demands for more water, and endless production of noxious waste and climate-killing emissions.
Only a few miles northeast of the watershed, New Fortress Energy is constructing a 260-acre complex near Wyalusing, Pennsylvania, to convert fracked gas into liquified natural gas, or LNG. The LNG will be dangerously transported by truck and rail to a planned export facility in Gibbstown, New Jersey, to send these private exploits overseas. A local group, Protect Northern PA, has formed to encourage a more sustainable path forward for the area, one that values people and the planet. The New Fortress Energy plant, if completed, would create inertia for extended extraction across the Marcellus Shale.
But hope abides in the Loyalsock. Hikers flock to enchanted trails, revelers rejoice on graveled shores. The place exudes an invisible elixir called stewardship, rippling through the air, nourishing receptive hearts and minds. Brandished for free, it shares this necessary ethos, seeking more followers.
Thanks to…
Thank you to all of the inspiring and steadfast environmental stewards who have contributed to the creation of this digital atlas:
Dick Martin from PAForestCoalition.org;
Barb Jarmoska, Harvey M. Katz, and Ralph Kisberg from Responsible Drilling Alliance;
Ann Pinca from Lebanon Pipeline Awareness;
Paul V. Otruba and Victor Otruba from Environeers;
Justin Grubb, Alex Goatz, and Michael Clark from Running Wild Media;
and Rachel McDevitt from StateImpact
Leann Leiter from Earthworks
Lighthawk
Staff at FracTracker Alliance
Project funding provided by The Foundation for Pennsylvania Watersheds
“The Iroquois…called Pine Creek ‘Tiadaghton’ meaning either ‘The River of Pines’ or ‘The Lost or Bewildered River’.”[i] The river’s iconic watershed in North Central Pennsylvania spans 979 square miles, spanning parts of Clinton, Lycoming, Potter, and Tioga counties, and an infamous 47-mile gorge through which the Pine Creek flows. At 87 miles in length, it is the largest tributary to the West Branch Susquehanna River.[ii]
In 1964, Congress included Pine Creek as one of 27 rivers under study for inclusion in the National Wild and Scenic River System.[iii] Four years later, the US Department of the Interior designated twelve miles of the canyon a National Natural Landmark. In 1992, Pine Creek was recognized as a Pennsylvania Scenic River.[iv] These accolades underscore its vibrant beauty, ecological value, and cultural significance.
A rugged landscape carved into the Allegheny Plateau, the watershed contains extensive public lands and the highest concentrations of exceptional value (EV) and high quality (HQ) streams anywhere in Pennsylvania. It is a prized recreational attraction in the region known as the Pennsylvania Wilds, a destination for nature-based tourism. The area has endured episodes of resource extraction – logging, coal mining, and shallow gas development – but nothing quite the same as the assault from hundreds of new unconventional gas wells and the sprawling pads, pipelines, impoundments, compressor stations, and access roads accompanying such development.
Modern extraction is heavy industry – loud, dusty, and dirty. It is incongruent with the thick forests, sensitive habitats, hushed solitude, and star-drenched skies one expects to experience in many wilderness pursuits. Threats to air, water, and wildlife are manifest. Landscape fragmentation and forest loss are collateral damage. Ecological impacts, while sometimes immediate, are often insidious as they slowly degrade environmental health over time. The Oil and Gas Program of the Pennsylvania Department of Conservation and Natural Resources (DCNR) acknowledged in a 2012 presentation: “…that Marcellus Shale will be a long-term influence on the character of Pennsylvania landscapes.”[v] To what extent remains to be determined.
Writer and conservationist Samuel P. Hayes noted “The Pennsylvania Administrative Code of 1929 identified watershed protection as the primary purpose of the state forests.”[vi] Enduring more than 10 years of fracking history, and with more planned, the Pine Creek watershed is an experiment for this tenent and overdue for the geospatial examination that follows.
According to the NOAA, a watershed is a land area that channels rainfall and snowmelt to creeks, streams, and rivers, and eventually to outflow points such as reservoirs, bays, and the ocean.
Use the time slider below to explore the changes in the Pine Creek watershed from 2008 to 2016
CONTENTS
click on the section title to jump to that section
Humans have left their mark on Pine Creek for thousands of years, but the effects of timber and fossil fuel extraction in the last 220 years are most notable. Historical accounts and agency records provide substantial documentation of these impacts.
TIMBER
In 1799, Pine Creek’s first sawmill was set up near the confluence with Little Pine Creek. By 1810, eleven saw mills were in operation. In the next 30 years, that number rose to 145. Pine Creek earned the moniker of “Lumber Capital of the World,” but by the end of the Civil War, the great pine forests along Pine Creek were depleted due to clearcutting. By the end of the Civil War, the great pine forests along Pine Creek were depleted. Underappreciated for lumber, eastern hemlocks remained, but were eventually felled as well, their bark prized for tanning leather. The advent of logging railroads accelerated the forest’s demise. By the first years of the 20th century, the trees were all but gone, “…branches and stumps littered the mountainsides and sparks from locomotives created fires of holocaustal proportions.”[vii]
Sadly, much of the wildlife was gone too. Bounties, market hunting, and habitat loss had taken a toll. The area’s last timber wolf was killed in 1875. The beaver, otter, fisher, martin, lynx, and wolverine were exterminated by the early 1900s. The remaining solitary panthers lasted until the 1930s, then “faded into oblivion.”[viii]
COAL
While not often thought of as a part of Pennsylvania’s coal country, the Pine Creek Watershed has seen its share of coal mining and related activity. Coal was first discovered along the Babb Creek portion of the watershed in 1782, and mining operations began in earnest in the 1860s. By 1990, the area was so impacted by mine drainage and other pollution that there were no fish found in Babb Creek. Efforts to rehabilitate the stream have made some progress, raising the pH of the stream and restoring fish populations, to the point where Babb Creek was officially removed from the list of impaired streams in 2016.
Within the watershed’s abandoned mine areas, 68 specific sites totaling nearly 500 acres are flagged as “containing public health, safety, and public welfare problems created by past coal mining.” This represents more than 11% of the total mined area. Only five of these 68 sites – all strip mines – have completed the reclamation process.
Table 1. Problematic coal mine areas in the Pine Creek Watershed
SITE TYPE
ABANDONED
RECLAMATION COMPLETE
TOTAL FACILITIES
TOTAL ACRES
Dry Strip Mine
31
5
36
322.0
Flooded Strip Mine
2
–
2
1.7
Spoil Pile
13
–
13
148.4
Refuse Pile
12
–
12
23.2
Known Subsidence Prone Area
2
–
2
0.4
Coal Processing Settling Basin
3
–
3
1.5
TOTAL
63
5
68
497.4
OIL & GAS
The oil and gas industry in Pennsylvania started with the Drake Well near Titusville in 1859, before the onset of the Civil War. In the years since, perhaps as many as 760,000 such wells have been drilled statewide.[ix] While the Pennsylvania Department of Environmental Protection (DEP) is the current state agency with regulatory oversight of the industry, it estimates that there could be as many as 560,000 wells drilled that they have no record of in their database. Given the lack of data for these early wells, it is not possible to know exactly how many wells have been drilled in the Pine Creek Watershed.[x]
Over a century ago, pollution was seen as the price to be paid for a job in timbering or mining. Some politicians seem to want a return to those bad old days by gutting some of our reasonable regulations that protect our air and water. Here, as in the rest of the Marcellus gas play, our politicians are not protecting our air and water as mandated in Article 1, Section 27 of our State Constitution.
-Dick Martin Coordinator for the Pennsylvania Forest Coalition and board member of Pennsylvania Environmental Defense Foundation, PEDF
A Wealth of Public Lands & Recreational Opportunity
The Pine Creek Watershed is in the heart of the Pennsylvania Wilds, a 12-county region in North Central Pennsylvania focused on nature-based tourism. “Adventure to one of the largest expanses of green between New York City and Chicago,” touts the initiative’s website.[xi] The area includes over two million acres of public land, and is marketed for its notorious starry skies, quaint towns, large elk herd, and other attractions, like Pine Creek.
The watershed and its trails and public lands contribute substantially to the PA Wilds estate and offerings, including:
1,666 stream miles (187.6 miles Exceptional Value and 1,011.5 miles High Quality)
Eight state parks, spanning 4,713 acres (7.36 sq. miles)
Four state forests, covering 264,771 acres (414 sq. miles)
Eight natural areas
Three wild areas
Seven state game lands, totaling 51,474 acres (80.42 sq. miles)
And 31 trails, traversing 789 miles
These largely remote and rugged spaces are relished for their idyllic and pristine qualities. Modern extraction brings discordant traffic, noise, lights, and releases of pollutants into the air and water. Stream waters – ideal for trout, anglers, and paddlers – are siphoned for the fracturing process. Trails are interrupted by pipelines and access roads. The erosion of outdoor experiences is piecemeal and pervasive.
A recent study lends credence to the concern that shale gas development is incongruent with the region’s ecotourism and recreational goals. “The Impacts of Shale Natural Gas Energy Development on Outdoor Recreation: A Statewide Assessment of Pennsylvanians” found that “only a small population of Pennsylvania outdoor recreationists were impacted by [shale natural gas energy development (SGD)] related activities. In the regions of Pennsylvania where SGD was most prominent (e.g., North Central and Southwest), outdoor recreation impacts were considerably higher.”[xii]
Weak rules favor the gas companies and allow them to waste resources, pollute our air, and destroy our climate. Continued exploitation of our public lands diminishes the value of this common good.
–Leann Leiter, OH/PA Field Advocate, Earthworks
Read more about Leann’s view on fracking in Pine Creek and using FLIR photography to expose polluting emissions. Go to this post on Earthworks’ blog.
Natural resource extraction in the Pine Creek Watershed did not stop with timber, coal, and traditional oil and gas. The drilling landscape in Pennsylvania changed dramatically around 2005, as operators began to develop the Marcellus Shale, a carbon-rich black shale that had eluded the industry for decades, because the rock formation was reluctant to release the large quantities of gas trapped within it. Based on successes in other shale formations, the Marcellus began to be drilled with a combination of horizontal drilling and high volume hydraulic fracturing – now using millions of gallons of fluids, instead of tens of thousands – and built upon multi-acre well pads. Operators were successful in releasing the gas, and this type of well, known as “unconventional” drilling, took off in vast swaths of Pennsylvania. Similar techniques were extended to other formations, notably the Utica shale formation.
The map below shows the cumulative footprint of extractive practices in Pine Creek, with the exclusion of timber.
Midstream Infrastructure
In 2018, unconventional wells in the Pine Creek Watershed produced 203 billion cubic feet of gas, which is more than the entire state of West Virginia consumed in 2017, not including electricity generation. To get all of that gas to market requires an extensive network of pipelines, and multi-acre compressor stations are required to push the gas through those pipes.
Pipeline data for the region, largely based on the Pipeline and Hazardous Materials Safety Administration’s (PHMSA) public pipeline viewer map, includes over 85 miles of pipelines in the watershed. However, this data does not include any of the gathering lines that crisscross the watershed, connecting the drilling sites to the midstream network.
Among other concerns, gas pipelines need to be placed in areas where they will not be impacted by tree roots, and so operators clear a 50-foot wide right-of-way, at minimum. This width results in the clearing of more than 6 acres per linear mile of pipe, which would be a total of 515 acres for the known pipeline routes in the region. However, the 50-foot width is a minimum, and some rights-of-way exceeding 300 feet were observed in the watershed, which would require the clearing of more than 36 acres per linear mile. These land clearing impacts are in addition to those required for well pads, access roads, and other infrastructure.
Many of the compressor stations in the Pine Creek Watershed are considered major pollution sources, and therefore require a Title V permit from the US Environmental Protection Agency (EPA). This means that they either produce at least 10 tons per year of any single hazardous air pollutant, or at least 25 tons of any combination of pollutants on the list.
Missing pipeline data is evidenced by FracTracker’s records of many compressor stations that are not along documented pipeline routes. Of the 26 compressors in the watershed that we have records for, only six are within 250 meters of known pipeline routes. Similarly, only 29 of the 594 drilled unconventional wells in the watershed are within the quarter-kilometer radius of known pipeline routes. One way or another, all compressors and well sites have to be connected to pipelines.
Table 2. Oil & Gas Well Status in the Pine Creek Watershed
Oil & Gas Well Status
# of Wells
Operator reported not drilled
404
Proposed but never materialized
111
Active (conventional)
25
Active (unconventional)
529
Other
304
TOTAL
1,374
The PA DEP has records for 1,374 oil and gas wells within the watershed, although not all of these were actually drilled. Of these wells, 404 wells have an official status of “operator reported not drilled,” while an additional 111 have a similar status of “proposed but never materialized.” Of the remaining 859 wells, 554 are currently considered active (including 25 conventional and 529 unconventional wells). An active status is given once the well is proposed — even before it is officially permitted by DEP, let alone drilled. The status remains until some other status applies.
Seventy-four wells are considered to be “regulatory inactive” (four conventional, 71 unconventional), meaning that the well has not been in production for at least a year, and must meet several other requirements. The remainder of the wells in the watershed have reached the end of their functional life, of which 168 have been plugged (119 conventional, 49 unconventional). This is done by filling the well bore with concrete, and is considered permanent, although the plugs have been known to fail from time to time. Fifty-seven additional conventional wells are considered abandoned, meaning that they are at the end of their useful life but have not been appropriately plugged, neither by the operator nor DEP. Five additional conventional wells are considered to be orphaned, which is a similar status to abandoned, but these wells are no longer linked to an operator active in the state. Given the lack of recordkeeping in the early part of the industry’s history in PA, the number of plugged, abandoned, and orphaned wells in the Pine Creek Watershed is likely significantly underrepresented.
Conventional drilling activity has essentially ceased in the watershed. A single well categorized as conventional, the Bliss 3H well, has been drilled in 2019. In fact, this well is almost certainly miscategorized. Not only does its well name follow conventions for horizontal unconventional wells, but the DEP’s formation report indicates that it is in fact drilled into the Marcellus Shale. Prior to Bliss 3H, the two most recent conventional wells were drilled in 2011.
Unconventional drilling is a different story altogether. In terms of the number of wells drilled, the peak within the Pine Creek Watershed was in 2011, with 186 wells drilled. That represented 9.5% of the statewide total that year, and Pine Creek is just one of 35 comparably sized watersheds targeted for unconventional development in Pennsylvania.
More recently, there were 16 wells drilled in the watershed in 2018, and 17 wells through the halfway point of 2019, indicating that the extraction efforts are once again on the upswing.
Table 3. Number of unconventional wells drilled in Pennsylvania and the Pine Creek Watershed
YEAR
STATEWIDE
PINE CREEK WATERSHED
PCT. TOTAL
2006
37
1
2.7%
2007
113
1
0.9%
2008
332
9
2.7%
2009
821
26
3.2%
2010
1598
114
7.1%
2011
1956
186
9.5%
2012
1351
85
6.3%
2013
1212
48
4.0%
2014
1369
30
2.2%
2015
784
11
1.4%
2016
503
20
4.0%
2017
810
29
3.6%
2018
777
16
2.1%
2019 (YTD)
366
17
4.6%
TOTAL
11999
593
5.8%
The map below shows a heavily forested section of the watershed that has been significantly damaged by unconventional oil and gas development. Notice the forest fragmentation and land disturbance that has occurred as a result of fracking activities.
Use the time slider below to explore the changes in the Pine Creek watershed from 2008 to 2016
On May 9, 2019, nearly two dozen people descended upon the Pine Creek Watershed for the purpose of chronicling the impacts that the oil and gas industry is currently wreaking on the landscape. The documentation began early in the morning at the William T. Piper Memorial Airport in the town of Lock Haven, located in Clinton County. FracTracker Alliance organized the blitz with numerous partner organizations, including EarthWorks, Sierra Club, Save Our Streams PA, Responsible Drilling Alliance, Pennsylvania Forest Coalition, Environeers, Pine Creek Headwaters Protection Group, and Lebanon Pipeline Awareness.
The massive watershed was broken up into 10 impact zones, which were mostly determined by concentrations of known sites such as well pads, compressor stations, retention ponds, and pipeline corridors.
Some people brought cameras and specialized equipment to Pine Ceek, such methane sensors and global positioning system devices. Participants were encouraged to try out the FracTracker Mobile App, which was designed to allow users to communicate and share the location of oil and gas concerns. Earthworks brought a FLIR infrared camera, which can capture volatile organic compounds and other pollutants that are typically invisible to the human eye, but that still pose significant risks to health and the environment. Others participants brought specialized knowledge of oil and gas operations from a variety of perspectives, from those who had previously interacted with the industry professionally, to those who have been forced to live in close proximity of these massive structures for more than a decade.
While we knew that it would not be possible to photograph every impact in the watershed, the results of this group effort were tremendous, including hundreds of photos, dozens of app submissions, and numerous infrared videos. All of these have been curated in the map above. In our exuberance, we documented a number of facilities that wound up not being in the Pine Creek Watershed – still impactful but beyond the scope of this project. In some cases, multiple photos were taken of the same location, and we selected the most representative one or two for each site. Altogether, the map above shows 22 aerial images, 84 app submissions, 46 additional photos, and nine infrared FLIR videos.
FracTracker also collaborated with a pilot from LightHawk, a nonprofit group that connects conservation-minded pilots with groups that can benefit from the rare opportunity to view infrastructure and impacts from the air. Together, LightHawk and FracTracker’s Ted Auch flew in a mostly clockwise loop around the watershed, producing the aerial photography highlighted in this article, and in the map below.
The benefits of being able to see these impacts from the air is incalculable. Not only does it give viewers a sense of the full scope of the impact, but in some cases, it provides access to sites and activities that would otherwise be entirely occluded to the public, such as sites with active drilling or hydraulic fracturing operations, or when the access roads are behind barriers that are posted as no trespassing zones.
It can be difficult to maintain a sense of the massive scale of these operations when looking at aerial images. One thing that can help to maintain this perspective is by focusing on easily identifiable objects, such as nearby trees or large trucks, but it is even more useful to cross-reference these aerial images with those taken at ground level.
Drilling unconventional wells requires the use of millions of gallons of water per well, sometimes as high as 100 million gallons. Unconventional drilling operations in Pennsylvania are required to self-report water, sand, and chemical quantities used in the hydraulic fracturing stage of well production to a registry known as FracFocus. Because of this, we have a pretty good idea of water used for this stage of the operation.
This does not account for all of the industry’s water consumption. The amount of water required to maintain and operate pipelines, compressor stations and other processing facilities, and to suppress dust on well pads, access roads, and pipeline rights-of-way is unknown, but likely significant. Much of the water used for oil and gas operations in this watershed is withdrawn from rivers and streams and the groundwater beneath the watershed.
Table 3. Water consumption by well in the Pine Creek Watershed
CATEGORY
GALLONS
EQUIVALENT PERSONS (ANNUAL USAGE)
Average Single Well
6,745,697
246
Maximum Single Well
13,313,916
486
All Wells (2013-2017)
850,648,219
31,074
There are 60 water-related facilities for oil and gas operations active within the watershed in 2019, including two ground water withdrawal locations, 20 surface water withdrawal locations, and 38 interconnections, mostly retention ponds. This dataset does not include limits on the 22 withdrawal locations, however, one of the surface withdrawal sites was observed with signage permitting the removal of 936,000 gallons per day. If this amount is typical, then the combined facilities in the watershed would have a daily capacity of about 20.6 million gallons, which is about 27 times the daily residential consumption within the watershed.
Predictably, water withdrawals ebb and flow with fluctuations in drilling activity, with peak consumption exceeding 1.2 billion gallons in the three-month period between April and June 2014, and an aggregate total of nearly 20.4 billion gallons between July 2008 and December 2016. It is not known what fraction of these withdrawals occurred in the Pine Creek Watershed.
Violations
Between October 22, 2007, and April 24, 2019, the Pennsylvania DEP issued 949 violations to unconventional oil and gas operations within the Pine Creek Watershed.[xiii] It can be difficult to know precisely what happened in the field based on the notations in the corresponding compliance reports. For example, if an operator failed to comply with the terms of their erosion and sediment control permit, it is unclear whether there was a sediment runoff event that impacted surface waters or not. However, as these rules were put into place to protect Pennsylvania’s waterways, there is no question that the potential for negative water impacts exists. Therefore, erosion and sedimentation violations are included in this analysis.
Other violations are quite explicit, however. The operator of the Hoffman 2H well in Liberty Township, Tioga County was cited for failing to prevent “gas, oil, brine, completion and servicing fluids, and any other fluids or materials from below the casing seat from entering fresh groundwater,” and failing to “prevent pollution or diminution of fresh groundwater.” A well on the Tract 007 – Pad G well pad was left unplugged. “Upon abandoning a well, the owner or operator failed to plug the well to stop the vertical flow of fluids or gas within the well bore.”
The violation description falls into more than 100 categories for sites within the watershed. We have simplified those as follows:
Table 4. Oil and gas violations in the Pine Creek Watershed
VIOLATIONS
COUNT
WATER RELATED
Administrative
61
No
Casing / Cement Violation
31
Yes
Clean Streams Law Violation
32
Yes
Erosion & Sediment
84
Yes
Failed to Control / Dispose of Fluids
279
Yes
Failure to Comply With Permit
3
No
Failure to Plug Well
1
Yes
Failure to Prevent Pollution Event
23
Yes
Failure to Protect Water Supplies
8
Yes
Failure to Report Pollution Event
20
Yes
Failure to Restore Site
8
No
Hazardous Venting
1
No
Industrial Waste / Pollutional Material Discharge
229
Yes
Rat Hole Not Filled
7
Yes
Residual Waste Mismanagement
2
Yes
Restricted Site Access to Inspector
1
No
Site Restoration Violation
9
No
Unmarked Plugged Well
1
No
Unpermitted Residual Waste Processing
73
Yes
Unsound Impoundment
20
Yes
Unspecified Violation
48
No
Waste Analysis Not Completed
1
No
Water Obstruction & Encroachment
7
Yes
TOTAL
949
–
Altogether, 816 out of the 949 violations (86%) issued in the Pine Creek Watershed were likely to have an impact on either surface or ground water in the region. Two sites have more than 50 violations each, including the Phoenix Well Pad, with 116 violations in Duncan Township, Tioga County, and the Bonnell Run Hunting & Fishing Corp Well Pad in Pine Township, Lycoming County, with 94 violations.
Water Complaints
When things go wrong with oil and gas operations, it is often residents in the surrounding areas that are exposed to the impacts. There are limited actions that affected neighbors can take, but one thing that they can do is register a complaint with the appropriate regulatory agency, in this case the Pennsylvania DEP.
A thorough file review was conducted by Public Herald for complaints related to oil and gas operations in PA, yielding 9,442 complaints between 2004 and 2016. While this includes all oil and gas related complaints, Public Herald’s analysis show that the frequency is highly correlated with the unconventional drilling boom that occurred within that time frame, with the number of new wells and complaints both peaking in 2011.
Many of these complaints occurred in the Pine Creek Watershed. It is impossible to know the exact number, as the precise location of the events was redacted in the records provided by DEP. Most of the records do include the county and in some cases, the municipality. Altogether, there were complaints in 32 municipalities that are either partially or entirely within the watershed, for a total of 185 total complaints. Of those, 116 of (63%) specifically indicate water impacts, spread out over 25 municipalities throughout the watershed.
Additional complaints with unspecified municipalities were received by DEP in Lycoming County (n=4), Potter County (n=4), and Tioga County (n=3). These counties substantially overlap with the Pine Creek Watershed, but the data is unclear as to whether or not these impacts were noted within the watershed or not.
It is worth remembering that complaints are dependent upon observation from neighbors and other passersby. As Pine Creek is composed of rugged terrain with vast swaths of public land, it is relatively sparsely populated. It is likely that if these drilling sites were placed in more densely populated areas, the number of complaints related to these operations would be even higher.
“It was 2007, and my water well was fine. I mean, I didn’t have any problem with it. I was cooking, drinking, bathing with it and everything else. Well, then after they drilled I thought it was kind of…it didn’t taste like it did before.”[xiv]
– Judy Eckhart
A Waste-Filled Proposition
Since the Pine Creek Watershed has been the site of considerable oil and gas extraction activity, it has also been the site of significant quantities of waste generated by the industry, which is classified as residual waste in Pennsylvania. This category is supposedly for nonhazardous industrial waste, although both liquid and solid waste streams from oil and gas operations pose significant risks to people exposed to them, as well as to the environment. Oil and gas waste is contaminated with a variety of dangerous volatile organic compounds and heavy metals, which are frequently highly radioactive. There are also a large number of chemicals that are injected into the well bore that flow back to the surface, the content of which is often kept secret, even from workers who make use of them onsite.
There were 37 sites in the Pine Creek Watershed that accepted liquid waste between 2011 and 2018. Of these sites, 30 (81%) were well pads, where flowback from drilling may be partially reused. While this reduces the overall volume of waste that ultimately needs to be disposed of, it frequently increases the concentration of hazardous contaminants that are found in the waste stream, which can make its eventual disposal more challenging. Most of the sites that accept waste do reuse that waste. However, the largest quantity of waste are from the remaining seven sites.
Table 5. Disposal of liquid gas waste in the Pine Creek Watershed
CATEGORY
BARRELS
GALLONS
PCT. TOTAL
Reuse at Well Pads
2,042,662
85,791,801
23%
Other Facilities
6,701,292
281,454,261
77%
GRAND TOTAL
8,743,954
367,246,062
100%
One single site – the Hydro Recovery LP Antrim Facility in Pine Township, Lycoming County – accounted for the majority of liquid waste disposed in the watershed, with 6,622,255 barrels (278,134,704 gallons.) has This amounts to 98.8% of all liquid waste that was not reused at other well pads.
Wastewater is also spread on roads in some communities, as a way to suppress dust on dirt roads. 3,001 barrels (126,050 gallons) of liquid waste have been used for road spreading efforts in regions intersecting the watershed in Ulysses Township, Potter County, and across private lots and roads throughout Potter and Tioga counties. Note that these figures include waste generated from conventional wells, which have different legal requirements for disposal than waste from unconventional wells, despite a similar chemical profile.
There are three facilities that have accepted solid oil and gas waste in the watershed, including a small one operated by Environmental Products and Services of Vermont (55 tons), Hydro Recovery LP Antrim Facility (10,415 tons), and Phoenix Resources Landfill (900,094 tons). This includes 200,808 tons in 2018, which is close to the previous peak value of 216,873 tons accepted in 2012.
Figure 1. Tons of solid O&G waste accepted at the Phoenix Resources Landfill
Recap: How has a decade of fracking impacted the Pine Creek Watershed?
1,374 recorded oil and gas wells in the watershed
554 are currently considered active
including 25 conventional and 529 unconventional wells
949 violations to unconventional oil and gas operations within the Pine Creek Watershed, 86% of which were likely to have an impact on either surface or ground water
185 complaints in 32 municipalities that are either partially or entirely within the watershed
A minimum of 515 acres cleared for the known gas pipeline routes in the region
26 compressor stations in the watershed
850,648,219 gallons of water used to frack wells in the watershed between 2013-2017
60 water-related facilities for oil and gas operations active within the watershed active in 2019, including two ground water withdrawal locations, 20 surface water withdrawal locations, and 38 interconnections (mostly retention ponds)
37 sites in the Pine Creek Watershed that accepted liquid waste between 2011 and 2018
And When It’s Over?
In the last ice age, glaciers came from the finger lakes area into Pine Creek. This made the soil there very deep and rich– in fact, people come from all over to study that soil. The Pine Creek area could be a mecca for sustainable agriculture. There is great soil, excellent water, and plenty of space for wind and solar. Under the right leadership, this region of Pennsylvania could feed people in a time when climate resilience is so urgently needed.
–Melissa Troutman, Research & Policy Analyst, Earthworks. Director of “Triple Divide.” Journalist, Public Herald
The Pine Creek region retains a primeval grandeur – an alluring wild spirit of great pride and significance to our state. Natural gas development has – and will further – compromise the natural and experiential qualities of this special place. For the benefit of Pennsylvanians today and tomorrow, extraction must be replaced by cleaner forms of energy and conservation values made preeminent.
The Pine Creek Watershed in Pennsylvania’s Susquehanna River Basin has seen more than its fair share of industrial impacts in the centuries since European contact, from repeated timber clearcutting, to coal extraction, to the development of unconventional oil and gas resources in the 21st century. Despite all of this, Pine Creek remains one of the Commonwealth’s natural gems, a cornerstone of the famed Pennsylvania Wilds.
Many of the impacts to the watershed could be thought of as temporary, in that they would likely stop occurring when the oil and gas developers decide to pack up and leave for good. This includes things like truck traffic, with all of the dust and diesel exhaust that accompanies that, pollution from compressor stations and leaky pipe junctions, and even most surface spills.
And yet in some ways, the ability of the land to sustain this industry becomes substantially impaired, and impacts become much more prolonged. Consider, for example, that prior logging efforts have permanently changed both the flora and fauna of the region. Similarly, while there is no more active coal mining in Pine Creek, almost 500 acres of sites deemed to be problematic remain, and some streams impacted by contaminated runoff and mine drainage have yet to return to their former pristine state, even decades later.
Unconventional drilling in the watershed will have similarly permanent impacts. While there is a legal threshold for site restoration, these multi-acre drill sites will not resemble the heavily forested landscape that once stood there when they reach the end of their useful life. Access roads and gathering lines that crisscross the landscape must be maintained until all well pads in the area are out of service, and then the aging infrastructure will remain in situ. Contaminated groundwater supplies are likely to take centuries to recover, if it is even possible at all.
Thousands of feet of rock once separated the unconventional formations from the surface. That distance was a barrier not just to the gas, but also to salty brines, toxic heavy metals, and naturally occurring radioactive materials that are present at those depths. To date, 593 holes have been drilled in the Pine Creek Watershed, creating 593 pathways for all of these materials to move to the surface. The only things keeping them in place are concrete and steel, both of which will inevitably fail over the course of time, particularly in the highly saline environment of an old gas well.
Even if the industry were to leave today and properly plug all of the wells in the Pine Creek Watershed, impacts from the drilling are likely to remain for many years to come.
[v] DCNR, Bureau of Forestry. Marcellus Shale Management Field Tour, 2012. http://www.paforestcoalition.org/documents/Marcellus_Shale_Management_Field_Tour_5-14-12.pdf
[vi] Hayes, Samuel P. Wars in the Woods: The Rise of Ecological Forestry in America. Pittsburgh, PA. University of Pittsburgh Press, 2006. (2007). P 120-121.
[vii] Owlett, Steven. Seasons Along the Tiadaghton: An Environmental History of the Pine Creek Gorge. Wellsboro, PA: Steven E. Owlett, 1993. P.58-60.
[viii] Owlett, Steven. Seasons Along the Tiadaghton: An Environmental History of the Pine Creek Gorge. Wellsboro, PA: Steven E. Owlett, 1993. P.61.
[ix] Pennsylvania Department of Environmental Protection, Oil Gas Locations – Conventional Unconventional,2019. https://www.pasda.psu.edu/uci/DataSummary.aspx?dataset=1088
[xiii]Pennsylvania Department of Environmental Protection. Oil and Gas Compliance Report Viewer. 2019. http://www.depreportingservices.state.pa.us/ReportServer/Pages/ReportViewer.aspx?/Oil_Gas/OG_Compliance
All aerial photography by TedAuch with flight support by LightHawk (May 2019).
Pine Creek compressor station FLIR camera footage by Earthworks (May 2019).
Project funding provided by:
https://www.fractracker.org/a5ej20sjfwe/wp-content/uploads/2019/07/DSC_0624_LowRes.jpg29444496Shannon Smithhttps://www.fractracker.org/a5ej20sjfwe/wp-content/uploads/2019/10/Fractracker-Color-Logo.jpgShannon Smith2019-08-07 09:36:032020-03-20 17:32:33Wildness Lost – Pine Creek
Pennsylvania a leading producer of waste from oil and gas production, which contains carcinogens, secret fracking chemicals, heavy metals, and radioactive materials. Read Earthworks’ latest report, and view FracTracker’s interactive map to see how much PA oil and gas waste is being processed, transported, and disposed near you.
https://www.fractracker.org/a5ej20sjfwe/wp-content/uploads/2020/10/TAuch_Plastics-Cracker_Construction-Shell-BeaverCounty_PA_Oct2019-Feature.jpg16673750Shannon Smithhttps://www.fractracker.org/a5ej20sjfwe/wp-content/uploads/2019/10/Fractracker-Color-Logo.jpgShannon Smith2020-10-28 16:40:362020-11-03 14:59:04Fracking and the 2020 Presidential Election
https://www.fractracker.org/a5ej20sjfwe/wp-content/uploads/2020/10/Waste-to-Energy-facilities-in-the-US-feature-.jpg16673750Karen Edelsteinhttps://www.fractracker.org/a5ej20sjfwe/wp-content/uploads/2019/10/Fractracker-Color-Logo.jpgKaren Edelstein2020-10-19 15:11:492020-10-20 17:32:13Incinerators: Dinosaurs in the world of energy generationTed Auch
https://www.fractracker.org/a5ej20sjfwe/wp-content/uploads/2020/10/TAuch_Plastics-Cracker_Construction-Shell-BeaverCounty_PA_Oct2019-Feature.jpg16673750Shannon Smithhttps://www.fractracker.org/a5ej20sjfwe/wp-content/uploads/2019/10/Fractracker-Color-Logo.jpgShannon Smith2020-10-14 11:54:592020-10-28 16:41:09Straight Talk on the Future of Fracking Jobs in Pennsylvania
Additional Maps, Data, & Reports
PA Oil & Gas Activity Over Time
GIF of unconventional wells drilled between May 2002 and March 2017
This album contains PA imagery contributed to our site from FracTracker staff and volunteers. Reuse is permitted so long as you cite the photographer if one is listed in the photo’s info section, as well as FracTracker Alliance.
To file an environmental health concern in PA, please contact:
Pennsylvania Department of Health (PA DOH)
Division of Environmental Health Epidemiology, Room 933, Health and Welfare Building
625 Forster St., Harrisburg, PA 17120
Toll free hotline: 1-877 PA Health (1-877-724-32584)
Email: RA-DHENVHEALTH@pa.gov • PA DOH Website
Occupational Health and Safety Administration (OSHA)
OSHA can help answer questions or concerns from employers and workers. To reach your regional or area OSHA office, go to OSHA’s Regional & Area Offices webpage or call 1-800-321-OSHA (6742). • OSHA Oil & Gas Website
Fracking has been raised as an issue that could determine the outcome of the 2020 US presidential election. Republican candidates have cited erroneous figures of how many fracking jobs exist in Pennsylvania, and have falsely claimed that Democratic presidential candidate Joe Biden and running mate Kamala Harris seek to ban fracking. And while the Democratic candidates have made suggestive comments in the past, they have made their position clear. As Senator Harris stated in the vice presidential debate: “I will repeat, and the American people know, that Joe Biden will not ban fracking. That is a fact.”
The debate around this issue is not on whether or not fracking should be banned– something neither party advocates– but rather around the facts. Republican candidates have inflated the extent of fracking jobs by up to 3500 percent. But the natural gas industry and the fracking boom have failed to deliver the job growth and prosperity that was predicted by proponents a decade ago. In reality, the total number of jobs in the natural gas industry in Pennsylvania never reached more than 30,000 over the last five years and is now less with the industry’s economic decline.
The total number of jobs in the natural gas industry in Pennsylvania never reached more than 30,000 over the last five years and is now less with the industry’s economic decline.
The debate should not be around the facts- those are already firmly established. The debate should be around how to best support fossil fuel workers in the inevitable transition to cleaner energy. What does a just transition that supports workers and the climate look like?
Pipeline construction in the Loyalsock Watershed, PA. Photo by Barb Jarmoska.
Stay in the know
Learn more about fracking and the 2020 presidential election
FracTracker Alliance and The Breathe Project have compiled a fact sheet to help us answer this question based on where Pennsylvania currently stands.
As unconventional oil and natural gas extraction operations have expanded throughout the United States over the past decade, the harmful health and environmental effects of fracking have become increasingly apparent and are supported by a steadily growing number of scientific studies and reports. Although some uncertainties remain around the exact exposure pathways, it is clear that issues associated with fracking negatively impact public health and the surrounding environment.
This map contains numerous data layers that help understand unconventional drilling activity in PA. View the map details below to learn more, or click on the map to explore the dynamic version of this data.
Straight Talk on the Future of Jobs in Pennsylvania (September 2020)
The Breathe Project and FracTracker Alliance have crafted the following messaging for refuting the conflated job numbers being touted by pro-fossil fuel organizations and political candidates regarding fracking and jobs in Pennsylvania that, in some cases, has inflated natural gas jobs in the state by 3500 percent.
The natural gas industry and the fracking boom have failed to deliver the job growth and prosperity that was predicted by proponents a decade ago. The total number of jobs in the natural gas industry in Pennsylvania never reached more than 30,000 over the last five years and is now less with the industry’s economic decline.
FACT: The Pa. Dept. of Labor and Industry (DLI) reported that direct employment in natural gas development totaled 19,623 in 2016. This was down from 28,926 total natural gas development jobs in 2015. This includes jobs in drilling, extraction, support operations and pipeline construction and transportation. (StateImpact, 2016)
Pa. DLI calculated the employment figures using data from six data classifications at the U.S. Bureau of Labor Statistics — specifically, the North American Industry Classification System (NAICS) codes for cured petroleum and natural gas extraction, natural gas liquid extraction, drilling oil and gas wells, support activities for oil and gas operations, oil and gas pipeline and related structures and pipeline transportation of natural gas. (Natural Gas Intel, 2016)
Inflated estimates of fracking-related jobs in Pennsylvania under previous Gov. Tom Corbett included regulators overseeing the industry as gas jobs, truck drivers, and those working in highway construction, steel mills, coal-fired power plants, sewage treatment plants, and others. Pa. Gov. Tom Wolf’s administration revised the way gas industry jobs were calculated to reflect a more accurate depiction of jobs in the sector.
FACT: Food & Water Watch calculated that there were 7,633 jobs pre-boom (2001 – 2006), which rose to 25,960 oil and gas industry jobs post-boom (2016 – 2018). (FWW, March 2020)
Food & Water Watch created a more accurate model using a definition that encompasses only jobs directly involved with domestic oil and gas production, specifically: oil and gas extraction; support activities for oil and gas operations; drilling oil and gas wells; oil and gas pipeline construction; and pipeline transportation.
FACT: The Food & Water Watch analysis also reports that misleadingly broad definitions in industry-supported job reports overstated the industries’ scope. The industry analysis included broad swaths of manufacturing industries including “fertilizer manufacturing,” convenience store workers, and gas station workers, which accounted for nearly 35 percent of all oil and gas jobs in their analysis. (FWW, PwC at 5 and Table 4 at 9, 2019)
FACT: As a point of comparison, in 2019, close to 1 million state residents were working in healthcare, 222,600 in education, and over 590,000 in local and state government. (Pennsylvania Bureau of Labor Statistics, July, 2020)
FACT: To forecast fracking-related job growth, the American Petroleum Institute used a model with exaggerated multipliers and faulty assumptions, such as the amount of purchases made from in-state suppliers, and it double counted jobs, leading to wildly optimistic estimates. (Ohio River Valley Institute, August 2020)
FACT: In addition, many of the jobs claimed in a 2017 American Chemistry Council Appalachian petrochemical economic impact study would arise in plastics manufacturing, which raises two concerns. First, both the ACC study and subsequent reports by the U.S. Department of Energy assume that 90% of the ethylene and polyethylene produced by imagined Appalachian cracker plants would be shipped out of the region to be used in manufacturing elsewhere in the country and the world. Of the 10% that would presumably stay in the region, much or most of it would serve to replace supplies that the region’s plastics manufacturers currently source from the Gulf Coast. (Ohio River Valley Institute, August 2020)
The fracking and petrochemical industries create unsustainable boom and bust cycles that do not holistically improve local economies.
FACT: Economic analyses show that the oil and gas industry is a risky economic proposition due to the current global oversupply of plastics, unpredictable costs to the industry, a lower demand for plastics, and increased competition. The analyses call into question industry’s plans to expand fracking and gas infrastructure in the region. (IEEFA, August 2020)
FACT: Plans to build petrochemical plants in Beaver County, Pennsylvania and Belmont, Ohio, for the sole purpose of manufacturing plastic nurdles will not be as profitable as originally portrayed. (IEEFA Report, June 2020)
A clean energy economy is the only way forward.
FACT: The Dept. of Energy’s U.S. Energy and Employment Report (2017) and E2 Clean Jobs Pennsylvania Report (2020) shows that clean energy jobs in Pennsylvania employ twice as many people as the fossil fuel industry prior to the pandemic.
FACT: The 4-state region of Ohio, West Virginia, Kentucky and Pennsylvania has formed a coalition of labor, policy experts and frontline community leaders called Reimagine Appalachia. This coalition is in the process of addressing the vast number of jobs in renewable and clean energy industries in a report that will be published this fall.
Reimagine Appalachia seeks major federal funding packages that will create jobs, rebuild infrastructure and addresses climate change that will ensure that no one is left behind going forward.
The Breathe Project is a coalition of citizens, environmental advocates, public health professionals and academics using the best available science and technology to improve air quality, eliminate climate pollution and make our region a healthy, prosperous place to live.
FracTracker Alliance is a 501(c)3 organization that maps, analyzes, and communicates the risks of oil, gas, and petrochemical development to advance just energy alternatives that protect public health, natural resources, and the climate.
Feature image of construction of the Royal Dutch Shell cracker plant in Beaver County, Pennsylvania, October 2019. Ted Auch, FracTracker Alliance.
https://www.fractracker.org/a5ej20sjfwe/wp-content/uploads/2020/10/TAuch_Plastics-Cracker_Construction-Shell-BeaverCounty_PA_Oct2019-Feature.jpg16673750Shannon Smithhttps://www.fractracker.org/a5ej20sjfwe/wp-content/uploads/2019/10/Fractracker-Color-Logo.jpgShannon Smith2020-10-28 16:40:362020-11-03 14:59:04Fracking and the 2020 Presidential Election
In this article, we’ll take a look at the current trend in “re-branding” incineration as a viable option to deal with the mountains of garbage generated by our society. Incineration can produce energy for electricity, but can the costs—both economically, and ecologically—justify the benefits? What are the alternatives?
Changes in our waste stream
In today’s world of consumerism and production, waste disposal is a chronic problem facing most communities worldwide. Lack of attention to recycling and composting, as well as ubiquitous dependence on plastics, synthetics, and poorly-constructed or single-use goods has created a waste crisis in the United States. So much of the waste that we create could be recycled or composted, however, taking extraordinary levels of pressure off our landfills. According to estimates in 2017 by the US Environmental Protection Agency (EPA), over 30 percent of municipal solid waste is made up of organic matter like food waste, wood, and yard trimmings, almost all of which could be composted. Paper, glass, and metals – also recyclable – make up nearly 40 percent of the residential waste stream. Recycling plastic, a material which comprises 13% of the waste stream, has largely been a failed endeavor thus far.
Why say NO to incinerators?
They are bad for the environment, producing toxic chlorinated byproducts like dioxins. Incineration often converts toxic municipal waste into other forms, some of which are even more toxic than their precursors.
They often consume more energy than they produce and are not profitable to run.
They add CO2 to the atmosphere.
They promote the false narrative that we can “get something” from our trash
They detract from the conversation about actual renewable energy sources like wind power, solar power, and geothermal energy that will stop the acceleration of climate chaos.
Nevertheless, of the approximately 400 million tons of plastic produced annually around the world, only about 10% of it is recycled. The rest winds up in the waste stream or as microfragments (or microplastics) in our oceans, freshwater lakes, and streams.
According to an EPA fact sheet, by 2017, municipal solid waste generation increased three-fold compared with 1960. In 1960, that number was 88.1 million tons. By 2017, this number had risen to nearly 267.8 million tons. Over that same period, per-capita waste generation rose from 2.68 pounds per person per day, to 4.38 pounds per person per day, as our culture became more wed to disposable items.
The EPA provides a robust “facts and figures” breakdown of waste generation and disposal here. In 2017, 42.53 million tons of US waste was shipped to landfills, which are under increasing pressure to expand and receive larger and larger loads from surrounding area, and, in some cases, hundreds of miles away.
How are Americans doing in reducing waste?
On average, in 2017, Americans recycled and composted 35.2% of our individual waste generation rate of 4.51 pounds per person per day. While this is a notable jump from decades earlier, much of the gain appears to be in the development of municipal yard waste composting programs. Although the benefits of recycling are abundantly clear, in today’s culture, according to a PEW Research Center report published in 2016, just under 30% of Americans live in communities where recycling is strongly encouraged. An EPA estimate for 2014 noted that the recycling rate that year was only 34.6%, nationwide, with the highest compliance rate at 89.5% for corrugated boxes.
Figure 3. Percent of Americans who report recycling and re-use behaviors in their communities, via Pew Research center
Historically, incineration – or burning solid waste – has been one method for disposing of waste. And in 2017, this was the fate of 34 million tons—or nearly 13%– of all municipal waste generated in the United States. Nearly a quarter of this waste consisted of containers and packaging—much of that made from plastic. The quantity of packaging materials in the combusted waste stream has jumped from only 150,000 tons in 1970 to 7.86 million tons in 2017. Plastic, in its many forms, made up 16.4% of all incinerated materials, according to the EPA’s estimates in 2017.
Figure 4: A breakdown of the 34.03 tons of municipal waste incinerated for energy in the US in 2017
What is driving the abundance of throw-away plastics in our waste stream?
Sadly, the answer is this: The oil and gas industry produces copious amounts of ethane, which is a byproduct of oil and gas extraction. Plastics are an “added value” component of the cycle of fossil fuel extraction. FracTracker has reported extensively on the controversial development of ethane “cracker” plants, which chemically change this extraction waste product into feedstock for the production of polypropylene plastic nuggets. These nuggets, or “nurdles,” are the building blocks for everything from fleece sportswear, to lumber, to packaging materials. The harmful impacts from plastics manufacturing on air and water quality, as well as on human and environmental health, are nothing short of stunning.
FracTracker has reported extensively on this issue. For further background reading, explore:
A report co-authored by FracTracker Alliance and the Center for Environmental Integrity in 2019 found that plastic production and incineration in 2019 contributed greenhouse gas emissions equivalent to that of 189 new 500-megawatt coal power plants. If plastic production and use grow as currently planned, by 2050, these emissions could rise to the equivalent to the emissions released by more than 615 coal-fired power plants.
Just another way of putting fossil fuels into our atmosphere
Incineration is now strongly critiqued as a dangerous solution to waste disposal as more synthetic and heavily processed materials derived from fossils fuels have entered the waste stream. Filters and other scrubbers that are designed to remove toxins and particulates from incineration smoke are anything but fail-safe. Furthermore, the fly-ash and bottom ash that are produced by incineration only concentrate hazardous compounds even further, posing additional conundrums for disposal.
Incineration as a means of waste disposal, in some states is considered a “renewable energy” source when electricity is generated as a by-product. Opponents of incineration and the so-called “waste-to-energy” process see it as a dangerous route for toxins to get into our lungs, and into the food stream. In fact, Energy Justice Network sees incineration as:
… the most expensive and polluting way to make energy or to manage waste. It produces the fewest jobs compared to reuse, recycling and composting the same materials. It is the dirtiest way to manage waste – far more polluting than landfills. It is also the dirtiest way to produce energy – far more polluting than coal burning.
Municipal waste incineration: bad environmentally, economically, ethically
Waste incineration has been one solution for disposing of trash for millennia. And now, aided by technology, and fueled by a crisis to dispose of ever-increasing trash our society generates, waste-to-energy (WTE) incineration facilities are a component in how we produce electricity.
But what is a common characteristic of the communities in which WTEs are sited? According to a 2019 report by the Tishman Environmental and Design Center at the New School, 79% of all municipal solid waste incinerators are located in communities of color and low-income communities. Incinerators are not only highly problematic environmentally and economically. They present direct and dire environmental justice threats.
Waste-to-Energy facilities in the US, existing and proposed
Activate the Layers List button to turn on Environmental Justice data on air pollutants and cancer occurrences across the United States. We have also included real-time air monitoring data in the interactive map because one of the health impacts of incineration includes respiratory illnesses. These air monitoring stations measure ambient particulate matter (PM 2.5) in the atmosphere, which can be a helpful metric.
What are the true costs of incineration?
These trash incinerators capture energy released from the process of burning materials, and turn it into electricity. But what are the costs? Proponents of incineration say it is a sensible way to reclaim or recovery energy that would otherwise be lost to landfill disposal. The US EIA also points out that burning waste reduces the volume of waste products by up to 87%.
The down-side of incineration of municipal waste, however, is proportionally much greater, with a panoply of health effects documented by the National Institutes for Health, and others.
Dioxins (shown in Figures 6-11) are some of the most dangerous byproducts of trash incineration. They make up a group of highly persistent organic pollutants that take a long time to degrade in the environment and are prone to bioaccumulation up the food chain.
Dioxins are known to cause cancer, disrupt the endocrine and immune systems, and lead to reproductive and developmental problems. Dioxins are some of the most dangerous compounds produced from incineration. Compared with the air pollution from coal-burning power plants, dioxin concentrations produced from incineration may be up to 28 times as high.
Federal EPA regulations between 2000 and 2005 resulted in the closure of nearly 200 high dioxin emitting plants. Currently, there are fewer than 100 waste-to-energy incinerators operating in the United States, all of which are required to operate with high-tech equipment that reduces dioxins to 1% of what used to be emitted. Nevertheless, even with these add-ons, incinerators still produce 28 times the amount of dioxin per BTU when compared with power plants that burn coal.
Even with pollution controls required of trash incinerators since 2005, compared with coal-burning energy generation, incineration still releases 6.4 times as much of the notoriously toxic pollutant mercury to produce the equivalent amount of energy.
Energy Justice Network, furthermore, notes that incineration is the most expensive means of managing waste… as well as making energy. This price tag includes high costs to build incinerators, as well as staff and maintain them — exceeding operation and maintenance costs of coal by a factor of 11, and nuclear by a factor of 4.2.
Figure 12. Costs of incineration per ton are nearly twice that of landfilling. Source: National Solid Waste Management Association 2005 Tip Fee Survey, p. 3.
Energy Justice Network and others have pointed out that the amount of energy recovered and/or saved from recycling or composting is up to five times that which would be provided through incineration.
Figure 13. Estimated power plant capital and operating costs. Source: Energy Justice Network
The myth that incineration is a form of “renewable energy”
Waste is a “renewable” resource only to the extent that humans will continue to generate waste. In general, the definition of “renewable” refers to non-fossil fuel based energy, such as wind, solar, geothermal, wind, hydropower, and biomass. Synthetic materials like plastics, derived from oil and gas, however, are not. Although not created from fossil fuels, biologically-derived products are not technically “renewable” either.
Biogenic materials you find in the residual waste stream, such as food, paper, card and natural textiles, are derived from intensive agriculture – monoculture forests, cotton fields and other “green deserts”. The ecosystems from which these materials are derived could not survive in the absence of human intervention, and of energy inputs from fossil sources. It is, therefore, more than debatable whether such materials should be referred to as renewable.
Although incineration may reduce waste volumes by up to 90%, the resulting waste-products are problematic. “Fly-ash,” which is composed of the light-weight byproducts, may be reused in concrete and wallboard. “Bottom ash” however, the more coarse fraction of incineration—about 10% overall—concentrates toxins like heavy metals. Bottom-ash is disposed of in landfills or sometimes incorporated into structural fill and aggregate road-base material.
How common is the practice of using trash to fuel power plants?
Trash incineration accounts for a fraction of the power produced in the United States. According to the United States Energy Information Administration, just under 13% of electricity generated in the US comes from burning of municipal solid waste, in fewer than 65 waste-to-energy plants nation-wide. Nevertheless, operational waste-to-incineration plants are found throughout the United States, with a concentration east of the Mississippi.
According to EnergyJustice.net’s count of waste incinerators in the US and Canada, currently, there are:
88 operating
41 proposed
0 expanding
207 closed or defeated
Figure 14. Locations of waste incinerators that are already shut down. Source: EnergyJustice.net)
Precise numbers of these incinerators are difficult to ascertain, however. Recent estimates from the federal government put the number of current waste-to-energy facilities at slightly fewer: EPA currently says there are 75 of these incinerators in the United States. And in their database, updated July 2020, the United States Energy Information Administration (EIA), lists 63 power plants that are fueled by municipal solid waste. Of these 63 plants, 40—or 66%—are in the northeast United States.
Regardless, advocates of clean energy, waste reduction, and sustainability argue that trash incinerators, despite improvements in pollution reduction over earlier times and the potential for at least some electric generation, are the least effective option for waste disposal that exists. The trend towards plant closure across the United States would support that assertion.
Let’s take a look at the dirty details on WTE facilities in three states in the Northeastern US.
Review of WTE plants in New York, Pennsylvania, and New Jersey
A. New York State
Operational WTE Facilities
In NYS, there are currently 11 waste-to-energy facilities that are operational, and two that are proposed. Here’s a look at some of them:
The largest waste-to-energy facility in New York State, Covanta Hempstead Company (Nassau County), was built in 1989. It is a 72 MW generating plant, and considered by Covanta to be the “cornerstone of the town’s integrated waste service plan.”
According to the Environmental Protection Agency’s ECHO database, this plant has no violations listed. Oddly enough, even after drawing public attention in 2009 about the risks associated with particulate fall-out from the plant, the facility has not been inspected in the past 5 years.
Other WTE facilities in New York State include the Wheelabrator plant located in Peekskill (51 MW), Covanta Energy of Niagara in Niagara Falls (32 MW), Convanta Onondaga in Jamesville (39 MW), Huntington Resource Recovery in Suffolk County (24.3 MW), and the Babylon Resource Recovery Facility also in Suffolk County (16.8 MW). Five additional plants scattered throughout the state in Oswego, Dutchess, Suffolk, Tioga, and Washington Counties, are smaller than 15 MW each. Of those, two closed and one proposal was defeated.
Closed / Defeated Facilities
The $550 million Corinth American Ref-Fuel, was proposed for Corinth, New York. It was designed to take 1.27 million tons of New York City waste/year, even more than what is planned for the CircularEnerG plant. It was defeated ~2004. Population of 864 in immediate vicinity of plant, 98% white, income $59K.
Fire Island, Saltaire Incinerator closed. Took 12 tons/day. It was opened in 1965s, but not designed to produce energy, just burn trash. There was a population of 317 in immediate vicinity of plant, 93% white, income $123K.
The Long Beach incinerator processed 200 tons per day of solid waste. This plant was operating in 1988, but closed in 1996.
The Albany Steam Plant closed in 1994. When it was operational, it took in 340-600 tons of trash per day. Environmental justice issues were plentiful at this plant, with over 99% of the area as African American, according to the LA Times coverage of the issue.
CircularEnerG, was a 50 MW plant proposed in Romulus, on the former Seneca Army Depot, in the middle of largely white Seneca County, New York. However, the nearest large population to the proposed site was the 1500-prisoner capacity Five Points Correctional facility, swaying the demographics to nearly 52% African American in the highest impact zone. More broadly, the facility was in the heart of the Finger Lakes wine region, known for its extraordinary scenery, clean lakes, and award-winning wines. This facility was broadly opposed by nearly all the surrounding municipalities and counties, and mired in controversy about improper procedures and a designation by a local zoning officer as a “renewable” source of energy in its early filing papers.
Local advocacy groups, Seneca Lake Guardian (an affiliate of the Waterkeeper Network), and the Finger Lakes Wine Business Coalition worked exhaustively with the legal group, Earthjustice, to stop the project.
Figure 15. Map of regional governments and organizations opposed to construction of Romulus waste-to-energy incinerator in New York State
In March 2019, after state lawmakers, along with Governor Andrew Cuomo came out against the trash incinerator, the special use permit application for the facility was withdrawn.
Plans were also in development for a garbage-to-gas plant in the Hudson River community of Stony Point, New York. The company, New Planet Energy, had hoped to construct the gasification plant that would accept 4,500 tons of waste daily, brought in each day by approximately 400 trucks, according to an article in Lohud, May 1, 2018. However, the owner of the property eventually backed out of the proposal shortly after the publication of the article, following an uptick in criticism about the project about environmental and traffic safety concerns. This property is also currently an active Superfund site.
Proposed WTE Facilities
In New York State, there are currently two proposed WTE facilities.
New York State has rejected the designation for WTE facilities since 2011. As of the latest reports, the company is pushing ahead with its plans, despite the widespread dislike for the project. A bill in the State Legislature has been introduced to block the project. Green Waste Energy has been proposed for Rensselaer, NY. This trash-burning gasification plant would accept 2500 tons of trash per day. However, in August 2020, the New York State Department of Environmental Conservation (DEC) denied the air quality permit for the facility. The developers may appeal this decision.
In New Windsor, NY, a project called W2E Orange County has been under consideration. Most recent news coverage of this project was three and a half years ago, so it is possible this project is not moving forward. The parent company of the project, Ensorga, appears to have contracted its operations to West Virginia.
B. Pennsylvania
Operational WTE Facilities
In Pennsylvania, six WTE facilities are currently operating. Two have been closed, and six defeated.
Proposed WTE Facilities
In Pennsylvania, there are currently no WTEs under consideration for construction.
Closed WTE Facilities
Chester Resource Recovery #1 was used from the late 1950s to 1979. The neighborhood is over 64% African American. This was one of three incinerators used here.
Westmoreland County WTE plant, which opened in 1986 and burned 25 tons of solid municipal waste per day, has been closed due to financial unviability, and lack of need for the steam that was produced, according to a report drafted in 1997. It was located in a densely populated area, and provided steam to a nursing home, jail, and low-income housing.
Defeated WTE Facility Proposals
Elroy trash-to-steam plant was located in a densely populated section of Franconia Township, Montgomery County, Pennsylvania. It was to handle 360 tons of waste per day and was located on the grounds of a rendering plant. The application for this plant was withdrawn in June, 1989. Citizens for a Clean Environment successfully defeated this project.
The Plasma Gasification Incinerator, located in Hazle Township, Pennsylvania, was proposed to burn 4,000 tons of trash per day. The median income in the immediate vicinity of the site is $46K. The application for this project was withdrawn.
The Pittston Trash Incinerator in a very low-income area of Luzerne County, Pennsylvania, was designed to burn 3,000 tons of trash per day. This project was defeated.
The $65 million Delta Thermo Muncy facility, which would have burned municipal waste and sewage sludge, was defeated in December, 2016. Citizens in the Energy Justice Network and Stop the Muncy Waste Incinerator organized and passed a set-back ordinance that made it impossible for the plant to locate there. This proposed plant, would have been located in Lycoming County, Pennsylvania. The plan there was to decompose trash and sewage through a hydrothermal technique to create pellets, which would then be burned to yield energy.
Originally proposed in 2007, the $49 million Delta Thermo Allentown plant has been fought for many years by Allentown Residents for Clean Air. If built, it would generate 2 MW of energy, and receive 100 tons of municipal waste each day and 50 tons of sewage sludge. The plant is located in a densely-populated, predominately Hispanic neighborhood. There has been no news on this project in over four years, so this project appears to have been defeated.
Glendon Energy proposed building an incinerator in Northampton County, Pennsylvania. This proposal was also defeated.
C. New Jersey
Operational WTE Facilities
And in New Jersey, there are currently four operating WTE facilities. Essex County Resource Recovery Facility, is New Jersey’s largest WTE facility. It opened in 1990, houses three burners, and produces 93 MW total.
Three WTE facilities are currently proposed in New Jersey. Jefferson Renewable Energy Trash Incinerator (Jersey City, New Jersey) is designed to produce 90 MW of power, accepting 3,200 tons/day solid waste, plus 800 tons/day construction/demo waste.
Delta Thermo Sussex is designed to burn both municipal solid waste and sewage sludge. And DTE Paterson would accept 205 tons of waste/day. The price tag to build this small facility is not so small: $45 million.
Closed WTE Facilities
Two WTE plants in New Jersey are no longer in operation. These include Fort Dix, which opened in 1986 and burned 80 tons of trash per day; and Atlantic County Jail, which opened in 1990 and burned 14 tons of trash per day.
Throw-aways, burn-aways, take-aways
Looming large above the arguments about appropriate siting, environmental justice, financial gain, and energy prices, is a bigger question:
How can we continue to live on this planet at our current rates of consumption, and the resultant waste generation?
The issue here is not so much about the sources of our heat and electricity in the future, but rather “How MUST we change our habits now to ensure a future on a livable planet?”
Professor Paul Connett (emeritus, St. Lawrence University), is a specialist in the build-up of dioxins in food chains, and the problems, dangers, and alternatives to incineration. He is a vocal advocate for a “Zero Waste” approach to consumption, and suggests that every community embrace these principles as ways to guide a reduction of our waste footprint on the planet. The fewer resources that are used, the less waste is produced, mitigating the extensive costs brought on by our consumptive lifestyles. Waste-to-energy incineration facilities are just a symptom of our excessively consumptive society.
Dr. Connett suggests these simple but powerful methods to drastically reduce the amount of materials that we dispose — whether by incineration, landfill, or out the car window on a back-road, anywhere in the world:
Source separation
Recycling
Door-to-door collection
Composting
Building Reuse, Repair and Community centers
Implementing waste reduction Initiatives
Building Residual Separation and Research centers
Better industrial design
Economic incentives
Interim landfill for non-recyclables and biological stabilization of other organic materials
Connett’s Zero Waste charge to industry is this: “If we can’t reuse, recycle, or compost it, industry shouldn’t be making it.” Reducing our waste reduces our energy footprint on the planet.
In a similar vein, FracTracker has written about the potential for managing waste through a circular economics model, which has been successfully implemented by the city of Freiburg, Germany. A circular economic model incorporates recycling, reuse, and repair to loop “waste” back into the system. A circular model focuses on designing products that last and can be repaired or re-introduced back into a natural ecosystem.
This is an important vision to embrace. Every day. Everywhere.
For more in-depth and informative background on plastic in the environment, please watch “The Story of Plastic” (https://www.storyofplastic.org/). The producers of the film encourage holding group discussions after the film so that audiences can actively think through action plans to reduce plastic use.
https://www.fractracker.org/a5ej20sjfwe/wp-content/uploads/2020/10/Waste-to-Energy-facilities-in-the-US-feature-.jpg16673750Karen Edelsteinhttps://www.fractracker.org/a5ej20sjfwe/wp-content/uploads/2019/10/Fractracker-Color-Logo.jpgKaren Edelstein2020-10-19 15:11:492020-10-20 17:32:13Incinerators: Dinosaurs in the world of energy generation
Fracking has been raised as an issue that could determine the outcome of the 2020 US presidential election. Republican candidates have cited erroneous figures of how many fracking jobs exist in Pennsylvania, and have falsely claimed that Democratic presidential candidate Joe Biden and running mate Kamala Harris seek to ban fracking. And while the Democratic candidates have made suggestive comments in the past, they have made their position clear. As Senator Harris stated in the vice presidential debate: “I will repeat, and the American people know, that Joe Biden will not ban fracking. That is a fact.”
The debate around this issue is not on whether or not fracking should be banned– something neither party advocates– but rather around the facts. Republican candidates have inflated the extent of fracking jobs by up to 3500 percent. But the natural gas industry and the fracking boom have failed to deliver the job growth and prosperity that was predicted by proponents a decade ago. In reality, the total number of jobs in the natural gas industry in Pennsylvania never reached more than 30,000 over the last five years and is now less with the industry’s economic decline.
The total number of jobs in the natural gas industry in Pennsylvania never reached more than 30,000 over the last five years and is now less with the industry’s economic decline.
The debate should not be around the facts- those are already firmly established. The debate should be around how to best support fossil fuel workers in the inevitable transition to cleaner energy. What does a just transition that supports workers and the climate look like?
FracTracker Alliance and The Breathe Project have compiled a fact sheet to help us answer this question based on where Pennsylvania currently stands.
Straight Talk on the Future of Jobs in Pennsylvania (September 2020)
The Breathe Project and FracTracker Alliance have crafted the following messaging for refuting the conflated job numbers being touted by pro-fossil fuel organizations and political candidates regarding fracking and jobs in Pennsylvania that, in some cases, has inflated natural gas jobs in the state by 3500 percent.
The natural gas industry and the fracking boom have failed to deliver the job growth and prosperity that was predicted by proponents a decade ago. The total number of jobs in the natural gas industry in Pennsylvania never reached more than 30,000 over the last five years and is now less with the industry’s economic decline.
FACT: The Pa. Dept. of Labor and Industry (DLI) reported that direct employment in natural gas development totaled 19,623 in 2016. This was down from 28,926 total natural gas development jobs in 2015. This includes jobs in drilling, extraction, support operations and pipeline construction and transportation. (StateImpact, 2016)
Pa. DLI calculated the employment figures using data from six data classifications at the U.S. Bureau of Labor Statistics — specifically, the North American Industry Classification System (NAICS) codes for cured petroleum and natural gas extraction, natural gas liquid extraction, drilling oil and gas wells, support activities for oil and gas operations, oil and gas pipeline and related structures and pipeline transportation of natural gas. (Natural Gas Intel, 2016)
Inflated estimates of fracking-related jobs in Pennsylvania under previous Gov. Tom Corbett included regulators overseeing the industry as gas jobs, truck drivers, and those working in highway construction, steel mills, coal-fired power plants, sewage treatment plants, and others. Pa. Gov. Tom Wolf’s administration revised the way gas industry jobs were calculated to reflect a more accurate depiction of jobs in the sector.
FACT: Food & Water Watch calculated that there were 7,633 jobs pre-boom (2001 – 2006), which rose to 25,960 oil and gas industry jobs post-boom (2016 – 2018). (FWW, March 2020)
Food & Water Watch created a more accurate model using a definition that encompasses only jobs directly involved with domestic oil and gas production, specifically: oil and gas extraction; support activities for oil and gas operations; drilling oil and gas wells; oil and gas pipeline construction; and pipeline transportation.
FACT: The Food & Water Watch analysis also reports that misleadingly broad definitions in industry-supported job reports overstated the industries’ scope. The industry analysis included broad swaths of manufacturing industries including “fertilizer manufacturing,” convenience store workers, and gas station workers, which accounted for nearly 35 percent of all oil and gas jobs in their analysis. (FWW, PwC at 5 and Table 4 at 9, 2019)
FACT: As a point of comparison, in 2019, close to 1 million state residents were working in healthcare, 222,600 in education, and over 590,000 in local and state government. (Pennsylvania Bureau of Labor Statistics, July, 2020)
FACT: To forecast fracking-related job growth, the American Petroleum Institute used a model with exaggerated multipliers and faulty assumptions, such as the amount of purchases made from in-state suppliers, and it double counted jobs, leading to wildly optimistic estimates. (Ohio River Valley Institute, August 2020)
FACT: In addition, many of the jobs claimed in a 2017 American Chemistry Council Appalachian petrochemical economic impact study would arise in plastics manufacturing, which raises two concerns. First, both the ACC study and subsequent reports by the U.S. Department of Energy assume that 90% of the ethylene and polyethylene produced by imagined Appalachian cracker plants would be shipped out of the region to be used in manufacturing elsewhere in the country and the world. Of the 10% that would presumably stay in the region, much or most of it would serve to replace supplies that the region’s plastics manufacturers currently source from the Gulf Coast. (Ohio River Valley Institute, August 2020)
The fracking and petrochemical industries create unsustainable boom and bust cycles that do not holistically improve local economies.
FACT: Economic analyses show that the oil and gas industry is a risky economic proposition due to the current global oversupply of plastics, unpredictable costs to the industry, a lower demand for plastics, and increased competition. The analyses call into question industry’s plans to expand fracking and gas infrastructure in the region. (IEEFA, August 2020)
FACT: Plans to build petrochemical plants in Beaver County, Pennsylvania and Belmont, Ohio, for the sole purpose of manufacturing plastic nurdles will not be as profitable as originally portrayed. (IEEFA Report, June 2020)
A clean energy economy is the only way forward.
FACT: The Dept. of Energy’s U.S. Energy and Employment Report (2017) and E2 Clean Jobs Pennsylvania Report (2020) shows that clean energy jobs in Pennsylvania employ twice as many people as the fossil fuel industry prior to the pandemic.
FACT: The 4-state region of Ohio, West Virginia, Kentucky and Pennsylvania has formed a coalition of labor, policy experts and frontline community leaders called Reimagine Appalachia. This coalition is in the process of addressing the vast number of jobs in renewable and clean energy industries in a report that will be published this fall.
Reimagine Appalachia seeks major federal funding packages that will create jobs, rebuild infrastructure and addresses climate change that will ensure that no one is left behind going forward.
The Breathe Project is a coalition of citizens, environmental advocates, public health professionals and academics using the best available science and technology to improve air quality, eliminate climate pollution and make our region a healthy, prosperous place to live.
FracTracker Alliance is a 501(c)3 organization that maps, analyzes, and communicates the risks of oil, gas, and petrochemical development to advance just energy alternatives that protect public health, natural resources, and the climate.
Feature image of construction of the Royal Dutch Shell cracker plant in Beaver County, Pennsylvania, October 2019. Ted Auch, FracTracker Alliance.
https://www.fractracker.org/a5ej20sjfwe/wp-content/uploads/2020/10/TAuch_Plastics-Cracker_Construction-Shell-BeaverCounty_PA_Oct2019-Feature.jpg16673750Shannon Smithhttps://www.fractracker.org/a5ej20sjfwe/wp-content/uploads/2019/10/Fractracker-Color-Logo.jpgShannon Smith2020-10-14 11:54:592020-10-28 16:41:09Straight Talk on the Future of Fracking Jobs in Pennsylvania
FracTracker Alliance has released a new mapof drilling fluid spills along the Mariner East 2 pipeline route, showing 320 spills from its construction since 2017. Of those, a combined 147 incidents have released over 260,000 gallons of drilling fluid into Pennsylvania waterways.
The unpermitted discharge of drilling fluid, considered “industrial waste,” into waters of the Commonwealth violates The Clean Streams Law.
What you need to know:
Sunoco’s installation of the Mariner East 2 pipeline has triggered 320 incidences of drilling mud spills since 2017, releasing between 344,590 – 405,990 gallons of drilling fluid into the environment. View an interactive map and see a timeline of these incidents.
Construction has caused between 260,672 – 266,223 gallons of drilling fluid to spill into waterways, threatening the health of ecosystems and negatively affecting the drinking water of many residents.
There have been 36 spills since Pennsylvania entered a statewide shutdown on March 16th, 2020, in response to the COVID-19 pandemic. These spills released over 10,000 gallons of drilling fluid — most of which poured into Marsh Creek Lake in Marsh Creek State Park. See a map of this incident.
While the total reported volume of drilling fluid released into the environment from the pipeline’s construction is between 344,590 – 405,990 gallons, the actual total is larger, as there are 28 spills with unknown volumes. Spills of drilling mud are also referred to as “inadvertent returns,” or “frac-outs.”
Most of these spills occurred during implementation of horizontal directional drills (HDD). HDDs are used to install a pipeline under a waterway, road, or other sensitive area. This technique requires large quantities of drilling fluid (comprising water, bentonite clay, and chemical additives), which when spilled into the environment, can damage ecosystems and contaminate drinking water sources.
ME2 Background
The Mariner East 2 pipeline project is part of the Mariner East pipeline system, which carries natural gas liquids (NGLs) extracted by fracked wells in the Ohio River Valley east, to the Marcus Hook Facility in Delaware County, Pennsylvania. The NGLs will then go to Europe to be turned into plastic. Explore FracTracker’s other resources on this project:
There have been 36 spills since the Commonwealth shutdown statewide on March 16th, 2020, leaks that have jeopardized drinking water sources, putting communities at even higher risk during the COVID-19 pandemic.
On August 11th, construction caused a 15-foot wide and eight-foot deep subsidence event in the wetland (Figure 1). This caused drilling fluid to flow underground and contaminate groundwater, while also “adversely impacting the functions and values of the wetland.” Thirty-three acres of the lake are now closed to boating, fishing, and other uses of the lake — an extra blow, given the solace state parks have provided to many during this pandemic.
Figure 1. This HDD crossing in Upper Uwchlan Township, Chester County, caused over 8,000 gallons of drilling mud to spill into waterways. However, installation of the parallel 16-inch pipeline also caused spills at this same location in 2017.
A plume of drilling mud, captured here on video, entered the Marsh Creek Lake and settled on the lake bottom.
Upper Uwchlan Reroute
Last week, the PA DEP ordered Sunoco to suspend work on this HDD site and to implement a reroute using a course Sunoco had identified as an alternative in 2017:
“A 1.01 mile reroute to the north of the HDD is technically feasible. This would entail adjusting the project route prior to this HDD’s northwest entry/exit point to proceed north, cross under the Pennsylvania Turnpike, then proceed east for 0.7 miles parallel to the turnpike, cross Little Conestoga Road, then turn south, cross under the turnpike, and then reintersect the existing project route just east of this HDD’s southeast entry/exit point. There is no existing utility corridor here, however; therefore, this route would create a Greenfield utility corridor and would result in encumbering previously unaffected properties. The route would still cross two Waters of the Commonwealth and possible forested wetlands, and would pass in near proximity or immediately adjacent to five residential home sites. Both crossings of the turnpike would require “mini” HDDs or direct pipe bores to achieve the required depth of cover under the highway. Considered against the possibility of additional IRs [inadvertent returns] occurring on the proposed HDD, which are readily contained and cleaned up with minimal affect to natural resources, the permanent taking of the new 4 easement and likely need to use condemnation against previously unaffected landowners results in SPLP’s opinion that managing the proposed HDD is the preferred option.”
Based on that description, the route could follow the general direction of the dashed line in Figure 2:
Figure 2. Possible reroute of Mariner East 2 Pipeline shown with dashed line
The August incident likely surprised no one, as it was not the first spill at this location, and Sunoco’s own assessment acknowledged that this HDD crossing came with “a moderate to high risk of drilling fluid loss and IRs.”
Residents also sounded alarm bells for this drilling site. The proposal for just this location garnered over 200 public comments, all of which called on the DEP to deny Sunoco’s permit for drilling in this area. Many implored the DEP to consider the alternate route Sunoco must now use.
George Alexander, a Delaware County resident who runs a blog on this pipeline, the Dragonpipe Diary, says, “Sunoco/Energy Transfer continues to demonstrate in real time that they cannot build the Mariner Pipelines without inflicting harm upon our communities … The Marsh Creek situation is reminiscent of the damage to another favorite Pennsylvania lake, Raystown Lake in Huntingdon County.”
In 2017, Sunoco spilled over 200,000 gallons of drilling fluid into Raystown Lake, and released millions more underground. The spill caked acres of the lakebed with a coating of mud, hurting aquatic life and limiting recreational access to the lake. Sunoco failed to report the spills when they occurred, and the DEP fined the company $1.95 million for the incident. The fine is one of many Sunoco has incurred, including a $12.6 million penalty in February 2018 for permit violations, and more recently, a $355,636 penalty for drilling fluid discharges into waterways across eight counties.
The fracking boom triggered investment in projects to convert the fracked gas to plastic, leading to an oversupply in the global market. The industry made ambitious plans based on the price of plastic being $1/pound. Now, in 2020, the price is 40 – 60 cents per pound. If the Mariner East 2 pipeline is brought online, it likely will not be as profitable as its operators expected.
The poor finances of the oil and gas industry have led to the demise of several pipeline projects over the last few months. Phillips 66 announced in March it was deferring two pipelines — the Liberty Pipeline, which would transport crude oil from Wyoming to Oklahoma — and the Red Oak Pipeline system, planned to cross from Oklahoma to Texas. Kinder Morgan expressed uncertainty for its proposed Texas Permian Pass pipeline, and Enterprise Products Partners cancelled its Midland-to-ECHO crude oil pipeline project. The Atlantic Coast Pipeline also was cancelled this past July by Duke Energy and Dominion Energy, following “an unacceptable layer of uncertainty and anticipated delays,” and the Williams Constitution pipeline was also abandoned after years of challenges. In fact, the EIA recently reported that more pipeline capacity has been cancelled in 2020 than new capacity brought in service.
Will the Mariner East 2 be the next to fall?
Before you go
A note from the Safety 7: The Safety 7 are seven residents of Delaware and Chester Counties who are challenging Sunoco before the [Pennsylvania Public Utility Commission]. If you are outraged at the ongoing threat to our communities from this dangerous, destructive pipeline, please consider donating to the Safety 7 Legal fund … Our next hearing begins September 29, and funds from your support are urgently needed. This motion is representative of the kind of legal work we need, if we are to prevail in protecting our communities from this dangerous pipeline project. Please contribute today if you are able, and please share this appeal widely and let your friends and family know why this case matters to you!
https://www.fractracker.org/a5ej20sjfwe/wp-content/uploads/2020/09/ME2FeatureImage.jpg8331875Erica Jacksonhttps://www.fractracker.org/a5ej20sjfwe/wp-content/uploads/2019/10/Fractracker-Color-Logo.jpgErica Jackson2020-09-17 11:20:062020-09-28 15:22:31Mariner East 2 Causes Dozens of Spills Since Lockdown Began, Over 300 in Total
New Fortress Energy plans to build a liquefied natural gas (LNG) plant in Wyalusing, Pennsylvania, but residents in close proximity to the extensive facility and those along the transportation routes are pushing back due to health and safety concerns.
Overview
North America has an excess of fracked gas. The price of gas continues to plummet, due largely to an oversupply that exceeds market demand from Americans who want to enjoy their so-called “energy independence.” According to the United States Energy Information Administration (EIA), there is almost 18% more stored gas at the end of 2019 as there was at the end of 2018, translating to an increase of over 500 billion cubic feet over the course of a year.
What was once a promised economic boom to many communities has given way to bust. This is due, in part, to less production across the fracking fields, to the cancellation of numerous pipelines, and to the lack of domestic markets for fracked gas.
As costs for wind, solar, and grid-scale battery storage continue to drop, people are increasingly less reliant on fossil fuels. Aside from underground storage, what can industry do with all that excess product so industry has a justification to keep drilling?
Rather than cutting back on production, industry chooses to relieve domestic over-saturation by sending the gas off-shore for export.
While gas is typically moved from source to consumer via pipelines, transporting gas long distances overseas presents a technical challenge. Industry chooses to compress the gas under pressure or cryogenics so that it takes up less space. Liquefied natural gas, or LNG, is simply super-cooled methane, stored at minus 260 degrees Fahrenheit.
A new LNG project in northern Pennsylvania
A little more than a year ago, New Fortress Energy announced plans to invest $800 million to develop a liquefied natural gas plant along the scenic Susquehanna River in the Bradford County, Pennsylvania community of Wyalusing. In this quiet community of fewer than 600 people, formerly open fields and woodland are slated to be converted into massive LNG complex spanning 260 acres. The plant would produce approximately 3.6 million gallons of LNG each day.
Located on the site of the proposed LNG project is a historic marker, memorializing the pre-Colonial settlement of Friedenshütten. Here, indigenous Mahican, Lenape, and Haudenosaunee converts to Christianity lived with Moravian missionaries. The village was active between 1765 and 1772. According to Katherine Faull of Bucknell University “the Friedenshütten mission was dissolved in 1772, ostensibly because of the uncertainty of the land deals that had been made with the Cayuga who had jurisdiction over that part of Pennsylvania.” Portions of the settlement structure area visible in the 1768 map (Figure 1) are 700 feet from the New Fortress methane liquefaction buildings.
Figure 1. Map by Georg Wenzel Golkowsky, 1768 (TS Mp.213.13, Unity Archives, Herrnhut)
New Fortress Energy has plans to cut a 50-foot-wide stormwater drainage ditch directly through this historic site. Construction of the plant would reportedly create up to 500 temporary jobs, and 50 permanent ones.
Figure 2. Aerial view of site preparation work at the New Fortress LNG plant site. Source: Ted Auch, FracTracker Alliance
The site plan for the new facility, developed in October 2018, includes large gas engines, a liquefaction facility, a hydrocarbon impoundment basin, LNG storage and pumps, a gas treatment facility, transformers, and tanker staging areas. Some features are sited within 500 feet of the railroad.
Figure 3. Proposed site plan of the New Fortress LNG facility in Wyalusing, Pennsylvania. Map by FracTracker Alliance.
An air quality plan for the New Fortress LNG facility was approved in July, 2019. Although construction was well underway starting in spring 2019, work is currently paused on the site. New Fortress has not indicated when work would resume, but expects the construction process to span two to 2.5 years.
Where to, after Wyalusing?
Without an adequate market for the gas in the United States, LNG is destined for shipping overseas in specially-designed LNG carrier ships. In 2018, according to US government data reported in rigzone.com:
“….28 countries in total received LNG exports during 2018. However, just ten countries accounted for 82 percent of the U.S. LNG direct tanker exports that year and the top four markets shared 187 shipments between them. South Korea, the top destination, received 73 cargoes in all, followed by Mexico with 53, Japan with 37 and lastly China with 24. Of the remainder, Jordan, Chile, India, Turkey, Spain, Argentina, and Brazil took only a small number of shipments each. In addition to the standard large shipments of LNG in dedicated tankers, small shipments of LNG in special containers known as ISOs were sent to the Bahamas and Barbados.”
Presently, plans are in the works for the construction of a new LNG export facility in Gibbstown, New Jersey, located just downstream from Philadelphia on the Delaware River. The Gibbstown site was formerly the home of Dupont Repauno Works, where dynamite was manufactured from 1880 to 1954. Later, the main products made there were commodity chemicals such as nitric acid. The proposed export terminal design includes two 43-foot-deep docks that would accommodate LNG tankers.
The advocacy organization “Empower NJ” provides a comprehensive description here of the proposed expansion of the deepwater LNG export terminal at Gibbstown. LNG delivered to the site would be stored in an old underground cavern previously used by Dupont. While dredging for a single dock at Gibbstown was approved by the Delaware River in 2019, new plans to build two more loading berths at a second dock are now under consideration.
Modes of transportation from Wyalusing to Gibbstown
In collaboration with Delaware Riverkeeper Network (DRN), FracTracker looked at potential overland routes for how the LNG produced in Wyalusing would reach the nearest export terminal in Gibbstown, New Jersey, a distance of 200 or more miles away.
While transportation by rail of liquefied natural gas had not been permitted by federal regulations, a significant change in rules occurred in June 2020. Under pressure from the current administration in Washington, DC, the Pipeline and Hazardous Materials Safety Administration (PHMSA) issued a final rule that authorized the bulk transportation of LNG by rail.
Plans on how to deliver the LNG from the plant in Wyalusing to the export terminal in Gibbstown, New Jersey have not been finalized, and could be by roadway or railway, or both. According to the Wilkes-Barre, Pennsylvania-based Citizen’s Voice:
In its assessment, PHMSA concluded that transporting LNG via roadways carries the same inherent risks as railways, but there is a higher likelihood of an accident because of the larger number of trucks needed compared to train cars.
The DOT-113 tank cars New Fortress received approval for can carry nearly 30,700 gallons of LNG — three times more than a single tanker truck. But, because train cars carry significantly more LNG and are transported together along railways, an incident “could lead to higher consequences,” according to the environmental assessment.
How much risk?
Because there is little to no precedent of transporting such high volumes of liquefied natural gas on roads or railroads, the extent of the disaster that could occur from a leak or crash is generally unknown. However, Delaware Riverkeeper has cited research warning about the unique characteristics of supercooled gas if it rapidly expands and spreads across terrain:
“….transport of LNG has unique safety hazards, exposing those along this particular rail route to unprecedented and unjustifiable risk. An LNG release boils furiously into a flammable vapor cloud 600 times larger than the storage container. An unignited ground-hugging vapor cloud can move far distances,[1] and exposure to the vapor can cause extreme freeze burns. If in an enclosed space, it asphyxiates, causing death.1 If ignited, the fire is inextinguishable; the fire is so hot that second-degree burns can occur within 30 seconds for those exposed within a mile. An LNG release can cause a Boiling Liquid Expanding Vapor Explosion.[2] The explosive force of LNG is similar to a thermobaric explosion – a catastrophically powerful bomb. The 2016 U.S. Emergency Response Guidebook advises fire chiefs initially to immediately evacuate the surrounding 1-mile area.[3] No federal field research has shown how far the vapor cloud can move chiefs initially to immediately evacuate the surrounding 1-mile area.[4] No federal field research has shown how far the vapor cloud can move…”
You can read Delaware Riverkeeper’s full statement of the organization’s opposition to the transportation of LNG in rail cars here.
Visualizing the routes
FracTracker mapped the most likely transport routes by road and by rail, along with demographic information (Figures 5 – 9). In collaboration with DRN, we also assessed minority and low-income population density along each route, using the Environmental Protection Agency (EPA)’s environmental justice (EJ) screening dataset, EJSCREEN. “Minority” as defined by the United States Census data used by EPA, refers to individuals who reported their race and ethnicity as something other than “non-Hispanic White” alone.
On average, around 21% of the population along the truck routes, and about 25% of the population along the train routes, is part of an EJ community. EJ communities are those that are disproportionately impacted by environmental hazards and with increased vulnerability to said hazards. Due to systemic racism, injustice, and poverty, EJ communities tend to have higher proportions of residents who are low-income and/or minorities.
Total Population
Minority Population
Low-Income Population
Truck Route A
612,747
123,071 (20%)
122,830 (20%)
Truck Route B
929,236
207,924 (22%)
183,420 (20%)
Rail Route A
1,649,638
477,816 (29%)
392,577 (24%)
Rail Route B
1,947,544
479,500 (25%)
411,536 (21%)
Figure 4. Demographics of Environmental Justice (EJ) communities along New Fortress Energy’s liquified natural gas (LNG) transportation routes in the eastern United States.
Click here to view this map fullscreen, in its own window.
And click through the tabs below to see static images of the various routes.
Rail Route A
Figure 5. Rail Route A passes within 2 miles of a population of 1,649,638. 29% (477,816 individuals) are minorities, and 24% (392,577 individuals) are low income, according to 2010 US Census data compiled by the Environmental Protection Agency as part of their EJSCREEN program. Map made by FracTracker Alliance and published by Delaware Riverkeeper Network.
Rail Route B
Figure 6. Rail Route B passes within 2 miles of a population of 1,947,544. 25% (479,500 individuals) are minorities, and 21% (411,536 individuals) are low income, according to 2010 US Census data compiled by the Environmental Protection Agency as part of their EJSCREEN program. Map made by FracTracker Alliance and published by Delaware Riverkeeper Network.
Rail Route A Detail
Figure 7. Detail of Rail Route A close to proposed export terminal, and showing minority population density within 2 miles of the route. Map made by FracTracker Alliance and published by Delaware Riverkeeper Network.
Rail Route B Detail
Figure 8. Detail of Rail Route B close to proposed export terminal, and showing population density within 2 miles of the route. Map made by FracTracker Alliance and published by Delaware Riverkeeper Network.
Truck Route A
Figure 9. Truck Route A passes within 2 miles of a population of 612,747. 20% (123,071 individuals) are minorities, and 20% (122,830 individuals) are low income, according to 2010 US Census data compiled by the Environmental Protection Agency as part of their EJSCREEN program. Map made by FracTracker Alliance and published by Delaware Riverkeeper Network.
Truck Route B
Figure 10. Truck Route B passes within 2 miles of a population of 929,236. 22% (207,924 individuals) are minorities, and 20% (183,420 individuals) are low income, according to 2010 US Census data compiled by the Environmental Protection Agency as part of their EJSCREEN program. Map made by FracTracker Alliance and published by Delaware Riverkeeper Network.
Truck Route A Detail
Figure 11. Detail of Truck Route A close to proposed export terminal, and showing minority population density within 2 miles of the route.
Truck Route B Detail
Figure 12. Detail of Truck Route B close to proposed export terminal, and showing minority population density within 2 miles of the route. Map made by FracTracker Alliance and published by Delaware Riverkeeper Network.
Growing municipal and regulatory opposition to transport of LNG through communities
Municipal opposition against the plan to construct the LNG facility at Wyalusing is mounting. On Wednesday, September 2, 2020, the Borough Council of Clarks Summit, Pennsylvania (Lackawanna County) voted in opposition to the New Fortress Energy LNG project. Their resolution asked the Delaware River Basin Commission to vote to disapprove Dock 2, the cargo destination of the LNG trucks and trains that will be traversing Lackawanna County with their hazardous content.
And in most recent news, on September 10, the Delaware River Basin Commission (DRBC) voted to delay approving an application to expand the port facilities at Gibbstown, NJ that would have enabled LNG tankers to dock there. In this important turn of events, the representatives from New York, Delaware and New Jersey voted for the delay, while the Pennsylvania representative abstained, and the Federal representative from the US Army Corps of Engineers voted to deny it. The vote was preceded by a comment period in which the public expressed unanimous desire to stop the project, citing impacts to human and environmental health, as well as impacts from methane on climate catastrophe.
In the upcoming months, prior to when they meet again until December, the DRBC will more deeply consider the details of the application. Until that time, forward progress on the LNG plant and the export terminal is effectively halted.
In conclusion
As communities start to consider the impacts to health and safety posed by massive fossil fuel infrastructure—whether that is pipelines, compressor stations, drilling operations, or rail and road transport—clean energy alternatives like solar, wind, and geothermal become the sensible option for all. We applaud the elected officials in Clarks Summit for their vote early this month, and look forward to more following suit.
To stay up to date on the regional pushback against LNG and engage your voice in resistance, learn more at protectnorthernpa.org or sign-up to become an E-activist with Delaware Riverkeeper Network.
Feature photo by Ted Auch, FracTracker Alliance, with aerial support by Lighthawk
[1] “Immediate ignition with liquid still on the ground could cause the spill to develop into a pool fire and present a radiant heat hazard. If there is no ignition source, the LNG will vaporize rapidly forming a cold gas cloud that is initially heavier than air, mixes with ambient air, spreads and is carried downwind.” P. 10 “Methane in vapor state can be an asphyxiant when it displaces oxygen in a confined space.” P. 11. SP 20534 Special Permit to transport LNG by rail in DOT-113C120W rail tank cars. Final Environmental Assessment. Docket No. PHMSA-2019-0100. December 5, 2019. P. 10.
[2] “LNG tank BLEVE is possible in some transportation scenarios.” Sandia National Laboratories, “LNG Use and Safety Concerns (LNG export facility, refueling stations, marine/barge/ferry/rail/truck transport)”, Tom Blanchat, Mike Hightower, Anay Luketa. November 2014. https://www.osti.gov/servlets/purl/1367739 P. 23.
https://www.fractracker.org/a5ej20sjfwe/wp-content/uploads/2020/09/Aerial-view-of-site-preparation-work-at-the-New-Fortress-LNG-plant-site.jpg11743100Karen Edelsteinhttps://www.fractracker.org/a5ej20sjfwe/wp-content/uploads/2019/10/Fractracker-Color-Logo.jpgKaren Edelstein2020-09-15 10:13:212020-09-15 10:13:21LNG development puts Wyalusing, Pennsylvania in the cross-hairs
By Emma Vieregge, FracTracker Summer 2020 Environmental and Health Fellow
Overview
Unconventional oil and natural gas development, or “fracking,” began in Pennsylvania in the early 2000s. Since then, over 12,000 unconventional wells have been drilled in the state, and over 15,000 violations have been documented at unconventional well sites. As fracking operations continue to expand, increasing numbers of residents have experienced significant health impacts and irreparable damage to their property. Southwest Pennsylvania in particular has been heavily impacted, with high concentrations of oil and gas infrastructure developed in Washington, Greene, and Fayette Counties.
Fracking operations have led to declining air quality, water and soil contamination, and drastic changes to the physical landscape including deforestation, habitat fragmentation, road construction, and damaged farmland. While the volume of scientific literature about the physical and mental health impacts of fracking is rising, few studies exist that specifically focus on residents’ perceptions of the changing physical landscape. The primary goal of this qualitative study was to identify residents’ attitudes about the changing physical landscape resulting from fracking operations. Furthermore, how have these landscape changes affected residents’ engagement with the outdoors and their overall health?
Mental health, green spaces, and a changing landscape
Many scientific studies have documented the relationship between fracking developments and mental health, and between mental health and access to green spaces and engagement with the outdoors. Peer-reviewed studies have looked at heavily fracked communities across the US, many of which focus on Pennsylvania residents. Methods typically involve one-on-one interviews, larger focus groups, surveys, or a combination of the three, to identify how living amongst oil and gas operations takes a toll on everyday life. These studies have found an increase in stress and anxiety, feelings of powerlessness against the oil and gas industry, social conflicts, sleep disturbances, and reduced life satisfaction. Additionally, residents have experienced disruptions in their sense of place and social identity. For a summary of published research about the mental health impacts from fracking, click here.
A healthy strategy many choose to cope with stress and anxiety is engagement in outdoor recreation. Having easily accessible “green spaces,” or land that is partly or completely covered with grass, trees, shrubs, or other vegetation such as parks and conservation areas have been shown to promote physical and mental health. Many scientific studies have identified significantly fewer symptoms of depression, anxiety, and stress in populations with higher levels of neighborhood green space.1 Additionally, green spaces can aid recovery from mental fatigue and community social cohesion.2 3 However, residents in Southwestern Pennsylvania may slowly see their access to green spaces and opportunities for outdoor recreation decline due to the expansion of fracking operations. Figure 1 below shows a visual representation of the interconnected relationship between fracking, access to green spaces, and negative mental health impacts.
Figure 1. The interconnected relationship between fracking operations, landscape changes and decreasing access to outdoor recreation, and negative mental health impacts.
In the last 10-15 years, fracking operations in Southwest Pennsylvania have exploded. The development of new pipelines, access roads, well pads, impoundments, and compressor stations is widespread and altering the physical landscape. Figure 2 below illustrates just one of many examples of landscape disruption caused from fracking operations.
Figure 2. Examples of changes in the physical landscape caused from fracking operations in Greene County (A) and Washington County (B), Pennsylvania. Images taken from Google Earth.
Additionally, this time-slider map (Figure 3) illustrates a larger scale view of landscape changes in Greene County, Pennsylvania in a region just east of Waynesburg.
Figure 3. Time-slider map of a region in Greene County, PA where the left portion of the map is imagery from 2005, and the right portion of the map is from 2017. Active oil and gas wells are indicated by a blue pin, and compressor stations are in green.
Study design
A qualitative study was conducted to answer the following research questions:
What are residents’ perception of the landscape changes brought about by fracking?
Have these landscape changes caused any mental health impacts?
Have changes to the physical landscape from oil and gas operations resulting in any changes in engagement with outdoor recreation?
To better understand these topics, residents living in Southwestern Pennsylvania were recruited to participate in one-on-one phone interviews, and an online survey was also distributed throughout the FracTracker Alliance network. Recruitment for the one-on-one phone interviews was accomplished through FracTracker’s social media, and email blasts through other partnering organizations such as Halt the Harm Network, People Over Petro, and the Clean Air Council. Similarly, the online survey was shared on FracTracker’s social media and also distributed through our monthly newsletter. Since this was not a randomized sample to select participants, these results should not be generalized to all residents living near oil and gas infrastructure. However, this study identifies how certain individuals have been impacted by the changing landscape brought about by fracking operations.
Eight residents completed phone interviews, all of whom resided in Washington County, PA. Residents were first asked how long they have lived in their current home, and if there was oil and gas infrastructure on or near their property. Oil and gas infrastructure was defined as well pads, compressor stations, pipelines, ponds or impoundments, or access roads. Next, residents were asked if they had any health concerns regarding fracking operations and gave personal accounts of how fracking operations have altered the physical landscape near their home and in their surrounding community. For those with agricultural land, additional questions were asked about fracking’s impact on residents’ ability to use their farmland. Lastly, residents were asked questions focused on engagement in outdoor recreation and if fracking had any impact on outdoor recreation opportunities. NVivo, a qualitative analysis software, was used identify emergent themes throughout the interviews,
In addition to the interviews, an online survey was also made available.The main purpose of the survey was to gauge where concerns about landscape changes from fracking operations fell in relation to other oil and gas impacts (i.e. air pollution, water contamination, excess noise and traffic, and soil contamination). Nine responses were recorded, and the results are discussed below. However, if you would like to add your thoughts, you can find the survey at https://www.surveymonkey.com/r/Z5DCWBD.
Main findings and emergent themes
Various emergent themes surrounding the oil and gas industry’s impact on public health and the environment were identified throughout the resident interviews. Residents shared their personal experiences and how they have been directly impacted by fracking operations, especially with reference to the changing physical landscape surrounding their homes and throughout their communities. Participants’ time of residence in Washington County ranged from 3 years to their entire life, and all participants had oil and gas infrastructure (well pad, pipelines, impoundment, access roads, or compressor station) on or next to their property.
Changes to the physical landscape and residents’ attitudes toward the altered environment
The first overarching theme was changes to the physical landscape and residents’ attitudes toward the altered environment. All interview participants expressed concerns about the changes to the physical landscape on or surrounding their property, especially regarding access roads and well pads. Although one participant mentioned that widening the township road in order to make room for fracking trucks benefited the local community, the majority of participants expressed frustration about the construction of access roads, excessive truck traffic, noise, and dust from the unpaved access roads. One individual stated, “My main concern is the dust from the road. I’m constantly breathing that in, and it’s all over my shed, on the cars, the inside of the house, the outside of the house.” Multiple participants discussed the oil and gas operations disrupting what was once peaceful farmland with beautiful scenery (see an example in Figure 4 below). Another individual stated, “And of course, the noise is just unbearable. They don’t stop…the clanging on the pipe, the blow off with the wells, pumps running, generators, trucks coming down the hill with their engine brakes on, blowing their horn every time they want another truck to move.”
Figure 4. Aerial view of oil and gas infrastructure next to a home in Scenery Hill, PA. Image courtesy of Lois Bower-Bjornson from the Clean Air Council.
Impacts to outdoor recreation activities
Impacts to outdoor recreation activities such as hunting, fishing, and hiking were another recurring theme throughout the interviews. Again, a majority of participants believed their opportunities to partake in outdoor recreation have been limited since fracking operations began in their area.
Among the top concerns was deteriorating air quality and increasing numbers of ozone action days, or days when the air quality index (AQI) for ozone reaches an unhealthy level for sensitive populations. Various participants expressed concerns about letting their children outside due to harmful air emissions and odors originating from well pads or compressor stations. Excessive truck traffic was also a safety concern that was mentioned, especially for those individuals with access roads on or neighboring their property.
Additionally, one individual noted landscape changes in areas commonly used for hiking stating, “You might be hiking along a trail and then realize that you’re no longer on the trail. You’re actually on a pipeline cut. Or you’ll get confused while you’re hiking because you’ll intersect with a road that was developed for a well pad, and it’s not on your map.” Along with hiking, participants also noted a change in hunting and fishing opportunities since fracking moved into the region. Concerns were expressed regarding harvesting any fish or wild game due to possible contamination from fracking chemicals, especially near watersheds with known chemical spills.
Going for a hike and immersing oneself in nature is a healthy way to unwind and relieve stress. However, a rising number of well pads and compressor stations are put in place near parks, hiking trails, and state game lands throughout Southwest Pennsylvania (Figure 5). Participants expressed concerns about feeling unable to escape oil and gas infrastructure, even when visiting these recreational areas. As one individual mentioned, “It really does change your experience of the outdoors. And, you know, it’s an area that’s supposed to be a protected natural area. Then you know you can’t really get away. Even there in public lands far away from buildings and roads. And you can’t really get away from it.”
Figure 5. A map of active oil and gas well pads and compressor stations in Washington County, Pennsylvania. Map layers also indicate wells pads and compressor stations within 1 mile of a park, hiking trail, ball park, or state game land.
But what are the mental health impacts that result from the changing physical landscape brought about by fracking? Aside from the physical health effects caused by fracking activity — such as respiratory illnesses from air pollution or skin irritation from contaminated well water — these landscape changes have taken a toll on participants’ mental health as well.
Sentimental value and emotional distress
Many participants described the sentimental value of their property, and the beautiful scenery surrounding their generational family farms. But after fracking began on neighboring property, witnessing their tranquil family farm suddenly become surrounded by dusty access roads, excessive truck traffic, noise, and deteriorating air quality took a serious emotional and mental toll. When asked about the impact of the changing landscape, one participant stated, “It’s the emotional part of watching her childhood farm being destroyed while she is trying to do everything she can to rebuild it to the way it used to be.”
An additional emergent theme surrounding fracking landscape changes was surrounding agricultural impacts. Participants with agricultural land were asked additional questions about fracking’s impacts on their ability to use their farmland. One individual noted that one of their fields was now unusable due to large rocks and filter fabrics left from construction of a well pad, and redirected runoff uphill of their fields. The loss of productive farmland has further contributed to the mental and emotional stress. One participant added, “Our house is ruined, our health is ruined, and our farms are ruined.” In addition to agricultural impacts on large farms, multiple participants also mentioned concerns about their smaller-scale gardens, citing uncertainty about the impacts of air pollution and soil contamination on their produce.
Feelings of powerlessness and social tension
Some participants mentioned feelings of powerlessness against the oil and gas industry. Many families were not consulted prior to fracking operations beginning adjacent to their property. In some cases, this has resulted in significant declines in property values, leaving residents with no financial means to escape oil and gas activity. It is important to note that many residents are given temporary financial incentives to allow fracking on their land. However, to some, the monetary compensation failed to make up for the toll fracking took on their physical and mental health. Lastly, some participants also mentioned feeling stress and anxiety from the social tension resulting from fracking. Debates about the restrictions and regulations on fracking have divided many communities, leading to conflicts and social tensions between once-amiable neighbors.
Survey results
In addition to the interviews, an online survey was distributed to gain more insight as to where concerns about the changing physical landscape fell in relation to other effects associated with oil and gas development (such as poor air quality, water or soil contamination, truck traffic, and noise).
Nine individuals responded to the survey, all of whom indicated having oil and gas infrastructure within five miles of their home. All respondents also indicated that they participated in a wide variety of outdoor recreation activities such as hiking, wildlife viewing/photography, camping, hunting, and fishing.
Interestedly, only five respondents stated they felt fracking had a negative impact on their health, three responded they were unsure, and one responded no. However, all participants felt fracking had a negative impact on their surrounding environment. When discussing outdoor recreation, eight of nine respondents stated they felt fracking limited their access to outdoor recreation opportunities.
Next, respondents indicated that the level of concern related to the changing landscape brought about by fracking was equal to concerns about air pollution, water and soil contamination, noise, and truck traffic (using a 5-point likert scale). Lastly, one respondent stated that they closed their outdoor recreation tourism business due to blowdown emission (the release of gas from a pipeline to the atmosphere in order to relieve pressure in the pipe so that maintenance or testing can take place) and noise from fracking operations.
Conclusion and future directions
In summary, fracking operations have deeply impacted these individuals living in Washington County, Pennsylvania. Not only do residents experience deteriorating air quality, water contamination, and physical health effects, but the mental and emotional toll of witnessing multigenerational farms become forever changed can be overbearing. Other mental health impacts included rising social tensions, feelings of powerlessness, and continuous emotional distress. Fracking operations continue to change the physical landscape, tarnishing Southwest Pennsylvania’s natural beauty and threatening access to outdoor recreation opportunities. Unfortunately, those not living in the direct path of fracking operations struggle to grasp the severity of fracking’s impact on families living with oil and gas infrastructure on or near their property. More widespread awareness of fracking’s impacts is needed to educate communities and call for stricter enforcement of regulations for the oil and gas industry. As one resident summed up their experiences,
“Engines are running full blast, shining lights, and just spewing toxins out there. And you can’t get away from it. You just can’t. You can’t drink the water. You can’t breathe the air. You can’t farm the ground. And you’re stuck here.”
Hopefully, shedding light on residents’ experiences such as these will bring policymakers to reconsider fracking regulations to minimize the impact on public health and the surrounding environment.
By Emma Vieregge, FracTracker Summer 2020 Environmental and Health Fellow
Acknowledgements
The 2020 Environmental Health Fellowship was made possible by the Community Foundation for the Alleghenies and the Heinz Endowments.
Many thanks to all participants who took the time to share their experiences with me, Lois Bower-Bjornson with the Clean Air Council, Jessa Chabeau at the Southwest Pennsylvania Environmental Health Project, and the FracTracker team for all of their feedback and expertise.
Feature image courtesy of Lois Bower-Bjornson from the Clean Air Council.
References:
1 Beyer, K., Kaltenbach, A., Szabo, A., Bogar, S., Nieto, F., & Malecki, K. (2014). Exposure to Neighborhood Green Space and Mental Health: Evidence from the Survey of the Health of Wisconsin. International Journal of Environmental Research and Public Health,11(3), 3453-3472. doi:10.3390/ijerph110303453
2 Berman, M. G., Kross, E., Krpan, K. M., Askren, M. K., Burson, A., Deldin, P. J., . . . Jonides, J. (2012). Interacting with nature improves cognition and affect for individuals with depression. Journal of Affective Disorders,140(3), 300-305. doi:10.1016/j.jad.2012.03.012
3 Maas, J., Dillen, S. M., Verheij, R. A., & Groenewegen, P. P. (2009). Social contacts as a possible mechanism behind the relation between green space and health. Health & Place,15(2), 586-595. doi:10.1016/j.healthplace.2008.09.006
https://www.fractracker.org/a5ej20sjfwe/wp-content/uploads/2020/08/Fracking-SW-PA-feature-Lois-Bower-Bjornson.jpg16673750Guest Authorhttps://www.fractracker.org/a5ej20sjfwe/wp-content/uploads/2019/10/Fractracker-Color-Logo.jpgGuest Author2020-08-20 11:07:572020-10-21 15:59:30Landscape Changes and Mental Health Impacts in Southwestern Pennsylvania Communities: A Qualitative Study
In this special one-day fundraiser event, two intrepid FracTracker teams will build and share a live virtual map as we travel throughout the Ohio River Valley Region documenting oil, gas, and its effects on our health, climate, and environment.
How many sites can we visit in one day? What will we find?
We’ll share our findings to build awareness about the plight of this region—and so many other places victimized by this rogue industry. Plus, viewers will gain a firsthand understanding of how FracTracker turns data into real-world impact.
Proceeds will benefit the ongoing work of FracTracker to decarbonize our economy and promote environmental justice.
Whether you are able to contribute financially at this time or not, we hope you’ll join us on this virtual journey. You’ll see regular video updates along the way as we share our progress, and watch as a story map is updated throughout the day.
Join our team of explorers in spirit and pledge your support! We’re excited to share this journey with you.
https://www.fractracker.org/a5ej20sjfwe/wp-content/uploads/2020/08/FracTracker-in-the-Field-promotion5.jpg45008000FracTracker Alliancehttps://www.fractracker.org/a5ej20sjfwe/wp-content/uploads/2019/10/Fractracker-Color-Logo.jpgFracTracker Alliance2020-08-14 12:44:552020-08-24 14:43:04FracTracker in the Field: Building a Live Virtual Map
A Digital Atlas Exploring the Environmental Impacts of a Decade of Unconventional Natural Gas Extraction in the Loyalsock Creek Watershed
Fig. 1. Appalachia Midstream SVC LLC , Cherry Compressor Station in Cherry, Sullivan County, PA. (FLIR camera footage by Earthworks, July 2020)
An Introduction to the Loyalsock Creek Watershed
Nestled in Pennsylvania’s scenic Endless Mountains region, the Loyalsock Creek flows 64 miles from its headwaters in Wyoming County near the Sullivan County line, to a peaceful confluence with the West Branch Susquehanna River at Montoursville, east of Williamsport in Lycoming County. The lively, clear water drains 495 square miles, journeying through thick forests of the Allegheny Plateau over a landscape prized for rugged outdoor recreation, bucolic wooded respites, and quaint villages.
Local place names reflect the Munsee-Lenape, Susquehannock, and Iroquois peoples who called the area home at the time of early colonial settlement. The name Loyalsock stems from the native word Lawi-sahquick, meaning “middle creek.”
A favorite for angling, swimming, and whitewater paddling, the waterway supports a notorious resident – the aquatic eastern hellbender, the largest salamander in North America. In 2018, the Pennsylvania Department of Conservation and Natural Resources (DCNR) crowned the Loyalsock “River of the Year,” a program honoring the state’s premier rivers and streams and encouraging their stewardship.
Fig 2. Loyalsock Watershed Overview Map. (FracTracker Alliance, July 2020)
Contents
Click on the section title to jump to that section
A Wealth of Public Lands and Recreational Opportunity
Public Lands
Nearly one third of the Loyalsock watershed consists of state-owned public lands, including the 780-acre Worlds End State Park; 37,519 acres of state game lands; and, 65,939 acres of the Loyalsock State Forest. The State Forest encompasses two Natural Areas, Tamarack Run (201 acres) and Kettle Creek Gorge (774 acres), as well as a 1935-acre portion of Kettle Creek Wild Area.
Worlds End State Park was originally purchased by the state in 1929 in an attempt to allow the area to recover from clear-cutting. The land was significantly improved due to the work of the Civilian Conservation Corps in the 1930s. There is some uncertainty about the historical name of the region, and as a result, the park was renamed Whirl’s End in 1936, but reverted to Worlds End in 1943.
The area is a deep gorge cut by water rushing over millions of years through the Loyalsock Creek, over sedimentary formations known as the Sullivan Highlands. The gorge reaches 800 feet deep in some locations, where the fossilized remnants of 350-million-year-old lungfish burrows can be found.
Current amenities include 70 tent camping sites, 19 cabins, as well as group camping options accommodating up to 90 campers. A small swimming area on Loyalsock Creek is open in the summer months, and the Creek is also used for boating and fishing.
The Tamarack Run Natural Area protects one of the few enclaves of the tamarack tree, a species of larch common in Canada, but relatively rare as far south as the Loyalsock watershed.
The Kettle Creek Gorge Natural Area follows the path of Falls Run, which as the name suggests, contains numerous majestic waterfalls, including Angel Falls, which drops around 70 feet. The Natural Area is buffered by the Kettle Creek Wild Area. Kettle Creek is a Class A Wild Trout stream, meaning that natural populations of trout are sufficient in quantity and size to support fishing activities.
Fig. 3. A view of Loyalsock Creek from the High Rock Trail in Worlds End State Park. (Brook Lenker, FracTracker Alliance, August 2019)
Fig. 4. Tubing on Loyalsock Creek. (Brook Lenker, FracTracker Alliance, August 2019)
Relaxing on the Water
The Loyalsock watershed contains 909 miles of streams, with more than 395 miles (43%) classified as high quality (358 miles) or exceptional value (37 miles). The watershed contains 10,573 acres of wetlands, including 4,844 acres of forested wetlands, 3,261 acres of riverine wetlands, 1,013 acres of freshwater ponds, 761 acres of lakes, and 694 acres of emergent wetlands.
Another popular recreation spot within the Loyalsock watershed is Rose Valley Lake, a 389-acre artificial reservoir managed by the Pennsylvania Fish and Boat Commission. The lake contains a variety of fish, including bigmouth bass, bluegill, and walleye. Boating is restricted to electric motors and unpowered craft, making the area an idyllic getaway.
Trails
There are 238 miles of trails in the watershed, accommodating a variety of uses, including hiking, biking, horseback riding, cross-country skiing, and snowmobiles. Some notable examples include:
over 90 miles of snowmobile trails in the Loyalsock State Forest and Worlds End State Park;
most of the 64-mile-long Loyalsock Trail, showcasing numerous waterfalls;
the Double Run Ski Trail, providing cross-country opportunities in the Loyalsock State Forest;
and the 19-mile Loyalsock State Forest Bridle Trail for equestrian pursuits.
The Loyalsock Watershed also contains the entirety of state Game Lands #134 and #298, as well as parts of six others, including Game Lands #12, #13, #36, #57, #66, and #133. Not only hunting locations, these tracts preserve habitat for importantbird and mammal species, provide opportunities forbirding, and offer a variety of outdooreducation resources.
Commercial Opportunities
There are also privately-owned recreational opportunities in the region. A portion of the historicEagles Mere Country Club has provided golf and other activities for over 100 years. Eagles Mere Lake, just south of the watershed boundary,provides recreation opportunities for members of the privately-held Eagles Mere Association. At the south of the lake is the regionally-famous Eagles MereTobaggan Slide, where riders race down a specialized track at speeds up to 45 miles per hour, when winters are cold enough for sufficient ice conditions – a fleeting situation due to climate change.
A few miles to the east of Eagles Mere lies a cluster of lakes that surround the borough of Laporte, in Sullivan County. The largest of these lakes is Lake Mokoma, administered by the Lake Mokoma Association. Participation in the Association is limited to those who own residences or vacation homes in Sullivan County.
Fig. 5. Hiking trail in the Loyalsock State Forest. (FracTracker Alliance, July, 2020)
Fig. 6. An interactive map of recreation opportunities in the Loyalsock Watershed. (FracTracker Alliance, July 2020)
Note: Wetland data presented are from the National Wetlands Inventory (NWI), which is a geographically comprehensive dataset compiled by the US Fish and Wildlife Service from aerial photographs, but not a complete or accurate depiction of regulated wetlands for site-specific purposes. A relatively newer wetland mapping dataset for Pennsylvania appears to identify more areas of potential wetlands than NWI. Nevertheless, the NWI and other available map sources generally underestimate actual wetland coverage in Pennsylvania. Accurate wetland mapping requires the application of technical criteria in the field to identify the site-specific vegetation, soil, and hydrology indicators that define regulated wetlands (25 Pa. Code 105.451).
Stream data presented are from the Pennsylvania DEP Designated Use listing (25 Pa. Code 93.9), which is based on the National Hydrography Dataset. Some streams have updated designations of their existing water uses as depicted on other DEP datasets. Available electronic datasets and topographic maps do not display all permanent or intermittent streams included as Regulated Waters of the Commonwealth (25 Pa. Code 105.1). It is possible to map additional streams with the help of existing photo-based digital elevation models, although use of that technique was beyond the scope of this informational project. Such streams would add significantly to the total mileage, but they have not yet been acknowledged by the Pennsylvania DEP, and therefore are not included in the DEP’s inventories of high quality, exceptional value, or other streams.
The datasets used in this map collection can be found by following the links in the Details section of each map, found near the top-left corner of the page.
Fracking comes to the Loyalsock
Figures 7-9. Aerial imagery of unconventional oil and gas infrastructure in the Loyalsock State Forest. (Ted Auch, FracTracker Alliance, with aerial assistance from Lighthawk. June, 2020)
On November 17, 2009, Inflection Energy began drilling the Ultimate Warrior I well in Upper Fairfield Township, Lycoming County. In quick succession came Pennsylvania General Energy, Chesapeake Appalachia, Chief Oil & Gas, Anadarko E&P, Alta Resources (ARD), and Southwestern Production (SWN), all of which drilled a well by the end of 2010. It was a veritable invasion on the watershed, one that ushered in a dramatic change from a mostly agrarian landscape, to one with heavy industrial presence.
Residents have to deal with constant construction of well pads, pipelines, compressor stations, and staging grounds. Since each drilled well requires thousands of truck trips, enormous traffic jams are common, with each idling engine spewing diesel exhaust into the once clean air. The noise of drilling and fracking continues into the night, and bright flaring of gasses at wells and other facilities disrupts sleep schedules, and may contribute to serious health issues as well.
Fig. 10. An interactive map of the impacts of the unconventional oil and gas industry to the Loyalsock Creek Watershed. Note: Pipelines may be only partially depicted due to data limitations. (FracTracker Alliance, 2020)
Fracking is a nuisance and a risk in the best of times, but the Marcellus boom in the Loyalsock watershed has been notably problematic. The most frequent violations in the watershed are casing and cementing infractions, for which the “operator conducted casing and cementing activities that failed to prevent migration of gas or other fluids into sources of fresh groundwater.” This particular violation has been reported 47 times in the watershed, although there are dozens of additional casing and cementing issues that are similarly worded (see appendix). Erosion and sediment violations have also been commonplace, and these can have significant impacts on stream system health.
Improperly contained waste pits have leached toxic waste into the ground. A truck with drilling mud containing 103,000 milligrams per liter of chlorides – about five times more than ocean water – was driving down the road with an open valve, spewing fluids over a wide area. Some spills sent plumes of pollution directly into streams.
Fig. 11. Diesel truck traffic carrying fracking equipment in the Loyalsock watershed. (FracTracker Alliance, June, 2020)
Fig. 12. Diesel exhaust spewing from fracking equipment. (Barb Jarmoska)
Fig. 13. Fracking is a heavily industrial activity. Many of these sites in the Loyalsock Creek watershed are immediately adjacent to homes. (Barb Jarmoska)
Fig. 14. Open pits used to be permitted for temporary storage of oil and gas waste. Here, the liner is not properly covering the bottom-right corner, sludge is piled up past the liner in the top-right corner, and temporary fencing is failing in numerous locations. (Barb Jarmoska)
In short, it has been a mess. Altogether, there have been 631 violations issued for 317 unconventional wells drilled in the Loyalsock, an average of two violations per well.
The Pennsylvania Department of Environmental Protection (DEP) issues violations on pipelines as well, but we are unable to match pipeline violations to a specific location, so there is no way to know which ones occurred in the Loyalsock watershed.
We also know that pipeline construction is a process filled with mishaps. Specifically, there is a technique for drilling a pipeline segment underneath existing obstacles – such as streams and roads – known as horizontal directional drilling (HDD). These HDD sites frequently bleed large quantities of drilling mud into the ground or surface water. When these leaks surface, these spills are known euphemistically as “inadvertent returns.” Sometimes, the same phenomenon occurs but the fluid drains instead to an underground cavity, referred to as “loss of circulation.” We do not have data on either category for pipelines in the Loyalsock watershed. However, the DEP has published inadvertent returns for the Mariner East II route to the south, and when combining spills impacting the water and ground, these occur at a rate of about two spills for every three miles of installed pipe. Many of these releases are measured in thousands of gallons.
Unfortunately, drilling and all related activity continue in the Loyalsock Creek watershed. As the industry has proven incapable of conducting these activities in an unsullied manner that is protective of the environment and the health of nearby residents, we can expect the litany of errors to continue to grow.
A Brief Timeline of Infractions
In 2016, a major incident was reported to the Pipeline and Hazardous Materials Safety Administration (PHMSA), a federal agency under the Department of Transportation (DOT). On October 21, a Sunoco pipeline ruptured, spilling 55,000 gallons of gasoline into Wallis Run, a tributary of Loyalsock Creek. The eight-inch pipeline burst when high winds and heavy floods triggered mudslides, sweeping away at least two homes and leaving flooded roads impassable. Water suppliers and national and state agencies advised locals to conserve water, and the DEP and water supplier American Water shut down intake valves until they had measured contamination levels in three water supplies serving thousands of people downstream, including populations in Lewisburg, Milton, and Gamble Township.
Limited access to the area delayed identifying the source of the rupture, though Sunoco shut off the pipeline that runs from Reading to Buffalo, NY. When waters receded, Sunoco officials replaced the broken pipe, which they said was broken by debris from a washed out bridge ten feet upstream. The pipeline was buried five feet below the creek, but heavy rains exposed it.
Agency authorities later found that heavy rains had flushed out much of the pollution, though they recorded the highest levels in the Loyalsock Creek. While this is obviously a weather-related event, local residents questioned the placement of a hazardous liquids pipeline crossing at such a volatile location, noting that the same pipeline had been exposed, (although not breached), just five years earlier.
Sunoco tops the list of U.S. crude oil spills. Sunoco and their subsidiaries reported 527 hazardous liquids pipeline incidents between 2002 and 2017, incidents that released over 87,000 barrels of hazardous liquids, according to Greenpeace USA and Waterkeeper Alliances’ 2018 report on Energy Transfer Partners (ETP) & Sunoco’s History of Pipeline Spills. Sunoco and its subsidiary ETP are developing the Dakota Access Pipeline, the Mariner East pipeline, and the Permian Express pipeline, sites that have already seen construction errors causing leaks and spills.
The area suffered another heavy spill in 2017, when a well operated by Colorado-based Inflection Energy leaked over 63,000 gallons of natural gas drilling waste into a Loyalsock Creek tributary. The spill occurred when waste was being transferred from one container to another, a neglect of the contracted worker who had fallen asleep. DEP spokesman Neil Shader said the waste – called “flowback” – was filtered and treated, but this brine can contain chemicals, metals, salts, and other inorganic materials that can pollute soil and groundwater. Carol Parenzan, at the time serving as Middle Susquehanna’s Riverkeeper, said many residents are supplied by well water, and were not alerted of the spill until a local began investigating and calling local and state authorities.
Fig. 16. At the Chesapeake Appalachia LLC Manning Well Site and Lambert Farms Well Site, the emissions sources appear to be engines or combustion devices. (FLIR camera footage by Earthworks, July 2020)
One of Earthworks’ trained and certified thermographers visited the Loyalsock watershed and surrounding area in mid-July with a FLIR optical gas imaging (OGI) camera. This industry standard tool can make visible pollutants that are typically invisible to the human eye, but that still pose significant risks to health and the environment–including 20 volatile organic compounds, such as the carcinogens benzene and toluene, and methane, a greenhouse gas 86 times more potent than carbon dioxide.
Water is the lifeblood of the Loyalsock watershed, as it is in any basin. However, in the Loyalsock, water is of particular importance. As we have seen, recreation opportunities in the area are defined by water, including fantastic fishing streams and lakes, meandering trails passing many waterfalls, various boating sites, and inviting swimming holes. For one reason or others, most visitors come to the Loyalsock to enjoy these natural aquatic locations.
Perhaps the most important water assets are underground aquifers. The majority of the watershed is rural, and private wells for potable household water are typical. Even the municipal water supply for the Borough of Montoursville is fed by groundwater, including five wells and an artesian spring.
Contamination
For a region so dependent on surface water for tourism, commercial activities, and groundwater for drinking supplies, the arrival of fracking is a significant concern. Unfortunately, spills and other violations are common at well pads and related infrastructure, with over 631 violations in the watershed since 2010.
Even pipelines that are not yet operational can have impacts on the waterways in the Loyalsock Creek watershed. In September 2012, for example, a “significant amount” of sediment and mud spilled into the Loyalsock Creek during the construction of Central New York Oil and Gas’ Marc I pipeline project. Such incidents introduce silt and clay into waterways, fine sediments that have the potential to deplete aquatic fauna. These types of episodes have received considerably more attention since this event, and it turns out that they are quite common during pipeline construction. For example, the Mariner East pipeline has had hundreds of these so-called inadvertent returns, many of which directly affected the waters of the Commonwealth.
Fig. 17.Trucks withdrawing water for drilling-related activities at the Forksville Heritage Freshwater Station, operated by Chief Oil & Gas. Photo from FracTracker mobile app report.
Fig. 18.The average amount of water used per well in the Loyalsock Watershed has increased over time. In recent years, several wells exceeded 30 million gallons (FracTracker Alliance, 2020).
In addition to contamination concerns, unconventional oil and gas wells are extremely thirsty operations. FracTracker has analyzed wells in the watershed using the industry’s chemical registry site FracFocus. Of the 274 wells in the watershed reporting to FracFocus between January 2011 and April 2020, 38 did not include a value for total water usage. These wells were all fracked on or before September 13, 2012, when the registry was still in its early phase and its use was not well standardized. Two wells fracked in 2018 by Pennsylvania General Energy had very low water consumption figures, with one reporting 2,100 gallons, and the other reporting 6,636 gallons. These two reports appear to be erroneous, and so these wells were removed from our analysis.
Of the remaining 234 wells in the data repository, one reported using less than one million gallons, although it came close, with 925,606 gallons. Another 63 wells used between one and five million gallons, 137 wells used between five and ten million gallons, 25 wells used between ten and 20 million gallons, and eight used more than 20 million gallons. The average consumption was 7,739,542 gallons, while the maximum value was for Alta Resources’ Alden Evans A 2H well, which used 34,024,513 gallons of water.
The well’s operator has a tremendous impact on the total amount of water usage reported on FracFocus in the Loyalsock watershed.
However, it is worth noting that time factors into this analysis. None of the three companies averaging less than five million gallons of water per well – including Anadarko, Atlas, and Southwestern – have records after 2014, and water consumption has increased dramatically since then. Still, Alta’s average of nearly 24.7 million gallons per well stands out, with more than twice the amount of water consumed per well, compared to the next highest user.
Altogether, the wells on the FracFocus registry in the Loyalsock watershed consumed over 1.8 billion gallons of water, enough water to supply nearly 36,000 households for a year, assuming an average of 138 gallons per household, per day. This is a real need in the United States, as a 2019 report by DigDeep and US Water Alliance estimated that there were two million people in the U.S. without running water in their homes.
Operator
Average Gallons per Well
Alta Resources
24,658,871
Anadarko Petroleum Corporation
3,320,469
Atlas Energy, L.P.
4,926,427
Chesapeake Operating, Inc.
6,572,047
Chief Oil & Gas
8,537,475
Inflection Energy (PA) LLC
7,716,069
Pennsylvania General Energy
11,680,249
Seneca Resources Corporation
8,410,013
Southwestern Energy
2,355,864
Fig. 19.Total amount of water usage reported by oil and gas operators in the Loyalsock watershed. (FracFocus, 2020)
Fig. 20. An interactive map of oil and gas related water sites in the Loyalsock Creek Watershed. (FracTracker Alliance, 2020)
Between January 2011 and April 2020, two conventional wells and 297 unconventional wells combined to produce 7,017,102 barrels (294.7 million gallons) of liquid waste, and 340,856 tons (681.7 million pounds) of solid waste.
Fig. 21. Liquid oil and gas waste produced in the Loyalsock Creek watershed, in barrels. Note that 2020 includes data from January to April only. (FracTracker Alliance, July 2020)
Fig. 22. Solid oil and gas waste produced in the Loyalsock Creek watershed, in tons. Note that 2020 includes data from January to April only. (FracTracker Alliance, July, 2020)
This averages out to 23,469 barrels (985,680 gallons) and 1,140 tons (2,279,973 pounds) per well drilled in the basin, and most of these wells are active and continue to produce waste. Many of these wells have generated waste quantities in great excess of these averages.
Unlike gas production, which tends to drop off precipitously after the first year, liquid waste production remains at an elevated level for years. For example, the Brooks Family A-201H well, the well reporting the largest quantity of liquid waste in the basin, produced 1,499 barrels in 2017, 28,847 barrels in 2018, 35,143 barrels in 2019, and 23,829 barrels in the first four months of 2020. The volumes from this well increase substantially each year.
For all wells in the watershed reporting liquid waste between 2018 and 2019, waste totals decreased by almost 42%. While a significant decrease, these 237 wells still generated 829,267 barrels (34.8 million gallons) of waste in 2019, and some have been generating waste since at least 2011. Wells will continue to produce waste until they are permanently plugged, but unfortunately, there are plans for more drilling in the watershed. There are 17 active status wells that have been permitted and not yet drilled. Important to remember is that fracking waste is often radioactive, and laden with salt, chemicals, and other contaminants, making it a hazardous product to transport, treat, or dispose.
Fig. 23. Cumulative liquid waste totals produced by oil and gas wells in Loyalsock Creek watershed between January 2011 and April 2020. (FracTracker Alliance, July, 2020)
Fig. 24. An interactive map of oil and gas waste generated in the Loyalsock Creek Watershed between January 2011 and May 2020. (FracTracker Alliance, July, 2020)
On a sunny Friday in June 2020, a group of 18 FracTracker staff members and volunteers gathered in the Loyalsock watershed to document activities and infrastructure related to unconventional oil and gas activities. FracTracker’s Matt Kelso used a variety of data from the DEP to prepare maps depicting an array of infrastructure, including 317 drilled wells on 110 different pads, five compressor stations, a compressed natural gas truck terminal, and 24 water facilities related to oil and gas extraction – including five surface water withdrawal sites and 19 storage reservoirs. He then divided an area of about 496 square miles into five sections, and at least two participants were assigned to explore each section.
Using the FracTracker mobile app, cameras, and other documentation tools, the group was able to verify the location of 91 infrastructure sites, including well pads, compressor stations, pipelines, water withdrawal sites and reservoirs, as well as significant truck traffic. As they made their way over the rural back roads, many participants were struck by the juxtaposition of a breathtaking landscape and peaceful farmlands with imposing, polluting fracking sites.
The day was also documented by Rachel McDevitt from StateImpact Pennsylvania, a reporting project of NPR member stations, as well as the filmmakers Justin Grubb, Alex Goatz, and Michael Clark from Running Wild Media.
With the geolocated photos and site descriptions documented on this day, FracTracker was able to compile this story atlas to serve as an educational tool for concerned residents of the Loyalsock.
You can find these reports and many more by downloading the FracTracker app on your iOS or Android device, or by going to the web app at https://app.fractracker.org/.
Fig. 25. FracTracker’s Executive Director Brook Lenker addresses the gathering of volunteers, media members, and FracTracker staff at Canfield Island Heritage Trail Park on documentation day. (FracTracker Alliance, June, 2020)
Fig. 26 FracTracker’s Matt Kelso explains the maps he made of different sections in the Loyalsock Watershed. (FracTracker Alliance, June, 2020)
Fig. 27 Running Wild Media’s filmmaker captures the introduction to the documentation day by FracTracker staff. These filmmakers tagged along for additions to a film about the eastern hellbender, to be released in spring 2021. (FracTracker Alliance, June, 2020)
Fig. 28. A compressor station is seen across a field of wildflowers, somewhere in the Loyalsock Watershed. (FracTracker Alliance, June, 2020)
Fig. 29. Volunteers stand outside gated infrastructure in the watershed on the documentation field day. (FracTracker Alliance, June, 2020)
Fig. 30. A pipeline path cutting through forest in the Loyalsock watershed. (FracTracker Alliance, June, 2020)
Fig. 31. Grass has grown to cover a pipeline path traversing a hillside in the Loyalsock. (FracTracker Alliance, June, 2020)