Tag Archive for: Utica

The Ohio Utica Shale Play Turns 500… Almost!
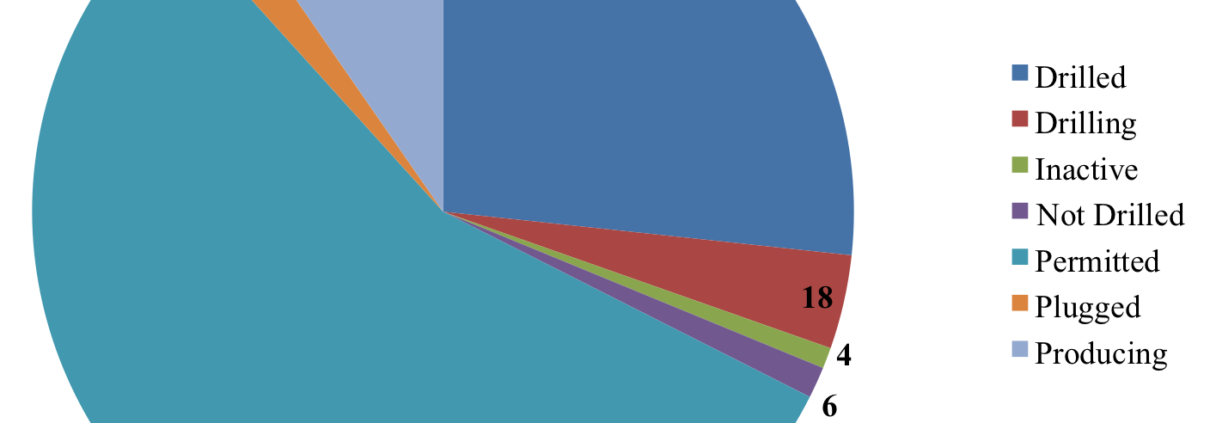
Drilling Trends

Ohio’s first Utica well was permitted by ODNR on behalf of Hess Ohio Resources on 9-28-10. As shown in Figure 1 (right), the major uptick in well permitting began in the summer of 2011 with 23 wells permitted during that period, ramping up to 24 wells in November 2011. There was a brief reduction in permitting during the winter of 2011-12, followed by the boom-boom summer and fall of 2012, with an average of 37 wells per month and a total of 261 wells permitted between June and December 2012.

Production

As of the end of 2012, only 30.4% of the 487 permitted wells had been drilled or are currently being drilled. Forty-seven are currently producing gas, with the Ohio Department of Natural Resources (ODNR) reporting production data for only 9 of the 47 producing wells. All of these wells are owned by Chesapeake, 2/3 of which are in Carroll County. On average, these wells produced 61 barrels of oil, 1,875 million cubic feet of gas, and 8,905 gallons (i.e. 37 tons) of brine per day over an average production period of 88 days. Twenty of the permitted wells are classified as inactive (not drilled) or plugged, with the remaining permitted but yet to be drilled (Figure 2). The top five Utica counties based on number of well permits are Carroll, Harrison, Columbiana [1], Jefferson, and Guernsey [2]; while on the other end, Ashland, Geauga, Medina, and Wayne are each home to one Utica well at this point (Figure 3). According to Columbus, OH-based Huntington Bank’s first Midwest Economic Index, early returns in these parts are mixed in Ohio: “58 percent of respondents agreed that the industry would bring opportunity, with 15 percent of those saying it would be a significant opportunity, while 42 percent said they did not see it bringing economic opportunity to their communities.”

Bird’s Eye View

From an area perspective, Carroll County has 0.45 wells per square mile – 0.39 more wells per square mile than the next ten counties with the most wells (Figure 4) – while the bottom four counties currently contain 0.0023 wells per square mile. The relationship between population and wells is generally the opposite of the previous two relationships with the bottom four counties having an average of 108,345 citizens for every well drilled. Carroll County has 163 residents per well, while the remaining top ten counties have an average resident-to-well ratio of 7,057 (Figure 4, Inset). This means that any potential ad valorem-based tax structure would benefit – on a per capita basis – less populated counties rather than those with more wells such as Carroll.

Companies Involved

Chesapeake and its subsidiaries is the dominant player in the Ohio Utica play, with 320 of all wells permitted, followed by Gulfport Energy with 25, Enervest and HG Energy with 16, and Hess Ohio with 14 permitted wells. These five firms account for 80.3% of all permitted wells in Ohio, with an additional eighteen firms splitting the remaining 19.7% (Table 1, below). However, the firms that are publicly traded have been experiencing an average decline in share price of 3.41% since the time their first wells were permitted to the close of business on January 22nd, 2013. The biggest financial losers have been some of the Ohio Utica play’s biggest participants – including Chesapeake (CHK, -27%), Consol Energy (CNX, -29%), and Devon (DVN, -17%) [3]. Meanwhile, Anadarko (APC, +14%), Gulfport (GPOR, +19%)), and the upstart PDC Energy (PDCE, +55%) are the biggest beneficiaries of wading into Ohio’s Utica Shale play. However, the industry is displaying quite a few characteristics of an unsustainable boom; Wall Street analysts have been skeptical of big Utica Shale energy operations from soup to nuts as reported by Reuters last fall. but Wall Street voted in favor of the removal – either voluntary or forced – of CHK’s founder Aubrey McLendon to the tune of a 10% share spike the day of the announcement. Even the aforementioned winners have been outperformed by the S&P 500 and Dow Jones Industrial by 12.6% since permitting began in September 2010.

Will the boom continue to boom? It may be too soon to tell, but one thing is for sure, shale gas extraction to-date has made an indelible mark on many communities in eastern Ohio.

Figure 1. Ohio Utica Well Development per Month & Cumulatively as of January 1, 2013

Figure 1. Ohio Utica Well Development per Month & Cumulatively as of January 1, 2013. Click on the image to view full-screen.

Figure 2. Ohio Utica Well Status as of January 1, 2013.

Figure 2. Ohio Utica Well Status as of January 1, 2013. Click on the image to view full-screen.

Figure 3. Ohio Utica Wells by County as of January 1, 2013

Figure 3. Ohio Utica Wells by County as of January 1, 2013. Click on the image to view full-screen.

Figure 4. Ohio Utica Wells Per Square Mile by County and People Per Well by County as of January 1, 2013.

Figure 4. Ohio Utica Wells Per Square Mile by County and People Per Well by County as of January 1, 2013. Click on the image to view full-screen.


[1] Thanks to the surge in Columbiana County wells, the Texas-based Santrol will be opening a frac sand terminal with direct access to Ohio State Route 11 open 365 days a year and equipped to handle 500,000 tons annually.

[2] Guernsey and Noble are home to the Muskingum Watershed Conservancy District that is currently in negotiations with Antero to drill beneath Seneca Lake – even though there is a substantial and vocal opposition in the region in the form of the Southeast Ohio Alliance to Save Our Water.


Table 1. Distribution of Ohio Utica Shale wells across companies (#, %), Date of First Permit (DFP), and the valuation of the publicly funded companies at their DFP at the close of business 1/22/2013.


Company Valuation

Company

#

%

DFP

Share Price DFP

Share Price 1/22/2013

% Change

Anadarko

12

0.025

09/07/2011

69.88

79.49

1.138

Antero

11

0.023

03/23/2012

Atlas Noble

5

0.010

09/24/2012

31.14

30.315

0.974

Carrizo

2

0.004

07/26/2012

24.02

22.43

0.934

Chesapeake Energy

320

0.657

12/23/2010

25.61

18.73

0.731

Chevron Appalachia

2

0.004

07/31/2012

109.58

115.91

1.058

Consol Energy

19

0.039

06/17/2011

45.86

32.74

0.714

Devon Energy

13

0.027

11/02/2011

65.46

54.28

0.829

Eclipse Resources

1

0.002

12/21/2012

Enervest

16

0.033

06/30/2011

9.37

9.37

1.000

EQT

1

0.002

09/13/2012

57.76

60.43

1.046

Gulfport Energy

25

0.051

02/28/2012

35.49

42.3

1.192

Halcon

1

0.002

11/02/2012

5.003

5.815

1.162

Hall Drilling

1

0.002

09/17/2012

Hess Ohio

14

0.029

09/28/2010

53.63

58.87

1.098

HG Energy

16

0.033

09/14/2011

Hilcorp Energy

1

0.002

12/14/2012

Mountaineer Keystone

7

0.014

07/13/2012

PDC Energy

4

0.008

05/25/2012

25.67

39.8

1.550

R E Gas Development

8

0.016

03/19/2012

Sierra Resources

3

0.006

07/02/2012

SWEPI

1

0.002

06/20/2012

XTO Energy

4

0.008

04/09/2012

0.28

0.027

0.096

 Sum

487

       Average

0.966

DFP = Date of First Permit; “—“ not a publicly funded company.


Ohio’s Waste Not, Want Not!

By Ted Auch, PhD – Ohio Program Coordinator, FracTracker Alliance

The Akron Beacon Journal’s Bob Downing has just published an investigative report looking at the recent advisory put forth by the Ohio Environmental Protection Agency’s (OEPA) Division of Materials and Waste Management – along with the Ohio Department of Natural Resources (ODNR) Division of Oil and Gas Resources Management and the Ohio Department of Health (OHD) [1] Bureau of Radiation Protection – to all of Ohio’s municipal solid waste landfills. The advisory suggests that the landfills statewide – including 17 industrial residual waste, 40 municipal solid waste, 36 orphaned landfill facilities along with 64 transfer stations – should prepare to start receiving solid Utica and Marcellus shale drilling waste, “including drill cuttings, drilling muds, and frac sands,” (especially since Pennsylvania seems to be cracking down on some of its traditional drilling waste disposal practices). This new waste stream is in addition to the millions of barrels of potentially radioactive liquid waste already being trucked in from PA and WV [2] for deep well injection – and potentially shipped into Washington County, OH along the Ohio River [3]. This advisory is concerning because the same regulatory bodies have been conveying to other media outlets (e.g. The Columbus Dispatch) that such activities are strictly prohibited and that injection of Technologically Enhanced Naturally Occurring Radioactive Materials (TENORM) is “almost the perfect solution” compared to to landfill disposal.

If the advisory is correct, however, there are complications associated with using this disposal method relative to the waste’s viscosity, elevated levels of Total Dissolved Solids (TDSs), and/or concentrations of TENORM. Materials deemed suitable for municipal landfills must not exceed five picocuries per gram radium above background levels; however, early returns speak to the potential for shale wastewater to be:

… 3,609 times more radioactive than a federal safety limit for drinking water…[or] 300 times higher than a Nuclear Regulatory commission limit for industrial discharges to water. Learn more

Additionally, Marcellus brine may have salinity and radium levels three times that of traditional sandstone/limestone oil and gas wells of the Cambrian-Mississippian age. To put this Marcellus data in perspective, the range was 0-18 picocuries per gram with a median value of 2.46 picocuries per gram. Issues associated with brine disposal, however, are not new here in Ohio where researchers like The Ohio State University’s Wayne Pettyjohn reported excessive levels of freshwater chloride (35-320,000 mg/l) pollution in Morrow, Delaware, and Medina counties. These results prompted Pettyjohn to write “ground-water resources may be seriously and perhaps irreparably contaminated long before landowners are even aware that a problem exists” (Pettyjohn, 1971).

The solution proposed by the authors of this advisory is to use the US EPA’s “paint-filter test” bringing materials into compliance with Code of Federal Regulation (CFR) 264.313 and 265.313, which basically ended the practice of disposing of “liquid waste or waste containing free liquids” in 1985. The EPA’s Paint Filter Liquids Test (Method 9095B) is summarized as follows:

Material is placed in a paint filter [Mesh number 60 +/- 5% (fine meshed size)] [4]. If any portion of the material passes through and drops from the filter … the material is deemed to contain free liquids.

Figure 1. Ohio’s Registered Non-Hazardous & Hazardous Waste Landfills

Figure 1. Ohio’s Registered Non-Hazardous & Hazardous Waste Landfills

This advisory is likely due to the backlash associated with injection well incidents, including the Youngstown earthquakes attributed by some scientists to the lubrication effect that injected materials have on geologic faults. Additionally, rural communities – and researchers – in Ohio’s Utica Shale basin are beginning to raise questions around the practice of spreading shale gas brine on roads as a substitute for salt in the winter and approved disposal method during the summer. Concerns revolve around elevated levels of chlorides in excess of 2-5 times EPA public drinking-water standards (Bair and Digel, 1990). Unfortunately, the OEPA advisory is ambiguous about post-disposal monitoring, suggesting only that:

… the landfill may need to perform monitoring of landfill systems, such as those related to leachate collection, to determine potential impacts to human health or the environment associated with these [TENORM] waste streams.

This inclusion of the word may rather than must further alienates communities already skeptical about the ability or will of ODNR – and now OEPA and ODH – to regulate and/or ensure adequate monitoring of unconventional natural gas drilling activities. If this advisory is any indication related activities will be spreading beyond the Utica Basin to the state’s 21 hazardous and 121 non-hazardous waste facilities (Figure 1), with specific focus on the 57 industrial residual and municipal solid waste facilities throughout the state (Figure 2 below). Such a regulatory development has serious ramifications for PA’s 40+ municipal waste landfills, 5 construction/demolition waste landfills, 3 residual waste landfills, and 6 resource recover/waste to energy facilities (see full PA stats) and the nation’s 1,908 Municipal Solid Waste (MSW) landfills as reported in BioCycle (2010).

As drilling intensifies in the Utica Shale, nearby states may be further burdened by the mounting waste stream. Communities once thought to be disconnected from hydraulic fracturing will be forced to debate the merits of allowing such waste in their communities, similar to the situation facing non-Utica Shale cities in Ohio. Such a discussion will be unavoidable given that 84% of the state’s waste treatment facilities are located outside what could liberally be referred to as the Ohio Shale play (Figure 2 Inset).

Figure 2. Ohio’s Registered Non-Hazardous Waste Facilities by Type (% of the state’s 121 facilities)

Figure 2. Ohio’s Registered Non-Hazardous Waste Facilities by Type (% of the state’s 121 facilities)


[1] The ODH co-signed the OEPA advisory even though its own radiation-protection chief Michael Snee told The Columbus Dispatch that “wastes trucked to landfills pose a bigger threat to groundwater” relative to injection wells only days prior to the OEPA advisories release last September.
[2] 53% of the 12.2 million barrels of brine injected into Ohio’s 160 injection wells came from these neighboring states (PA and WV).
[3] The company proposing the Washington County landfill in New Matamoras is confident that the shipping of shale gas drilling waste is safe because “barges ship hydrochloric acid,” as their VP of Appalachian business development told The Columbus Dispatch.
[4] Mesh number 60 is in the lower third of the US Sieve size distribution with an opening of 0.250 mm or 0.0098 in, with the smallest sieve size being No. 400 at 0.037 mm. or 0.0015 in. Learn more>

Lakes in Appalachian Ohio’s Utica Play: A Snapshot

By Ted Auch, PhD – Ohio Program Coordinator, FracTracker Alliance

Ohio’s southwest Appalachian counties – namely Carroll, Harrison, Guernsey, and Noble Counties – are home to two significant resources:

  1. the state’s Utica Shale Triple Play – defined as the extraction of “natural gas and natural gas liquids…from the Marcellus Shale…Upper Devonian Shale…and the Utica Shale about 1,000 to 2,000 feet below the Marcellus” (Range Resources CEO, John Pinkerton); and
  2. many of the state’s premier lakes, including Atwood in Carroll and Tuscarawas and Senacaville in Noble and Guernsey counties (Figure 1).

Senacaville and Atwood Lakes provide countless ecological and economic benefits (a.k.a., Ecosystem Services) at a regional, state, and local level contributing substantially to the state’s $3.6 billion wildlife tourism economy – a number that is increasing by 2% per year according to the US Fish & Wildlife Service’s Wildlife & Sport Fish Restoration Program (WSFR). Needless to say, the unconventional natural gas industry, which uses approximately 5 million gallons of fresh water per drilled well, relies heavily on Ohio’s lakes, wetlands, and to a lesser degree vernal pools – all of which are concentrated in the Utica Shale sweet spot counties on the Pennsylvania and West Virginia borders. These same counties are home to nearly all the state’s 440+ Utica Wells and more than half its 160+ injection wells (used for waste fluid disposal) (Figure 2).

Recently – for these and other environmental reasons – many in the area have grown concerned that Appalachian Ohio’s entire lake network is at risk due to current and proposed hydraulic fracturing and injection wells. In an attempt to assess these risks, we analyzed the proximity of current Utica drilled wells and Class II/III [1] wells to these two lakes specifically and to the state’s inland perennial water bodies. Atwood Lake is the lake with the most wells – either injection or fracturing – within a five-mile radius with 19 total (Figures 3 and 4). Meanwhile, M.J. Kirwan Reservoir, Guilford, and Senacaville Lakes each have 12 wells within a five-mile radius. The Cuyahoga River, Lake Mohawk, Tappan Lake, and Berlin Lake are the remaining water bodies currently within five miles of 10 or more wells. Four of these 19 wells are within two miles of Atwood and Guilford Lake’s shores. In the case of Tappan and Berlin Lakes, 3 wells sit within two miles (Figure 4). Interestingly Tappan Lake’s integrity from a water quality perspective has come under pressure thanks to the Chesapeake Energy Dodson well according to Charles Fisher, administrator of the Harrison County Health Department and organic farmer John M. Luber as “a stream…that empties into Tappan Lake becomes discolored during periods of rainfall or melting snow…the pollution did not happen until drilling operations began.”

In researching previous natural resource activities in the Utica Shale Basin, we found that in addition to the many shale and injection wells in the vicinity of these lakes, most are surrounded or sit atop abandoned, underground coal mines (AUCM). One example is Senacaville Lake, where Seneca Coal’s Klondyke, Rigby, and Walholding AUCMs are within feet of the lake’s western shore. In addition, Akron Coal, James W. Ellsworth, and Cambridge Collieries’ AUCMs just to the west of Senecaville Lake lie directly beneath two Utica and two Class III wells, bringing into question the reported discrete nature of these types of extraction procedures with respect to their proximity to primary freshwater sources. The same is true for Atwood Lake, with six AUCMs less than a mile of its eastern extent – previously owned by the Ohio Central Mining Co., Burns Coal Co., White Barr Coal Co., Marshall Harvey, etc. (Figure 5).

The possibility for the disruption of regular inputs/outputs of these lakes’ hydrological cycles – specifically from a water quality or quantity perspective – is growing. This is the case because the interconnectivity (Setbacks Press Release V 3) between Utica and injection wells is increasing and due to the fact that many AUCM exist in the very areas where hydraulic fracturing is currently being conducted or has been proposed. As a result, many community organizations and non-profit environmental groups are looking to construct and implement a comprehensive water monitoring protocol in Ohio’s Utica Basin. However, given funding limitations and the lack of data being made available from Ohio’s Department of Natural Resource (ODNR) and Ohio Environmental Protection Agency (OEPA), these groups are being forced to prioritize water bodies of concern. Our research suggests that some of the state’s largest and most economically beneficial lakes – namely Senacaville, Atwood, Guilford, Tappan, and Berlin – are at the top of the list of stressed and/or potentially susceptible inland waters.

Figure 1. Eastern Ohio Utica Shale Basin - Click to enlarge

Figure 1. Eastern Ohio Utica Shale Basin

Figure 2. Ohio’s lakes, wetlands, and vernal pools relative to its Utica Shale and Class II/III injection wells - Click to enlarge

Figure 2. Ohio lakes, wetlands, & vernal pools relative to Utica Shale & Class II/III injection wells

Figure 3. The distribution of Ohio’s Utica Shale and Class II/III Injection wells with respect the region’s primary perennial water bodies at 1, 3, and 5 mile intervals

Figure 3. The distribution of Ohio’s Utica Shale and Class II/III Injection wells with respect the region’s primary perennial water bodies at 1, 3, and 5 mile intervals


Figure 4. Senecaville & Atwood Lake Region of Ohio’s shale geology, state parks, Utica Shale and Class II/III wells (Note: Pink & Green Circles represent 1 mile radius around Utica Shale and Class III Wells). - Click to enlarge

Figure 4. Senecaville & Atwood Lake Region of Ohio’s shale geology, state parks, Utica Shale & Class II/III wells

Figure 5. Senecaville & Atwood Lake Region of Ohio’s shale geology, state parks, Utica Shale and Class II/III wells, and Abandoned Underground Coal Mines (AUCMs) - Click to enlarge

Figure 5. Senecaville & Atwood Lake Region of Ohio’s shale geology, state parks, Utica Shale & Class II/III wells, plus Abandoned Underground Coal Mines

Note: Pink & Green Circles in Figures 4 and 5 represent a 1 mile radius around Utica Shale & Class III Wells.


1. From the ODNR: “Class II disposal wells include conventional brine injection wells, annular disposal wells, and enhanced oil recovery injection wells. Enhanced recovery injection wells are used to increase production of hydrocarbons from nearby producing wells… Additionally, DMRM also regulates Class III salt-solution mining wells, which are used to produce saturated brine from the salt deposits that occur from 2000 to 3500 feet below Ohio’s ground surface. The saturated brine is then used to make table salt, water softener salt, and salt blocks. All types of injection wells are designed to ensure safe injection into permitted formations.”

Shale gas plays with Utica in blue

Stepping into the Utica Shale

By Samantha Malone, MPH, CPH

I recently had the honor of presenting to a well-informed and concerned audience of residents, media, academics, non-profits, and industry personnel in the town of Alliance in Northeastern Ohio. The reason I was asked to participate in this public meeting was to provide some insight into how drilling has progressed in Pennsylvania from a public health perspective. While Ohio doesn’t really have much Marcellus Shale activity, the industry has been ramping up their efforts in the Utica Shale, which is situated approximately 6,500 feet beneath Alliance and below the Marcellus formation. See the map below of all known U.S. shale plays; the Utica has been shaded blue.

Shale gas plays with Utica in blue

Shale gas plays in continental U.S., with Utica in blue

Also on the agenda that evening were two experts in their fields: Dr. Jeffrey Dick, Chair of the Geology and Environmental Science department at Youngstown State University, who spoke about the hydraulic fracturing process and the available research regarding its impacts from a geological and hydrological perspective; and Dr. Theodore Voneida, professor emeritus of Neurobiology at Northeastern Ohio Universities College of Medicine, who discussed medical concerns with a very moving talk and follow-up video.

The event began as expected – with an air of fear present as to what this consortium of speakers would say about such a potential money-maker for certain mineral rights owners and the local economy. What surprised me by the end of the presentations was the intuitive discussion among residents and attendees of their experiences with the industry and landsmen. (Landsmen are the personnel hired by the gas drilling companies to persuade mineral rights owners to lease their property for natural gas extraction purposes. Historically, there have been many complaints raised about the transparency of the process and the unscrupulous nature of these contracted employees.) Alliance’s residents reported similar experiences. Some were told, “all of your neighbors have leased, so we’ll get the gas out one way or another.” When, in fact, those neighbors (also present at the meeting) had not signed, but were given the same spiel about why they should lease their mineral rights to one company in particular.

The most unfortunate part about witnessing this discussion was the realization that I had heard it all before: in 2009 and 2010 when drilling activity intensified in PA and WV. In fact, residents’ concerns and frustrations were significant driving forces behind the development of FracTracker. People craved access to easy to understand and transparent information about the pace of lease, drilling, and its associated risks. I truly hope that we’ve begun to provide what is needed to make well-informed decisions about natural gas drilling since that time.

Shale gas drilling activity is increasing quickly in Ohio. According to Dr. Dick, there were six drilling rigs working the region in November 2011. By late February 2012, 18 rigs were at work and 76 wells have been permitted. At least 10 different companies are aiming to exploit the Utica Shale in 18 counties of Eastern Ohio. With no end to this surge in site, FracTracker will strive to respond with an increase in Ohio data sets, snapshots, and stories that will keep everyone better informed.

Additional Resources:


Author Information:
Samantha Malone, MPH, CPH — Communications Specialist, FracTracker; Doctorate of Public Health Student, University of Pittsburgh Graduate School of Public Health, Environmental and Occupational Health Department. Samantha can be reached by email: malone@fractracker.org or phone: 412-648-8541.