At Rhiza, we love to experiment with new ways of visualizing data that help tell better data stories. In most of our work environments, using data is kind of difficult and visualizing is usually left to data experts. We’d love to see a future where sharing data visualizations (maps, charts, explanations, etc) is as easy as recording and sharing a video on YouTube. Not everything produced will be stellar in quality, but at least we’ll all be a lot further down the road towards breaking down the traditional data silos and moving data aggregation and visualization solely out of the hands of database admins and graphic designers. We’ll still need those folks, their jobs will just get a lot more fun!
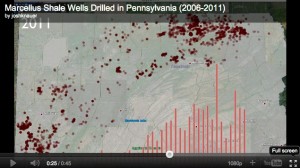
To this end, when I saw a data animation created by John Detwiler that showed the spread of drilled Marcellus shale gas wells in Bradford County, I wanted to create my own data animation telling the same story, but for the entire state of Pennsylvania… Read more»
https://www.fractracker.org/a5ej20sjfwe/wp-content/uploads/2011/12/youtube-snap-300x168.jpg168300FracTracker Alliancehttps://www.fractracker.org/a5ej20sjfwe/wp-content/uploads/2021/04/2021-FracTracker-logo-horizontal.pngFracTracker Alliance2011-12-27 10:18:562020-07-21 10:38:52Animating Data: A Different Way to Look at Marcellus Shale Drilling
By Samantha Malone, MPH, CPH – DrPH Student in Environmental & Occupational Health; Communications Specialist for FracTracker.org
As natural gas drilling in the Marcellus Shale region of our country moves forward, people in many states are debating over the best ways to regulate the natural gas industry. I’m not going to get into the impact fee discussion in this piece, although it is an obvious point of contention that needs addressed in PA immediately. Rather, I’d like to propose a way to manage the permitting and future development of the companies operating in this field.
Pipeline Safety
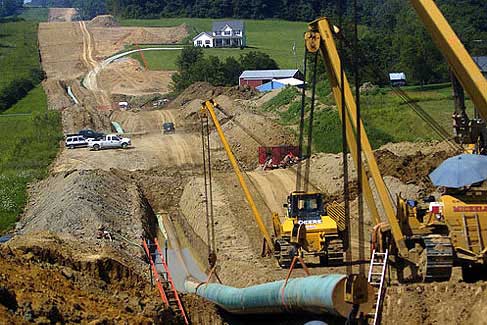
There are 2.5 million miles of pipelines in the U.S., the majority of which are for gas transmission and distribution. A recent 4-part series by the Philadelphia Inquirer brought to light the real and potential dangers of the gas pipeline system, which is being expanded in PA to handle the Marcellus gas destined for the market. The biggest concern highlighted in these articles in my opinion is the lack of oversight anywhere in the process – especially when our regulatory officials cannot even locate the pipelines. (Specific geographic locations of pipelines are often held close to the chest due to the perception that this information poses a risk to national security and infrastructure.)
Pipelines do fail, as demonstrated by the toxic liquid spills map below. This graphic was created by the New York Times, who in a earlier article discussed the lack of human and fiscal resources available to the Pipeline and Hazardous Materials Safety Administration – noting that although the number of spills have declined, pipelines are still responsible for approximately 100 significant spills per year.
NEW YORK TIMES | Source: Department of Transportation, Pipeline and Hazardous Materials Safety Administration
If you’d like to be able to find where pipelines are located (approximately) in your county, visit the U.S. DOT’s Pipeline and Hazardous Materials Safety Administration (PHMSA) website for Pipeline Safety Awareness. The site also provides you with data about pipeline incidents. In case you would rather not go diving through the raw data, below are some U.S. pipeline incident datasets and example maps from 2010 – Nov 2011 data that Matt Kelso obtained from PHMSA:
PHMSA Gas Distribution Pipeline Incidents: Dataset | Map
PHMSA Gas Transmission Pipeline Incidents: Dataset | Map
(You can do a lot more with this data, such as filtering it by whether surface water remediation was necessary or by the type of contaminant that was released.)
Violations in PA
Violations Jan-Sept 2011 PA (EHS violations in red)
Another concern about natural gas drilling is the risk of environmental health and safety incidents occurring throughout the rest of the drilling process.1
The map to the left created using Data.FracTracker.org shows all of the violations that were issued to drillers from Jan-Sept. 2011 in Pennsylvania. The red dots are the violations that fall under the DEP’s loose category of Environmental Health and Safety (EHS).2
As you can see, EHS incidents do occur, but is that the whole story? Perhaps we should be asking ourselves, who exactly is responsible for these incidents – pipelines and the like? When you look more closely at the data the industry’s safety record becomes less monolithic than at first glance.
Focusing on the Bad Actors
The PR surrounding natural gas drilling is controversial at best. We have seen blanket statements about how safe – and dangerous – natural gas drilling and pipelines can be. We all must recognize that the answer lies somewhere in between. However, where is the perfect medium located, and how do we address the root of the problems that do arise?
One approach that is taken by some regulatory bodies such as OSHA is to focus on the bad actors. In two of his more recent posts, FracTracker’s Matt Kelso analyzed the ‘bad actors’ that exist within the violations issued in PA. While this is certainly not an easy or straightforward task, he was able to identify operators with the highest and lowest violations per well drilled, as well as trends between 2010 and 2011. Check out these analyses here: Part 1 | Part 2.
Bad actors are not good for the industry’s PR or the Commonwealth’s residents. If the agencies responsible for issuing drilling permits quantitatively began to take violation trends into account, this would allow the safer drillers to continue operating, while limiting those with a less than appealing track record.
1 One of the great changes made by the PA Department of Environmental Protection in the last 2 years has been the transfer from the paper record system for keeping track of the violations they issue to a digital version that allows people access to the comprehensive, raw data. This is certainly also something that should be on NY’s Department of Environmental Conservation radar prior to issuing its first permit for high volume hydraulic fracturing.
2 EHS violations are a loose category because often times when we sift through the data we will find administrative oversights like paperwork mislabeled as EHS, and more serious spills and fires mislabeled as administrative.
https://www.fractracker.org/a5ej20sjfwe/wp-content/uploads/2011/12/ViolationsJan-Sept2011PA.jpg5271073FracTracker Alliancehttps://www.fractracker.org/a5ej20sjfwe/wp-content/uploads/2021/04/2021-FracTracker-logo-horizontal.pngFracTracker Alliance2011-12-21 18:22:522020-07-21 10:38:51A discussion on regulation and safety
The last of the three datasets is the most unique, with data spatially joined to municipalities. The following two maps exhibit the Marcellus Shale related data that they contain:
Number of Marcellus Shale wells per PA municipalities as of December 16, 2011. Click the gray compass rose and double carat (^) to hide those menus. Then click the information tool (the blue “i”) then any map feature for more information.
Number of Marcellus Shale wells in PA municipalities per square mile, as of December 16, 2011. Area calculation performed in PA State Plane South.
https://www.fractracker.org/a5ej20sjfwe/wp-content/uploads/2021/04/2021-FracTracker-logo-horizontal.png00Matt Kelso, BAhttps://www.fractracker.org/a5ej20sjfwe/wp-content/uploads/2021/04/2021-FracTracker-logo-horizontal.pngMatt Kelso, BA2011-12-16 14:23:142020-07-21 10:38:51Updated Drilled Wells Data for PA
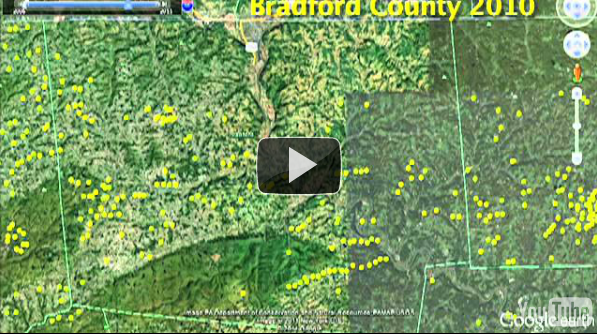
One of the regular users, John Detwiler, recently took the mapping application that is part of the platform to an even greater level. He exported wells drilled data by year into Google Earth to create an animation of the shale gas wells drilled from 2007-11 in Bradford County, PA. Check it out:
https://www.fractracker.org/a5ej20sjfwe/wp-content/uploads/2011/12/Screen-Shot-2011-12-14-at-11.29.12-PM.png334597FracTracker Alliancehttps://www.fractracker.org/a5ej20sjfwe/wp-content/uploads/2021/04/2021-FracTracker-logo-horizontal.pngFracTracker Alliance2011-12-15 00:31:442020-07-21 10:38:51Bradford County Wells Drilled Animation
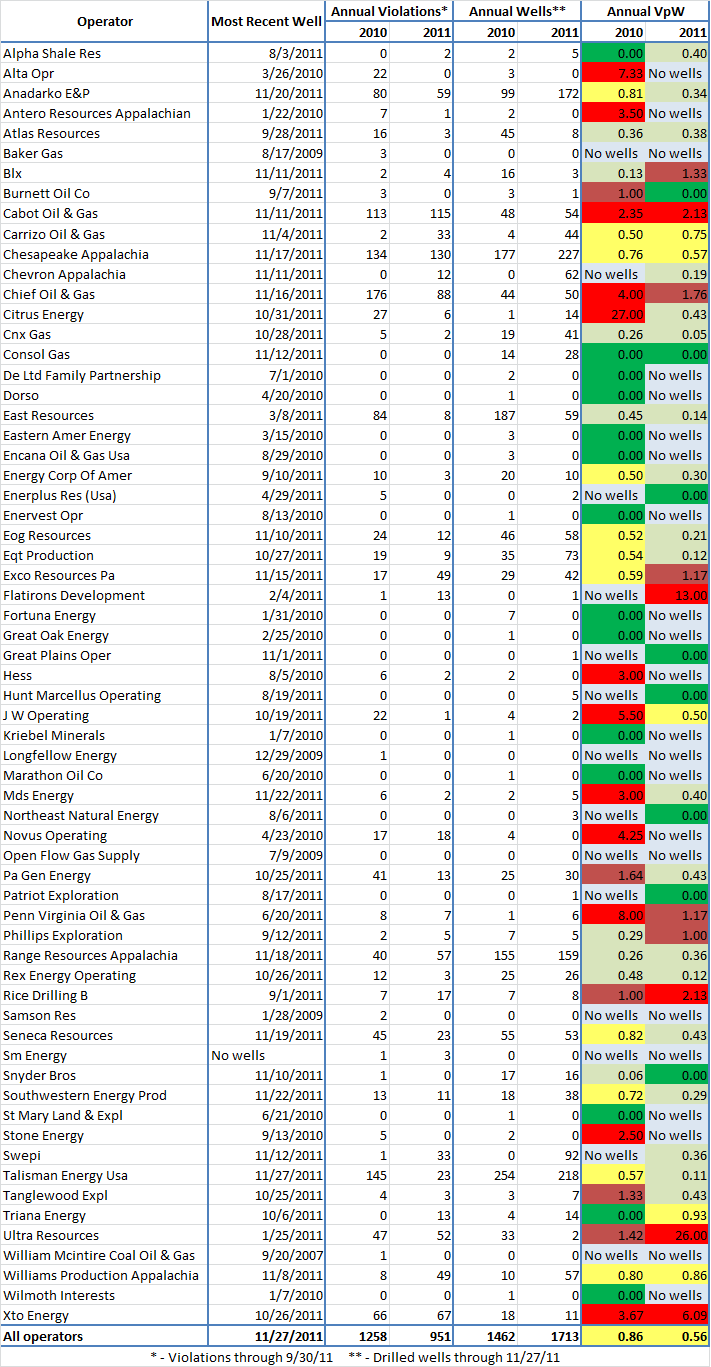
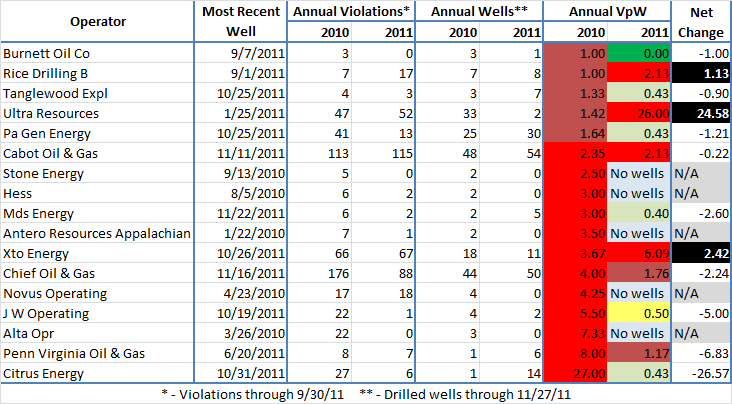
Recently, I conducted an analysis of the legacy of each Marcellus Shale operator’s violations over time, normalized by the number of wells each company has drilled, in a metric that I call Violations per Well, or VpW. While that analysis was cumulative, I’ve had FracTracker readers ask if the VpW from one year predicts the VpW for the following year, particularly among the bad actors. To help answer that question, I’ve taken the same raw data from the previous post, and recompiled it to help address that.
I’ve been looking at violations per well for some time, on the theory that it can be used to help score a company’s compliance history with regards to the Pennsylvania Department of Environmental Protection, which issues them. All of these wells and violations are Marcellus Shale specific, and come from sources posted on the DEP website.
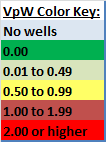
For ease of use, I’ve color coded the results, with bright green being the best scores, and bright red being the worst. Companies without wells for a given year are indicated in pale blue. They may either indicate drilling operators that were inactive in a given year, or midstream companies that haven’t drilled any well. Here’s the color coded key:
And here are the results:
To look at the bad actors from 2010, I selected all of the entries that were colored burgundy or bright red for that year’s VpW score. How have they fared so far in 2011?
To be fair, I should point out that operators with very few wells can get obnoxious VpW scores in a hurry. On the other hand, there were 14 Marcellus Shale operators with at least one well drilled in 2010 that didn’t get any violations that year. Therefore, in this instance, I’ve included all operators with a VpW of 1.00 or greater, and will leave questions about sample size up to the reader.
Five of the operators with VpW scores of 1.00 or higher haven’t drilled any wells at all in 2011 so far. In fact, all of them had VpW scores of at least 2.50. There may be a variety of reason for their absence in 2011, but honestly, their lack of compliance isn’t missed.
Nine operators improved from 2010 to 2011, four of which improved all the way into green categories. This is the result that we want to see, where companies appear to be responsive to violations issued by the DEP. Notable among this group is Citrus Energy, which had a huge amount of violations compared to one drilled well in 2010, to a VpW score under 0.50 so far in 2011. Also, PA Gen Energy is an operator with a significant number of wells that went from a red to a green category, which is encouraging to see. Cabot, on the other hand, barely budged, and remains over 2.00 violations per well.
There are also three operators from 2010 with VpW scores of 1.00 or greater that actually got worse in 2011. And keep in mind, the data used includes almost two more months of drilled wells than violations, so inclusion in this group is especially dubious. They include Rice Drilling B, whose VpW more than duobled to 2.13; XTO, which went from awful to horrific since becoming a subsidiary of ExxonMobil; and Ultra Resources, whose performance has been nothing short of ghastly in 2011. Luckily, Ultra has been leaving the Keystone State alone since January–let’s hope it stays that way.
I maintain that since so many operators–big and small–are able to keep their violations to wells ratio at less than 1:2, all of the operators that operate in Pennsylvania’s Marcellus Shale should try to reach that standard. Those that show a continued disregard for our laws protecting our environment should face stiff fines for their complacency, while those operators that average more than two violations per well drilled over a prolonged period of time need to be banned.
https://www.fractracker.org/a5ej20sjfwe/wp-content/uploads/2021/04/2021-FracTracker-logo-horizontal.png00Matt Kelso, BAhttps://www.fractracker.org/a5ej20sjfwe/wp-content/uploads/2021/04/2021-FracTracker-logo-horizontal.pngMatt Kelso, BA2011-12-12 15:40:172020-07-21 10:38:40Violations per Well by Operator, Part 2: Bad Actors
The Community Foundation for the Alleghenies has named a former state Department of Conservation and Natural Resources official to manage its newest fund, FracTracker.org, effective this week.
Brook Lenker, who served as manager of education and outreach in the department for nearly eight years, will manage FracTracker.org staffing and operations; expand the website capabilities; coordinate and develop content; publicize and expand use of the website by journalists and other users; broaden community and academic outreach; and undertake additional strategic initiatives.
“We are pleased to be able to engage a talented and committed environmental leader such as Brook and to work with donors such as The Heinz Endowments, whose generosity can be put to use through important community tools like the FracTracker.org Fund,” Angie Berzonski, program & communications officer for the Community Foundation for the Alleghenies, said in making the announcement today (Friday, December 9, 2011).
“FracTracker is an invaluable resource to all who care about our future and the complex challenges associated with the shale gas industry,” said Lenker. “I’m honored to lead it and hope to expand its utilization, grow its capabilities, and build powerful partnerships that enhance its effectiveness.”
In his previous work, Lenker had extensive experience collaborating with groups as diverse as conservationists, businesses and hunting-fishing interests. “It was my responsibility to help lead a program to engage all Pennsylvanians in better environmental stewardship practices,” he said, “and I look at my work with the diverse stakeholders connected to FracTracker in the same way.”
The FracTracker website is hosted by the Foundation for Pennsylvania Watersheds. The web portal is a combination data and blog tool that allows users to interact with, upload, analyze and visualize data that have been located geographically in relation to gas extraction activities in the Marcellus Shale region and oil and gas extraction nationally. The portal is also a hypothesis generating tool for academics; a storytelling device for journalists; and a resource for industry and government agencies. The hub serves as a center of data aggregation so that impact can be viewed and understood at scale and, through analysis and exposure, informs all levels of society and social discourse.
“We are looking forward to Brook’s leadership in the future development and use of FracTracker.org.,” said Caren Glotfelty, director of The Heinz Endowments’ Environment Program, which has provided nearly $1.5 million for the project since it began two years ago. “The website has become an important, independent, fact-based source of information on the effects of Marcellus Shale natural gas production, and we expect it will become even more useful under Brook’s management.”
Additional support for various aspects of the FracTracker project comes from the Philadelphia-based William Penn Foundation, which has awarded a $300,000 grant.
The Community Foundation for the Alleghenies is a nonprofit public foundation. Through the charitable giving of its donors, it builds professionally managed assets to support the communities it serves. Grants typically are advised by donors or are entrusted to the Foundation to use its community knowledge and engagement to place their giving toward greatest needs, emerging issues or to best leverage additional support. The Foundation is overseen by an active volunteer board and committees. The Foundation is also among those community foundations achieving compliance with national standards as established by the Council on Foundations.
For information about grantmaking or to inquire how to establish your own charitable fund at the Foundation, please contact the Foundation at 814-536-7741 or visit its website, www.cfalleghenies.org.
###
Samantha Malone and Matthew Kelso welcome Brook Lenker into the FracTracker.org team. They are excited about the experience and passion he brings to the table and look forward to working with him in making FracTracker.org a key player into the shale gas world.
https://www.fractracker.org/a5ej20sjfwe/wp-content/uploads/2011/12/cfa3.png250610FracTracker Alliancehttps://www.fractracker.org/a5ej20sjfwe/wp-content/uploads/2021/04/2021-FracTracker-logo-horizontal.pngFracTracker Alliance2011-12-12 14:59:452020-07-21 10:38:40Community Foundation for the Alleghenies Announces Director for its New FracTracker Fund
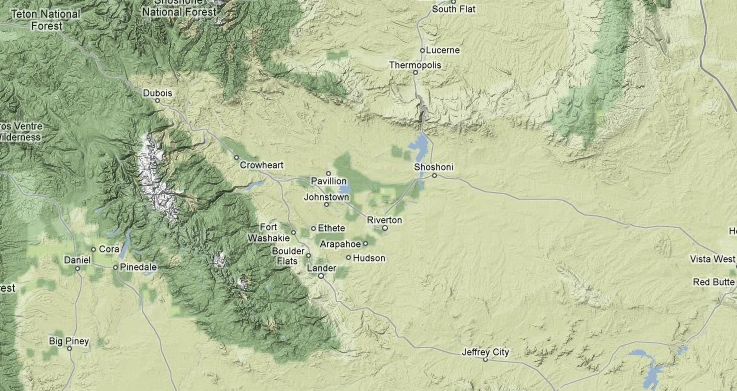
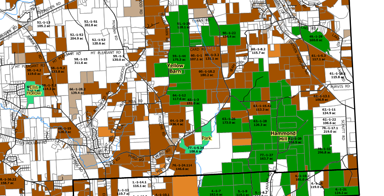
The Internet is alive today after the U.S. Environmental Protection Agency released a report that indicates hydraulic fracturing (used when drilling for natural gas in tight shale formations) can contaminate groundwater. Residents of Pavillion, WY have been complaining about the state of their groundwater for some time now. The draft EPA report lends credibility to their claims with the finding that chemicals associated with the process were found in some deep water aquifers in the area. And when you look at all of the evidence around this issue – outside of the EPA’s study – the results are even more ‘ground-breaking.’
Having said that, there are a few questions regarding the EPA report/research. No field study could ever account for all of the potential confounders and variables – especially given the amount of resources the EPA had at its disposal to conduct this work. However, some of the most significant questions that I would like to see answered before this draft is finalized include:
How representative is the data from the two monitoring wells in relation to residents’ drinking water wells?
Has the potential for surface contamination of the monitoring wells been ruled out?
Why weren’t the duplicate samples that were analyzed by separate labs also able to detect 2-BE?
These questions (and surely more) are exactly why this is only a draft report. According to the EPA, it will be available for a 45-day public comment period. A subsequent 30-day peer-review process will be led by a panel of independent scientists to ensure that the results that stay on the records are accurate.
https://www.fractracker.org/a5ej20sjfwe/wp-content/uploads/2011/12/Screen-Shot-2011-12-09-at-3.41.18-PM.png391737FracTracker Alliancehttps://www.fractracker.org/a5ej20sjfwe/wp-content/uploads/2021/04/2021-FracTracker-logo-horizontal.pngFracTracker Alliance2011-12-09 17:06:452020-07-21 10:38:39EPA: Fracking and Groundwater Contamination
The New York Times has collected more than 111,000 oil and gas leases and related documents through open records requests. Over 100,000 of the documents in the archive are from Tarrant County, Tex., roughly 3,200 are from New York, and the remainder are from states including Maryland, Ohio, Pennsylvania and West Virginia.
To see all of the leases that have been collected by the New York Times, click here.
Some quick tidbits about what they found:
Fewer than half the leases require companies to compensate landowners for water contamination after drilling begins. And only about half the documents have language that lawyers suggest should be included to require payment for damages to livestock or crops.
Most leases grant gas companies broad rights to decide where they can cut down trees, store chemicals, build roads and drill. Companies are also permitted to operate generators and spotlights through the night near homes during drilling.
In the leases, drilling companies rarely describe to landowners the potential environmental and other risks that federal laws require them to disclose in filings to investors.
Most leases are for three or five years, but at least two-thirds of those reviewed by The Times allow extensions without additional approval from landowners.
https://www.fractracker.org/a5ej20sjfwe/wp-content/uploads/2011/12/gasLeasesSEDrydenA-livingindryden-org.png196384FracTracker Alliancehttps://www.fractracker.org/a5ej20sjfwe/wp-content/uploads/2021/04/2021-FracTracker-logo-horizontal.pngFracTracker Alliance2011-12-05 16:24:442020-07-21 10:38:39Gas Lease Review by the New York Times
As FracTracker’s manager, the Center for Healthy Environments and Communities of the University of Pittsburgh Graduate School of Public Health has created a brief online SurveyMonkey questionnaire (approximately 10 minutes). The purpose of this research is to determine whether and how people are using Data.FracTracker.org to make decisions surrounding natural gas drilling. If you are willing to participate, the survey will ask about your utilization of FracTracker’s features (e.g. data mapping component), whether you have used the system to help you make decisions about natural gas drilling, whether you believe that the decisions you made impacted your health or those around you, and your demographics (e.g. sex, age, race, education, and residence).
There are no foreseeable risks associated with filling out this survey, nor are there any direct benefits. There is no compensation for completing the survey. All responses are confidential, and results will be kept within University of Pittsburgh computers. Aggregated responses will be used for the purposes of writing an academic paper on the utilization of FracTracker for decision-making. Your participation is voluntary, and you may stop participating at any time.
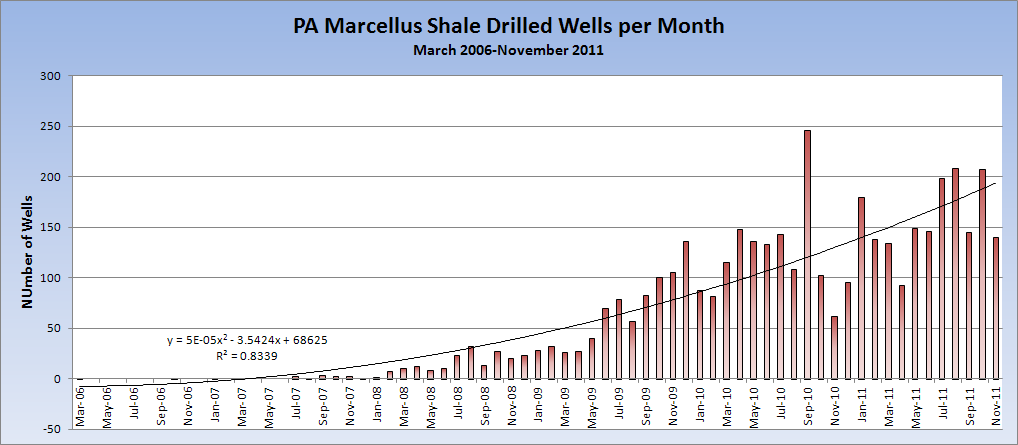
The following chart takes a look at the number of drilled Marcellus Shale wells in Pennsylvania, from 2006 through November, 2011. The accompanying trend line is included, not so much to predict December’s total, but to show the relatively decent R2 value. That is to say, despite the occasional peaks (e.g., September 2010) and troughs (e.g., November 2010), the number of Marcellus Shale wells drilled per month has been increasing in a fairly orderly manner over the past 4 years and 8 months.
Actually, the best Excel trendline was a sixth order polynomial, with an R2 value of .087, but that’s getting fairly silly relative to my purposes here.
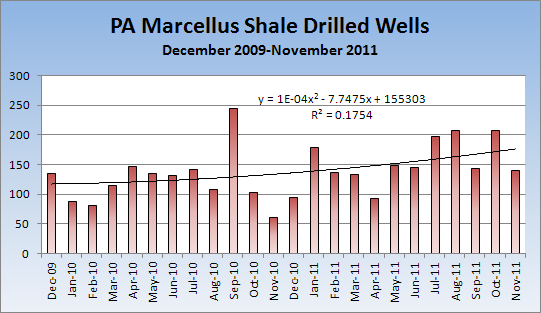
However, when you use the same data but only look at the last 24 months, the results are far more erratic. Once again, the highest R2 value was from a polynomial trendline. But that value wasn’t very high at all:
Once again, I don’t think the equation itself is that important, but the 0.18 R2 value is pretty low. Even the sixth order polynomial, with three peaks and three troughs, has an R2 value of only 0.34.
While the first chart shows an industry that is steadily accelerating, the second one shows…I don’t know. I’m hesitant to offer interpretations. My sense is that even though the R2 value is surprisingly low compared to the first chart, it doesn’t actually mean that much. Visually assessing the chart, it doesn’t seem to be a seasonal fluctuation, but there are mini-clusters of months with higher amounts of drilling activity, and those with lower amounts as well. Certainly, the trendline is higher this month that it was two years ago, but not dramatically so.
 At Rhiza, we love to experiment with new ways of visualizing data that help tell better data stories. In most of our work environments, using data is kind of difficult and visualizing is usually left to data experts. We’d love to see a future where sharing data visualizations (maps, charts, explanations, etc) is as easy as recording and sharing a video on YouTube. Not everything produced will be stellar in quality, but at least we’ll all be a lot further down the road towards breaking down the traditional data silos and moving data aggregation and visualization solely out of the hands of database admins and graphic designers. We’ll still need those folks, their jobs will just get a lot more fun!
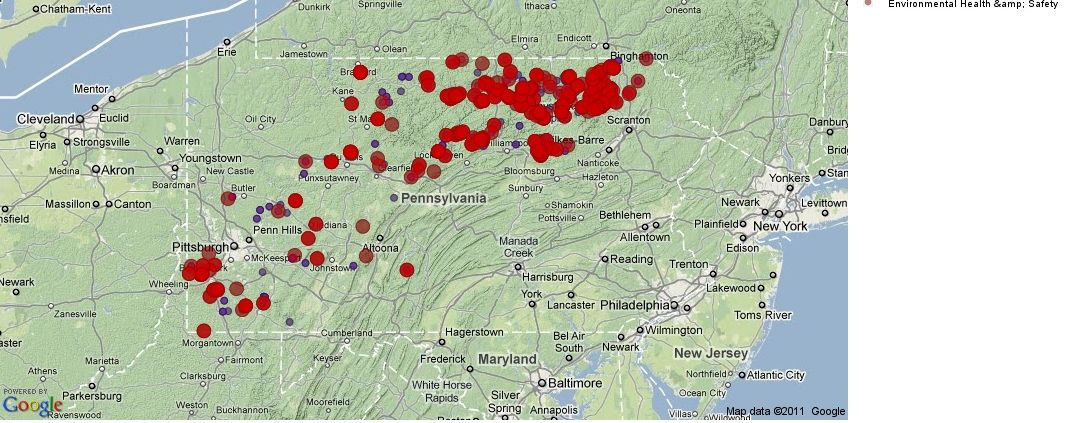

")


.")