Frac

Interview with Dorina Hippauf – Sentinel Award Winner

Kirk Jalbert, FracTracker’s Manager of Community Based Research & Engagement, interviews Dorina Hippauf, one of FracTracker’s 2015 Community Sentinels Award Winners.

dorina_hippauf

Dorina Hippauf is the Chair of the Research Committee for the Gas Drilling Awareness Coalition (GDAC) of Luzerne County, Pennsylvania, and a contributing member of the Shale Justice Coalition. When a landman came knocking on her door in 2010, offering riches in exchange for a gas lease, Dory took the old saying of “if it sounds too good to be true, it probably isn’t” to heart. This was the starting point that led to her dedicated exploration of the industry’s practices and the creation of the Shale Players project, which now contains over 10,000 entries of who is connected to who in the industry. Dorina is one of three recipients of the 2015 FracTracker Community Sentinels Award. Here we talk with Dory about her work to connect the dots between board rooms, lobbyists, PR firms, astroturf organizations, and government agencies that promote the agendas of the gas industry.


Q: Dorina, perhaps we can begin by your telling me a bit about what brought you to advocacy work related to oil and gas development?

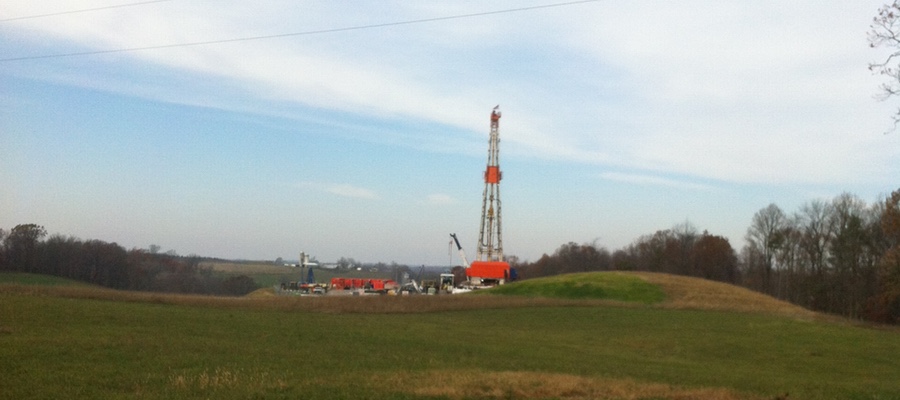
Dorina: What got me into the whole issue of gas drilling was, one, when I was driving to work, I would see flares on hillsides and I didn’t really understand what was going on.  You know, there were big, large flames and my first thought was, something is on fire. Then I realized that from the way it was flaming, it was contained. But I still didn’t know what was going on. And then we had a land man come knock on our door and start offering us a lease. And we only have three quarters of an acre. Originally he was offering $1,000 an acre and when we said we only have three quarters of an acre, he dropped the price to $750. Everything just didn’t sound right. So I started doing some online investigating. I came across the GDAC, which is a local grassroots group in our area. I started attending meetings and I got involved from there.

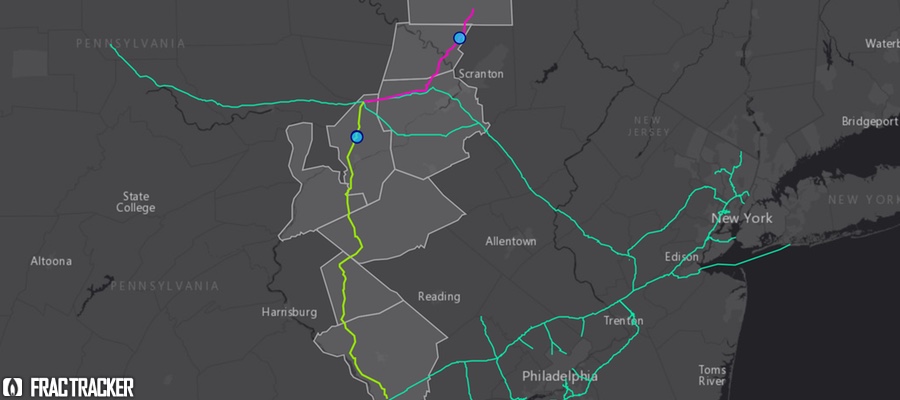
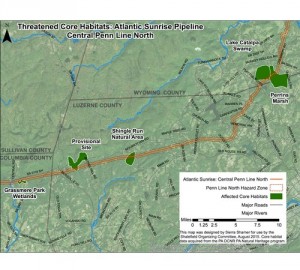
The big driller here that was signing everybody up was Encana, which is of course based out of Canada. They did three test wells in our area. All three came up dry. Basically we are right at the edge of the productive end of the Marcellus Shale. Encana, shortly after they finished up the last test well, released everybody from their leases and left town in 2011. But I remained active with GDAC because I realized they have to get the gas to market. We’re located along the Transcontinental Pipeline, an ideal place for them to connect to gas hubs for gathering lines. So I knew the whole issue of gas drilling wasn’t going to be over with just Encana leaving our area.


The Shale Players Project

Q: I know that one of the projects that you were instrumental in founding was the Shale Players project. Tell me more about that project, how it began, and what its status is presently?

A: I was at a GDAC meeting and somebody was talking about Encana and the question was asked, who is Encana? So I started Googling them and getting some information and this lead to other connections and I realized that just jotting things down on a piece of paper wasn’t going to give the whole picture. A lot of these companies are all interconnected one way or the other. I created this spreadsheet that grew into the Shale Players project. I have lists of the executives that work at these companies, the Board of Directors, politicians that are connected to them, other front groups, trade agencies, Astroturf, PR firms, and lobbying groups. It has grown to over 10,000 entries now.

Dorina explains Shale Players in her video “Connecting the Dots”

Q: How have you disseminated your findings and what are some of the results that you have seen come from this research?

A: Anyone who wants it, I give it to them. It’s also online on Google Docs. What I hope to do eventually is find someone that is able to put this into a format so it’s searchable online. So that when you type in somebody’s name or a company, it shows all of those connections. I update the online version every three or four months. As for what we’ve done with the results, the Public Accountability Initiative used it when they did their expose on Pennsylvania and gas drilling. Walter Brasch also cited a lot of my work in his book Fracking Pennsylvania. Other groups are using it because they go looking for information on a company that they may be dealing with.

Q: You also do a fair amount of blogging too, correct?

A: Yes, my blog is Frackorporation. When I blog, I usually try to show the connections to the genealogy of some of these organizations to give people a better idea of who they are really dealing with. So many people are looking for a single villain to blame. But it’s all interconnected. And that’s what I’m trying to show people, that this is more than just drilling and fracking and dealing with one company, it also extends to the whole issue of lobbying, the citizen united decision, and with unlimited donations to candidates. A lot of money gets passed around. Alec is involved, the Koch brothers are involved. A lot of big names.


We’re in for the long haul

Q: How do you think your work has made a difference in the public’s understanding of the political and economic landscape of the gas industry?

A: Well, to some extent, it discourages people because they see how large and involved it is. But on the other hand, it also makes them angry and they realize that you have to deal with this issue on a lot of different levels, both in terms of environmental impact, getting the community involved, and that its important to get involved politically. Also, it helps them to determine who to contact if they want to write a letter to a company. Too often we will just send it to the spokesperson who is just reading a script, but that is not whose attention you want to get. Also, the shareholders, they often don’t realize what the company is really doing. If you own one share of a company, you can go to their meetings and make a lot of noise.

Q: So this really is about building community and not just about collecting data. This relates to another project you are involved in called the Shale Justice Coalition. Can you tell me more about the Coalition?

A: The Shale Justice Coalition is a coalition of grassroots groups. Our overall objective is to stop the practice of fracking and to promote alternative energy as a better option. We have members in four or five in the states now as well as some from England and Ireland. Lots of information gets passed around as a result of the coalition — things that are going on in Ohio that we may not know about, things that are going on in New York — we try to share the information, get people interested and make them more aware of the bigger picture of the industry. Many of these groups will get a hold of me personally and ask me to write up a blog post about what is going on in their area. The media is not paying attention. With the Seneca Lake gas storage project there was some emails that were uncovered where Crestwood was telling its employees to boycott all businesses in the towns surrounding the lake that opposed the storage facility. Local groups had tried to get it to reporters who put it on the back burner and didn’t follow-up. I blogged about it, then it got picked up on social media, then the papers finally picked it up. Yeah, I mean, sometimes you have to rattle the cages.


Q: How has this work changed your perspective on the role of making information and data available to the public, in terms of making for better environmental protection?

A: It’s important to get this information out there, to make it readily accessible, easy for people to find and to use. I always thought when I first started this, that I could find one website where I could do a search on companies specifically for fracking and gas and oil drilling. But there wasn’t any. So in a way, with the Shale Players project, I’ve had to fill that niche. Also, a lot of the information I tend to find online I don’t know where they got their information. I take great pains to make sure whatever I put out there has the source link to it, so people can go and look for it themselves.

Q: So what is next for you Dory? What kind of new projects are you planning?

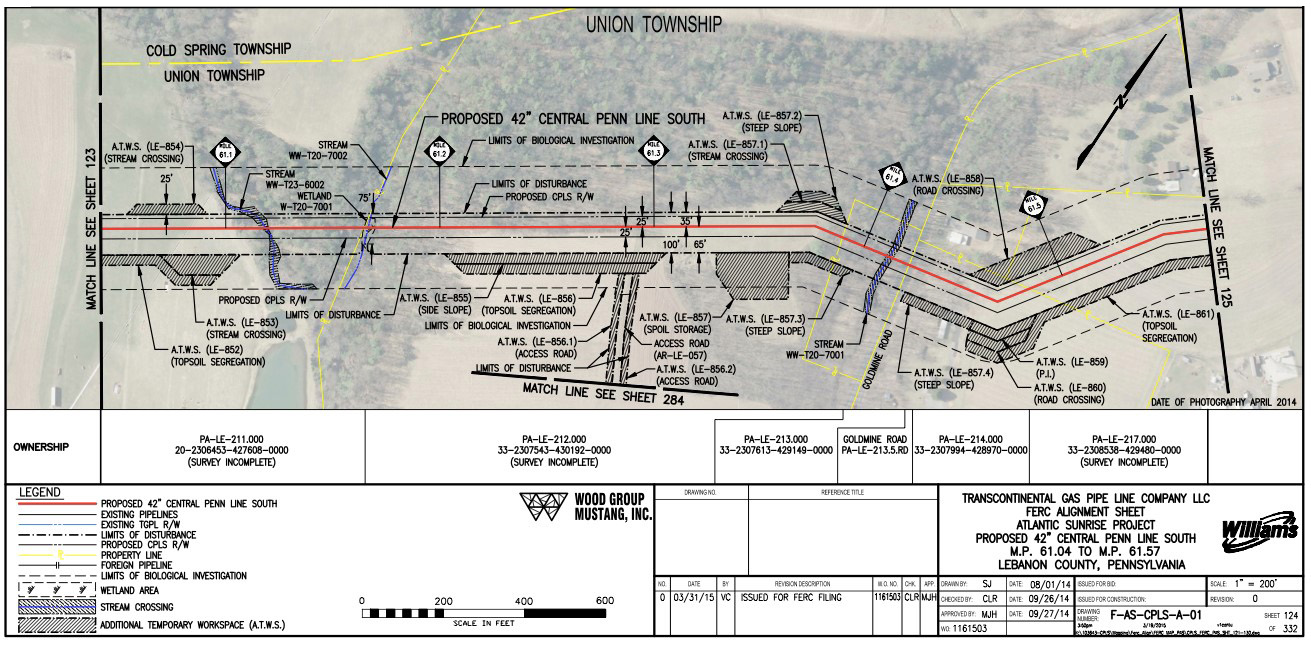
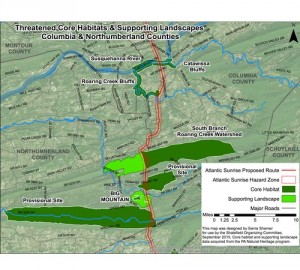
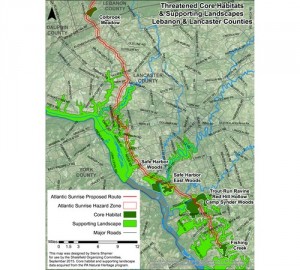
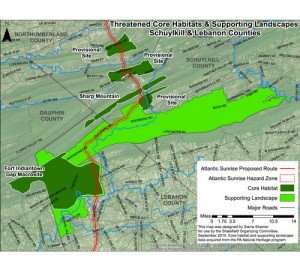
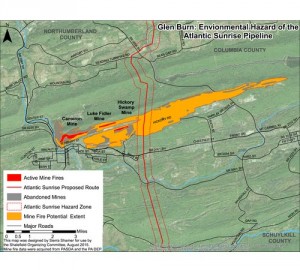
A: At the moment we are fighting the pipelines. I’ve been going around doing presentations at the request of organizations. Talking about what is going on with FERC and how the FERC process works. Letting people know what they need to be aware of the easement agreements and that they do have to negotiate. Just saying “no” to the easement and taking it to the point of imminent domain, if that is the course the company takes, isn’t enough. You have to show good faith and some attempt at negotiating an easement. Otherwise, when you go before the judge, he’s going to side with the company. Unfortunately, I think with these pipelines, unless we get more action from people, these pipelines are going to go through.


Q: Is there anything that you would communicate to other people and groups that are trying to get off the ground to deal with issues related to oil and gas?

A: Yes. One of the biggest things I keep hearing from people is that, when we have meetings or presentations or newspaper articles or whatever, we are only preaching to the choir. But what these groups have to realize is that the choir is growing. Every pipeline and every gas well sparks a new group of concerned people. So, the choir is growing and people are listening. It does get discouraging. It feels like you are losing at Whack-a-Mole. You are not going to get your cookies right now. And there is no one magic bullet that is going to fix everything. You have to deal with FERC, you have to deal with DEP, you have to deal with the government agencies that are involved. You have to consider who your legislators are. And you just can’t get discouraged. Take a break, stay off the computer for a week, recharge your batteries, and get back into it. You are in it for the long haul and you have to be able to make that commitment.

Q: Do you have any concluding thoughts for our readers?

A: People need to get local and be vocal. Tip O’Neil said, all politics are local and that is where it’s going to start. It’s like that movie, Groundswell. That’s grassroots. It starts from the bottom up to make real change. You can’t look at the federal government to fix it for you and the state government isn’t going to fix it either. You have to start locally and building the momentum there. And don’t give up.

About FracTracker Alliance [video]

Learn more about FracTracker Alliance and why we do what we do in this snazzy new video produced by Stony Creek Films.

Oil wastewater pit

Wastewater Pits Still Allowed in California

By Kyle Ferrar, Western Program Coordinator

Above-ground, unlined, open-air sumps/ponds

It is hard to believe, but disposing of hazardous oil and gas wastewaters in unlined, open-air pits – also known as sumps or ponds – is still a common practice in California. It is also permitted in other states such as Texas and West Virginia. Because these ponds are unlined and not enclosed, they contribute to degraded air quality, are a hazard for terrestrial animals and birds, and threaten groundwater quality. A 2014 report by Clean Water Action, entitled In the Pits provides a thorough summary of the issue in California. Since the report was released, new data has been made available by the Central Valley Regional Water Quality Review Board identifying additional locations of wastewater pits.

With the increase of oil and gas development in unconventional reservoirs, such as the Monterey Shale Play in California, the size of the resultant waste stream of drill cuttings, produced brines, and wastewater has skyrocketed. Operators now drill larger, deeper wells, requiring larger volumes of liquid required for enhanced oil recovery methods, such as steam injection, and stimulations such as hydraulic fracturing and acidizing. While California is the 4th largest oil-producing state, it is 2nd only to Texas in wastewater production. This boom of unconventional development, which may still in its infancy in California, has resulted in an annual waste stream of over 130 billion gallons across the state, 80 billion (62%) from Kern County alone.1

Results of the state mandated California Council on Science and Technology Report found that more than half of the California oil industries waste water is “disposed” in pits.2 As outlined by Clean Water Action, the massive waste-stream resulting from drilling, stimulation, and production is one of the most significant and threatening aspects of oil and gas operations in terms of potential impacts to public health and environmental resources.

Wastewater Facility Details

Last February, the LA Times reported on the pits, identifying a total of 933 in California.3 The most recent data from the Regional Water Quality Control Board of the Central Valley shows:

  • A total of 1,088 pits at 381 different facilities
  • 719 pits are listed as “Active.” 369 are “Idle.”
  • 444/939 (47.3%) ponds do not list a permit.
  • 462 pits are operated by Valley Water Management Corporation.

In Table 1, below, the counts of Active and Idle facilities and pits are broken down further to show the numbers of sites that are operating with or without permits. The same has been done for the operator with the most pits in Table 2, because Valley Wastewater operates nearly 9 times as many pits as the second largest operator, E & B Natural Resources Management Corporation. These two operators, along with California Resources Elk Hills LLC, all operate the same number of facilities (28). The other top 20 operators in Kern County are listed in Table 3, below.

Table 1. Wastewater Pit and Facility Counts by Category
Counts Active Idle
Facilities 180 201
Unpermitted Facilities 102 179
Facility Permitted prior to 1985 37 11
Individual Pits 719 369
Unpermitted Individual Pits 187 257
Pit Permitted prior to 1985 252 63


Table 2. Valley Water Wastewater Pit and Facility Counts by Category
Counts Active Inactive
Facilities 21 7
Unpermitted Facilities 2 2
Facility Permitted prior to 1985 9 1
Individual Pits 356 78
Unpermitted Individual Pits 5 9
Pit Permitted prior to 1985 166 35


Table 3. Top 20 Operators by Facility Count, with Pond Counts.
Rank Operator Pond Count Facility Count
1 Valley Water Management Company 462 28
2 E & B Natural Resources Management Corporation 53 28
3 California Resources Elk Hills, LLC 31 28
4 Aera Energy LLC 67 25
5 California Resources Corporation 31 23
6 Chevron U.S.A. Inc. 40 14
7 Pyramid Oil Company 21 12
8 Macpherson Oil Company 14 9
9 Schafer, Jim & Peggy 8 8
10 Crimson Resource Management 20 6
11 Bellaire Oil Company 11 6
12 Howard Caywood 11 6
13 LINN Energy 10 6
14 Seneca Resources Corporation 9 6
15 Holmes Western Oil Corporation 6 6
16 Hathaway, LLC 22 5
17 Central Resources, Inc. 15 5
18 Griffin Resources, LLC 13 5
19 KB Oil & Gas 8 5
20 Petro Resources, Inc. 6 5

Maps of the Pit Locations and Details


The following maps use the Water Authority data to show the locations details of the wastewater pits. The first map shows the number of pits housed at each facility. Larger markers represent more pits. Zoom in closer using the [+] to see the activity status of the facilities. Click the link below the map to open a new webpage. View the names of the facility operators by turning on the layer in the “Layers” menu at the top of the page. The second and third maps show the activity and permit status of each facility. The fourth map allows you to view both activity status and permit status simultaneously by toggling the layers on and off (Open the map in its own webpage, then use the layers menu at the top of the screen to change views).

Map 1. Facility Pit Counts with the top 10 operators identified as well as facility status

Map 1. To view the legend and map full screen, click here.

Map 2. Facility Activity Status

Map 2. To view the legend and map full screen, click here.

Map 3. Facility Permit Status

Map 3. To view the legend and map full screen, click here.

Map 4. Facilityhttps://maps.fractracker.org/lembed/?appid=7385605f018e437691731c94bb589f0a” width=”800″ height=”500″>
Map 4. To view the legend and map full screen, click here.

References

  1. USGS. 2014. Oil, Gas, and Groundwater Quality in California – a discussion of issues relevant to monitoring the effects of well stimulation at regional scales.. California Water Science Center. Accessed 10/1/15.
  2. CCST. 2015. Well Stimulation in California. California Council on Science and Technology. Accessed 9/1/15.
  3. Cart, Julie. 2/26/15. Hundreds of illicit oil wastewater pits found in Kern County . Los Angeles Times. Accessed 9/1/15.

Parked Oil Trains in Berks County, PA

By
Matt Kelso, Manager of Data & Technology
Kirk Jalbert, Manager of Community Based Research & Engagement

The Risks of Crude Oil Trains

As new oil fields boomed across North America in recent years, drillers looked for ways to get the product to refineries thousands of miles away. One solution was to use the nation’s rail infrastructure to ship hundreds of thousands of barrels of crude oil per day. The flow of oil was so great that thousands of additional tanker cars were ordered to get the oil to market. And yet, this solution of transporting crude by rail brought additional problems. Shipping large quantities of highly volatile and combustible crude oil on often antiquated rail lines has resulted in numerous accidents, at times spectacular in scale. In recent months, however, thousands of these oil tankers have been sitting idle on the tracks around the country, partially due to dropping oil prices, leading refineries to opt for cheaper imported oil and less expensive ways to get the domestic product to market such as through pipelines.

Communities Along the Tracks

The interactive story map below investigates a stretch of oil trains that have been parked for months in close proximity to homes, schools, and busy intersections in Berks County, Pennsylvania. Altogether, 30,494 people live in the seven communities through which the tracks in question pass. We began this project in response to concerns from residents who contacted FracTracker for assistance in understanding why these trains were located in their community, what hazards they might pose, and to help people bring this story to the public to foster meaningful discussions about the risks of parked oil trains.

Berks_staticmap


FracTracker has covered the risks of oil trains in a series of other articles. Click here to learn more.

Maps of Updated Central Penn Pipeline Emphasize Threats to Residents and Environment

By Sierra Shamer, Guest Author

The Atlantic Sunrise Project or Central Penn Line is a natural gas pipeline Williams Companies has proposed for construction through eight counties of Central Pennsylvania. Williams intends to connect the Atlantic Sunrise to their two Transco pipelines, which extend from the northeast to the Gulf of Mexico. FracTracker discussed and mapped this controversial project as part of a blog entry in June of 2014; since then, the Atlantic Sunrise Project has been, and continues to be, a focus of unprecedented opposition. While supporters of the pipeline stress how it may enhance energy independence, economic growth, and job opportunities, opponents cite Williams’ poor safety records, their threats of eminent domain, and environmental hazards. This article provides details and maps pertaining to these threats and concerns.

Atlantic Sunrise: Project Overview

The Atlantic Sunrise Project would add 183 miles of new pipeline through the construction of the Central Penn Line North and the Central Penn Line South. The proposed Central Penn Line North (CPLN) begins in Susquehanna County, continues through Wyoming and Luzerne counties, and meets with the Transco Pipeline in Columbia County. With a 30 inch in diameter, it would allow for a maximum pressure of 1,480 psi (pounds per square inch). The proposed Central Penn Line South (CPLS) begins at the Transco Pipeline in Columbia County, and continues through Northumberland, Schuylkill, and Lebanon counties, ending in Lancaster. It would be 42 inches in diameter with a maximum pressure of 1,480 psi. The Atlantic Sunrise project also involves the construction of two new compressor stations, one in Clinton Township, Wyoming County, and the other in Orange Township, Columbia County. Finally, to accommodate the daily 1.7 million dekatherms (1 dekatherm equals 1,000 cubic feet of gas or slightly more than 1 million BTUs in energy) of additional natural gas that would flow through the system, the project proposes the expansion of 10 existing compressor stations along the Transco Pipeline in Pennsylvania, Maryland, Virginia, and North Carolina. Although the Atlantic Sunrise Pipeline would be entirely within Pennsylvania, it is permitted and regulated by the Federal Energy Regulatory Committee (FERC) because through its connection to the Transco Pipeline, it transports natural gas over state lines.

Updated Central Penn Pipeline Route

On March 31, 2015, Williams filed their formal application to FERC docket #CP15-138. Along with the formal application came changes to the pre-filing route of the pipeline that was submitted in the spring of 2014. The route of the Central Penn Line North has been modified since then by 21%, while the Central Penn Line South has been rerouted by 57%.

Williams’ application comprised of hundreds of attached documents, including pipeline alignment sheets for the entire route. Here is one example: 

alignment_sheet_example

These alignment sheets show the extent of William’s biological investigation, the limits of disturbance, the occurrence of stream and wetland crossings, and any road or foreign pipeline crossings. Absent from the alignment sheets, however, is the area around the right-of-way that will be endangered by the presence of the pipeline. This is colloquially known as the “burn zone” or “hazard zone”.

What are “Hazard Zones”?

A natural gas pipeline moves flammable gas under extreme pressure, creating a risk of pipeline rupture and potential explosion. The “potential impact radius” or “hazard zone” is the approximate area within which there will be immediate damage in the case of an explosion. Should this occur, everything within the hazard zone would be incinerated and there would be virtually no chance of escape or survival. Based on pipeline diameter and pressure, the hazard zone can be calculated using the formula: potential impact radius = 0.69 * pipeline diameter * (√max pressure ).

Based on this formula, the hazard zone for the Central Penn Line North, with its diameter of 30 inches and maximum pressure of 1,480 psi, is approximately 796 feet (243 meters) on either side of the pipeline. The hazard zone for Central Penn Line South, with its diameter of 42 inches and maximum pressure of 1480 psi, is 1,115 feet (340 meters) on either side.

Many residents are unaware that their homes, workplaces, and schools are located within the hazard zone of the proposed Atlantic Sunrise Pipeline. Williams does not inform the public about this risk, primarily communicating with landowners along the right-of-way. The interactive, zoomable map (below) of the currently proposed route of the Atlantic Sunrise, Central Penn North and South pipelines depicts the pipeline right-of-way, as well as the hazard zones. The pipeline route was digitized using the alignments sheets included in Williams’ documents submitted to FERC. You can use this map to search home, work, and school addresses to see how the pipeline will affect residents’ lives and the lives of their communities.

Click in the upper right-hand corner of the map to expand to full-screen view, with a map legend.

Affected Communities

Landowners & Eminent Domain

Landowners along the right-of-way are among the most directly and most negatively impacted by the Atlantic Sunrise Pipeline, and other similar projects. Typically, people first become aware that a pipeline is intended to pass through their property when they receive a notice in the mail. Landowners faced with this news are on their own to negotiate with the company, navigate the FERC permitting and public comment process, and access unbiased and pertinent information. They face on-going stress, experiencing pressure from Williams to sign easement agreements, concern about the effects of construction on their property, and fear of living near explosive infrastructure. They must also consider costs of legal representation, decreases in property value, and limited options for mortgage and refinancing.

Sometimes, landowners in a pipeline’s right-of-way choose to not allow the company onto their property to conduct a survey. Landowners may also refuse to negotiate an agreement with the pipeline company. In response, the pipeline company can threaten to seize the property through the power of eminent domain, the federal power allowing private property to be taken if it is for the “public use.”

The law of eminent domain states that landowners whose properties are condemned must be fairly compensated for their loss. However, most landowners feel that in order to be fairly compensated by the company, they must hire their own land appraiser and attorney. This decision can be costly, however, and may not be an option for many people. The legitimacy of Williams’ intent to use eminent domain is contested by opponents of the project, who cite how “public use” of the property provides no positive local impacts. The Atlantic Sunrise Pipeline is intended to transport gas out of Pennsylvania through the Transco, so the landowners in its path will not benefit from it at all. Further, it connects to a network of pipelines leading to current export terminals in the Gulf of Mexico, as well as controversial planned export facilities like Cove Point, MD .

Throughout Pennsylvania, communities have responded to the expansion of pipelines, and to the threats of large companies like Williams. The need for landowner support has been addressed by organizations such as the Shalefield Organizing Committee, Energy Justice Network, the Clean Air Council, the Gas Drilling Awareness Coalition, and We Are Lancaster County. These organizations have worked to provide information, increase public awareness, engage with FERC, and develop resistance to the exploitation of Pennsylvania’s resources and residents. Director Scott Cannon of the Gas Drilling Awareness Coalition has documented firsthand the impacts of unconventional drilling in Pennsylvania through a short film series called the Marcellus Shale Reality Tour. The most recent in the series relates the stories of two landowners impacted by the Atlantic Sunrise Pipeline in the short film Atlantic Sunrise Surprise.

Environmental Review

Theoretically, environmental review of this proposed pipeline would be extensive. Primary decision-making on the future of the Atlantic Sunrise rests with FERC. Due to the National Environmental Policy Act of 1969 (NEPA), all projects overseen by federal agencies are required to prepare environmental assessments (EAs) or environmental impact assessments (EIAs). Because FERC regulates interstate pipelines, EA’s or EIA’s are required in their approval process. These assessments are conducted to accurately assess the environmental impacts of projects and to ensure that the proposals comply with federal environmental laws such as the Endangered Species Act, and the Clean Air and Water Acts. On the state level, the Pennsylvania Department of Environmental Protection (PA DEP) issues permits for wetlands and waterways crossings and for compressor stations on regional basis.

Core Habitats, Supporting Landscapes

The route of the Atlantic Sunrise Pipeline will disturb numerous areas of ecological importance, including many documented in the County Natural Heritage Inventory (CNHI). The PA Department of Conservation and Natural Resources conducted the inventory to be used as a planning, economic, and infrastructural development tool, intending to avoid the destruction of habitats and species of concern. The following four maps show the CNHI landscapes affected by the current route of the Atlantic Sunrise pipeline (Figures 1-4).

Figure 1

Figure 1. Columbia & Northumberland counties

Figure 3. Lebanon County

Figure 2. Lebanon & Lancaster counties

Figure 3. ddd

Figure 3. Threatened Core Habitats

Figure 4. Schuyklill

Figure 4. Schuyklill & Lebanon counties

The proposed pipeline would disrupt core habitats, supporting landscapes, and provisional species-of-concern sites. According to the Natural Heritage Inventory report, core habitats “contain plant or animal species of state or federal concern, exemplary natural communities, or exceptional native diversity.” The inventory notes that the species in these habitats will be significantly impacted by disturbance activities. Supporting landscapes are defined as areas that “maintain vital ecological processes or habitat for sensitive natural features.” Finally, the provisional species of concern sites are regions where species have been identified outside of core habitat and are in the process of being evaluated. The Atlantic Sunrise intersects 16 core habitats, 12 supporting landscapes, and 6 provisional sites.

Active Mine Fires

Map5-GlenBurn

Figure 5. Glen Burn Mine Fires

The current route of the Atlantic Sunrise intersects the Cameron/Glen Burn Colliery, considered to be the largest man-made mountain in the world and composed entirely of waste coal. This site also includes a network of abandoned mines, three of which are actively burning (Figure 5).

The pipeline right-of-way is roughly a half-mile from the closest burning mine, Hickory Swamp. These mine fire data were sourced from a 1988 report by GAI Consulting Inc. The time frame for the spread of the mine fires is unknown, and dependent on environmental factors. Mine subsidence — when voids in the earth created by mines cause the surface of the earth to collapse — is another issue of concern. Routing the pipeline through this unstable area adds to the risk of constructing the pipeline through the Glen Burn region.

Looking Ahead

The Atlantic Sunrise Project has received an unprecedented level of resistance that continues to grow as awareness and information about the threats and hazards develops. While Williams, FERC, and the PA DEP negotiate applications and permits, work is also being done by many non-profit, research, and grassroots organizations to investigate the environmental, cultural, and social costs of this pipeline. We will follow up with more information about this project as it becomes available.


This article was written by Sierra Shamer, an environmental mapper and activist. Sierra is a member of the Shalefield Organizing Committee and holds two degrees from the University of Maryland, Baltimore County: a B.A. in environmental studies and an M.S. in geography and environmental systems.

The Curious Case of the Shrinking Utica Shale Play

Oil, Gas, and Brine Oh My!
By Ted Auch, Great Lakes Program Coordinator, FracTracker Alliance

It was just three years ago that the Ohio Geological Survey (OGS) and Department of Natural Resources (DNR) were proposing – and expanding – their bullish stance on the potential Utica Shale oil and gas production “play.” Back in April 2012 both agencies continue[d] to redraw their best guess, although as the Ohio Geological Survey’s Chief Larry Wickstrom cautioned, “It doesn’t mean anywhere you go in the core area that you will have a really successful well.”

What we found is that the OGS projections have not held up to their substantial claims. And here is why…

Background

The Geological Survey eventually parsed the Utica play into pieces:

  • a large oil component encompassing much of the central part of the state,
  • natural gas liquids from Ashtabula on the Pennsylvania border southwest to Muskingum, Guernsey, and Noble Counties, and
  • natural gas counties, primarily, along the Ohio River from Columbiana on the Pennsylvania-West Virginia border to Washington County in the Southeast quarter of the state.
Columbus Dispatch Utica Shale "play" map

Columbus Dispatch Utica Shale “play” map

Fast forward to the first quarter of 2015 and we have a very healthy dataset to begin to model and validate/refute these projections. Back in 2009 Wickstrom & Co. only had 53 Utica Shale laterals, while today Ohio is host to 962 laterals from which to draw our conclusions. The preponderance of producing wells are operated by Chesapeake (463), Gulfport (118), Antero Resources (62), Eclipse Resources (41), American Energy Utica (36), Consol (35), and R.E. Gas Development (34), with an additional 13 LLCs and 10 publicly traded companies accounting for the remaining 173 producing laterals. A further difference between the following analysis and the OGS one is that we looked at total production and how much oil and gas was produced on a per-day basis.

Analysis

Using an interpolative geostatistical technique known as Empirical Bayesian Kriging and the 962 lateral dataset, we modeled total and per day oil, gas, and brine production for Ohio’s Utica Shale between 2011 and Q1-2015 to determine if the aforementioned map redrawing holds up, is out-of-date, and/or is overly optimistic as is generally the case with initial O&G “moving target” projections.

Days of Activity & Brine Production

The most active regions of the Utica Shale for well pad activity has been much of Muskingum County and its border with Guernsey and Noble counties; laterals are in production every 1 in 2.1-3.4 days. Conversely, the least active wells have been drilled along the Harrison-Belmont border and the intersection between Harrison, Tuscarawas, and Guernsey counties.

Brine is a form of liquid drilling waste characterized by high salt loads and total dissolved solids. The laterals that have produced the most brine to date are located in a large section of Monroe County and at the intersection of Belmont, Monroe, and Noble counties, with total brine production amounting to 23,292 barrels or 734,000-978,000 gallons (Fig. 1).

Total Ohio Utica Shale Production Days 2011 to Q1-2015

Total Ohio Utica Shale Oil Production 2011 to Q1-2015

Total Ohio Utica Shale Gas Production 2011 to Q1-2015

Total Ohio Utica Shale Brine Production 2011 to Q1-2015

Figure 1. Total Ohio Utica Shale Oil, Gas, and Brine Production 2011 to Q1-2015

This area is also one of the top three regions of the state with respect to Class II Injection volumes; the other two high-brine production regions are Morrow and Portage counties to the west and southwest, respectively (Fig. 2).

Layout & Volume (2010 to Q1-2015, Gallons) of Ohio’s Active Class II Injection Wells

Figure 2. Layout & Volume (2010 to Q1-2015, Gallons) of Ohio’s Active Class II Injection Wells

However, on a per-day basis we are seeing quite a few inefficient laterals across the state, including Devon Energy’s Eichelberger and Richman Farms laterals in Ashland and Medina counties. Ashland and Medina are producing 230-270 barrels (8,453-9,923 gallons) of brine per day. In Carroll County, one of Chesapeake’s Trushell laterals tops the list for brine production at 1,843 barrels (67,730 gallons) per day. One of Gulfport’s Bolton laterals in Belmont County and EdgeMarc’s Merlin 10PPH in Washington County are generating 1,100-1,200 barrels (40,425-44,100 gallons) of brine per day.

Oil & Gas Production

Since the last time we modeled production the oil hotspots have shrunk. They have also become more discrete and migrated southward – all of this in contrast to the model proposed by the OGS in 2012. The areas of greatest productivity (i.e., >26,000 barrels of oil) are not the central part of the state, but rather Tuscarawas, Harrison, Guernsey, and Noble counties (Fig. 1). The intersection of Harrison, Tuscarawas, and Guernsey counties is where oil productivity per-day is highest – in the range of 300-630+ barrels (Fig. 3). The areas that the OGS proposed had the highest oil potential have produced <600 barrels total or <12 barrels per day.

Per Day Ohio Utica Shale Oil Production 2011 to Q1-2015

Per Day Ohio Utica Shale Gas Production 2011 to Q1-2015

Per Day Ohio Utica Shale Brine Production 2011 to Q1-2015

Figure 3. Per-Day Ohio Utica Shale Oil, Gas, and Brine Production 2011 to Q1-2015

The OGS natural gas region has proven to be another area of extremely low oil productivity.

Natural gas productivity in the Utica Shale is far less extensive than the OGS projected back in 2012. High gas production is restricted to discreet areas of Belmont and Monroe counties to the tune of 947,000-4.1 million Mcf to date – or 5,300-18,100 Mcf per day. While the OGS projected natural gas and natural gas liquid potential all the way from Medina to Fairfield and Perry counties, we found a precipitous drop-off in productivity in these counties to <1,028 Mcf per day (<155,000 Mcf total from 2011 to Q1-2015) or a mere 6-11% of the Belmont-Monroe sweet spot.

Conclusion: A Shrinking Utica Shale Play

Simply put, the OGS 2012 estimates:

  • Have not held up,
  • Are behind the times and unreliable with respect to citizens looking to guestimate potential royalties,
  • Were far too simplistic,
  • Mapped high-yield sections of the “play” as continuous when in fact productive zones are small and discrete,
  • Did not differentiate between per day and total productivity, and
  • Did not address brine waste.

These issues should be addressed by the OGS and ODNR on a more transparent and frequent basis. Combine this analysis with the disappointing returns Ohio’s 17 publicly traded drilling firms are delivering and one might conclude that the structural Utica Shale bubble is about to burst. However, we know that when all else fails these same firms can just “lever up,” like their Rocky Mountain brethren, to maintain or marginally increase production and shareholder happiness. Will these Red Queens of the O&G industry stay ahead of the Big Bank and Private Equity hounds on their trail?

Digging into Waste Data

Pennsylvania’s Drilling Waste Distributed to Eight States

By Matt Kelso, Manager of Data & Technology

According to data published by the Pennsylvania Department of Environmental Protection (DEP), Pennsylvania’s unconventional oil and gas waste that was generated in the first half of 2015 found its way to treatment facilities, disposal wells, and landfills in eight different states. While the majority of the waste stayed in-state, neighboring Ohio, New York, and West Virginia all received significant quantities of both solid and liquid waste, and additional disposals were made in the non-contiguous states of Michigan, Texas, Utah, and Idaho.


Waste generated by Pennsylvania’s unconventional oil and gas wells was disposed of in a variety of ways and over a large geographic area. Click on a facility to learn more, or zoom in to access waste generated by individual wells. Click here to access the full screen map with a legend and additional controls.

Unconventional drillers in the state are now required to report production data monthly, rather than in six month increments, but waste quantities generated by the wells is still supposed to be reported biannually. However, a small number of operators have been reporting waste monthly, as well, and those figures have been included in this analysis, after spot-checking for duplication. Each record includes data on how the waste was processed and where it was shipped, so we were able to map the receiving facilities as well, and aggregate their waste totals.

Types of Waste

Waste generated by unconventional wells in Pennsylvania from January to June 2015.

Waste generated by unconventional wells in Pennsylvania from January to June 2015 by type.

There are eight types of waste detailed in the Pennsylvania data, including:

  • Basic Sediment (Barrels) – Impurities that accompany the desired product
  • Drill Cuttings (Tons) – Broken bits of rock produced during the drilling process
  • Flowback Fracturing Sand (Tons) – Sand used to prop open cracks made during hydraulic fracturing that return to the surface
  • Fracing Fluid Waste (Barrels) – Fluid pumped into the well for hydraulic fracturing that returns to the surface. This includes chemicals that were added to the well.
  • Produced Fluid (Barrels) – Naturally occurring brines encountered during drilling that contain various contaminants, which are often toxic or radioactive
  • Servicing Fluid (Barrels) – Various other fluids used in the drilling process
  • Spent Lubricant (Barrels) – Oils used in engines as lubricants
  • General O&G Waste (Tons) – Solid waste types other than drill cuttings or fracturing sand

For the sake of simplicity, this analysis will at times aggregate the waste types into two categories, with all types reporting in tons as solid waste, while those listed in 42 gallon barrels will be considered liquid waste.

Waste Disposal

Waste disposal method for unconventional wells in PA, January to June 2015

Waste disposal method for unconventional wells in PA, January to June 2015

This PA waste gets disposed of in a variety of ways. About 93 percent of all solid waste ends up in landfills. 29 of the 58 operators reporting waste during this cycle reported drill cuttings. In a separate report, the DEP has records for unconventional wells drilled by 28 different operators during the same time frame, so these results seem reasonable, since drill cuttings are generated during the drilling process, whereas other types of waste are produced throughout the life cycle of the well.

Statewide, there over 596,000 tons of drill cuttings produced during a period which saw 422 wells spudded, an average of 1,412 tons of cuttings per well. Not all operators generated the same amount of cuttings per well, however. Vantage Energy reports 3,089 tons of cuttings per well, while Hilcorp Energy manages to average just 119 tons over 23 wells drilled in the six month period. It is worth noting that some wells that were spudded just prior to the reporting period likely still generated drill cuttings during the six months in question, and some wells spudded during the cycle will continue to produce cuttings into the next one.

In terms of liquid waste, nearly two thirds of the amount reported is reused for purposes other than road spreading. This is, unfortunately, a dead end in terms of being able to follow the waste stream in the data, as there are no facilities associated with the 13.8 million barrels of waste that falls into this category. 225,000 barrels are specified as being reused for hydraulic fracturing, while the remainder is simply destined for, “Reuse without processing at a permitted facility.”

The amount used for road spreading, 147 barrels, is relatively small, and all of this waste is reported as going to private roads in Greene County. The total amount of liquid waste produced in the six month period is almost 879 million gallons, or enough to fill 1,331 Olympic-sized swimming pools.

PA Waste Receiving Facilities

Altogether, we know where roughly 7 million of the nearly 21 million barrels of reported liquid waste wound up, as well as 640,000 of the 647,000 tons of solid waste. The top ten destinations for each waste type are as follows:

Top 10 reported recipients of unconventional O&G waste produced in PA during the first half of 2015.

Top 10 reported recipients of unconventional O&G waste produced in PA during the first half of 2015.

Six of the top destinations for liquid waste were located in-state, while seven of the top ten facilities for solid waste stayed in Pennsylvania. The only facility to appear on both lists is Patriot Water Treatment in Warren, Ohio.

Public Herald’s #fileroom Update

Crowdsourcing Digital PA Oil & Gas Data

FracTracker Alliance worked with Public Herald this spring to update and map oil and gas complaints filed by citizens to the Pennsylvania Department of Environmental Protection (PA DEP) as of March 2015. The result is the largest release of oil and gas records on water contamination due to fracking in PA. Additionally, Public Herald’s investigation revealed evidence of Pennsylvania state officials keeping water contamination related to fracking “off the books.”

Project Background

The mission of Public Herald, an investigative news non-profit formed in 2011, is two-fold: truth + creativity. Their work uses investigative journalism and art to empower readers and hold accountable those who put the public at risk. For this project, Public Herald aims to improve the public’s access to oil and gas information in PA by way of file reviews and data digitization. Public Herald maintains an open source website called #fileroom, where people can access a variety of digital information originally housed on paper within the PA DEP. This information is collected and synthesized with the help of donors, journalists and researchers in a collective effort with the community. To date, these generous volunteers have already donated more than 2,000 hours of their time collecting records.

The site includes complaints, permits, waste, legal cases, and gas migration investigations (GMI) conducted by the PA DEP. Additionally, there is a guide on how to conduct file reviews and how to access information through the “Right-to-Know” law at the PA DEP. They have broken down complaints and permits by county; wastes and GMI categories by cases, all of which include test results from inspections; and correspondence and weekly reports.

Some partners and contributors to the file team include Joshua Pribanic as the co-founder and Editor-in Chief, Melissa Troutman as co-founder and Executive Director, John Nicholson, who collects and researches for several databases, Nadia Steinzor as a contributor through Earthworks, and many more. Members of FracTracker working on this project include Matt Kelso, Samantha Rubright, and Kirk Jalbert.

#fileroom’s update expands the number of complaint data records collected to 18 counties – and counting!


View Map Fullscreen

Oil Train Response 2015

November 13-15, 2015

Wyndham Pittsburgh University Center, Pittsburgh, Pennsylvania
Coordinated by FracTracker Alliance and ForestEthics

Couldn’t make it?
Watch Friday’s Presentations
Or check out the conversation on Twitter: #oiltrain15

About the Event

Over the past few years, oil train traffic across the continent has increased rapidly with more than 500,000 rail cars moving oil in 2014 alone, according to the Association of American Railroads. The recent Lac-Mégantic, Quebec disaster and subsequent accidents illustrate the severity of this issue. There is a pressing need to determine true hazards facing our communities and to develop solutions to prevent further disasters. Across the United States and Canada, the issue of oil trains has quickly risen onto the agenda of community leaders, safety experts, researchers, and concerned citizens. There is much to discover and share about protecting people and vulnerable places from the various risks these trains pose. Oil Train Response 2015 provides two invaluable forums on this most pressing problem and provides information and insights for every audience.

November 13, 2015

Community Risks & Solutions Conference
Presented by The Heinz Endowments

November 14 & 15, 2015

Activist Training Weekend
Presented by ForestEthics


Conference – November 13th

Friday, Nov 13th: 7:30 AM – 5:00 PM. View Agenda

The one-day conference presented by The Heinz Endowments invites all interest groups to hear from experts about the scale and scope of this challenge, as well as updates on the current regulatory and legal frameworks; consider case studies about the actions/measures taken by various communities in response; and, participate in discussion sessions to explore solutions to better safeguard communities. Elected officials, regulators, and emergency response professionals from Pennsylvania and beyond are especially encouraged to attend to take advantage of this important learning and networking opportunity.

Training – November 14-15th

Saturday, Nov. 14th: Training 7:30 AM – 5:00 PM. Reception 6:00 – 8:00 PM
Sunday, Nov. 15th: Training 7:30 AM – 2:00 PM

A two-day training presented by ForestEthics will equip grassroots and NGO leaders from across the nation with better skills to take back to their communities, and provide critical opportunities for attendees to share winning strategies with each other. In the process of sharing, the conference will help to build both the oil train movement and support the broader environmental and social justice movements. Areas of strategic focus will include: organizing, communications, spokesperson training, data management for organizers, legal strategies, and crowd-sourced train tracking. It will also provide a structured forum for advocates fighting specific oil terminal proposals in places like Philadelphia, Baltimore, and Albany to develop shared strategies and tactics and provide all participants with the skills, knowledge and contacts they will need to carry on this work once they return home.

Oil trains are a major environmental justice issue. The conference and training will speak directly to environmental justice concerns and be inclusive of communities of color, economically disadvantaged urban and rural regions, and communities already experiencing environmental inequities. To this end, need-based travel scholarships will be provided. We are committed to developing the agenda in close consultation with our allies and attendees so that it meets their needs.

Please contact us with questions or requests: anne@forestethics.org.


Many thanks to Paul Heckbert & Randy Sargent of CMU for supplying the oil train photo (top).

Volunteers counting trucks supplying a new well pad in PA

3 Community ‘Sentinels’ Honored with FracTracker’s Environmental Stewardship Award

By Brook Lenker, Executive Director

In my earlier conservation work, I was always inspired by the activities of certain volunteers. Whether it was a guy who touched the lives of scores of kids through his outings and mentorship or a watershed maven who was the queen of planting and restoration, there are people who go above and beyond to make a difference, help others, and heal the planet. Some call them saints, others call them stewards, but whatever you call them they deserve our praise.

In this spirit, FracTracker Alliance created an award – in partnership with the Halt the Harm Network – to honor three ‘sentinels’ amongst the thousands of volunteers across the United States working in their communities and cherished places to observe, measure, document and report impacts caused by activities of the oil and gas industry. In the complex universe around these issues, volunteers fill regulatory gaps in oversight and do extraordinary things. Everyday insights from citizens lead to the discovery of problems unnoticed or ignored, to enforcement and remediation, and to new perspectives and initiatives for environmental protection. Whether mapping or monitoring, capturing photos or video, a sentinel is someone watching tirelessly, caring boldly – an indispensable ally in informing science, understanding, and action.

Community Sentinel Nominations

The nomination process launched in July and closed on August 17th, with 27 nominations received from around the country but especially the Northeast. The nominee lineup was a tour de force:

  • Ling Tsou, United for Action – New York, NY
  • Craig Stevens, Food & Water Watch, NYAF, PAF and other organizations – Herndon, VA
  • Diane Sipe, Marcellus Outreach Butler – Evans City, PA
  • Therese Vick, Blue Ridge Environmental Defense League – Raleigh, NC
  • Vera Scroggins – Brackney, PA
  • Jim Rosenberg, Fayette Marcellus Watch – Grindstone, PA
  • Kel Pickens, Stop Fracking Payne County – Stillwater, OK
  • Dick Martin, Pennsylvania Forest Coalition – Boiling Springs, PA
  • Leatra Harper, Freshwater Accountability Project – Grand Rapids, OH
  • Michael Fitzgerald, The Finger Lakes Times and Subject2Change Media – Watkins Glen, NY
  • Dory Hippauf, Gas Drilling Awareness Coalition – Dallas, PA
  • Frank Finan, Breathe Easy Susquehanna County – Hop Bottom, PA
  • Karen Edelstein, FracTracker Alliance – Lansing, NY
  • Dana Dolney, Friends of the Harmed – Pittsburgh, PA
  • John Detwiler, Marcellus Protest – Pittsburgh, PA
  • Malinda Clatterbuck, Martic Soul – Holtwood, PA
  • Anne Marie Garti, Stop the (UN) Constitutional Pipeline – East Meredith, NY

An esteemed panel of judges carefully considered the outstanding choices without pause to geography. Judges included:

  • Paul Feezel – Chair, Carroll Concerned Citizens
  • Julie Weatherington-Rice – Senior Scientist, Bennett & Williams
  • Jennifer Krill – Executive Director, Earthworks
  • Francisco “Paco” Ollervides – Leadership Development Manager, River Network
  • Ben Stout – Professor of Biology, Wheeling Jesuit University & FracTracker Alliance Board of Directors
  • Phil Pritchard – Retired, Nature Conservancy et al  & FracTracker Alliance Board of Directors

Award Recipients

In the end, in what were admitted to be very difficult decisions, three winners were chosen.

Dory Hippauf, Therese Vick, and Craig Stevens became the first recipients of the Community Sentinel Awards for Environmental Stewardship. Let’s make the ground shake with seismic applause! In the weeks to come, FracTracker plans to highlight each of these conservation heroes, sharing their experiences and inspiring others.

The Community Sentinels will be duly recognized at a FracTracker Film Night event in Mechanicsburg, PA on Saturday evening, September 12 where they will receive very special artisan-made awards fit for proud display. If you can, please join us for this celebration.

[ticket sales closed]

I’m gratified for the chance to meet and honor these dedicated individuals and lift up the names of all the nominees. I also appreciate the time and thoughtfulness of the nominators who presented such worthy candidates. While this was the inaugural year for the Sentinel Awards, we intend to give them annually and continue to affirm the good performed by good people in communities near and far.