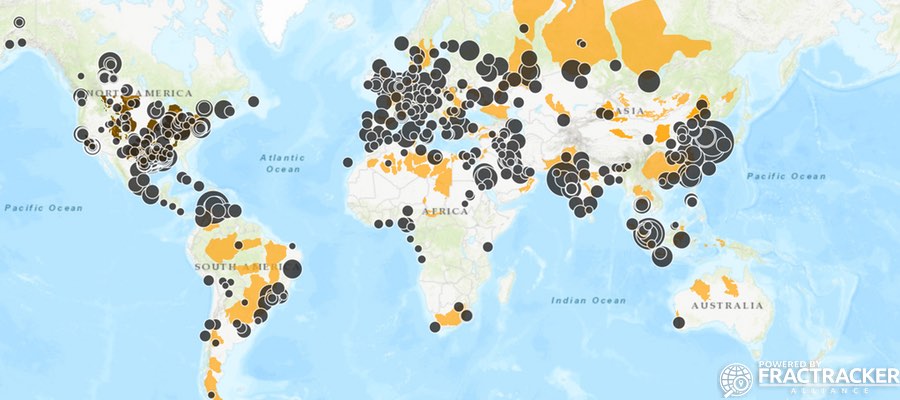
Potential Conflict Hotspots and Global Productivity Choke Points
Today, FracTracker is releasing a complete inventory of all 536 global oil refineries, along with estimates of daily capacity, CO2 emissions per year, and various products. These data have also been visualized in the map below.
Total productivity from these refineries amounts to 79,372,612 barrels per day (BPD) of oil worldwide, according to the data we were able to compile. However, based on the International Energy Agency, global production is currently around 96 million BPD, which means that our capacity estimates are more indicative of conditions between 2002 and 2003 according to BP’s World Oil Production estimates. We estimate this disparity is a result of countries’ reluctance to share individual refinery values or rates of change due to national security concerns or related strategic reasons.
Assuming the planet’s 7.6 billion people emit 4.9-5.0 metric tons per capita of CO2 per year, emissions from these 536 refineries amounts to the CO2 emissions of 52-57 million people. If you include the facilities’ methane and N2O emissions, this figure rises to 61-66 million people equivalents every year, essentially the populations of the United Kingdom or France.
Across the globe, countries and companies are beginning to make bold predictions about their ability to refine oil.
Nigeria, for example, recently claimed they would be increasing oil refining capacity by 13% from 2.4 to 2.7 million BPD. Currently, however, our data indicate Nigeria is only producing a fraction of this headline number (i.e., 445,000 BPD). The country’s estimates seem to be more indicative of conditions in Nigeria in the late 1960s when oil was first discovered in the Niger Delta. Learn more.
Is investing in – and doubling down on – oil refining capacity a smart idea for Nigeria’s people and economy, however? At this point, the country’s population is 3.5 times greater than it was in the 60’s and is growing at a remarkable rate of 2.7% per year. Yet, Nigeria’s status as one of the preeminent “Petro States” has done very little for the majority of its population – The oil industry and the Niger Delta have become synonymous with increased infant mortality and rampant oil spills.
Sadly, the probability that the situation will improve in a warming – and more politically volatile – world is not very likely.
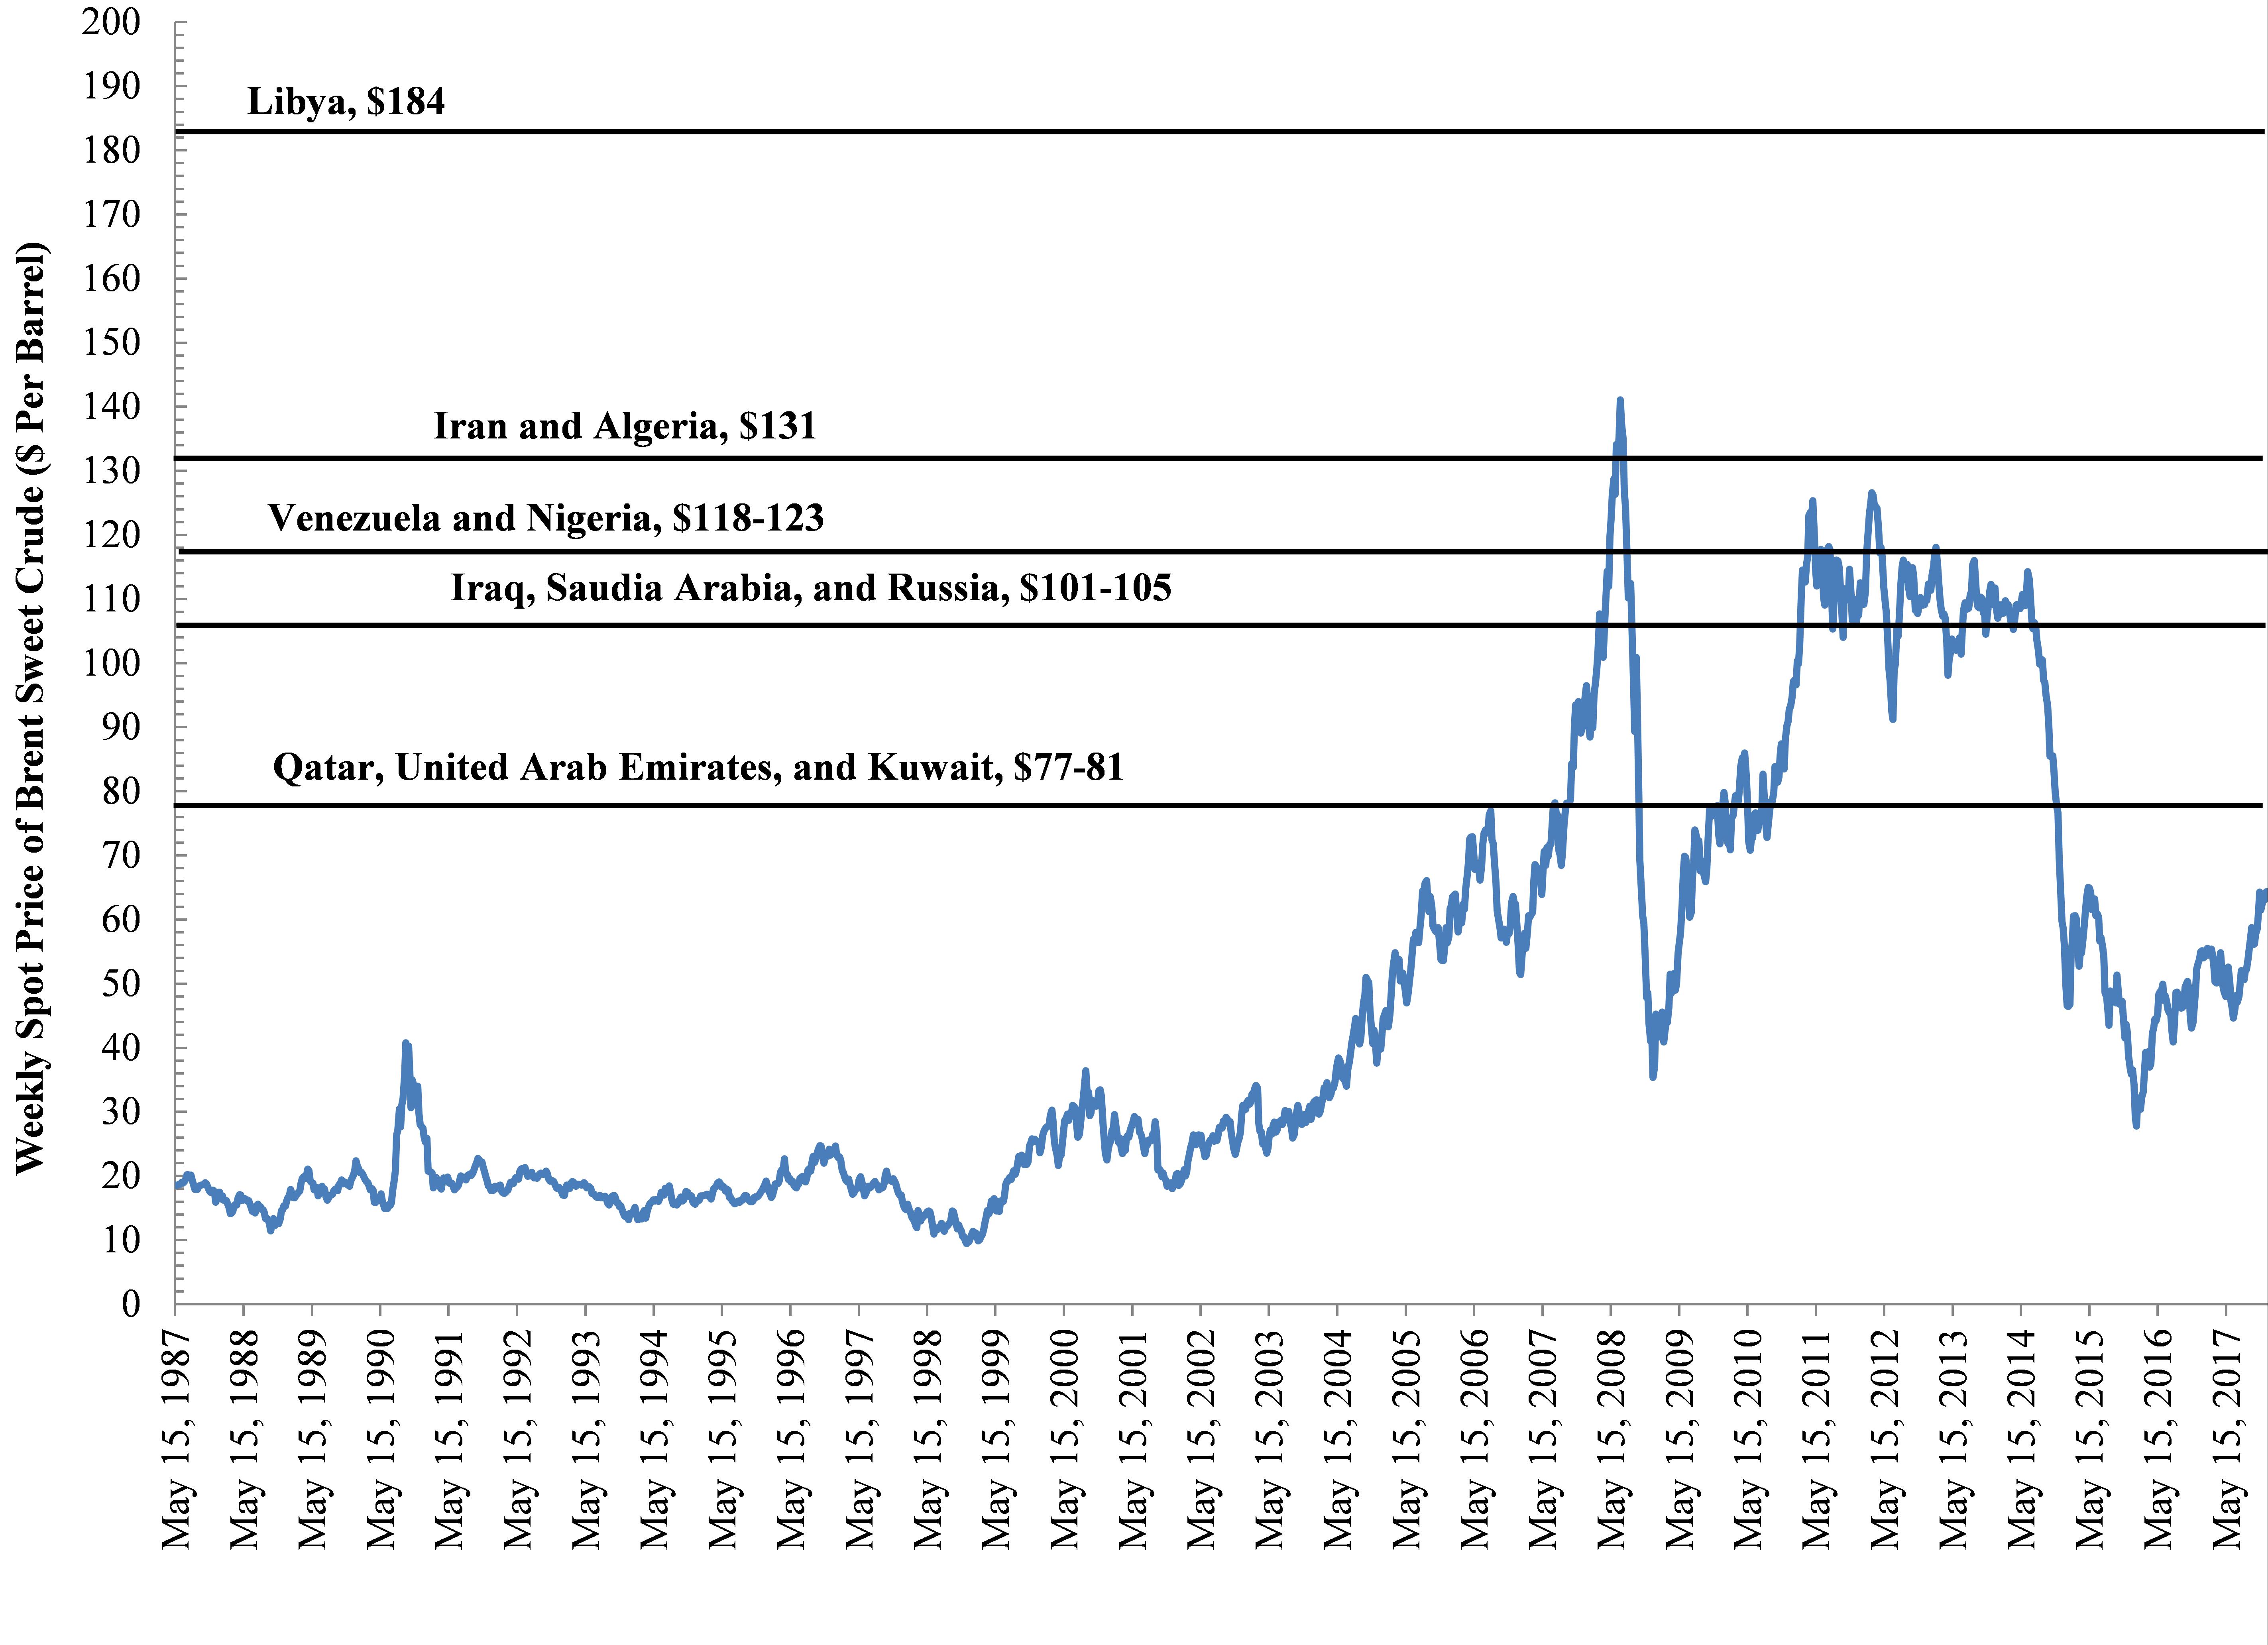
Such a dependency on oil price has been coupled to political instability in Nigeria, prompting some to question whether the discovery of oil was a cure or a curse given that the country depends on oil prices – and associated volatility – to balance its budget: Of all the Organization of Petroleum Exporting Countries (OPEC) countries, Nigeria is near the top of the list when it comes to the price of oil the country needs to balance its budget – Deutsche Bank and IMF estimate $123 per barrel as their breaking point. This is a valuation that oil has only exceeded or approached 4.4% of the time since 1987 (See Figure 2).
Former Central Bank of Nigeria Governor, Charles Soludo, once put this reliance in context:
… For too long, we have lived with borrowed robes, and I think for the next generation, for the 400 million Nigerians expected in this country by the year 2050, oil cannot be the way forward for the future.
Other regions are also at risk from the oil market’s power and volatility. In Libya, for example, the Ras Lanuf oil refinery (with a capacity of 220,000 BPD) and the country’s primary oil export terminal in Brega were the focal point of the Libyan civil war in 2011. Not coincidentally, Libya also happens to be the Petro State that needs the highest per-barrel price for oil to balance its budget (See Figure 2). Muammar Gaddafi and the opposition, National Transitional Council, jostled for control of this pivotal choke point in the Africa-to-Europe hydrocarbon supply chain.
The fact that refineries like these – and others in similarly volatile regions of the Middle East – produce an impressive 10% (7,166,900 BPD) of global demand speaks to the fragility of these Hydrocarbon Industrial Complex focal points, as well as the planet’s fragile dependence on fossil fuels going forward.
Figure 2. Weekly Spot Price of Brent Sweet Crude ($ Per Barrel) and estimates of the prices OPEC/Petro States need to balance their budgets.
Dividing Neighbors
These components of the fossil fuel industry, and their associated feedstocks and pipelines, will continue to divide neighbors and countries as political disenfranchisement and inequality grow, the climate continues to change, and resource limitations put increasing stress on food security and watershed resiliency worldwide.
Not surprisingly, every one of these factors places more strain on countries and weakens their ability to govern responsibly.
Thus, many observers speculate that these factors are converging to create a kind of perfect storm that forces OPEC governments and their corporate partners to lean even more heavily on their respective militaries and for-profit private military contractors (PMCs) to prevent social unrest while insuring supply chain stability and shareholder return.[2,3] The increased reliance on PMCs to provide domestic security for energy infrastructure is growing and evolving to the point where in some countries it may be hard to determine where a state’s sovereignty ends and a PMC’s dominance begins – Erik Prince’s activities in the Middle East and Africa on China’s behalf and his recent aspirations for Afghanistan are a case in point.
To paraphrase Mark Twain, whiskey is for drinking and hydrocarbons are for fighting over.
The international and regional unaccountability of PMCs has added a layer of complexity to this conversation about energy security and independence. Countries such as Saudi Arabia and Venezuela provide examples of how fragile political stability is, and more importantly how dependent this stability is on oil refinery production and what OPEC is calling ‘New Optimism.’ To be sure, PMCs are playing an increasing role in political (in)stability and energy production and transport. Since knowledge and transparency are essential for peaceful resolutions, we will continue to map and chronicle the intersections of geopolitics, energy production and transport, social justice, and climate change.
By Ted Auch, Great Lakes Program Coordinator, FracTracker Alliance; and Bryan Stinchfield, Associate Professor of Organization Studies, Department Chair of Business, Organizations & Society, Franklin & Marshall College
Assuming a tons of CO2 to barrels of oil per day ratio of 8.99 to 9.78 tons of CO2 per barrel of oil based on an analysis we’ve conducted of 146 refineries in the United States.
B. Stinchfield. 2017. “The Creeping Privatization of America’s Armed Forces”. Newsweek, May 28th, 2017, New York, NY.
R. Gray. “Erik Prince’s Plan to Privatize the War in Afghanistan”. The Atlantic, August 18th, 2017, New York, NY.
https://www.fractracker.org/a5ej20sjfwe/wp-content/uploads/2017/12/OilRefineries-Global-Feature.jpg400900Ted Auch, PhDhttps://www.fractracker.org/a5ej20sjfwe/wp-content/uploads/2021/04/2021-FracTracker-logo-horizontal.pngTed Auch, PhD2017-12-29 14:18:292021-04-15 15:02:03Tracking Global Oil Refineries and their Emissions
Decisions to drill or mine on public lands, however, are often extremely complicated.
By Allison M. Rohrs, Saint Francis University, Institute for Energy
The Commonwealth of Pennsylvania has historically been, and continues to be, home to an abundant array of energy resources like oil, gas, coal, timber, and windy ridgetops. Expectedly, these natural resources are found both on publicly and privately held land.
In Pennsylvania, the bulk of public lands are managed by two separate state agencies: The Department of Conservation and Natural Resources (DCNR), which manages the state’s forest and park system, and the Pennsylvania Game Commission (PGC), which manages the state’s game lands. Both of these state agencies manage oil, gas, and coal extraction as well as timbering on state property. Interestingly, neither of the agencies have utility-scale renewable energy generation on their land.
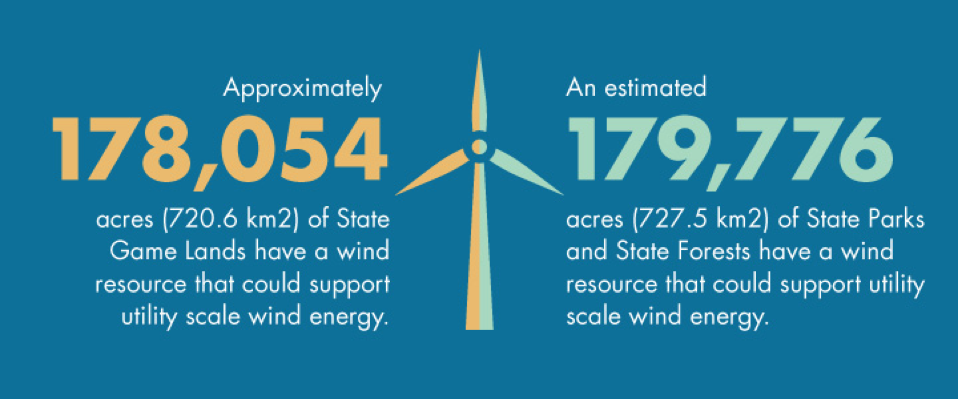
Some of Pennsylvania’s best wind resources can be found on the mountain ridges in the Commonwealth’s state forests and game lands, however, all proposals to build utility-scale wind farms have been denied by state agencies.
(Note: there are other state and federal agencies managing lands in PA, however, we focused our research on these two agencies specifically.)
Surprised to see that state lands have been greatly developed for different fossil industries but denied for wind energy, The Institute for Energy set out on a yearlong endeavor to collect as much information as we could about energy development on PA public lands. Using formal PA Right to Know requests, we worked with both DCNR and PGC to examine development procedures and management practices. We reviewed hundreds of available state agency reports, scientific documents, and Pennsylvania energy laws and regulations. We also worked with FracTracker Alliance to develop interactive maps that depict where energy development has occurred on state lands.
After a comprehensive review, we realized, like so much in life, the details are much more complicated than a simple yes or no decision to develop an energy project on state lands. Below is a brief summary of our findings, organized by energy extraction method:
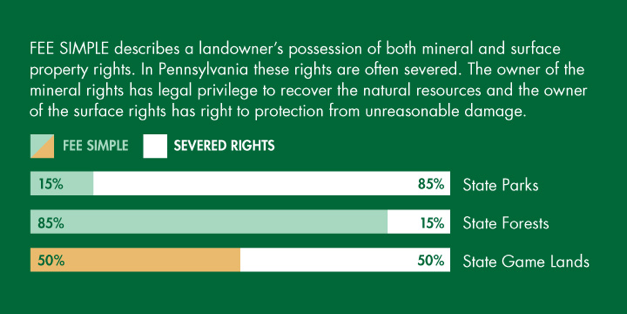
Land/Mineral Ownership in Pennsylvania
One of the most significant issues to understand when discussing energy resources on state lands is the complexity of land ownership in Pennsylvania. In many instances, the development of an energy resource on publicly owned land is not a decision, but instead an obligation. In Pennsylvania, property rights are often severed between surface and subsurface ownership. In many cases, surface owners do not own the mineral rights beneath them, and, by PA law, are obligated to allow reasonable extraction of such resource, whether it be coal, oil, or gas. In Pennsylvania, approximately 85% of state park mineral rights are owned by someone other than the Commonwealth (severed rights).
Legal Authority to Lease
It is critical to note that DCNR and PGC are two entirely separate agencies with different missions, legal structures, and funding sources. This plays a significant role in decisions to allow oil, gas, and coal development on their properties. Both agencies have explicit legal authority under their individual statutes that allow them to lease the lands for mineral extraction. This becomes more of an issue when we discuss wind development, where legal authority is less clear, particularly for DCNR.
Oil and Gas Extraction
Oil and gas wells have been spudded on state parks, state forests, and state game lands. The decision to do so is multifaceted and ultimately decided by three major factors:
Mineral ownership of the land,
Legal authority to lease the land, and
Potential impacts to the individual agency.
There is currently a moratorium on new surface leases of DCNR Lands. Moratoriums of such nature have been enacted and removed by different governors since 2010. Although there are no new lease agreements, extraction and production is still occurring on DCNR land from previously executed lease agreements and where the state does not own the mineral rights.
The Game Commission is still actively signing surface and non-surface use agreements for oil and gas extraction when they determine the action is beneficial to achieving their overall mission.
Revenues from the oil and gas industry play a significant role in the decision to drill or not. Both agencies have experienced increasing costs and decreasing revenues, overall, and have used oil and gas development as a way to bridge the gap.
Funds raised from DCNR’s oil and gas activities go back to the agency’s conservation efforts, although from 2009 to 2017, the State Legislature had directed much of this income to the state’s general fund to offset major budget deficits. Just this year, the PA Supreme Court ruled against this process and has restored the funds back to DCNR for conservations purposes.
All revenues generated from oil and gas development on state game lands stays within the Game Commission’s authority.
Along with positive economic benefits, there remains potential health and environmental risks unique to development on these public lands. Some studies indicate that users of these public lands could have potential exposure to pollution both in the air and in the water from active oil and gas infrastructure. The ease of public access to abandoned and active oil and gas infrastructure is a potential risk, as well. On the environmental side, many have argued that habitat fragmentation from oil and gas development is contradictory to the missions of the agencies. Both agencies have independent water monitoring groups specific to oil and gas activities as well as state regulated DEP monitoring. The potential negative effects on ground and surface water quality is an issue, however, mainly due the vast size of public lands and limited dwellings on these properties.
Use the map below to explore the PA state parks, forests, and game lands that have active oil and gas infrastructure.
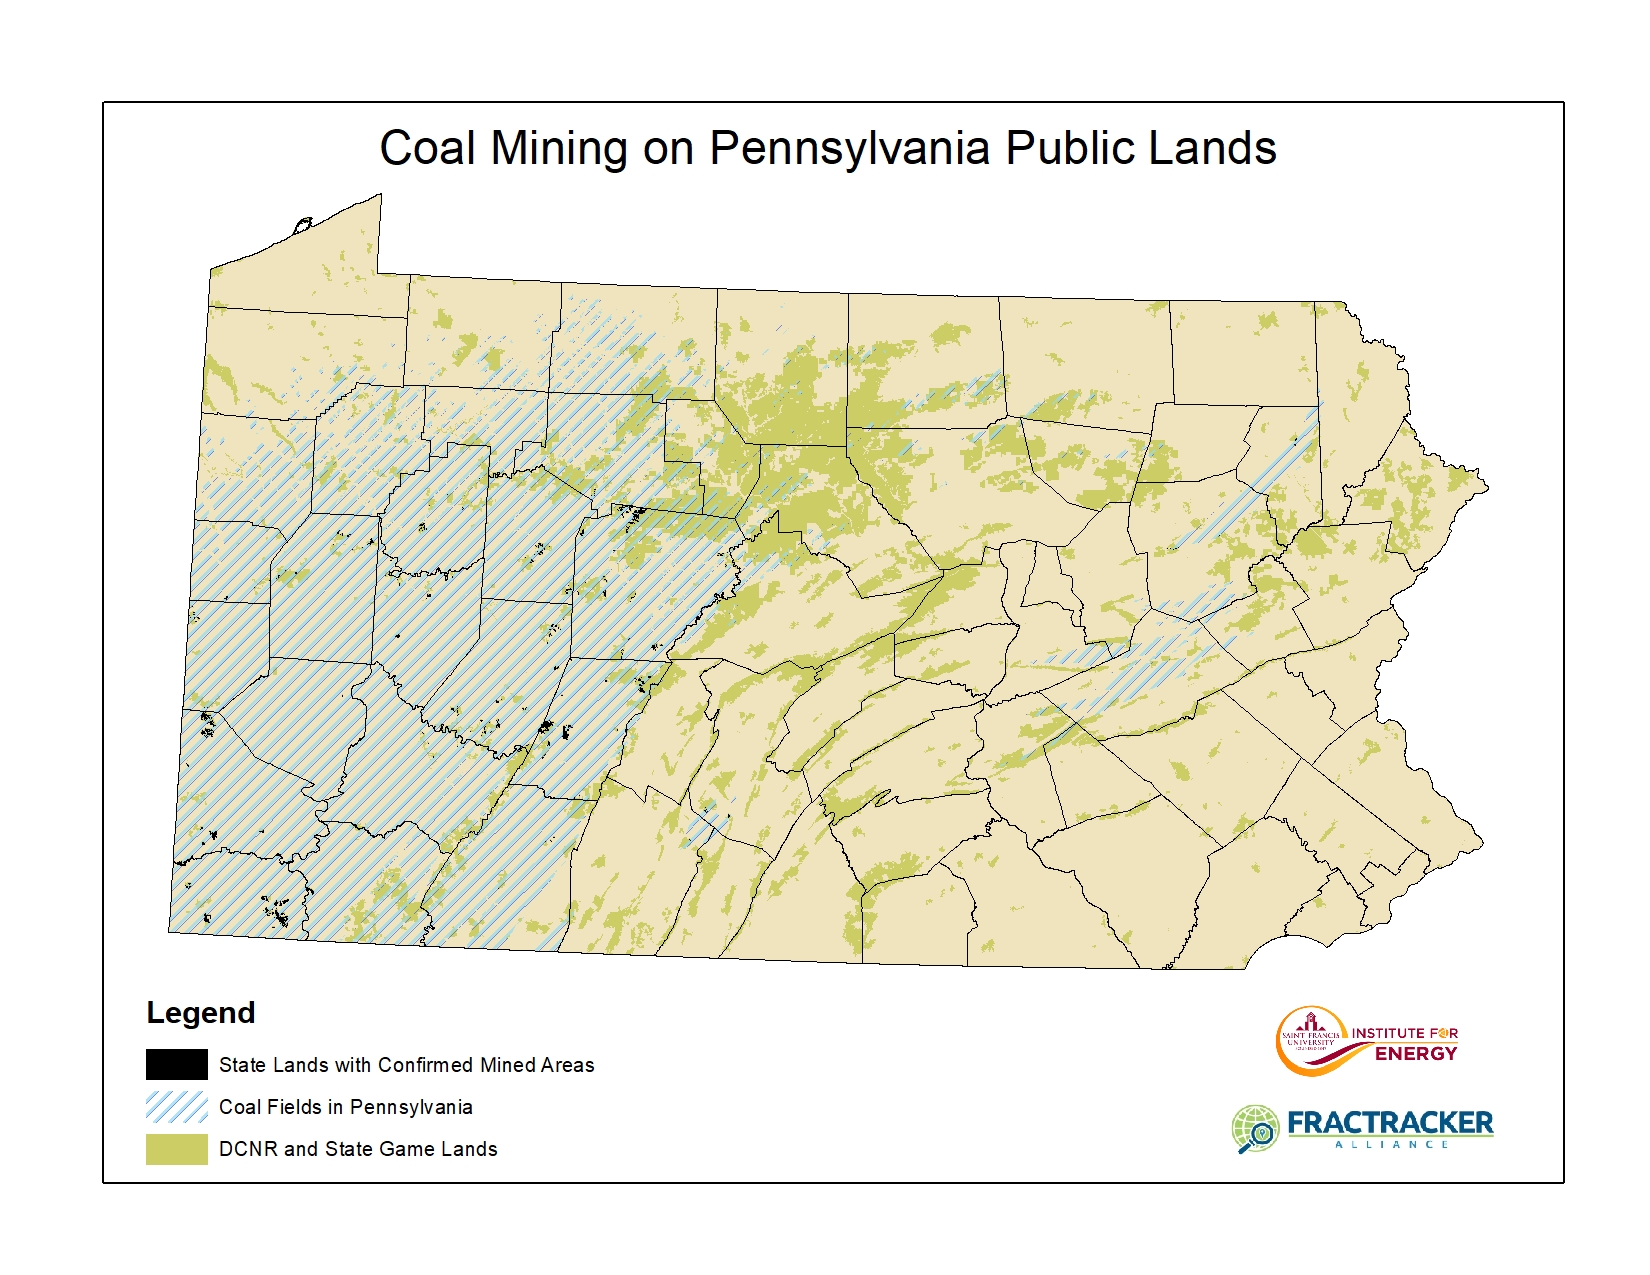
Thousands of acres of state forests and game lands have been mined for coal. Like oil and gas, this mineral is subject to similar fee simple ownership issues and is governed by the same laws that allow oil and gas extraction. DCNR, has not signed any virgin coal mining leases since the 1990s, but instead focuses on reclamation projects. There are coal mining operations, however, on forest land where DCNR does not own the mineral rights. The Game Commission still enters into surface and non-surface use agreements for mining.
In many circumstances, mining activity and abandoned mines were inherited by the state agencies and left to them to reclaim. Environmental and health impacts of mining specific to state land are generally attributed more to legacy mining and not to new mining operations.
Acid mine drainage and land subsidence has destroyed rivers and riparian habitats on these lands purposed for conservation.
The ease of public access and limited surveillance of public lands also makes abandoned mines and pits a dangerous health risk. Although threats to humans and water quality exist, abandoned mines have been noted for actually creating new bat habitat for endangered and threatened bat species.
Originally, we sought to quantify the total acreage of public lands affected by coal mining and abandoned mines; however, the dataset required to do so is not yet complete.
The Pennsylvania Department of Environmental Protection is currently in the process of digitizing over 84,000 hand drawn maps of mined coal seams in PA, an expected 15-year project.
Today, they have digitized approximately 30,000. The static map below demonstrates the areas with confirmed coal mining co-located on state lands:
Renewables
The discussion about renewable energy development in PA is almost as complex as the fossil industries. There are no utility-scale renewables on state owned land. Both DCNR and the Game Commission have been approached by developers to lease state land for wind development, however all proposals have been denied.
Even when DCNR owns the surface rights, they still cite the lack of legal authority to lease the land for wind, as their statute does not explicitly state “wind turbines” as a lawful lease option.
The Game Commission does have the legal authority to lease its land for wind development, but has denied 19 out of 19 requests by developers to do so, citing many environmental and surface disturbances as the primary reason.
The development of wind projects in PA has slowed in the past five years, with only one new commercial wind farm being built. This is due to a variety of reasons, including the fact that many of windiest locations on private lands have been developed.
We estimate that 35% of the state’s best wind resource is undevelopable simply because it is on public land.
Like all energy development, wind energy has potential environmental and health impacts, too. Wind could cause habitat fragmentation issues on land purposed for conservation. The wind energy industry also has realized negative effects on bird and bat species, most notably, the endangered Indiana bat. Health impacts unique to public lands and wind development include an increased risk of injury to hunters and recreators related to potential mechanical failure or ice throw off the blades. Unlike fossil energies, however, wind energy has potential to offset air emissions.
We estimate that wind development on PA public lands could offset and estimated 14,480,000 tons of CO2 annually if fully developed.
Commercial wind turbines are currently being installed at hub heights of 80-100 meters where the annual average wind resource is 6.5 m/s or greater. The following map demonstrates areas of Pennsylvania where the wind speeds are 6.5 m/s or greater at 100 meters, including areas overlapping state lands, where no utility scale development has occurred.
Biomass is organic material, such as wood, that is considered renewable because of its ability to be replenished. The harvesting of such wood (timber) occurs on both DCNR and PGC lands and provides funding for these agencies.
Small-scale wind, solar, hydro, geothermal, and biomass projects do exist on PA public lands for onsite consumption, however no renewables exist on a commercial or utility scale.
Both the fossil and renewable energy industries are forecasted to grow in Pennsylvania in the years to come. The complex decisions and obligations to develop energy resources on PA public lands should include thoughtful management and fair use of these public lands for all energy resources.
For more information and details, check out the entire comprehensive report on our website: www.francis.edu/energy.
This work was supported by The Heinz Endowments.
https://www.fractracker.org/a5ej20sjfwe/wp-content/uploads/2017/12/PA-State-Lands-Drilling-Lenker.jpg400900Guest Authorhttps://www.fractracker.org/a5ej20sjfwe/wp-content/uploads/2021/04/2021-FracTracker-logo-horizontal.pngGuest Author2017-12-19 11:42:542021-04-15 15:02:04Energy development is happening on your state lands, Pennsylvania
Often times it can be difficult to clearly communicate the impact that FracTracker has had on communities concerned about the impacts of the oil and gas industry, or the benefits the data we provide offer to researchers and journalists investigating the links between this activity and a variety of issues. As such, I will let these recent testimonials say it better – and more concisely – than I can:
I came across the FracTracker Alliance website and related maps about a month ago and have found them really useful in developing a new research project… In particular, the work on silica mining is really fascinating.
– G. Pickren, Chicago, IL
Thanks for all that FracTracker does… the Mariner East 2 spill map is so very helpful for small struggling grass roots groups like Lebanon Pipeline Awareness!
– A. Pinca, Annville, PA
Your work at the FracTracker Alliance is first-rate. Your presence on the panel brought your unique insights and experience to the audience in a truly meaningful way… You empowered and inspired those in attendance.
– D. Shields, Pittsburgh, PA
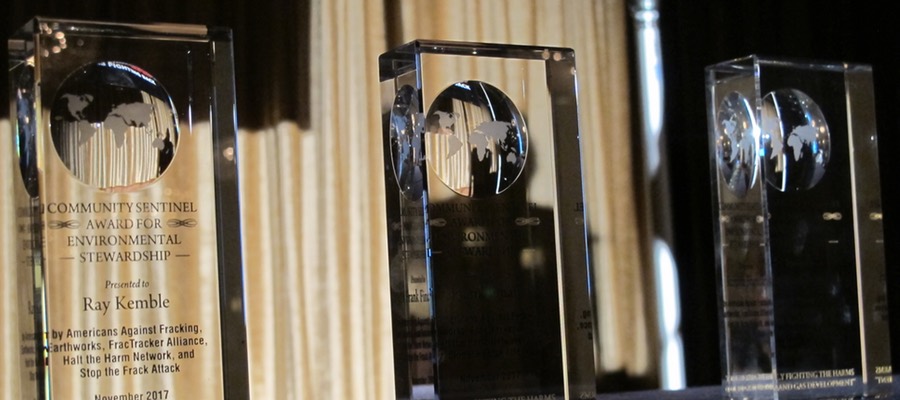
The Community Sentinel Award for Environmental Stewardship, launched in 2015, is awarded each year to three people who work to guard their communities from the harms of oil and gas development. Below is a reflection of the 2017 honorees and Community Sentinel Award Program held on November 18, 2017 in Pittsburgh, PA.
This year, 18 people were nominated by their peers to receive this distinguished award. These nominees were reviewed by a committee of community defense leaders (judges listed below). With the help of our Award Partners, we presented the 2017 Community Sentinel award to: Ranjana Bhandari, Frank Finan, and Ray Kemble. Each awardee received $1,000 to perpetuate their efforts.
The award ceremony, attended by ~300 people, was graciously emceed by David Braun of Rootskeeper. Recipients were introduced enthusiastically by Jennifer Krill of Earthworks, Ryan Clover-Owens of Halt the Harm Network, and Doug Shields of Food and Water Watch. After giving their very moving acceptance speeches, Ranjana, Frank, and Ray were then presented with their awards by acclaimed author and ecologist, Sandra Steingraber.
Community Sentinel Award Recipients
Ranjana Bhandari of TX, Photo by Julie Dermansky | DeSmogBlog
Ranjana Bhandari, though humble and quiet, is an outspoken advocate for clean air and water. When urban fracking came to her town, she took the initiative to form a grass roots organization. In 2017, she worked tirelessly for many months organizing a successful opposition to a proposed wastewater injection well that was to be installed on the banks of her town’s drinking water supply.
Frank Finan of PA
Frank Finan is an unsung hero of the Marcellus Shale, through both his work documenting emissions using his FLIR camera and his selfless donations of talent, skills, and labor when his neighbors are in need. He made it his mission to help families who were becoming ill from highly concentrated spikes of pollution.
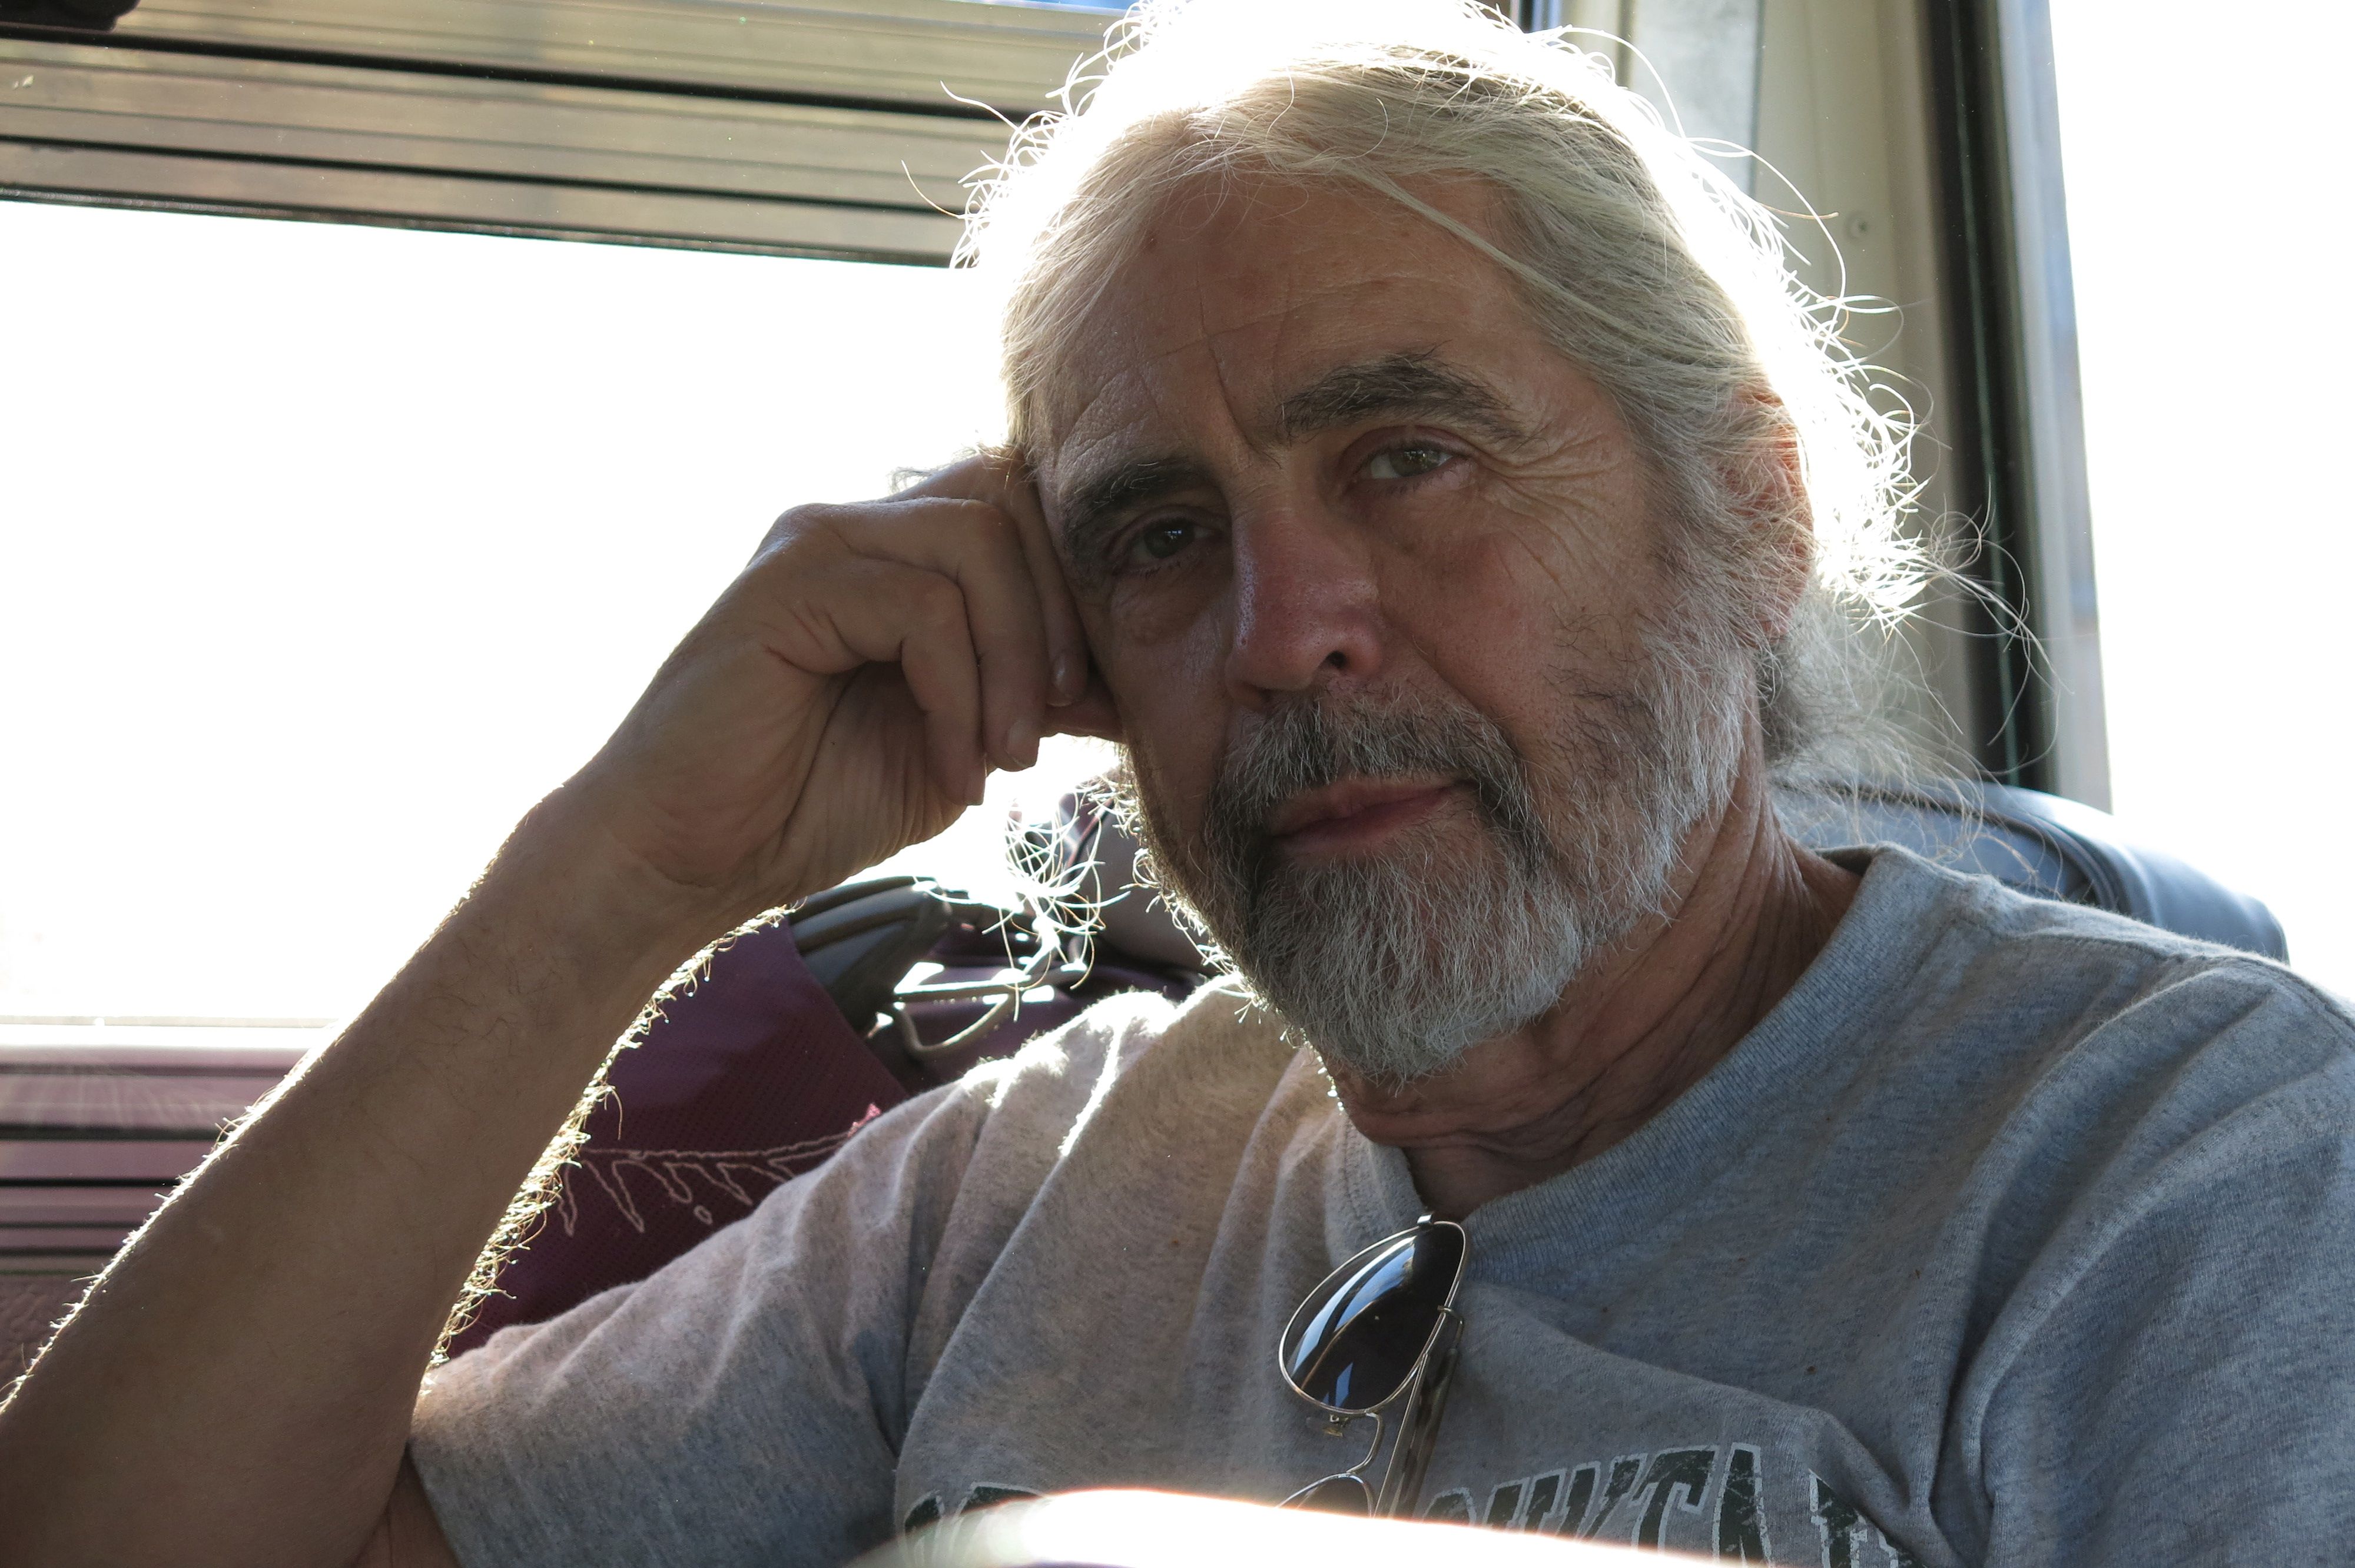
Ray Kemble of PA
Ray Kemble has been at the center of fighting fracking from day one as a resident of Dimock, Pennsylvania. Despite recently breaking has back and undergoing an operation for cancer, he will not be deterred from seeking justice for the harmed.
Legacy of Heroes Presentation
In addition to the Community Sentinels, we also recognized activists who could not be with us during a special Legacy of Heroes presentation. This presentation recognized the efforts of four people who valiantly fought against the harms of dirty energy but passed away in the last year: Walter Brasch of Pennsylvania, Rosemarie Braz of California, Jackie Dill of Oklahoma, and Kaye Fissinger of Colorado.
Walter Brasch, of Bloomsburg, Pennsylvania, was professor emeritus of mass communications and journalism at Bloomsburg University and an award-winning reporter and author who turned his attention to fracking when the boom overtook PA. His critically-acclaimed book, Fracking Pennsylvania: Flirting with Disaster, explored the controversies surrounding shale gas development in his home state.
From apartheid to the prison-industrial complex to climate change, Rose Braz fought injustice in all its many forms. An incredible strategist, facilitator and mentor, she led and inspired a generation of activists. As the Center for Biological Diversity’s Climate Campaign Director from 2009 until her death, and Co-founder of Californians Against Fracking, Rose worked passionately to protect people from fracking and dangerous drilling.
Jackie Dill described herself as a heritage wildcrafter, practicing and teaching others to use wild plants for food, spices, healing, and crafts. Oil and gas companies developed wells around her home, and fracking-induced earthquakes severely damaged it. Jackie was known for speaking out about these issues, with features in Time and Newsweek.
Kaye Fissinger, of Longmont, Colorado, was a force of nature. The effort she led to ban fracking via an historic ballot initiative attracted the attention of The New York Times and PBS, among other national media. A founding member of Americans Against Fracking, Kaye helped change the conversation about fracking.
On behalf of all of the award partners and sponsors, a heartfelt thank you goes out to these incredible advocates.
Courtney Williams – resistaim.org / resistspectra.org – Peekskill, NY
Leonard Zuza – Community Resident – Solomons, MD
** Indicates 2017 Award Recipient
Legacy of Heroes Remembrance
Walter Brasch of Pennsylvania
Jackie Dill of Oklahoma
Kaye Fissinger of Colorado
Rosemarie Braz of California
If there are additional community heroes who passed away this year that you would like us to list above, we would be happy to include them. Please email us: info@fractracker.org.
Judges
Bill Hughes of Wetzel County Action Group, West Virginia
Pat Popple of Save the Hills Alliance, Wisconsin
Sierra Shamer of Shalefield Organizing Committee, Pennsylvania
Dante Swinton of Energy Justice, Maryland
Niki Wong of Redeemer Community Partnership, California
Many thanks to the organizers and attendees of the People vs. Oil and Gas Infrastructure Summit, during which the Community Sentinel award ceremony was conducted.
https://www.fractracker.org/a5ej20sjfwe/wp-content/uploads/2017/11/CommunitySentinelAwards-Feature.jpg400900FracTracker Alliancehttps://www.fractracker.org/a5ej20sjfwe/wp-content/uploads/2021/04/2021-FracTracker-logo-horizontal.pngFracTracker Alliance2017-11-30 11:05:302021-04-15 15:02:05Reflections from the 2017 Community Sentinel Award Program
We live in a complex environment of local, regional, national, and international issues. We are constantly bombarded with a news cycle that regenerates at increasingly dizzying speeds. How can we possibly know what is truly important when hyped up twitter controversies clog up our news feeds?
In this quantity-over-quality culture, many of the most important issues and fights for civil rights and energy justice become casualties of a regression to ignorance.
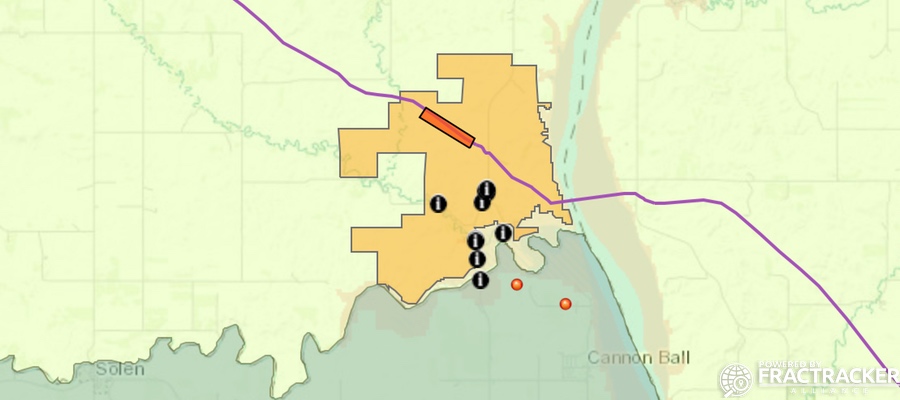
At FracTracker, we disagree with this tactic – especially as it relates to the protests at Standing Rock. FracTracker has previously written about these demonstrations (shown in the map above), and has also analyzed and mapped data on oil spills from pipelines in North Dakota. We will continue FracTracker’s coverage of Standing Rock and the Water Protectors who fought – and continue to fight – the Dakota Access Pipeline (DAPL), known as the Black Snake.
Following the Fight
For those unaware, the fight against the Dakota Access Pipeline operated by Energy Transfer Partners, continues. While the project was green-lighted by the Trump Administration and Bakken oil began flowing in June of 2017, the court has returned the permits to the U.S. Army Corps of Engineers. A U.S. District Court judge ruled that the initial approval of the pipeline did not undergo adequate study of its environmental consequences. The finding stated that the Army Corps provided a flawed model, inadequate for predicting the full impacts of a leak under Lake Oahe. The model does not consider what would happen in the event of a leak under the lake. It models only benzene — one of many toxic chemicals present in crude oil — and models its movement in an unrealistic manner. Energy Transfer Partners claims the model is conservative, but it massively underestimates the potential impacts on human health and wildlife. The Army Corps provides no plan to contain an underground leak or clean contaminated soil and groundwater under Lake Oahe.
On a related note, DAPL’s parent company, Energy Transfer Partners, said in a recent annual report that it may not have sufficient liquid assets to finance a major cleanup project and would likely pass those costs onto local landowners and federal taxpayers. Energy Transfer Partners has since filed a racketeering lawsuit seeking $300 million in damages from the Red Warrior Camp at Standing Rock.
… the agency could simply revise or update its environmental review and again conclude that no EIS (environmental impact statement) is required. If that happens, additional legal challenges are likely. The Tribe believes this court decision should trigger a full EIS, including consideration of route alternatives, just as the Obama administration proposed in December.
Normally, when a permit is issued in violation of the National Environmental Protection Act (NEPA), operations are suspended, which would have forced the DAPL to shut down while the review is conducted. Contrary to the usual protocol, on October 11, 2017 a federal judge ruled that the pipeline will remain operational pending the environmental review by the Army Corps. Standing Rock Sioux Chairman Dave Archambault II has said in a statement, however, “Just because the oil is flowing now doesn’t mean that it can’t be stopped.”
More Information and Resources
The Lakota People’s Law Project (LPLP) has been a resource to Lakota country – an area comprised of nine Indian reservation in North and South Dakota – since 2004. The LPLP supports a number of campaigns including divestment and energy justice, and has published several reports:
Special thanks to the Lakota People’s Law Project and Rachel Hallett-Ralston for the information provided.
In January of 2017, 76 Water Protectors including Chase Iron Eyes were arrested on land granted to the Standing Rock Lakota Sioux Tribe under the 1851 Treaty of Fort Laramie. Chase Iron Eyes, Lead Counsel of the Lakota People’s Law Project, has been charged with felony incitement to riot and misdemeanor criminal trespass. In the interview above, Chase Iron Eyes discusses his involvement with Standing Rock and the political pressures to make an example out of him. Read the Lakota People’s Law Project petition here.
By Kyle Ferrar, Western Program Coordinator, FracTracker Alliance
In October, Al Gore’s Climate Reality Project invigorated Pittsburgh like an autumn breeze. Never before had 1,400 people assembled in the region for the shared purpose of solving the climate crisis. The ground almost shook from the positive energy. It was induced seismicity of a better kind.
About the Climate Reality Project
The event occupied the David Lawrence Convention Center, a LEED Platinum facility providing the ultimate venue for a training session about saving our planet. The Nobel Laureate and former Vice President, joined by notable scientists, dignitaries, and communication experts, peppered three-days with passion and insight. The participants – who had to complete a rigorous application to attend – came from Pennsylvania, other states, and other countries. Their backgrounds were as diverse as their geographic origins. Seasoned activists were joined by faith leaders, students, educators, researchers, philanthropists, public health professionals, and business persons. A deep concern about humanity’s future was the common bond.
Together, we comprised the largest Climate Leadership Corps class ever. There are now more than 13,000 well-prepared voices speaking truth to power around the world to accelerate clean energy and foster sustainability. The ranks will continue to rise.
Unequivocal facts and figures affirmed that time is running out unless we expedite our energy transition. Most people don’t question gravity, but some question climate change despite scientific certainty about both. Jumping off a cliff is deadly and so is leaping off the metaphorical cliff of denial. When it comes to these issues, we were taught to find and focus on shared values. Everyone, even the cynic, cares about a person, place, or thing that will be irrevocably affected by man-made climate chaos.
Good for the planet, people, and jobs
Everyone needs a job, and embracing renewables and building smart, efficient energy systems creates a lot of them. In the U.S., solar energy jobs are growing 17 times faster than the overall economy.[1] Today, there are over 2.6 million Americans employed in the solar, wind, and energy efficiency sectors.[2] These safe, well-paying positions will continue to grow over time, but they’ll grow faster if government at every scale accelerates the new economy with supportive policies, programs, decisions and resources. In the process, we’ll build wealth and opportunity. If we don’t do what’s needed and its fossil fuel business as usual, we’ll have polluted air, sickened landscapes, and an economy in decline.
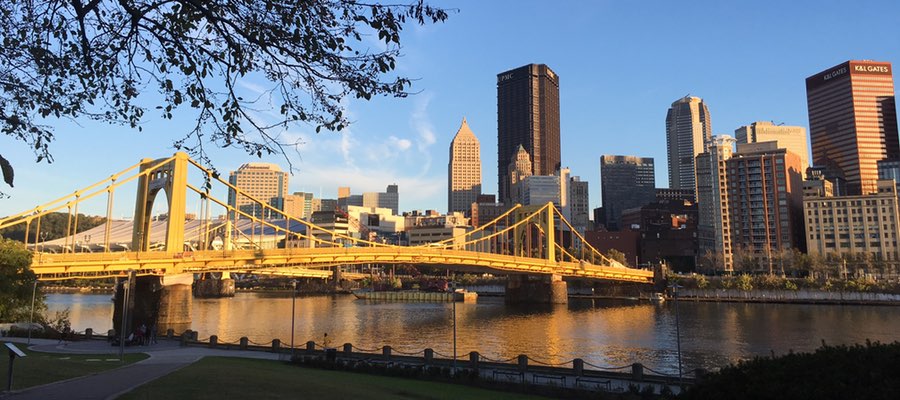
Hope – a bridge to somewhere better
On the afternoon that training ends, the weather is unusually warm and has been for days, another reminder that normal is long gone. Hope fills the void. I walk the Rachel Carson Bridge, named for the conservation giant who warned of the dangers of putting unfettered profit before the good of people and nature. Atop her bridge, wind turbines whirl, whispering intelligent tidings to all who will listen.
If you’d like to schedule a hope-filled climate reality project presentation in your community, please contact us at info@fractracker.org
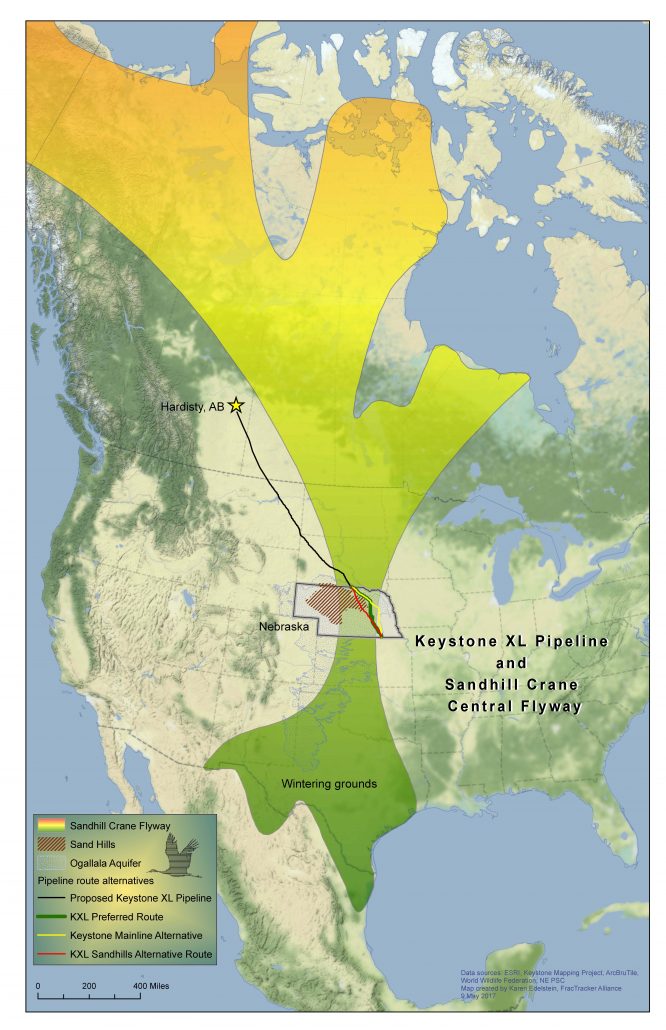
When we hear his call, we hear no mere bird. We hear the trumpet in the orchestra of evolution. He is the symbol of our untamable past, of that incredible sweep of millennia which underlies and conditions the daily affairs of birds and men…” ~ Aldo Leopold, on the Sandhill Crane, in “Marshland Elegy”
Dilbit – or diluted bitumen – is refined from the naturally-occurring tar sands deposits in Alberta, Canada. In March 2017, I applied to the Nebraska Public Service Commission for standing as an intervenor in the Commission’s consideration of TransCanada’s request for a permit to construct a pipeline transporting dilbit – a project referred to as the Keystone XL pipeline. Below are my reflections on the battle against the permitting process, and how FracTracker’s maps ensured the Sandhill Crane’s voice made it into public record.
A Pipeline’s History
The Keystone 1 pipeline carries the dilbit from Alberta, to Steele City, Nebraska, and ultimately to Port Arthur, Texas and export refineries along the Gulf Coast. The state of Montana had already approved the Keystone XL project, as had the state of South Dakota. The decision of the South Dakota Public Utilities Commission was appealed, however, and has now worked its way to the South Dakota Supreme Court, where it is pending.
Resistance to TransCanada’s oil and gas infrastructure projects is not new. Beginning in 2010, some Nebraska farmers and ranchers joined forces with tribal nations in the Dakotas, who were also fighting TransCanada’s lack of proper tribal consultation regarding access through traditional treaty territory. The indigenous nations held certain retained rights as agreed in the 1868 Fort Laramie Treaty between the United States government and the nine tribes of the Great Sioux Nation. The tribes were also protesting TransCanada’s flaunting of the National Historic Preservation Act’s protections of Native American sacred sites and burial grounds. Further, although TransCanada was largely successful in securing the easements needed in Nebraska to construct the pipeline, there were local holdouts refusing to negotiate with the company. TransCanada’s subsequent attempts to exercise eminent domain resulted in a number of lawsuits.
In January of 2015, then-President Barack Obama denied the international permit TransCanada needed. While that denial was celebrated by many, everyone also understood that a new president could well restore the international permit. Indeed, as one of his first actions in January 2017, the new Republican president signed an executive order granting the permit, and the struggle in Nebraska was reignited.
“What Waters Run Through My Veins…”
While I am a long-time resident of New York, I grew up in the Platte River Valley of South Central Nebraska, in a town where my family had and continues to have roots – even before Nebraska became a state. There was never a question in my mind that in this particular permitting process I would request status as an intervenor; for me, the matter of the Keystone XL Pipeline went far beyond the legal and political and energy policy questions that were raised and were about to be considered. It was about who I am, how I was raised, what I was taught, what waters run through my veins as surely as blood, and who my own spirit animals are, the Sandhill Cranes.
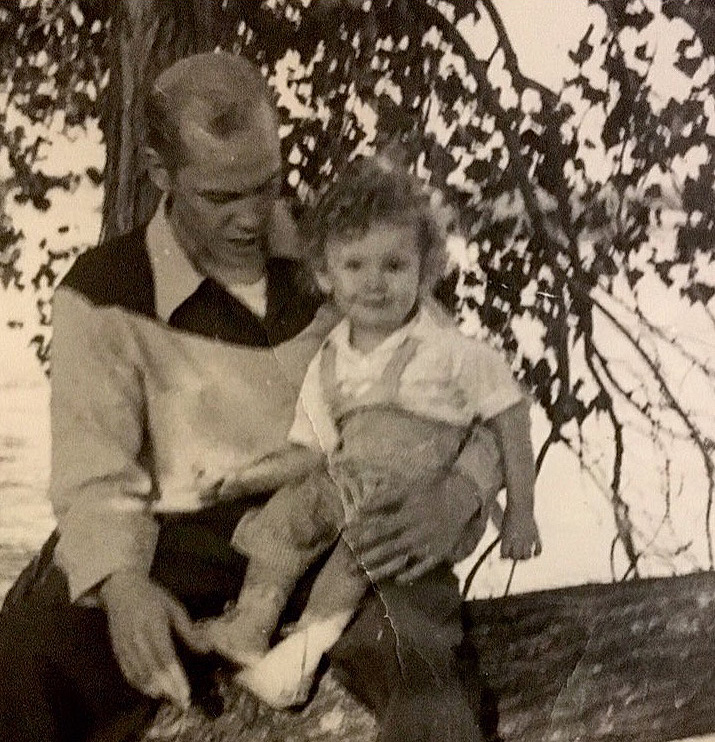
Bardaglio (age 3) and her father, along the banks of the Platte River
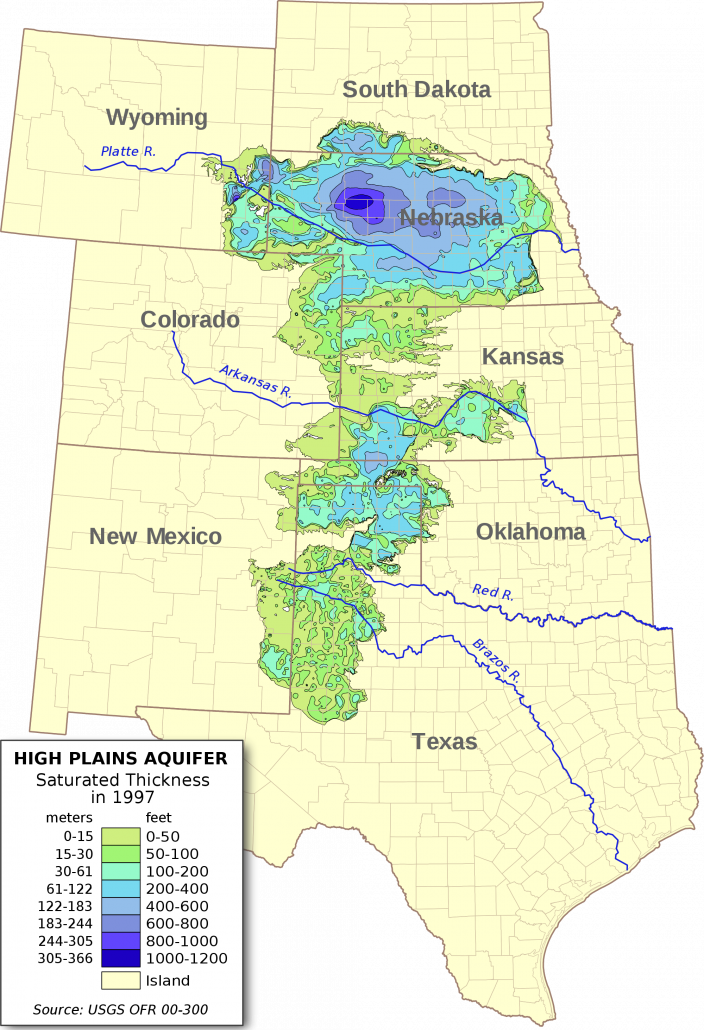
When we were growing up, our father told us over and over and over about why Nebraska was so green. The Ogallala Aquifer, he said, was deep and vast, and while eight states partially sat atop this ancient natural cistern, nearly all of Nebraska floated on this body. Nebraska was green, its fields stretching to the horizon, because, as our father explained, the snow runoff from the Rockies that flowed into our state and was used eleven times over was cleansed in water-bearing sand and gravel on its way to the Missouri on our eastern boundary, thence to the Mississippi, and finally to the Gulf.
I grew up understanding that the Ogallala Aquifer was a unique treasure, the largest freshwater aquifer in the world, the lifeblood for Nebraska’s agriculture and U.S. agriculture generally, and worthy of protection. I thought about the peril to the aquifer because of TransCanada’s plans, should there be a spill, and the additional threats an accident would potentially pose to Nebraska’s rivers, waterways and private wells.
The Ogallala Aquifer
Knowing that climate change is real, terrifying, and accelerating, I recognized that a warming world would increasingly depend on this aquifer in the nation’s midsection for life itself.
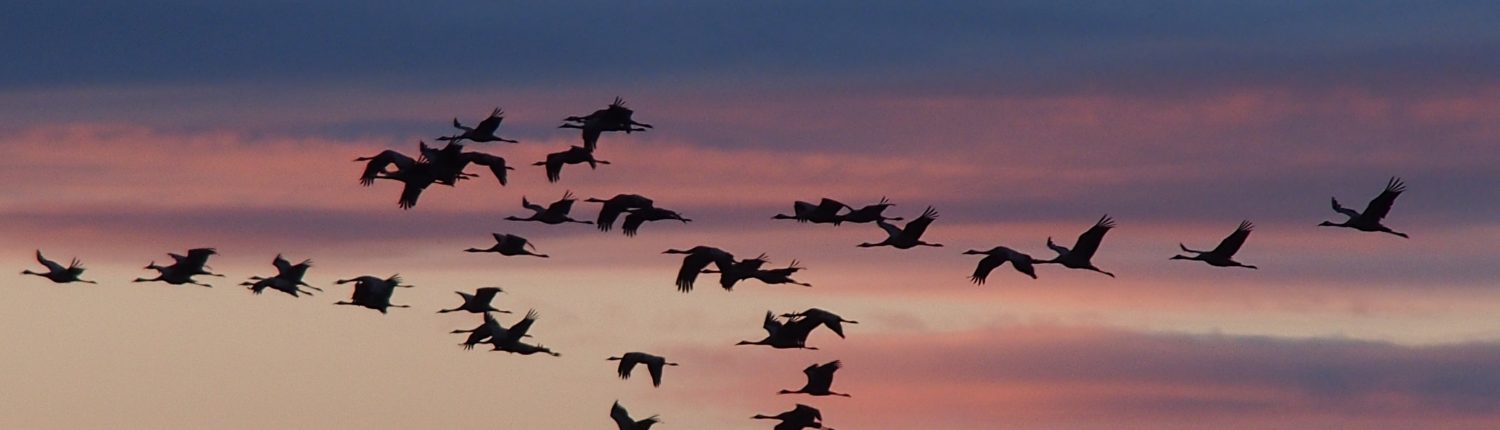
Migration of the Sandhill Cranes
As I thought about how I would fight the KXL, another narrative took shape rising out of my concern for the aquifer. Growing up in the South Central Platte River Valley, I – and I daresay most everyone who lives there – have been captivated by the annual migration of the Sandhill Cranes, plying the skies known as the Central Flyway. As sure as early spring comes, so do the birds. It may still be bitterly cold, but these birds know that it is time to fly. And so they do – the forward scouts appearing in winter grey skies, soon followed by some 500,000 – 600,000 thousand of them, darkening the skies, their cries deafening and their gorgeous archaeopteryx silhouettes coming in wave after wave like flying Roman Legions.
To this day, no matter where I am, the first thing in my sinews and bones when winter begins to give way is the certainty that the birds are coming, I feel them; they are back. They are roosting on the sandbars in the braided river that is the Platte and gleaning in the stubbled fields abutting it… they are home.
Scientists estimate that at least one-third of the entire North American population of Sandhill Cranes breed in the boreal forest of Canada and Alaska…
Scientists estimate that approximately 80 percent of all Sandhill Cranes in North America use a 75-mile stretch of Nebraska’s Platte River during spring migration. From March to April, more than 500,000 birds spend time in the area preparing for the long journey north to their breeding grounds in Canada and Alaska. During migration, the birds may fly as much as 400 miles in one day.
Sandhill Cranes rely on open freshwater wetlands for most of their lifecycle. Degradation of these kinds of wetland habitats is among the most pressing threats to the survival of Sandhill Cranes. (Emphasis added)
Giving Sandhill Cranes a Voice
But how could I make the point about the threat TransCanada posed to the migratory habitat of the Sandhill Cranes (and endangered Whooping Cranes, pelicans, and hummingbirds among the other thermal riders who also migrate with them)? Books, scientific papers, lectures – all the words in the world – cannot describe this ancient rite, this mysterious primal navigation of the unique pathway focusing on this slim stretch of river, when viewed from a global perspective a fragile skein in a fragile web in a biosphere in peril.
In my head I called it a river of birds in the grassland of sky. And I am so grateful to my friend, Karen Edelstein at FracTracker Alliance, for her willingness to help map and illustrate the magnificence of the migration flyway in the context of the three proposed options for the KXL pipeline.
Karen prepared two maps for me, but my favorite is the one above.
It shows an ancient, near-primordial, near-mystical event. Guided by rudders and instinct we can barely comprehend, in concert with earth’s intrinsic and exquisitely-designed balance, and as certain as a sunrise, a sunset or a moon rise, these oldest of crane species find their ways through the heavens. They hew to certainties that eclipse the greed of multinational corporations like TransCanada, who barely even pay lip service to the integrity of anything over which they can’t exert dominion. To say they don’t respect the inherent rights of species other than our own, or to ecological communities that don’t directly include us, is an understatement, and a damning comment on their values.
I was prepared for pushback on these maps from TransCanada. And in truth, the company was successful in an in limine motion to have certain exhibits and parts of my testimony stricken from the official record of the proceedings.
But not the maps.
In fact, too many other intervenors to count, as well as several of the lawyers involved in the proceedings commented to me on the beauty and accuracy of the maps. And not only are they now a part of the permanent record of the Nebraska Public Service Commission, should there be an appeal (which all of us expect), on both sides of the issue, there is a very good possibility they will be incorporated into the formal testimonies by the lawyers as the matter moves through the appeals process.
Taking Action, Speaking Out
Ordinary citizens must figure out how to confront the near-impenetrable stranglehold of multi-national corporations whose wealth is predicated on the continuance of fossil fuels as the primary sources of energy. We have had to become more educated, more activist, and more determined to fight the destruction that is now assured if we fail to slow down the impacts of climate change and shift the aggregate will of nations towards renewable energy.
Many activists do not realize that they can formally intervene at the state level in pipeline and infrastructure permitting processes. In doing so, the voice of the educated citizen is amplified and becomes a threat to these corporations whose business models didn’t account for systematic and informed resistance in public agencies’ heretofore pro forma proceedings. The publicly-available documents and filings from corporations can be important tools for “speaking truth to power” when paired with the creative tools born of necessity by the environmental movement.
Technology is value-neutral, but as I learned – as did many others in the Keystone XL Pipeline fight – in skilled hands it becomes a weapon in the struggle for the greater good.
I will be forever grateful for FracTracker, and will be interested to see how others use this tool in the fights that are sure to come.
EXCELSIOR!
For more background on the natural history of Sandhill Cranes, please view this video produced by The Crane Trust.
Wrexie Bardaglio is a Nebraska native living in Covert, New York. She worked for ten years for a member of Congress as a legislative assistant with a focus on Indian affairs and for a DC law firm as legislative specialist in Indian affairs. She left politics to open a bookstore in suburban Baltimore. She has been active in the Keystone XL fights in Nebraska and South Dakota and in fracking and gas infrastructure fights in New York.
This article’s feature image of a Sandhill Crane is the work of a U.S. Fish and Wildlife Service employee, taken or made as part of that person’s official duties. As a work of the U.S. federal government, the image is in the public domain.
FracTracker Alliance makes hundreds of maps, analyses, and photos available for free to frontline communities, grassroots groups, NGO’s, and many other organizations concerned about the industry to use in their oil and gas campaigns. To address an issue, you need to be able to see it.
However, we rely on funders and donations – and couldn’t do all of this without your help!
https://www.fractracker.org/a5ej20sjfwe/wp-content/uploads/2017/11/Sandhill-Crane-CreativeCommons-Feature.jpg400900Guest Authorhttps://www.fractracker.org/a5ej20sjfwe/wp-content/uploads/2021/04/2021-FracTracker-logo-horizontal.pngGuest Author2017-11-08 15:02:182021-04-15 15:02:07Giving Voice to the Sandhill Cranes: Place-based Arguments against Keystone XL
Oil and gas operators are polluting groundwater in Colorado, and the state and U.S. EPA are granting them permission with exemptions from the Safe Drinking Water Act.
FracTracker Alliance’s newest analysis attempts to identify groundwater risks in Colorado groundwater from the injection of oil and gas waste. Specifically, we look at groundwater monitoring data near Class II underground injection control (UIC) disposal wells and in areas that have been granted aquifer exemptions from the underground source of drinking water rules of the Safe Drinking Water Act (SDWA). Momentum to remove amend the SDWA and remove these exemption.
Aquifer exemptions are granted to allow corporations to inject hazardous wastewater into groundwater aquifers. The majority, two-thirds, of these injection wells are Class II, specifically for oil and gas wastes.
The results of this assessment provide insight into high-risk issues with aquifer exemptions and Class II UIC well permitting standards in Colorado. We identify areas where aquifer exemptions have been granted in high quality groundwater formations, and where deep underground aquifers are at risk or have become contaminated from Class II disposal wells that may have failed.
Of note: On March 23, 2016, NRDC submitted a formal petition urging the EPA to repeal or amend the aquifer exemption rules to protect drinking water sources and uphold the Safe Drinking Water Act. Learn more
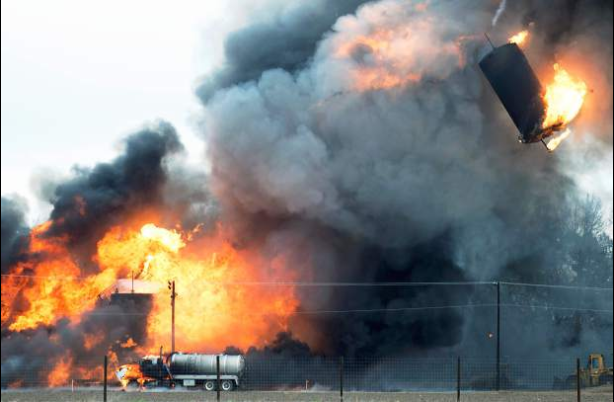
Research shows injection wells do fail
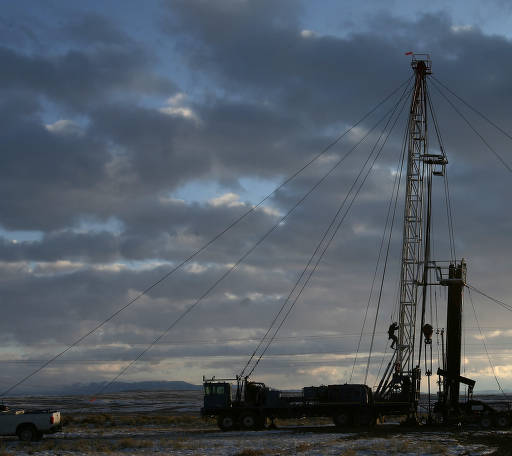
Class II injection well in Colorado explodes and catches fire. Photo by Kelsey Brunner for the Greeley Tribune.
Disposal of oil and gas wastewater by underground injection has not yet been specifically researched as a source of systemic groundwater contamination nationally or on a state level. Regardless, this issue is particularly pertinent to Colorado, since there are about 3,300 aquifer exemptions in the US (view map), and the majority of these are located in Montana, Wyoming, and Colorado. There is both a physical risk of danger as well as the risk of groundwater contamination. The picture to the right shows an explosion of a Class II injection well in Greeley, CO, for example.
Applicable and existing research on injection wells shows that a risk of groundwater contamination of – not wastewater – but migrated methane due to a leak from an injection well was estimated to be between 0.12 percent of all the water wells in the Colorado region, and was measured at 4.5 percent of the water wells that were tested in the study.
A recent article by ProPublica quoted Mario Salazar, an engineer who worked for 25 years as a technical expert with the EPA’s underground injection program in Washington:
In 10 to 100 years we are going to find out that most of our groundwater is polluted … A lot of people are going to get sick, and a lot of people may die.
Also in the ProPublic article was a study by Abrahm Lustgarten, wherein he reviewed well records and data from more than 220,000 oil and gas well inspections, and found:
Structural failures inside injection wells are routine.
Between 2007-2010, one in six injection wells received a well integrity violation.
More than 7,000 production and injection wells showed signs of well casing failures and leakage.
…groundwater contamination problems related to the subsurface disposal of liquid wastes by deep-well injection have been reviewed in the literature since 1950 (Morganwalp, 1993) and groundwater contamination accordingly is a serious problem.
According to his textbook, a 1974 U.S. EPA report specifically warns of the risk of corrosion by oil and gas waste brines on handling equipment and within the wells. The potential effects of injection wells on groundwater can even be reviewed in the U.S. EPA publications (1976, 1996, 1997).
As early as 1969, researchers Evans and Bradford, who reported on the dangers that could occur from earthquakes on injection wells near Denver in 1966, had warned that deep well injection techniques offered temporary and not long-term safety from the permanent toxic wastes injected.
Will existing Class II wells fail?
For those that might consider data and literature on wells from the 1960’s as being unrepresentative of activities occurring today, of the 587 wells reported by the Colorado’s oil and gas regulatory body, COGCC, as “injecting,” 161 of those wells were drilled prior to 1980. And 104 were drilled prior to 1960!
Wells drilled prior to 1980 are most likely to use engineering standards that result in “single-point-of-failure” well casings. As outlined in the recent report from researchers at Harvard on underground natural gas storage wells, these single-point-of-failure wells are at a higher risk of leaking.
It is also important to note that the U.S. EPA reports only 569 injection wells for Colorado, 373 of which may be disposal wells. This is a discrepancy from the number of injection wells reported by the COGCC.
Aquifer Exemptions in Colorado
According to COGCC, prior to granting a permit for a Class II injection well, an aquifer exemption is required if the aquifer’s groundwater test shows total dissolved solids (TDS) is between 3,000 and 10,000 milligrams per liter (mg/l). For those aquifer exemptions that are simply deeper than the majority of current groundwater wells, the right conditions, such as drought, or the needs of the future may require drilling deeper or treating high TDS waters for drinking and irrigation. How the state of Colorado or the U.S. EPA accounts for economic viability is therefore ill-conceived.
Data Note: The data for the following analysis came by way of FOIA request by Clean Water Action focused on the aquifer exemption permitting process. The FOIA returned additional data not reported by the US EPA in the public dataset. That dataset contained target formation sampling data that included TDS values. The FOIA documents were attached to the EPA dataset using GIS techniques. These GIS files can be found for download in the link at the bottom of this page.
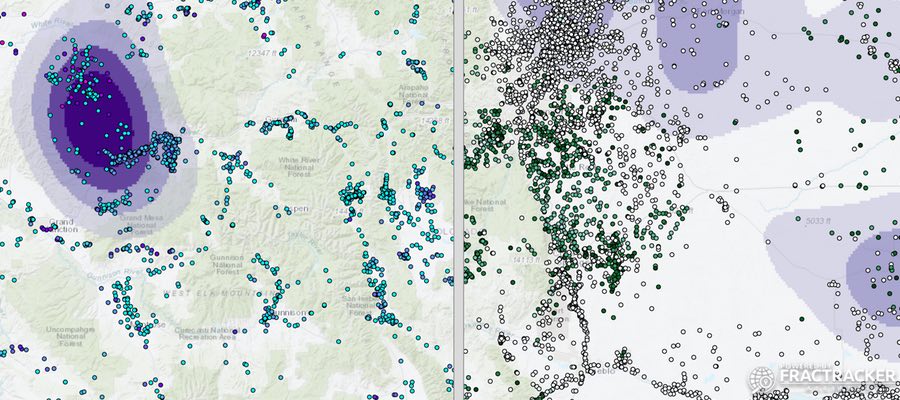
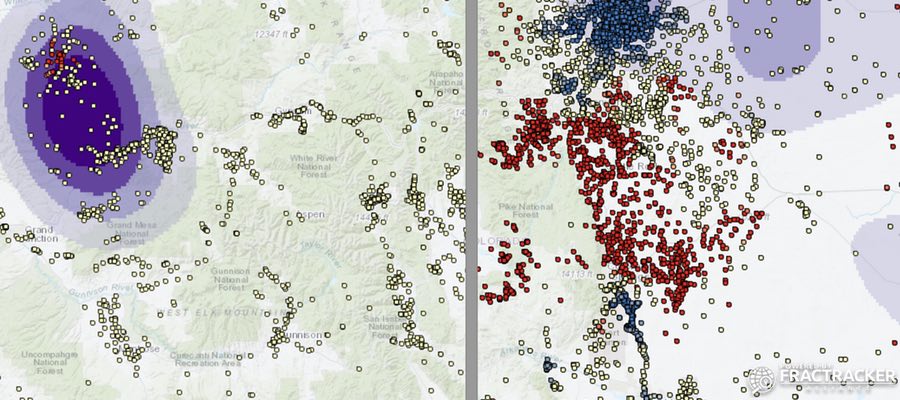
Map 1 above shows the locations of aquifer exemptions in Colorado, as well as the locations of Class II injection wells. These sites are overlaid on a spatial assessment of groundwater quality (a map of the groundwater’s quality), which was generated for the entire state. The changing colors on the map’s background show spatial trends of TDS values, a general indicator of overall groundwater quality.
In Map 1 above, we see that the majority of Class II injection wells and aquifer exemptions are located in regions with higher quality water. This is a common trend across the state, and needs to be addressed.
Our review of aquifer exemption data in Colorado shows that aquifer exemption applications were granted for areas reporting TDS values less than 3,000 mg/l, which contradicts the information reported by the COGCC as permitting guidelines. Additionally, of the 175 granted aquifer exemptions for which the FOIA returned data, 141 were formations with groundwater samples reported at less than 10,000 mg/l TDS. This is half of the total number (283) of aquifer exemptions in the state of Colorado.
When we mapped where class II injection wells are permitted, a total of 587 class II wells were identified in Colorado, outside of an aquifer exemption area. Of the UIC-approved injection wells identified specifically as disposal wells, at least 21 were permitted outside aquifer exemptions and were drilled into formations that were not hydrocarbon producing. Why these injection wells are allowed to operate outside of an aquifer exemption is unknown – a question for regulators.
You can see in the map that most of the aquifer exemptions and injection wells in Colorado are located in areas with lower TDS values. We then used GIS to conduct a spatial analysis that selected groundwater wells within five miles of the 21 that were permitted outside aquifer exemptions. Results show that groundwater wells near these sites had consistently low-TDS values, meaning good water quality. In Colorado, where groundwater is an important commodity for a booming agricultural industry and growing cities that need to prioritize municipal sources, permitting a Class II disposal well in areas with high quality groundwater is irresponsible.
In Map 2, above, the locations of groundwater wells in Colorado are shown. The colors of the dots represent the concentration of TDS on the right and well depth on the left side of the screen. By sliding the bar on the map, users can visualize both. This feature allows people to explore where deep wells also are characterized by high levels of TDS. Users can also see that areas with high quality low TDS groundwater are the same areas that are the most developed with oil and gas production wells and Class II injection wells, shown in gradients of purple.
Statistical analysis of this spatial data gives a clearer picture of which regions are of particular concern; see below in Map 3.
In Map 3, above, the data visualized in Map 2 were input into a hot-spots analysis, highlighting where high and low values of TDS and depth differ significantly from the rest of the data. The region of the Front Range near Denver has significantly deeper wells, as a result of population density and the need to drill municipal groundwater wells.
The Front Range is, therefore, a high-risk region for the development of oil and gas, particularly from Class II injection wells that are necessary to support development.
Methods Notes: The COGCC publishes groundwater monitoring data for the state of Colorado, and groundwater data is also compiled nationally by the Advisory Committee on Water Information (ACWI). (Data from the National Groundwater Monitoring Network is sponsored by the ACWI Subcommittee on Ground Water.) These datasets were cleaned, combined, revised, and queried to develop FracTracker’s dataset of Colorado groundwater wells. We cleaned the data by removing sites without coordinates. Duplicates in the data set were removed by selecting for the deepest well sample. Our dataset of water wells consisted of 5,620 wells. Depth data was reported for 3,925 wells. We combined this dataset with groundwater data exported from ACWI. Final count for total wells with TDS data was 11,754 wells. Depth data was reported for 7,984 wells. The GIS files can be downloaded in the compressed folder at the bottom of this page.
Site Assessments – Exploring Specific Regions
Particular regions were further investigated for impacts to groundwater, and to identify areas that may be at a high risk of contamination. There are numerous ways that groundwater wells can be contaminated from other underground activity, such as hydrocarbon exploration and production or waste injection and disposal. Contamination could be from hydraulic fracturing fluids, methane, other hydrocarbons, or from formation brines.
From the literature, brines and methane are the most common contaminants. This analysis focuses on potential contamination events from brines, which can be detected by measuring TDS, a general measure for the mixture of minerals, salts, metals and other ions dissolved in waters. Brines from hydrocarbon-producing formations may include heavy metals, radionuclides, and small amounts of organic matter.
Wells with high or increasing levels of TDS are a red flag for potential contamination events.
Methods
Groundwater wells at deep depths with high TDS readings are, therefore, the focus of this assessment. Using GIS methods we screened our dataset of groundwater wells to only identify those located within a buffer zone of five miles from Class II injection wells. This distance was chosen based on a conservative model for groundwater contamination events, as well as the number of returned sample groundwater wells and the time and resources necessary for analysis. We then filtered the groundwater wells dataset for high TDS values and deep well depths to assess for potential impacts that already exist. We, of course, explored the data as we explored the spatial relationships. We prioritized areas that suggested trends in high TDS readings, and then identified individual wells in these areas. The data initially visualized were the most recent sampling events. For the wells prioritized, prior sampling events were pulled from the data. The results were graphed to see how the groundwater quality has changed over time.
Case of Increasing TDS Readings
If you zoom to the southwest section of Colorado in Map 2, you can see that groundwater wells located near the injection well 1 Fasset SWD (EPA) (05-067-08397) by Operator Elm Ridge Exploration Company LLC were disproportionately high (common). Groundwater wells located near this injection well were selected for, and longitudinal TDS readings were plotted to look for trends in time. (Figure 1.)
The graphs in Figure 1, below, show a consistent increase of TDS values in wells near the injection activity. While the trends are apparent, the data is limited by low numbers of repeated samples at each well, and the majority of these groundwater wells have not been sampled in the last 10 years. With the increased use of well stimulation and enhanced oil recovery techniques over the course of the last 10 years, the volumes of injected wastewater has also increased. The impacts may, therefore, be greater than documented here.
This area deserves additional sampling and monitoring to assess whether contamination has occurred.
Figures 1a and 1b. The graphs above show increasing TDS values in samples from groundwater wells in close proximity to the 1 Fassett SWD wellsite, between the years 2004-2015. Each well is labeled with a different color. The data for the USGS well in the graph on the right was not included with the other groundwater wells due to the difference in magnitude of TDS values (it would have been off the chart).
Groundwater Contamination Case in 2007
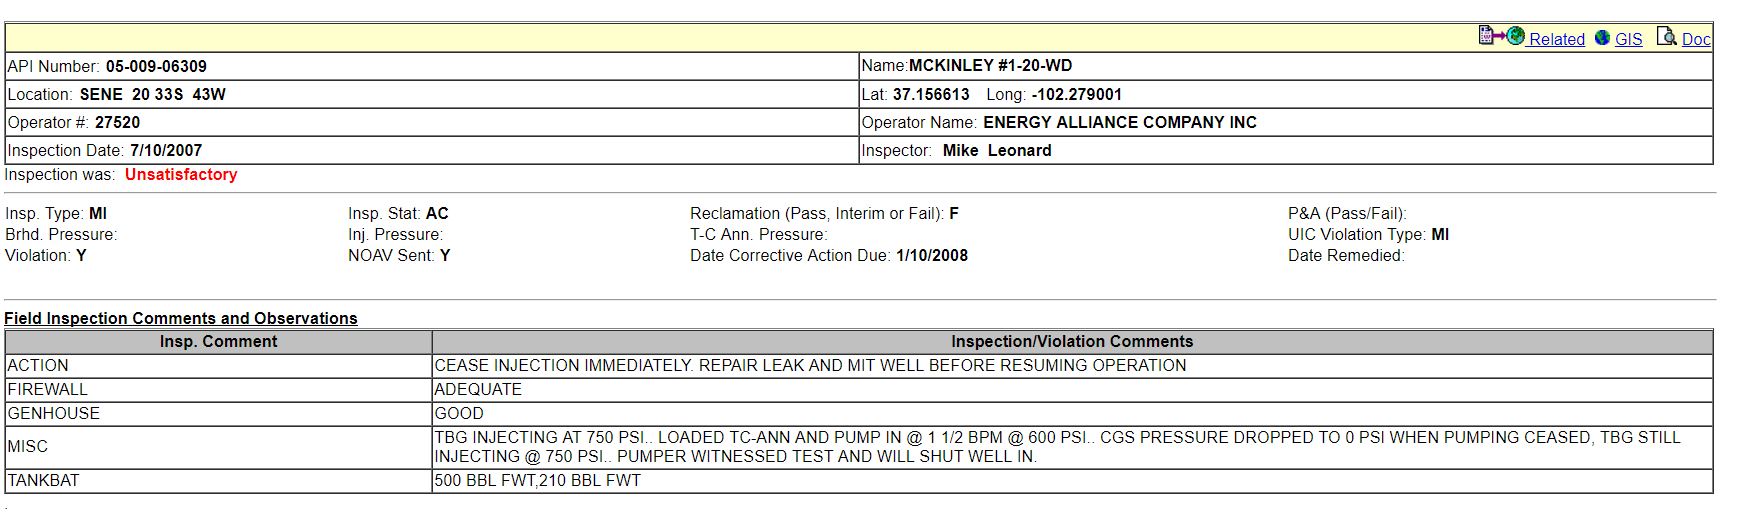
We also uncovered a situation where a disposal well caused groundwater contamination. Well records for Class II injection wells in the southeast corner of Colorado were reviewed in response to significantly high readings of TDS values in groundwater wells surrounding the Mckinley #1-20-WD disposal well.
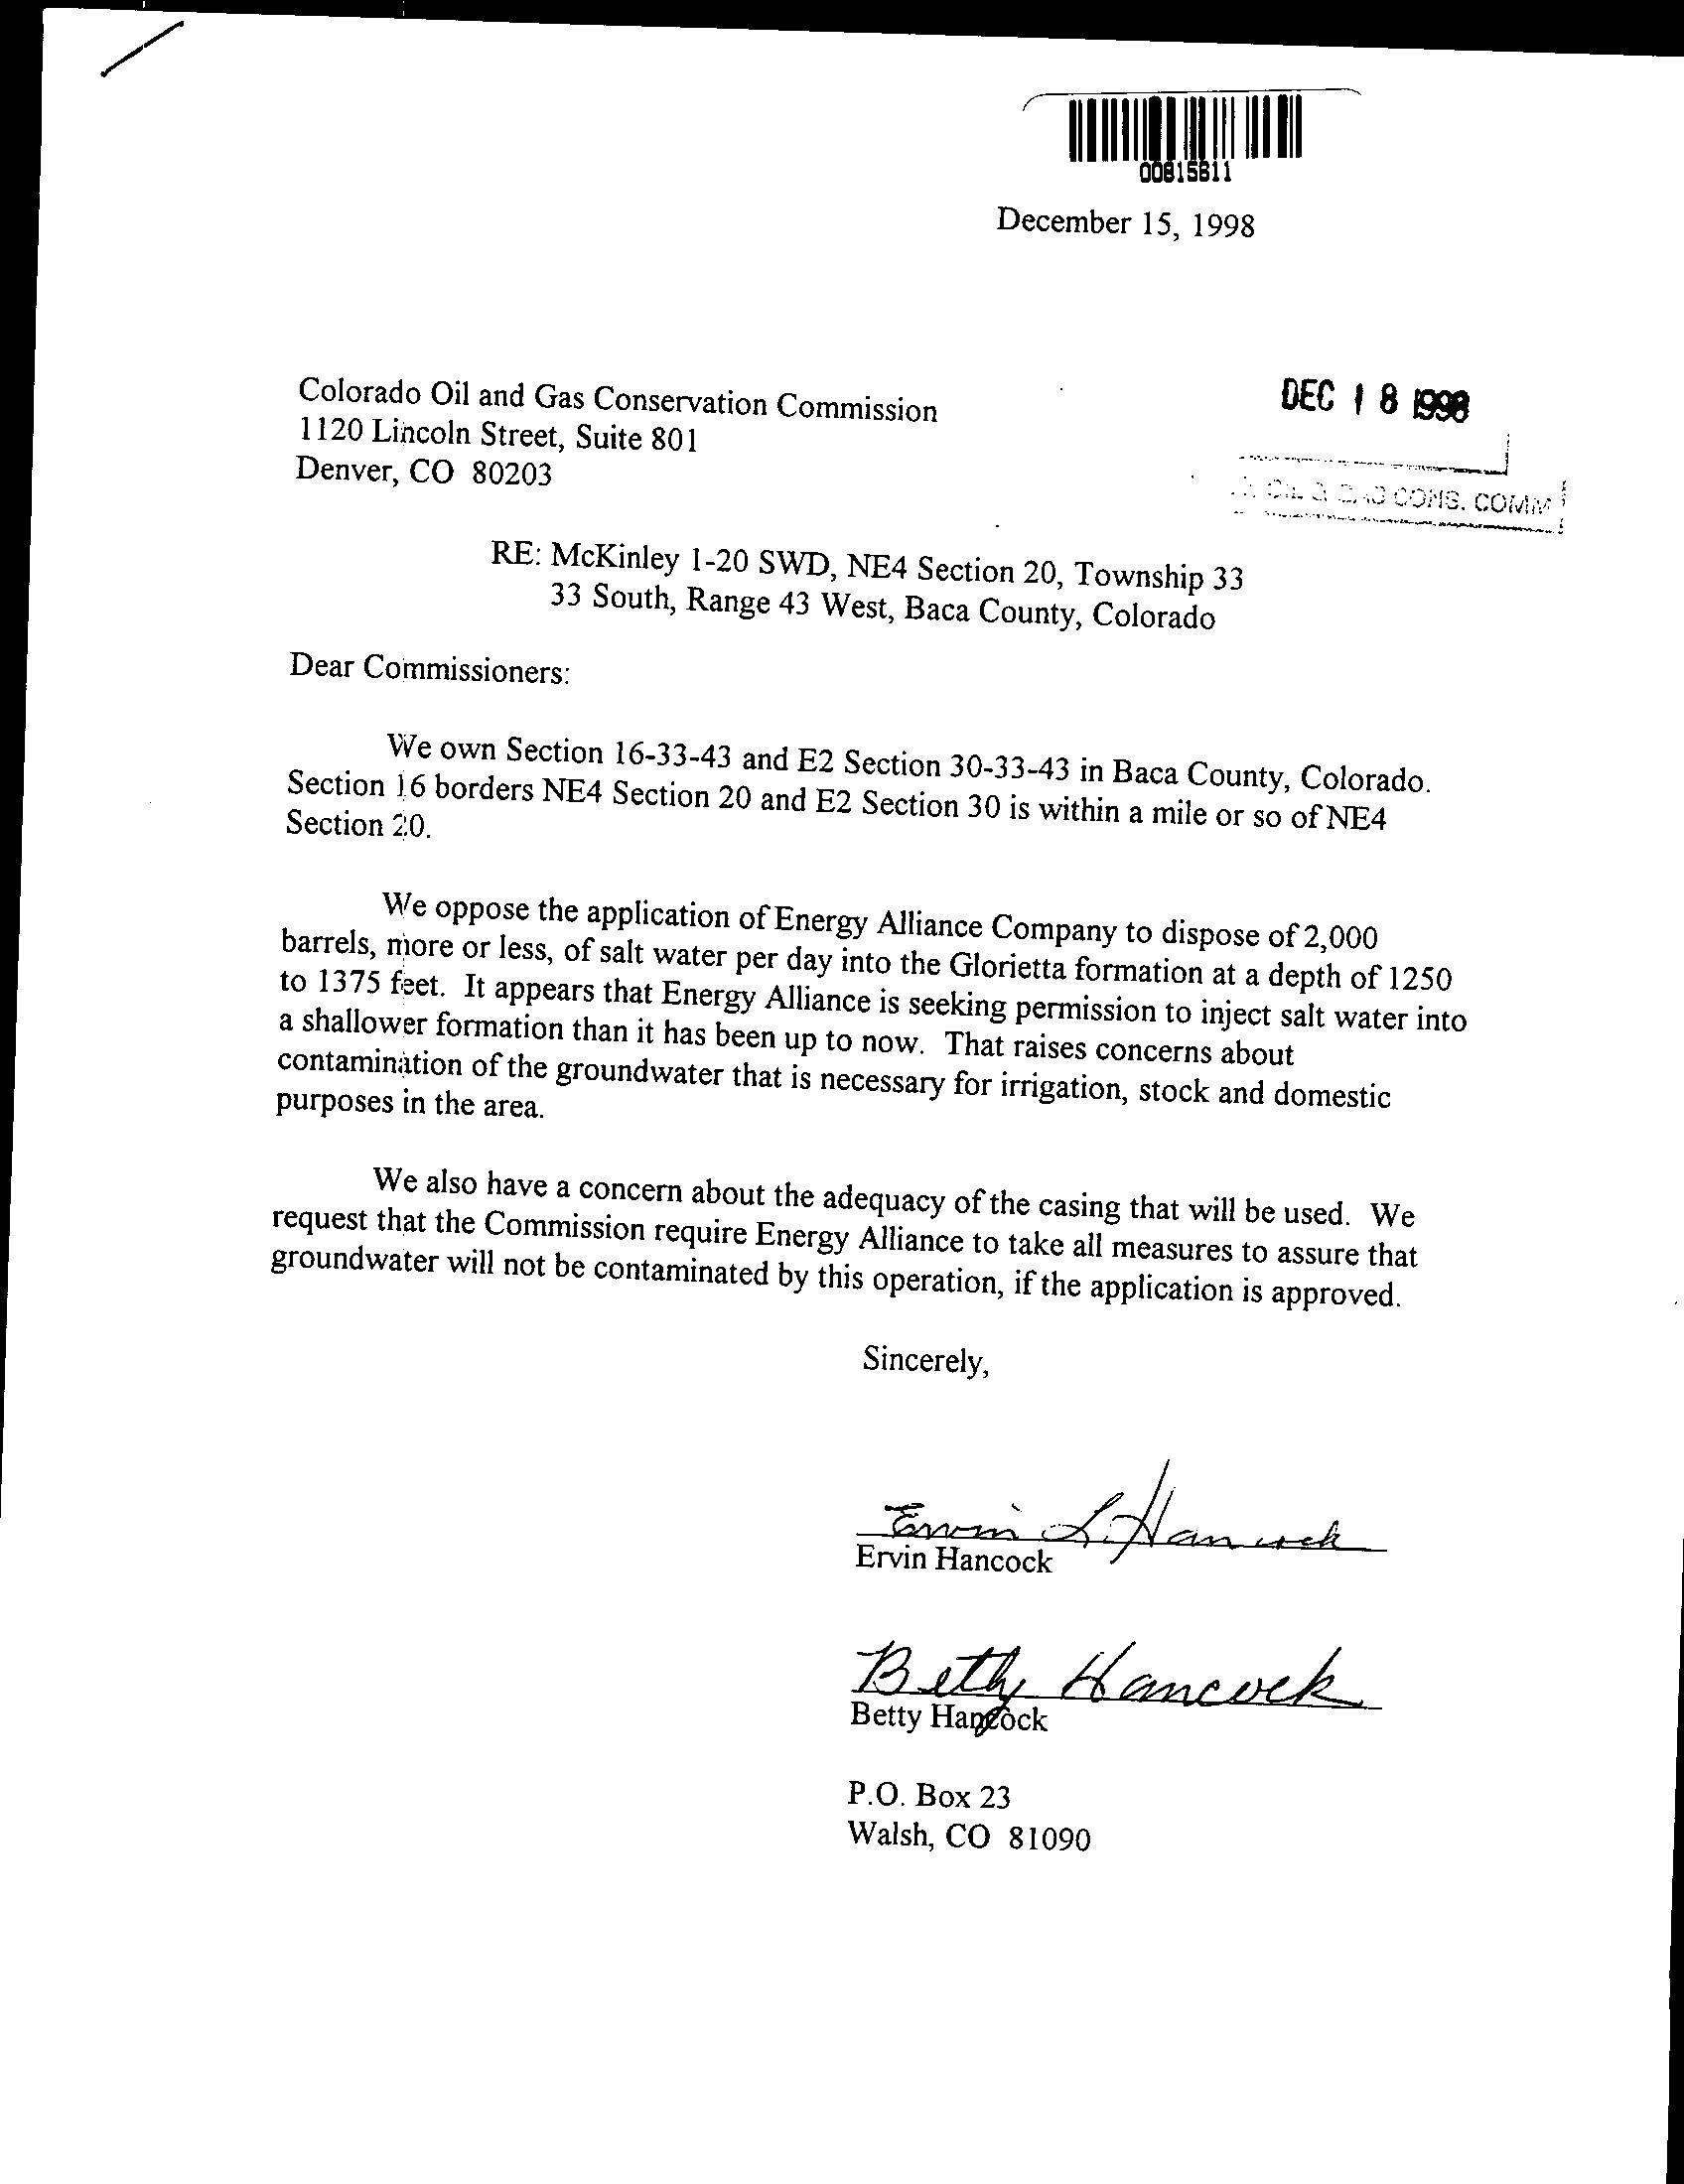
When the disposal well was first permitted, farmers and ranchers neighboring the well site petitioned to block the permit. Language in the grant application is shown below in Figure 2. The petitioners identified the target formation as their source of water for drinking, watering livestock, and irrigation. Regardless of this petition, the injection well was approved. Figure 3 shows the language used by the operator Energy Alliance Company (EAC) for the permit approval, which directly contradicts the information provided by the community surrounding the wellsite. Nevertheless, the Class II disposal well was approved, and failed and leaked in 2007, leading to the high TDS readings in the groundwater in this region.
Figure 2. Petition by local landowners opposing the use of their drinking water source formation for the site of a Class II injection disposal well.
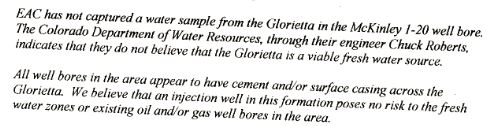
Figure 3. The oil and gas operation EAC claims the Glorietta formation is not a viable fresh water source, directly contradicting the neighboring farmers and ranchers who rely on it.
Figure 4. The COGCC well log report shows a casing failure, and as a result a leak that contaminated groundwater in the region.
Areas where lack of data restricted analyses
In other areas of Colorado, the lack of recent sampling data and longitudinal sampling schemes made it even more difficult to track potential contamination events. For these regions, FracTracker recommends more thorough sampling by the regulatory agencies COGCC and USGS. This includes much of the state, as described below.
Southeastern Colorado
Our review of the groundwater data in southeastern Colorado showed a risk of contamination considering the overlap of injection well depths with the depths of drinking water wells. Oil and gas extraction and Class II injections are permitted where the aquifers include the Raton formation, Vermejo Formation, Poison Canyon Formation and Trinidad Sandstone. Groundwater samples were taken at depths up to 2,200 ft with a TDS value of 385 mg/l. At shallower depths, TDS values in these formations reached as high as 6,000 mg/l, and 15 disposal wells are permitted in aquifer exemptions in this region. Injections in this area start at around 4,200 ft.
In Southwestern Colorado, groundwater wells in the San Jose Formation are drilled to documented depths of up to 6,000 feet with TDS values near 2,000 mg/l. Injection wells in this region begin at 565 feet, and those used specifically for disposal begin at below 5,000 feet in areas with aquifer exemptions. There are also four disposal wells outside of aquifer exemptions injecting at 5,844 feet, two of which are not injecting into active production zones at depths of 7,600 and 9,100 feet.
Western Colorado
In western Colorado well Number 1-32D VANETA (05-057-06467) by Operator Sandridge Exploration and Production LLC’s North Park Horizontal Niobara Field in the Dakota-Lokota Formation has an aquifer exemption. The sampling data from two groundwater wells to the southeast, near Coalmont, CO, were reviewed, but we can’t get a good picture due to the lack of repeat sampling.
In Northwestern Colorado near Walden, CO and the McCallum oil field, two groundwater wells with TDS above 10,000 ppm were selected for review. There are 21 injection wells in the McCallum field to the northwest. Beyond the McCallum field is the Battleship field with two wastewater disposal wells with an aquifer exemption. West of Grover, Colorado, there are several wells with high TDS values reported for shallow wells. Similar trends can be seen near Vernon. The data on these wells and wells from along the northern section of the Front Range, which includes the communities of Fort Collins, Greeley, and Longmont, suffered from the same issue. Lack of deep groundwater well data coupled with the lack of repeat samples, as well as recent sampling inhibited the ability to thoroughly investigate the threat of contamination.
Trends and Future Development
Current trends in exploration and development of unconventional resources show the industry branching southwest of Weld County towards Fort Collins, Longmont, Broomfield and Boulder, CO.
These regions are more densely populated than the Front Range county of Weld, and as can be seen in the maps, the drinking water wells that access groundwaters in these regions are some of the deepest in the state.
This analysis shows where Class II injection has already contaminated groundwater resources in Colorado. The region where the contamination has occurred is not unique; the drinking water wells are not particularly deep, and the density of Class II wells is far from the highest in the state.
Well casing failures and other injection issues are not exactly predictable due to the variety of conditions that can lead to a well casing failure or blow-out scenario, but they are systemic. The result is a hazardous scenario where it is currently difficult to mitigate risk after the injection wells are drilled.
Allowing Class II wells to expand into Front Range communities that rely on deep wells for municipal supplies is irresponsible and dangerous.
The encroachment of extraction into these regions, coupled with the support of Class II injection wells to handle the wastewater, would put these groundwater wells at particular risk of contamination. Based on this analysis, we recommend that regulators take extra care to avoid permitting Class II wells in these regions as the oil and gas industry expands into new areas of the Front Range, particularly in areas with dense populations.
Feature Image: Joshua Doubek / WIKIMEDIA COMMONS
Article by: Kyle Ferrar, Western Program Coordinator, FracTracker Alliance
October 31, 2017 Edit: This post originally cited the Clean Water Act instead of the Safe Drinking Water Act as the source that EPA uses to grant aquifer exemptions.
https://www.fractracker.org/a5ej20sjfwe/wp-content/uploads/2017/10/kansas_wellpad.jpg400900Kyle Ferrar, MPHhttps://www.fractracker.org/a5ej20sjfwe/wp-content/uploads/2021/04/2021-FracTracker-logo-horizontal.pngKyle Ferrar, MPH2017-10-26 14:55:032021-04-15 15:02:07Groundwater risks in Colorado due to Safe Drinking Water Act exemptions
We’d like to give our readers a bit of background on aquifer exemptions, because we’re going to be covering this topic in a few upcoming blog posts. Stay tuned!
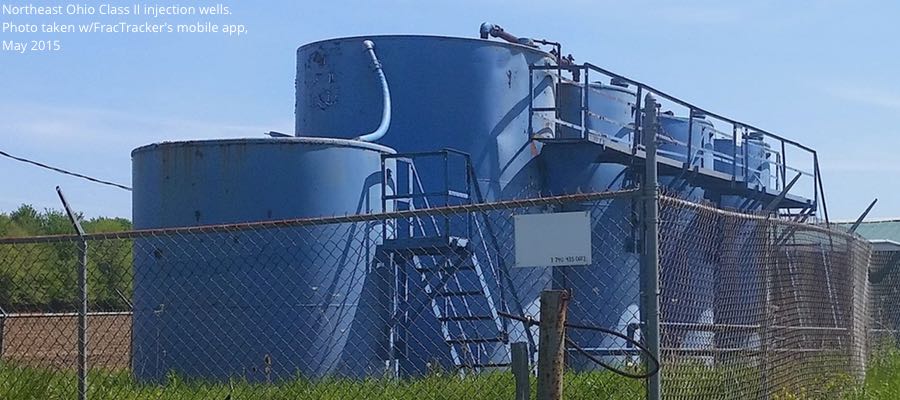
Liquid Waste Disposal
Drilling for oil and gas produces both liquid and solid waste that must be disposed of. The liquid waste from this industry is considered a “Class II waste” according to the US EPA. Aquifers are places underground capable of holding or transmitting groundwater. To dispose of Class II waste, operators are granted aquifer exemptions, by the EPA based on the state’s recommendations. The term “exemption,” specifically, refers to the Safe Drinking Water Act, which protects underground sources of drinking water (USDWs).
Therefore, these exemptions grant oil and gas operators the right to contaminate groundwaters, albeit many of the groundwater formations used for disposal in Class II wells are very deep.
There are several qualifiers for a USDW to be granted exempt from the Safe Drinking Water Act. Aquifer exemptions are granted for underground formations that are not currently used as a source of drinking water and meet one of the following criteria:
The formation contains commercially producible minerals or hydrocarbons;
The formation is so deep that recovery of water for drinking water purposes is economically or technologically impractical; or,
The formation is so contaminated that it would be economically or technologically impractical to render the water fit for human consumption.
In some states, aquifer exemptions are not approved for formations with Total Dissolved Solids (TDS*) equal to or less than 3,000 mg/l TDS.
If an underground formation qualifies for an exemption, it does not mean that groundwater cannot be used for drinking water, just that it is not currently a source of drinking water. The most precarious criteria requirement, therefore, is the determination that a USDW is simply not “economically viable” or it is “technologically impractical,” meaning that the cost of drilling a groundwater well to the depth of the aquifer (under the condition of the current need for water) may make the investment impractical. In the near future, this water may be needed and highly valued, however.
TDS = Total dissolved solids are inorganic salts (e.g. calcium, magnesium, potassium, sodium, bicarbonates, chlorides, and sulfates), as well as some organic matter, dissolved in water.
The Lay of the Land
Below, we have put together a map of aquifer exemptions in the U.S. Click on the dots and shaded areas to learn more about a particular aquifer.
By Kyle Ferrar, Western Program Coordinator, FracTracker Alliance
https://www.fractracker.org/a5ej20sjfwe/wp-content/uploads/2015/07/Injection-Feature.jpg400900Kyle Ferrar, MPHhttps://www.fractracker.org/a5ej20sjfwe/wp-content/uploads/2021/04/2021-FracTracker-logo-horizontal.pngKyle Ferrar, MPH2017-10-26 09:31:202021-04-15 15:02:09What are aquifer exemptions? Permitted exemptions from the Safe Drinking Water Act
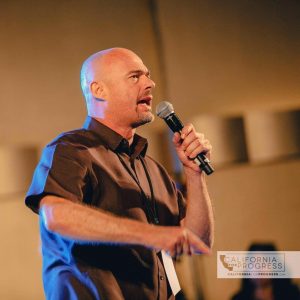
David Braun, FracTracker’s Honorary Annual Fund Chair, at a climate revolution rally in Los Angeles – Photo by Bryan Giardinelli
I’ve been fighting fracking for many years, in fact, it seems like a lifetime. I helped win the fracking ban in New York, organize coalitions like Americans Against Fracking and Californians Against Fracking, and, more recently, coordinate a major campaign called Oil Money Out – aimed at getting California politicians and Governor Jerry Brown to reject campaign contributions from the oil and gas industry, and instead prioritize public health. The work never stops, but we’re making critical headway.
Less than a year ago, I joined the board of FracTracker Alliance. Their maps, data, and insights are invaluable in my advocacy and in the efforts of so many other organizations addressing pressing energy issues. The FracTracker mobile app is a powerful tool to document the harms occurring in too many communities. Their small but mighty staff is passionate about what they do, and they’re good at it. They’re well-versed in the concerns and threats emblematic of oil and gas development.
As a vocal front-line advocate for better energy, FracTracker’s often behind-the-scenes work may not seem congruent with my methods, but the organization is an ally – a group who understands the synergy of collaboration. They work with people across the country on pressing issues: pipelines, sand mines, injection wells, ethane crackers. The list goes on.
Like other groups, they need ample resources to continue informing the public and serving the movement. I’m proud to be their honorary annual fund chair for the current fiscal year.
We need your help in reaching our goal of raising $25,000.
We know there are many worthy efforts competing for your donations, but every contribution to FracTracker – big or small – means a lot and gets us closer to our goal.
FracTracker seeks and treats donors respectfully. You won’t get nagged, but you will be rewarded with their hard work. Just check out their website and bear witness to their reach and impact. Please donate today.
If I need the best data or a provocative map, I go to FracTracker. If I need a photo to hit home a point, I can find one on the FracTracker image library. The testimonials from my peers pushing back on extreme energy attest: FracTracker is a force we can depend on.
Please help sustain their work with a personal donation.
“The times they are a changing” because of people like you who care. Thanks for fueling the momentum. Together, we’ll change the world.
https://www.fractracker.org/a5ej20sjfwe/wp-content/uploads/2017/10/FT-annualfund-feature.jpg400900FracTracker Alliancehttps://www.fractracker.org/a5ej20sjfwe/wp-content/uploads/2021/04/2021-FracTracker-logo-horizontal.pngFracTracker Alliance2017-10-11 10:14:082021-04-15 15:02:09Help us investigate pressing energy issues by donating to FracTracker’s Annual Fund