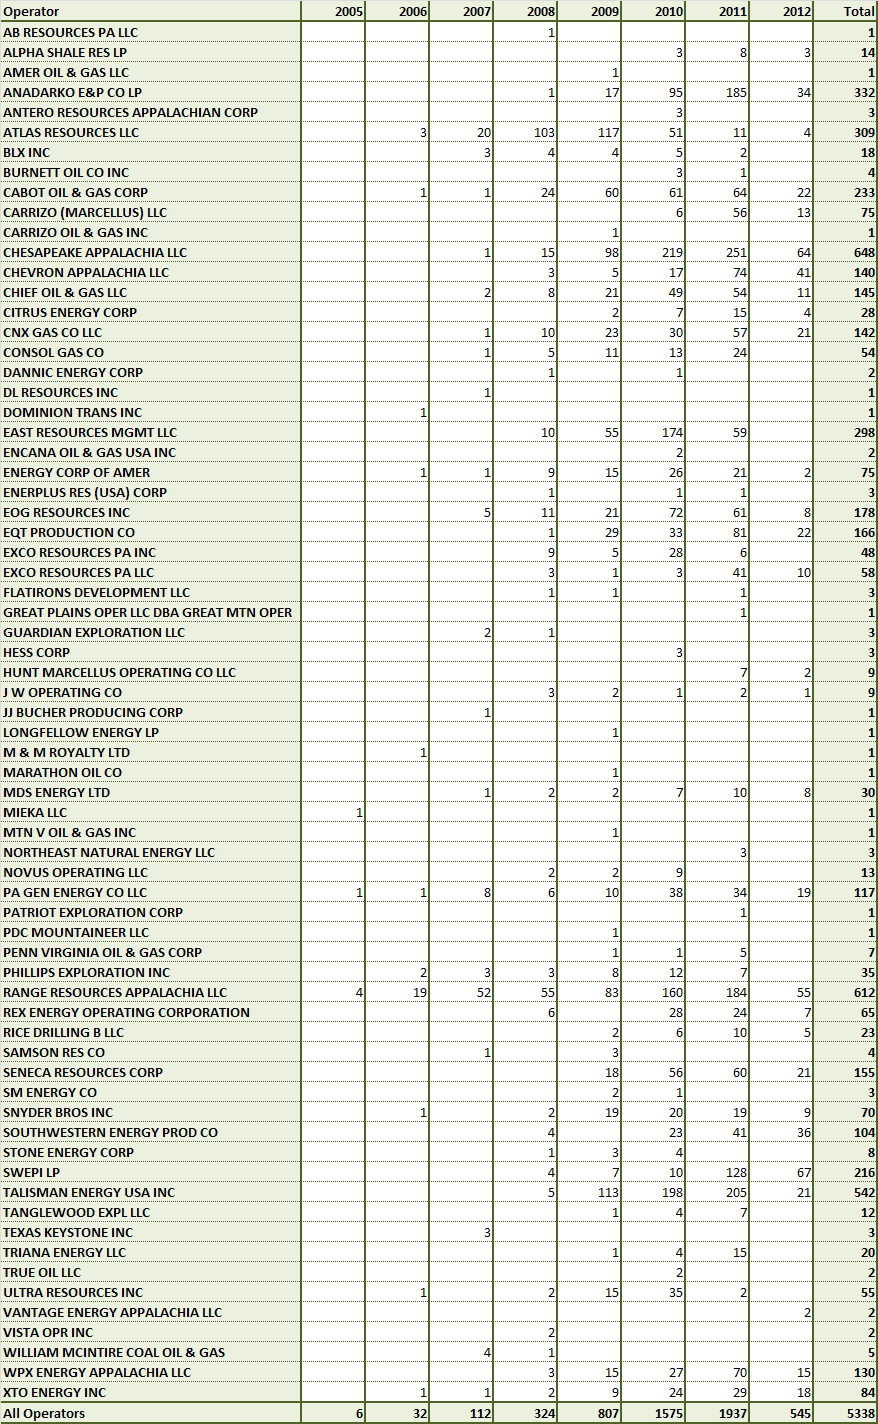
The roster of companies that drill into Pennsylvania’s Marcellus Shale is a long one: there are 70 different operators listed on the Marcellus Spud Report at the PADEP website. Here is a list of each operator, complete with annual totals since 2005:
Marcellus Shale wells drilled by operator by year, through May 2, 2012
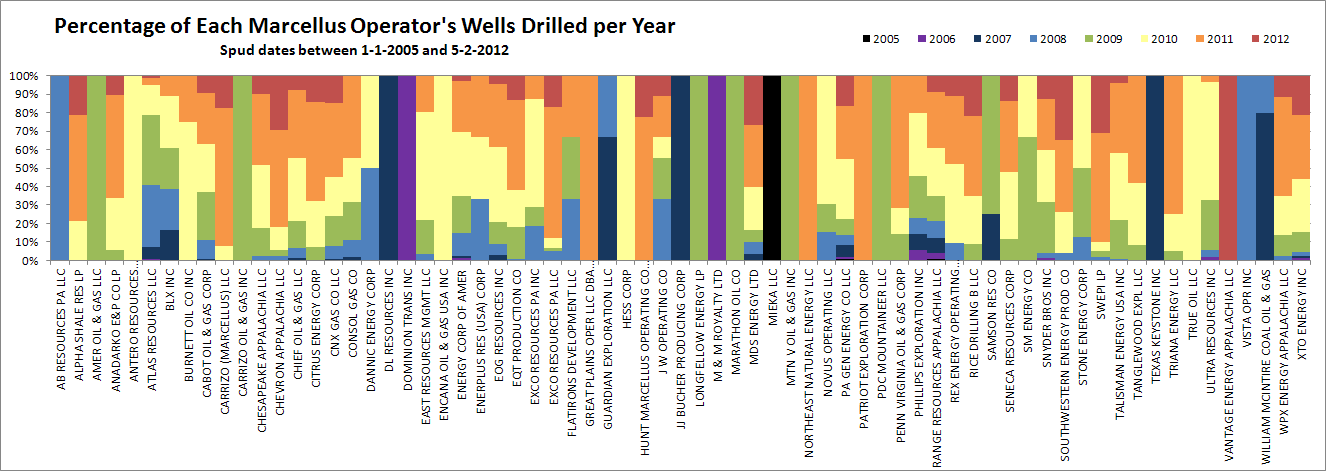
With the chart below, you can view the same data in a different way:
Percentage of each operator’s drilling activity by year. Please click the above image for a full sized view.
This graph is particularly useful for highlighting new operators, as well as those that are no longer drilling wells. When I show data trends for operators over time, I typically get multiple comments about mergers, acquisitions, and subsidiaries within the industry. Such comments are welcome, and yet any attempt to account for them on my end will almost certainly be incomplete, and therefore potentially misleading. For that reason, I have elected not to aggregate operators in any way, tempting though it may be to combine “Exco Resources PA Inc” and “Exco Resources PA Llc”.
Here are a few more observations about the data:
Atlas Resources drilled an industry-high 117 Marcellus Shale wells in 2009. The company is still active, but not on the same scale, drilling just 11 wells last year, and only four wells in the first four months of 2012.
The DEP has apparently made some retroactive changes to the operators for wells drilled in previous years. In this violations analysis from November, for example, Dominion Exploration and Production has 17 wells between 2006 and 2011. Now, the only Dominion well is for Dominion Trans Inc. The balance of Dominion wells was likely transferred to either Consol Gas Co or CNX Gas Co Llc, both subsidiaries of Consol Energy, which purchased Dominion’s Marcellus holdings in 2010.
Whatever prompted the DEP to reassign Dominion wells to other operators apparently didn’t apply for Shell’s 2010 acquisition of East Resources. Or at least it didn’t apply for all of East’s wells–in November, East was credited as being the operator for 342 wells, while they currently are on record for 298. Shell, which does business as SWEPI on this list, had no wells until 2011 on the November list, whereas now, they are listed as the operator for 21 wells that were spudded between 2008 and 2010.
With 545 wells drilled through the first 123 days of 2012, the industry is on pace to drill 1,617 Marcellus wells in Pennsylvania this year, down from 1,937 wells last year.
https://www.fractracker.org/a5ej20sjfwe/wp-content/uploads/2025/09/2025-Wordmark-Logo.png00Matt Kelso, BAhttps://www.fractracker.org/a5ej20sjfwe/wp-content/uploads/2025/09/2025-Wordmark-Logo.pngMatt Kelso, BA2012-05-04 15:13:592020-07-21 10:39:37Drilled Wells by Operator Over Time in PA’s Marcellus
At FracTracker, you could say that we are a bit obsessed about maps and data. The amazing map below was created and is updated by the PA Natural Heritage Program (PNHP). While this is a recurring project for PNHP, with the increase in shale gas activity in recent years it is ever more important to protect and document changes to sensitive ecosystems.
Important Natural Heritage Areas
Click on the map to check out a statewide interactive map featuring data from the County Natural Heritage Inventory. The results presented in this map represent a snapshot in time, highlighting the sensitive natural areas within Pennsylvania. Core habitat is outlined in red (places where any disturbance could be detrimental to certain ecological species), supporting landscape in purple, and landscape conservation areas in yellow.
By clicking on the map, you will be taken to the Heritage Program’s site where you can search the map by county, watershed, or an address to learn more about the protected areas near you. On this page you can learn about the species of special concern such as the Copperhead, the Bog Turtle, and Northern Cricket Frog.
About the Inventory
The County Natural Heritage Inventory is a cooperative program undertaken by the PNHP partnership. The County Natural Heritage Inventories (CNHI) have been systematic studies of the critical biological resources of the state, county by county. The primary focus of CNHIs has been on species of concern: those plants, animals, natural communities, and habitats most at risk of extinction at the global or local level. These projects are designed to identify, map and discus areas that support species of concern, exemplary natural communities and broad expanses of intact natural ecosystems that support components of Pennsylvania’s native species biodiversity. These areas are prioritized based upon their ecological qualities and provided with recommendations regarding their management and protection.
These studies were conceived as tools to assist in planning to avoid the accidental destruction of habitats supporting species of concern at both the county and municipal levels and have been used effectively in that capacity. CNHIs have been incorporated into comprehensive plans, consulted to plan development projects, and utilized by conservation organizations to prioritize their work. Additionally, these studies have been used to help in the development of recreational amenities, promotion of tourism industries and assistance in community development. CNHIs have also been a primary source for much of the Pennsylvania Natural Diversity Inventory permit review data. CNHIs can actually streamline economic and infrastructure developments by providing information on sensitive environmental features early in the planning process when adjustments can be made at little cost or delay.
The County Natural Heritage Inventory is a planning tool, and is not intended to be used as a substitute for environmental review. For more information, view the Statewide CNHI fact sheet.
Ohio is on the western edge of two enormous black shale formations in Appalachian Basin: the 390 million year old Devonian Period Marcellus Shale and the Utica Shale, formed from deposits in the Ordovician Period about 460 million years ago. Image source: Ohio Environmental Protection Agency
The Ohio Department of Natural Resources (ODNR) has made it easy to find shale gas data from these two formations.
This is provided that you are only interested in horizontal wells. ODNR sums up their opinion of the importance of horizontal wells thusly:
Effective immediately, the vertical permits (stratigraphic test well permits) have been removed from this listing. In the initial phases of both Marcellus and Utica exploration, they were listed to reflect exploratory activity. They are no longer necessary with the increase of horizontal permitting activity. As always, they are available through the Oil and Gas On-line Well Search (1).
To me, this seems like an arbitrary line in the sand for the ODNR to take, but then again, each state has its own quirks with dissemination of their oil and gas data. In Pennsylvania, for example, there is no way to determine a well’s source formation without a file review, other than whether or not the well is drilled into the Marcellus. And in New York, the entire debate is couched around the phrase “High Volume Horizontal Hydraulic Fracturing”, a specificity unmatched elsewhere in the basin, that includes well stimulations using more than 80,000 gallons of fluid. In many respects, the ways in which the states release their data are datapoints unto themselves, but then, that is the subject of a different post altogether.
So let’s take a look at the trends in Ohio for the deep shale gas formations:
Ohio shale gas permits, including Marcellus (blue) and Utica (red). Please note that Marcellus wells include horizontal and vertical permits, while Utica includes only permits for horizontal wells. Please click the gray compass rose and double carat (^) to hide those menus.
Horizontal Marcellus Shale permits issued in Ohio through 4-9-2012
Clearly, there is not nearly as much activity as there is in Pennsylvania or even West Virginia. Altogether, there have been 13 horizontal Marcellus permits issued in the Buckeye State, the most recent of which was nearly ten months ago. Seven of the permitted locations have been drilled so far.
Here’s the data from the Utica Shale:
Horizontal Utica Shale permits issued in Ohio through 4-9-2012
Altogether, there have been permits issued for 194 horizontal Utica wells, 60 of which have been drilled so far. Moreover, it seems to be in a period of rapid expansion; a distribution is reminiscent of the Marcellus in Pennsylvania in 2006 to 2007 (see link above).
Only nine of the sixty drilled wells were in production in 2011, four of which produced some oil from early completion and flowback phases, but no natural gas as of yet. None of the horizontal Utica wells were in production for the entire year in 2011.
Here are the statewide totals from the horizontal Utica wells:
Statewide production values from horizontal Utica Shale wells in Ohio in 2011
It is worth noting that over 59 percent of the gas production came from one well publicized Harrison County gas well–its 1.5 billion cubic feet of production is reported to be the source of 2 percent of the entire state’s gas production.
While that is an impressive quantity of gas from one well, it might be the oil production that is raising eyebrows in the industry. As this post is being written, oil prices are at $104 per barrel, and natural gas is trading at $1.92 per thousand cubic feet (Mcf). While there really isn’t much data to go on to determine if the results are typical, if there continues to be oil associated with the Utica gas to that extent, we may see more drilling rigs focused on the older formation, and fewer on the Marcellus.
The well database is here. There are some limitations on the utility of this database, however, as users cannot use formation as a search parameter, and searches are limited to 1,000 records. Upon request though, the ODNR did send me a DVD full of data. The information is available, it just takes some fortitude to slog through it.
https://www.fractracker.org/a5ej20sjfwe/wp-content/uploads/2025/09/2025-Wordmark-Logo.png00Matt Kelso, BAhttps://www.fractracker.org/a5ej20sjfwe/wp-content/uploads/2025/09/2025-Wordmark-Logo.pngMatt Kelso, BA2012-04-20 12:19:572020-07-21 10:39:36Shale Gas Trends in Ohio: Abandoning Marcellus, Embracing Utica
“Throughout the Marcellus Shale region, more and more we’re hearing of problems from our constituents,” said Curt Ashenfelter, Executive Director of the Keystone Trails Association (KTA) – a volunteer-directed, public service organization dedicated to providing, preserving, protecting and promoting recreational hiking trails and hiking opportunities in PA. “Pennsylvania hikers are concerned about the effect of drilling and want to play a role in monitoring the impact of this industry on PA’s forests and hiking trails.
With a simple-to-use form – available online and as a mail-in postcard – data on a variety of trail impacts related to shale gas drilling activities will be uploaded to FracTracker.org, a website providing a common portal to share data, photos, maps, and information related to the issues corollary to the shale gas industry. Photos of reported impacts can also be submitted.
“We’re pleased to be a partner in this grassroots endeavor to aggregate what have to date been mostly anecdotal but often alarming reports from our state’s extraordinary network of trails,” said Brook Lenker, Director of FracTracker. “We hope the information gathered helps to clarify the nature of the impacts and leads to sustainable solutions.”
“With over 3,000 miles of hiking trails in Pennsylvania and tourism being the Commonwealth’s 2nd largest industry, it’s critical to expose and address recurring problems caused by gas drilling activities, “ Ashenfelter added. “With a quick feedback loop like FracTracker, we can report problems to the appropriate agencies and gas drilling companies and seek remediation quickly.”
For more information on the Trail Logbook project, contact:
https://www.fractracker.org/a5ej20sjfwe/wp-content/uploads/2012/04/TrailLogbook.png250610FracTracker Alliancehttps://www.fractracker.org/a5ej20sjfwe/wp-content/uploads/2025/09/2025-Wordmark-Logo.pngFracTracker Alliance2012-04-20 09:00:572020-07-21 10:39:36Collaborative Trail Logbook – Reporting Gas Industry Impacts on PA Trail Experiences
The following line chart shows the number of Marcellus Shale wells drilled in Pennsylvania from January 2007 through March 2012, and the number of violations issued (1) by PADEP over the same period of time:
Drilled Wells and Violations in PA’s Marcellus Over Time
While drilling activities in Pennsylvania’s Marcellus Shale really got under way in 2005, the threshold of 10 wells drilled in a month didn’t happen until 2007, so the earlier data has been omitted in favor of charts that are a little less crowded. Here are a few milestones that have happened along the way:
First month with more violations than wells: April 2008 (difference=8)
First month with 50 violations: June 2008 (n=82)
First month with 50 wells: June 2009 (n=75)
First month with 100 violations: July 2009 (n=101)
First month with 100 wells: November 2009 (n=111)
First month with 100 more wells than violations: September 2010 (n=109)
First month with 200 wells: August 2011 (n=212)
Longest streak with more wells than violations: 15 months (January 2007 to March 2008) (2)
Longest streak with more violations than wells: 7 months: (February to August 2009)
Second longest streak with more wells than violations: 11 months (May 2011 to March 2012)
Second longest streak with more violations than wells: 2 months (Aug.-Sept 2008 and Dec. 2009-Jan 2010)
Included in violations is the total number of records from the compliance report linked above during the given time period where the “Marcellus only” and “Inspections with violations only” fields are set to “Yes”. This inflates the number of incidents reported by PADEP, which keeps track through the number of unique violation ID’s issued, so that if two instances are issued the same violation ID, it will be counted as one violation.
This streak may well be longer if months prior to 2007 were included
https://www.fractracker.org/a5ej20sjfwe/wp-content/uploads/2025/09/2025-Wordmark-Logo.png00Matt Kelso, BAhttps://www.fractracker.org/a5ej20sjfwe/wp-content/uploads/2025/09/2025-Wordmark-Logo.pngMatt Kelso, BA2012-04-11 14:47:032020-07-21 10:39:36Drilling and Compliance in PA’s Marcellus Over Time
In July 2011, the wellhead price of gas was $4.27 per thousand cubic feet (Mcf). As of this morning that price had fallen to $2.09, a decrease of more than 51 percent in well less than a year. This trend is widely projected to continue as gas reserves approach storage capacity in the US, at a time of year in which suppliers are typically busy recouping the pipelines after peak wintertime consumption. There is plenty of speculation that the price could fall to $1 per Mcf, or maybe even lower, sometime this summer.
In Pennsylvania’s Marcellus Shale, however, drilling operators are still hard at work, having applied for 742 permits and drilled 383 wells in the first quarter of 2012.
For consumers, this is of course all very good news. On the other hand, energy companies, lease holders, and counties signing up for the new impact fee are losing money with the low price of gas.
To be sure, there are still plenty of leaseholders taking home plenty of dollars:
Reported Gas production from Marcellus wells: July to December 2011. Please click the compass rose and double carat (^) to hide those menus.
The map above was designed to show wells that would make less than $1,000 (blue); $1,000 to $10,000 (orange); and $10,000 and above (purple) in leaseholder royalties over a six month period, assuming a wellhead price of $2.00 and 12.5 percent royalty (1). At these conditions, of the 2,257 Marcellus wells reporting production for the last half of 2011, 1,651 would have yielded royalty checks over $10,000, and 104 wells would have yielded less than $1,000.
Can Non-Productive Wells Be Avoided?
While there is widespread disagreement about many issues surrounding the Marcellus Shale in Pennsylvania, it is in nobody’s best interest to drill and stimulate wells that are not going to be productive. The question is, can drilling of relatively unproductive wells be avoided? These data don’t provide a difinitive answer to that, but do show how variable production returns can be, even on a local scale:
Production from Marcellus wells in southwestern Pennsylvania from July to December 2011, by municipality and well.
This map shows communities where very large amounts of gas are produced (dark red) adjacent to those where no gas is produced at all. And even within those dark red municipalities, there is considerable variability between the wells themselves. In Cumberland Township, Greene County, for example, there are two adjacent wells that each produced more than 600,000 Mcf in the reporting period, but less than a third of a mile to the north is another Marcellus well that produced only 7,383 Mcf (2).
For all the analysis that doubtlessly goes into placing the wells, the gas yields seem highly variable, even at very short distances.
Just to be clear, the production numbers from these wells were from late 2011, when the wellhead price of gas was well above $2.00. The purpose of this map is to give a general idea of what royalties on $2.00 gas would look like in Pennsylvania’s Marcellus.
I’m not going to claim that this result is typical without doing any spatial analysis, but it can be considered as anecdotal evidence of variability, in conjunction with the distributions visible on the map above.
https://www.fractracker.org/a5ej20sjfwe/wp-content/uploads/2025/09/2025-Wordmark-Logo.png00Matt Kelso, BAhttps://www.fractracker.org/a5ej20sjfwe/wp-content/uploads/2025/09/2025-Wordmark-Logo.pngMatt Kelso, BA2012-04-05 15:20:002020-07-21 10:39:36What are the Effects of Falling Gas Prices on PA’s Marcellus Shale?
If you look at the overall map of Marcellus Shale permits in West Virginia, it seems to be a topic of concern for most of the state. Looking at the map below of data obtained by the West Virginia Department of Environmental Protection (WVDEP) Oil and Gas Dataviewer, it isn’t surprising to note that such permits have been issued in 46 out of 55 counties in the Mountain State (1):
Marcellus Shale permits issued in West Virginia from 2005 to 3-20-2012
I was curious to see how the distribution looked over time, and was surprised to notice a pronounced contraction of the area of interest:
West Virginia Marcellus Shale permits issued by year, showing data by county and average latitude and longitude of each permitted location. Click image to view full size PDF.
While the majority of the state has been explored over the past seven years, the entire southwestern portion has been abandoned in terms of the Marcellus Shale (2), and the average latitude and longitude of all permits issued in 2011 is less than 20 miles from the Pennsylvania border.
To illustrate the trend, let’s take a closer look at Kanawha County, which is the most southwestern county with any shade of blue in the 2011 map. In 2007 and 2008, it led the way among all West Virginia counties with 29 and 48 permits issued, respectively, and the average permitted location was just one county to the northeast. Three years later, the number of new permits in Kanawha had dwindled to just one.
In contrast, Marshall County (the southernmost county in the panhandle) and Wetzel County (just to the south of Marshall) generated very little interest in the early exploration of West Virginia’s Marcellus Shale hydrocarbons, but by 2011, they were the top two counties in terms of permits issued.
This all begs the question of why the southwestern portion of the state is abandoned. While I don’t have access to production data, I assume that wells that were drilled in that area yielded disappointing returns on industry investments, or else efforts to extract resources would have continued. A colleague noted that the abandoned territory also happens to be the heart of West Virginia’s coal country, so perhaps there was some interference between the two extractive industries. This could be a contributing factor, but it is difficult to imagine a situation in which drillers would totally cede an eight county area to miners without massive compensation.
Lacking further data, it may not be possible to know the full story of what happened between 2008 and 2011 in southwestern West Virginia. But there is one thing that we know for sure: for all intents and purposes, the recoverable portion of the Marcellus Shale is smaller than we used to think.
The WVDEP data is fairly sloppy, as some of the permitted locations are actually in adjacent states, and 373 of the 2472 records downloaded (15 percent) on 3-20-2012 lacked permit issue dates. It is possible that these dates could be obtained from the alternative data source of https://apps.dep.wv.gov/oog/permitsearch_new.cfm. The Oil and Gas Dataviewer was preferred because it was possible to select for permits issued, and because the location data were in longitude and latitude rather than universal transverse Mercator.
County data is not included in the original data, but it is encoded in the well API number. Of necessity, the entries without permit issue dates were omitted from this analysis.
https://www.fractracker.org/a5ej20sjfwe/wp-content/uploads/2025/09/2025-Wordmark-Logo.png00Matt Kelso, BAhttps://www.fractracker.org/a5ej20sjfwe/wp-content/uploads/2025/09/2025-Wordmark-Logo.pngMatt Kelso, BA2012-03-26 16:47:582020-07-21 10:39:36Interest in West Virginia’s Marcellus Now Focused on North
I recently had the honor of presenting to a well-informed and concerned audience of residents, media, academics, non-profits, and industry personnel in the town of Alliance in Northeastern Ohio. The reason I was asked to participate in this public meeting was to provide some insight into how drilling has progressed in Pennsylvania from a public health perspective. While Ohio doesn’t really have much Marcellus Shale activity, the industry has been ramping up their efforts in the Utica Shale, which is situated approximately 6,500 feet beneath Alliance and below the Marcellus formation. See the map below of all known U.S. shale plays; the Utica has been shaded blue.
Shale gas plays in continental U.S., with Utica in blue
Also on the agenda that evening were two experts in their fields: Dr. Jeffrey Dick, Chair of the Geology and Environmental Science department at Youngstown State University, who spoke about the hydraulic fracturing process and the available research regarding its impacts from a geological and hydrological perspective; and Dr. Theodore Voneida, professor emeritus of Neurobiology at Northeastern Ohio Universities College of Medicine, who discussed medical concerns with a very moving talk and follow-up video.
The event began as expected – with an air of fear present as to what this consortium of speakers would say about such a potential money-maker for certain mineral rights owners and the local economy. What surprised me by the end of the presentations was the intuitive discussion among residents and attendees of their experiences with the industry and landsmen. (Landsmen are the personnel hired by the gas drilling companies to persuade mineral rights owners to lease their property for natural gas extraction purposes. Historically, there have been many complaints raised about the transparency of the process and the unscrupulous nature of these contracted employees.) Alliance’s residents reported similar experiences. Some were told, “all of your neighbors have leased, so we’ll get the gas out one way or another.” When, in fact, those neighbors (also present at the meeting) had not signed, but were given the same spiel about why they should lease their mineral rights to one company in particular.
The most unfortunate part about witnessing this discussion was the realization that I had heard it all before: in 2009 and 2010 when drilling activity intensified in PA and WV. In fact, residents’ concerns and frustrations were significant driving forces behind the development of FracTracker. People craved access to easy to understand and transparent information about the pace of lease, drilling, and its associated risks. I truly hope that we’ve begun to provide what is needed to make well-informed decisions about natural gas drilling since that time.
Shale gas drilling activity is increasing quickly in Ohio. According to Dr. Dick, there were six drilling rigs working the region in November 2011. By late February 2012, 18 rigs were at work and 76 wells have been permitted. At least 10 different companies are aiming to exploit the Utica Shale in 18 counties of Eastern Ohio. With no end to this surge in site, FracTracker will strive to respond with an increase in Ohio data sets, snapshots, and stories that will keep everyone better informed.
Author Information:
Samantha Malone, MPH, CPH — Communications Specialist, FracTracker; Doctorate of Public Health Student, University of Pittsburgh Graduate School of Public Health, Environmental and Occupational Health Department. Samantha can be reached by email: malone@fractracker.org or phone: 412-648-8541.
https://www.fractracker.org/a5ej20sjfwe/wp-content/uploads/2012/03/UticaShaleMap.png313659FracTracker Alliancehttps://www.fractracker.org/a5ej20sjfwe/wp-content/uploads/2025/09/2025-Wordmark-Logo.pngFracTracker Alliance2012-03-16 16:14:392020-07-21 10:39:35Stepping into the Utica Shale
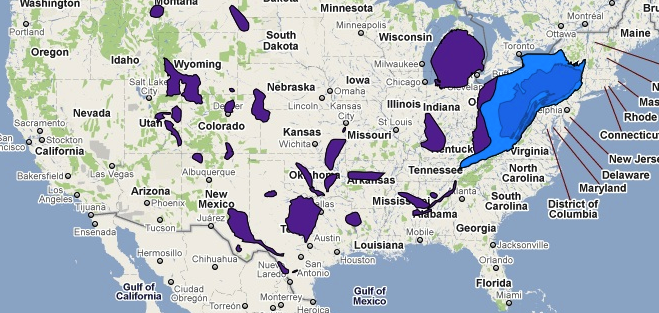
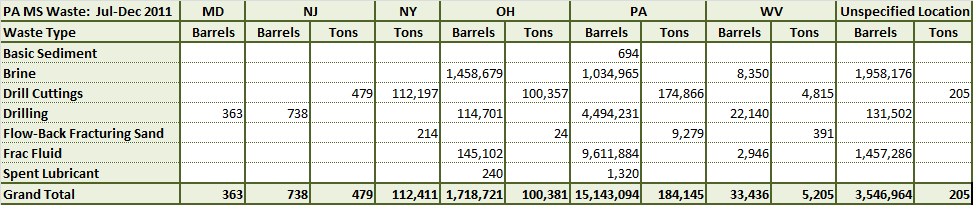
A new dataset has been added to FracTracker’s DataTool which aggregates the waste produced by Marcellus Shale wells in Pennsylvania in the last half of 2011 by the facilities that receive them. And while all of this waste was produced within the Commonwealth, the waste products are disposed of over a wide geographical area, spanning six states:
Note: Due to a change in FracTracker’s mapping utility, data from the last half of 2011 has been replaced by data from the first half of 2013 in the map above. Please press the expanding arrows icon in the top-right corner of the map to access full controls.
One can only guess at the business decisions involved with the shipping of large quantities of waste from Pennsylvania to eastern New Jersey or southern West Virginia. In other shale plays, the majority of waste is disposed of through deep well injections nearby, but it has long been known that Pennsylvania’s geology is unsuitable for these wells (see page 67 of this 2009 report, for example). And the 4.0 New Year’s Eve temblor near caused by waste fluid injection near Youngstown, Ohio has residents and officials in the Buckeye State thinking much the same.
State receiving Pennsylvania Marcellus Shale waste produced from July to December 2011
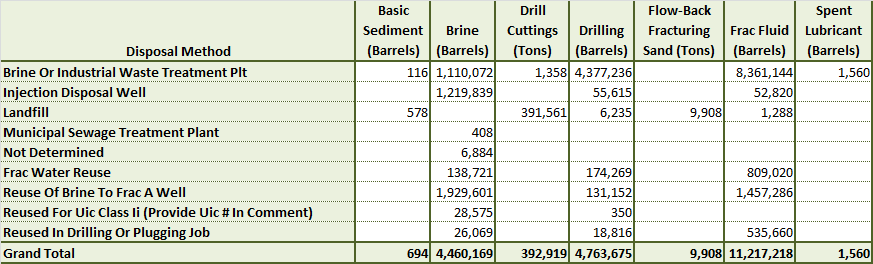
In the chart above, solid waste is measured in tons while liquid waste is measured in barrels. In terms of solid waste, the majority–218,000 tons–is actually shipped out of state. On the other hand, most of the liquid waste is dealt with in Pennsylvania (15.1 million barrels), but the 1.7 million barrels sent to Ohio is certainly significant. The 3.5 million barrels sent to an “unspecified location” is actually good news: the vast majority of that is recycled for use in subsequent wells. Not only does this give operators something constructive to do with the waste they produce, it also helps preserve fresh water resources in the region by offsetting water withdrawals. Here is the same data arranged to show the various methods of disposal:
PA Marcellus Shale waste disposal by method, July-December 2011
While the recycling efforts are starting to make a dent in the overall picture of how Pennsylvania handles its Marcellus Shale waste fluids, it still far from being the primary means of disposal. In fact, two thirds of the liquid waste produced is still being treated at brine and industrial waste facilities, which have a questionable ability to remove total dissolved solids, heavy metals, and other contaminants from waste water, which ultimately works its way back into Pennsylvania’s rivers and streams.
https://www.fractracker.org/a5ej20sjfwe/wp-content/uploads/2025/09/2025-Wordmark-Logo.png00Matt Kelso, BAhttps://www.fractracker.org/a5ej20sjfwe/wp-content/uploads/2025/09/2025-Wordmark-Logo.pngMatt Kelso, BA2012-03-14 15:38:472020-07-21 10:39:35Where Does the Waste From PA’s Marcellus Wells Go?
New York State has had a long history of natural gas drilling. The earliest gas wells were drilled in Fredonia, NY in 1825, and by 1857, engineers had discovered that if they fractured rock layers at the base of a gas well, the process stimulated greater flow of gas from the rock strata. Natural gas has been a common source of fuel for both heat and lighting for many years, and many rural properties in central and western New York have been leased and drilled. The New York State Department of Environmental Conservation lists nearly 40,000 wells in their database. While slightly fewer than half of those wells are now plugged and abandoned, many are still in production. Virtually all of these wells are vertical, conventionally drilled gas wells.
In around 2005, a new wave of gas leasing began in New York State. Companies conducted seismic testing throughout the rural countryside, with “thumper trucks” moving in slow formations along town roads, and helicopters canvassing the region dropping their cargoes of cables that were unrolled across fields and forests to aid in further assessment. Simultaneously, “landsmen”—hired by the gas industries—were going door-to-door, offering leasing deals to homeowners. Promoting a rationale of “energy independence” and appealing signing bonuses, the landsmen were successful in convincing tens of thousands of rural New Yorkers to lease their land for natural gas. With a history of conventional, vertical gas drilling in the area, many landowners did not consider asking an attorney to review the new leases. Furthermore, no mention was made of the recently-developed process of gas extraction: high volume, slickwater, horizontal hydraulic fracturing (HVHF), a technique that industry would want to use for natural gas extraction in the Marcellus Shale.
As awareness about the new extraction process, combining high volume, chemically-enhanced, hydraulic fracturing with horizontal drilling, began to spread among New York State communities, local decision-makers and citizen groups became concerned about risks inherent to the method. Troubling stories of polluted air and drinking water, impacts to human- and livestock health, and economic and social woes connected with rapid industrialization of rural communities spread from Pennsylvania, Colorado, Texas, and Wyoming, where HVHF was well underway.
Yet in New York State, the Department of Environmental Conservation (DEC) houses divisions that potentially work at cross-purposes with each other — one making laws that encourage mineral extraction, and the other that is supposed to oversee protection of land and water resources. Concerned citizens also became aware that changes to the Clean Air and Clean Water Acts, promulgated during the recent Bush administration, now exempted oil and gas drilling. Would there be any legal means of standing up against potentially disastrous industrialization of our rural landscape?
Investigative journalists including Ian Urbina (New York Times) and Abram Lustgarten (ProPublica) published hard-hitting articles that time and again confirmed that New York had a lot to be concerned about if wide-spread HVHF were to come to our state. Scientists stepped forward with additional information that the DEC had not supplied in their draft environmental impact statements. Citizen committees formed to discuss both the science and the social implications of allowing wide-spread gas drilling in our communities.
New York State’s Department of Environmental Conservation laws prevent local governments from regulating oil and gas development. However, home rule rights are also accorded to local governments. While, by law, municipalities cannot regulate industry, many attorneys are now arguing that towns can, on behalf of the health and well-being of their constituents, determine land use laws through zoning and other ordinances. Some of these land use laws may result in effectively banning activities such as HVHF in those towns.
The towns of Dryden (in Tompkins County, NY), and Middlefield (in Otsego County, NY) were two of more than twenty towns that put laws in place in the past year that banned HVHF. In the fall of 2011, Denver-based Anschutz Exploration Corporation sued the Town of Dryden, saying that state laws allowing for drilling pre-empted municipal laws. On February 21, 2012, State Supreme Court Judge Rumsey upheld Dryden’s right to set their own zoning regulations against HVHF stating, “Nowhere in legislative history provided to the court is there any suggestion that the Legislature intended — as argued by Anschutz — to encourage the maximum ultimate recovery of oil and gas regardless of other considerations, or to preempt local zoning authority.”
In Otsego County, the situation was slightly different. A local dairy farmer, who had leased her land sued the Town of Middlefield, asserting that the Town’s ban prevented her from enjoying the full value of her property. Just a week following the Dryden decision, a different judge ruled in the Middlefield case, and decided in favor of the town. Because drilling had not yet begun, the situation could not be considered a “takings.” The judge felt that while New York State can dictate (through regulations) how any industry operates, it is up to the town to decide where those industrial activities may take place.
Until the cases are heard in the Court of Appeals, these decisions stand as the opinion of the courts, but it is possible that there will be additional suits in the lower courts before a final decision is reached that will set the standard statewide. Nonetheless, the Dryden and Middlefield decisions clearly show that the lower courts support local community rights.
Although lawsuits are costly, the towns’ legal efforts have been supplemented by organizations that support the bans, and their costs have been reduced through the generous support of ordinary people. The prospect of additional suits has not deterred New York State’s municipalities from passing bans and moratoria preventing HVHF. To date, 21 towns have established bans, and more than 50 towns have enacted moratoria. Nearly 60 additional towns are in the process of developing bans or moratoria. See below for a map-in-progress within Data.FracTracker.org of the areas where bans and moratoria are in place or in development:
Progress of New York State towns enacting home rule to control impacts of high volume hydraulic fracturing for natural gas:
https://www.fractracker.org/a5ej20sjfwe/wp-content/uploads/2012/03/NYSMoratoria-Icon.png115115Karen Edelsteinhttps://www.fractracker.org/a5ej20sjfwe/wp-content/uploads/2025/09/2025-Wordmark-Logo.pngKaren Edelstein2012-03-01 12:44:072020-07-21 10:39:35NY Local Land Use Laws Upheld in Challenges to Municipal Drilling Prohibitions