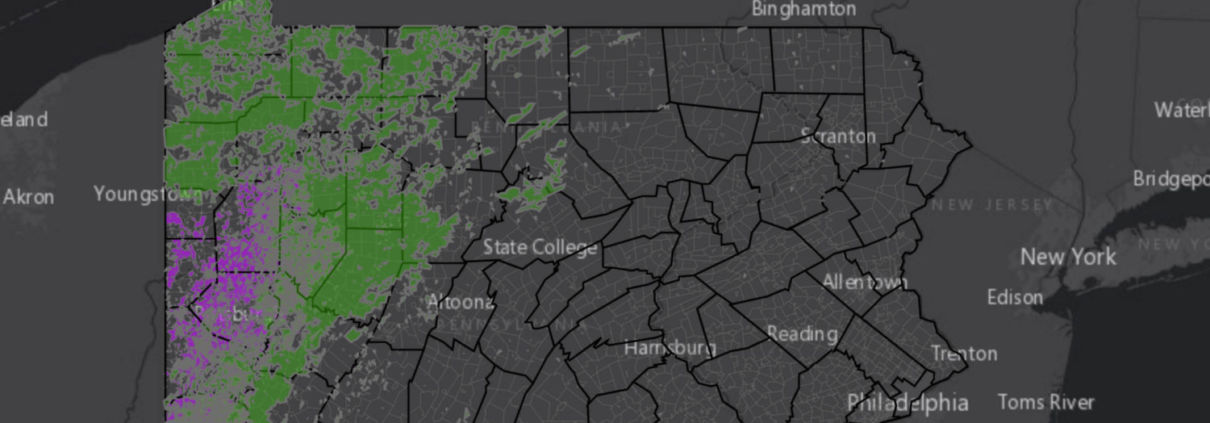
Pennsylvania Conventional Well Map Update
There are over 100,000 active conventional wells in PA, with more permitted each year. Most are unplugged, posing serious threats to the climate.
There are over 100,000 active conventional wells in PA, with more permitted each year. Most are unplugged, posing serious threats to the climate.
This testimony was provided by Shannon Smith, FracTracker Manager of Communications & Development, at the July 23rd hearing on the control of methane & VOC emissions from oil and natural gas sources hosted by the Pennsylvania Department of Environmental Protection (DEP).
My name is Shannon Smith and I’m a resident of Wilkinsburg, Pennsylvania. I am the Manager of Communications and Development at the nonprofit organization FracTracker Alliance. FracTracker studies and maps issues related to unconventional oil and gas development, and we have been a top source of information on these topics since 2010. Last year alone, FracTracker’s website received over 260,000 users. FracTracker, the project, was originally developed to investigate health concerns and data gaps surrounding Western Pennsylvania fracking.
I would like to address the proposed rule to reduce emissions of methane and other harmful air pollution, such as smog-forming volatile organic compounds, which I will refer to as VOCs, from existing oil and gas operations. I thank the DEP for the opportunity to address this important issue.
The proposed rule will protect Pennsylvanians from methane and harmful VOCs from oil and gas sources, but to a limited extent. The proposed rule does not adequately protect our air, climate, nor public health, because it includes loopholes that would leave over half of all potential cuts to methane and VOC pollution from the industry unchecked.
Emissions of the potent greenhouse gas methane and VOC pollution harm communities by contributing to the climate crisis, endangering households and workers through explosions and fires, and causing serious health impairments. Poor air quality also contributes to the economic drain of Pennsylvania’s communities due to increased health care costs, lower property values, a declining tax base, and difficulty in attracting and retaining businesses.
Oil and gas related air pollution has known human health impacts including impairment of the nervous system, reproductive and developmental problems, cancer, leukemia, depression, and genetic impacts like low birth weight.
One indirect impact especially important during the COVID-19 pandemic in 2020, is the increased incidence and severity of respiratory viral infections in populations living in areas with poor air quality, as indicated by a number of studies.
Given the available data, FracTracker Alliance estimates that there are 106,224 oil and gas wells in Pennsylvania. Out of the 12,574 drilled unconventional wells, there have been 15,164 cited violations. Undoubtedly the number of violations would be higher with stricter monitoring.
There is a need for more stringent environmental regulations and enforcement, and efforts to do so should be applauded only if they adequately respond to the scientific evidence regarding risks to public health. These measures are only successful if there is long-term predictability that will ultimately drive investments in clean energy technologies. Emission rollbacks undermine decades of efforts to shift industries towards cleaner practices. So, I urge the DEP to close the loophole in the proposed rulemaking that exempts low-producing wells from the rule’s leak inspection requirements. Low-producing wells are responsible for more than half of the methane pollution from oil and gas sources in Pennsylvania, and all wells, regardless of production, require routine inspections.
I also ask that the Department eliminate the provision that allows operators to reduce the frequency of inspections based on the results of previous inspections. Research does not show that the quantity of leaking components from oil and gas sources indicates or predicts the frequency or quantity of future leaks.
In fact, large and uncontrolled leaks are random and can only be detected with frequent and regular inspections. Short-term peaks of air pollution due to oil and gas activities are common and can cause health impairments in a matter of minutes, especially in sensitive populations such as people with asthma, children, and the elderly. I urge the Department to close loopholes that would exempt certain wells from leak detection and repair requirements, and ensure that this proposal includes requirements for all emission sources covered in DEP’s already adopted standards for new oil and gas sources.
Furthermore, conventional operators should have to report their emissions, and the Department should require air monitoring technologies that have the capacity to detect peaks rather than simply averages. We need adequate data in order to properly enforce regulations and meet Pennsylvania’s climate goals of decreasing greenhouse gas emissions by 80% by 2050.
Pine Creek compressor station FLIR camera footage by Earthworks (May 2019).
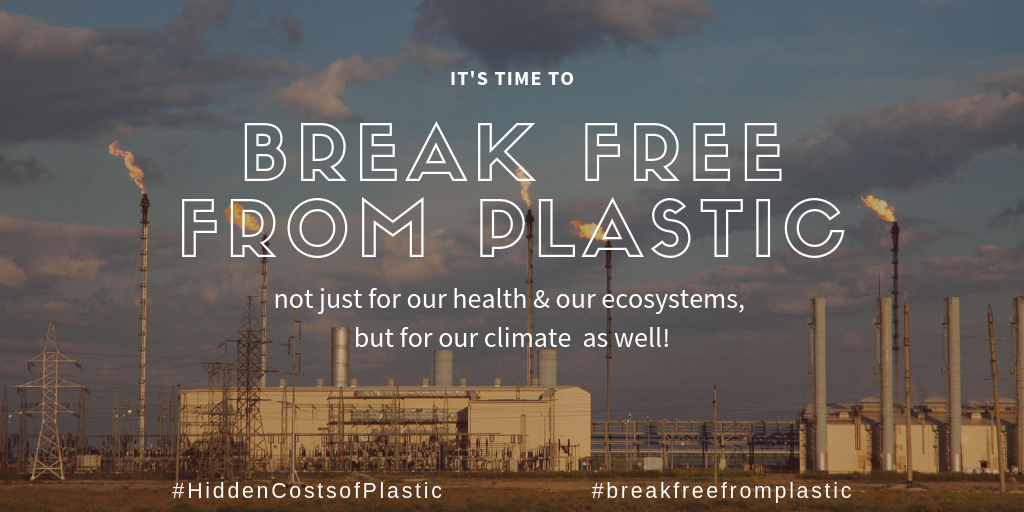
Plastic has been getting a lot of negative press lately.
It’s killing marine life, forming vortexes in the ocean, and being burned instead of recycled. But until recently, most of the attention has focused on plastic pollution – the waste that turns up after a product has served its purpose.
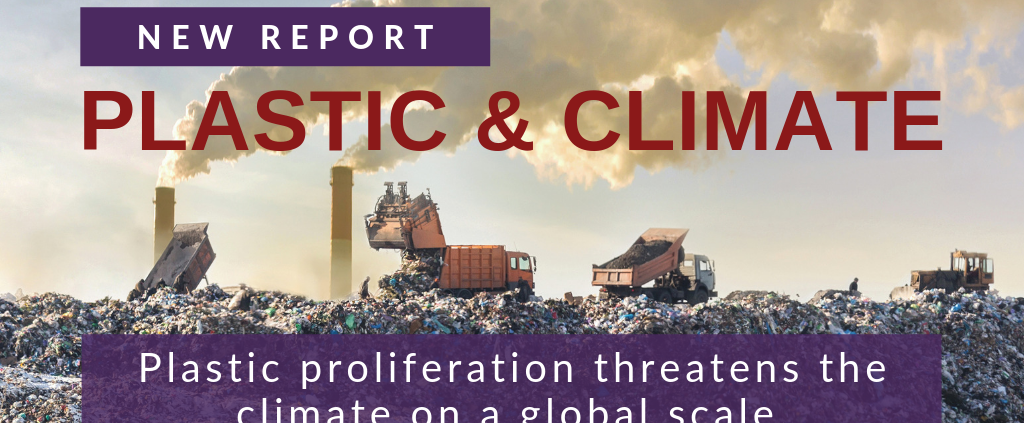
Now that’s changed- the Center for International Environmental Law (CIEL) has recently released “Hidden Costs of a Plastic Planet;” two reports that show us the consequences of plastic across its entire lifecycle. The first, Plastic & Health, explores human health impacts, while the second Plastic & Climate, tackles greenhouse gas emissions.
For the first time, we know the full scope of plastic’s impact – and it’s not looking good.
FracTracker is proud to partner with CIEL and several other organizations, including Earthworks, 5 Gyres, TEJAS, UPSTREAM, GAIA, Exeter University, and Environmental Integrity Project to release these reports.
Access the full reports and executives summaries here:
These reports make it clear: the impacts of plastic are serious, and they’re everywhere. We have the evidence to justify an immediate global move away from our disposable, single-use lifestyle. Tackling this toxic crisis will require action across all levels of society- corporations must consider the full life cycle of their products, policy makers must enact plastic reduction measures, and of course, industry needs to rectify its toxic impacts. Eager to encourage these entities to take action, the FracTracker team is committed to doing our own part to solve this plastics problem, and we hope that it inspires individuals, companies, community leaders, and politicians to join in.
Here’s what we’re doing to help the world #BreakFreeFromPlastic:
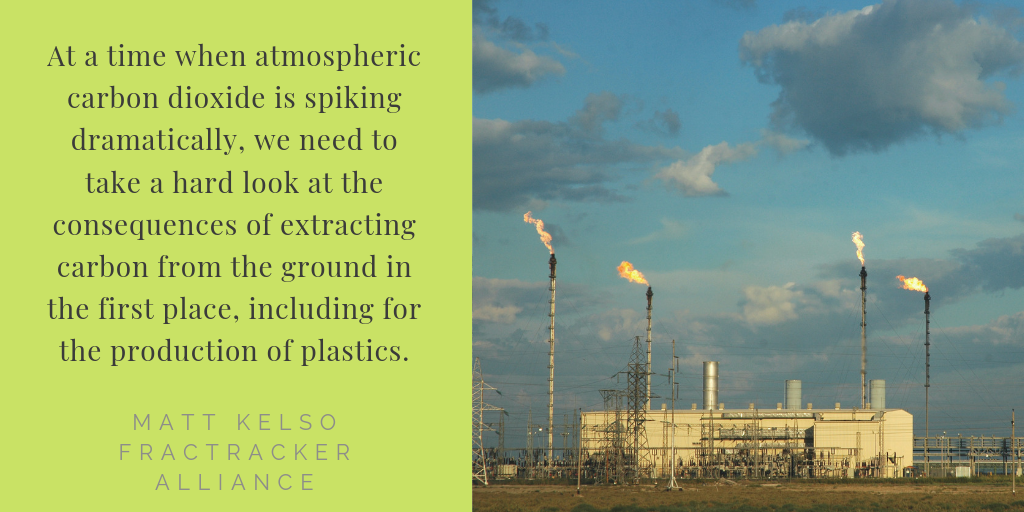
Since over 99% of plastic is made from oil and gas, keeping fossil fuels in the ground is the only way to eliminate all of plastic’s toxic impacts. Plastic & Climate found that extracting and transporting oil and gas for plastic production releases over 100 million metric tons of carbon dioxide equivalents per year. There are many opportunities for these releases to occur, including from methane leakage and flaring, the drilling process, deforestation of forests for pipelines and well pads, and emissions from truck traffic.
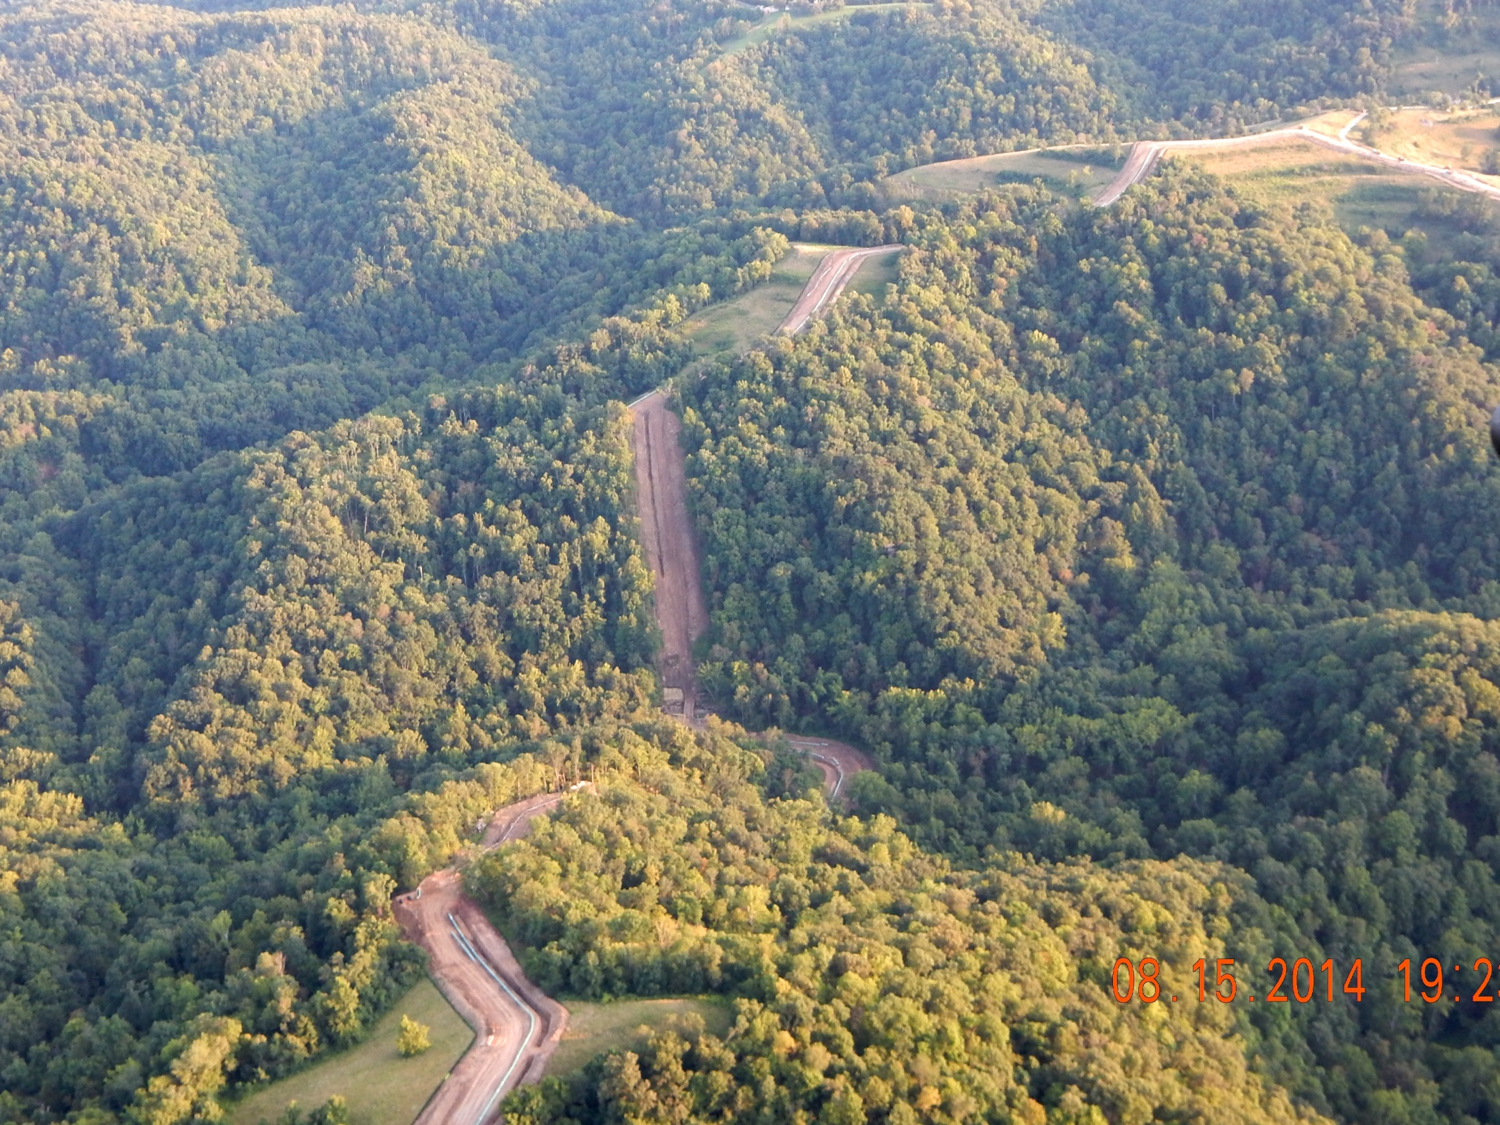
Pipeline construction causes deforestation, releasing carbon stored in trees and preventing further carbon sequestration
The FracTracker team will continue to study, map, and analyze the risks of this industry to encourage both a switch to renewable energy and a movement away from plastic production.
Unconventional technology has opened up access to large reserves of natural gas liquids, such as ethane, and plastic manufacturing is one way to increase demand for this glut. In fact, the oil and gas industry is hoping to increase demand for plastic worldwide by 40%! Two regions with access to natural gas liquids that are rapidly expanding plastics manufacturing capacity are the Gulf Coast and the Ohio River Valley.
Eager to justify this build-out, politicians and industries tout the ways plastic is part of a sustainable future. They say that without investing in plastic, we’re not taking full advantage of our resources, and that by using natural gas to make plastic instead of burning it, we’re keeping greenhouse gasses from entering the atmosphere. Speaking on manufacturing plastic from natural gas with public radio station WHYY, Pennsylvania’s Governor Wolf stated:
“I want to move to a point where what we’re using the gas for is for products that go into that sustainable energy future: lightweight products…so that we’re not burning this, we’re actually creating products that would make that energy future that we all want, that would address the issues of climate change in an effective way.”
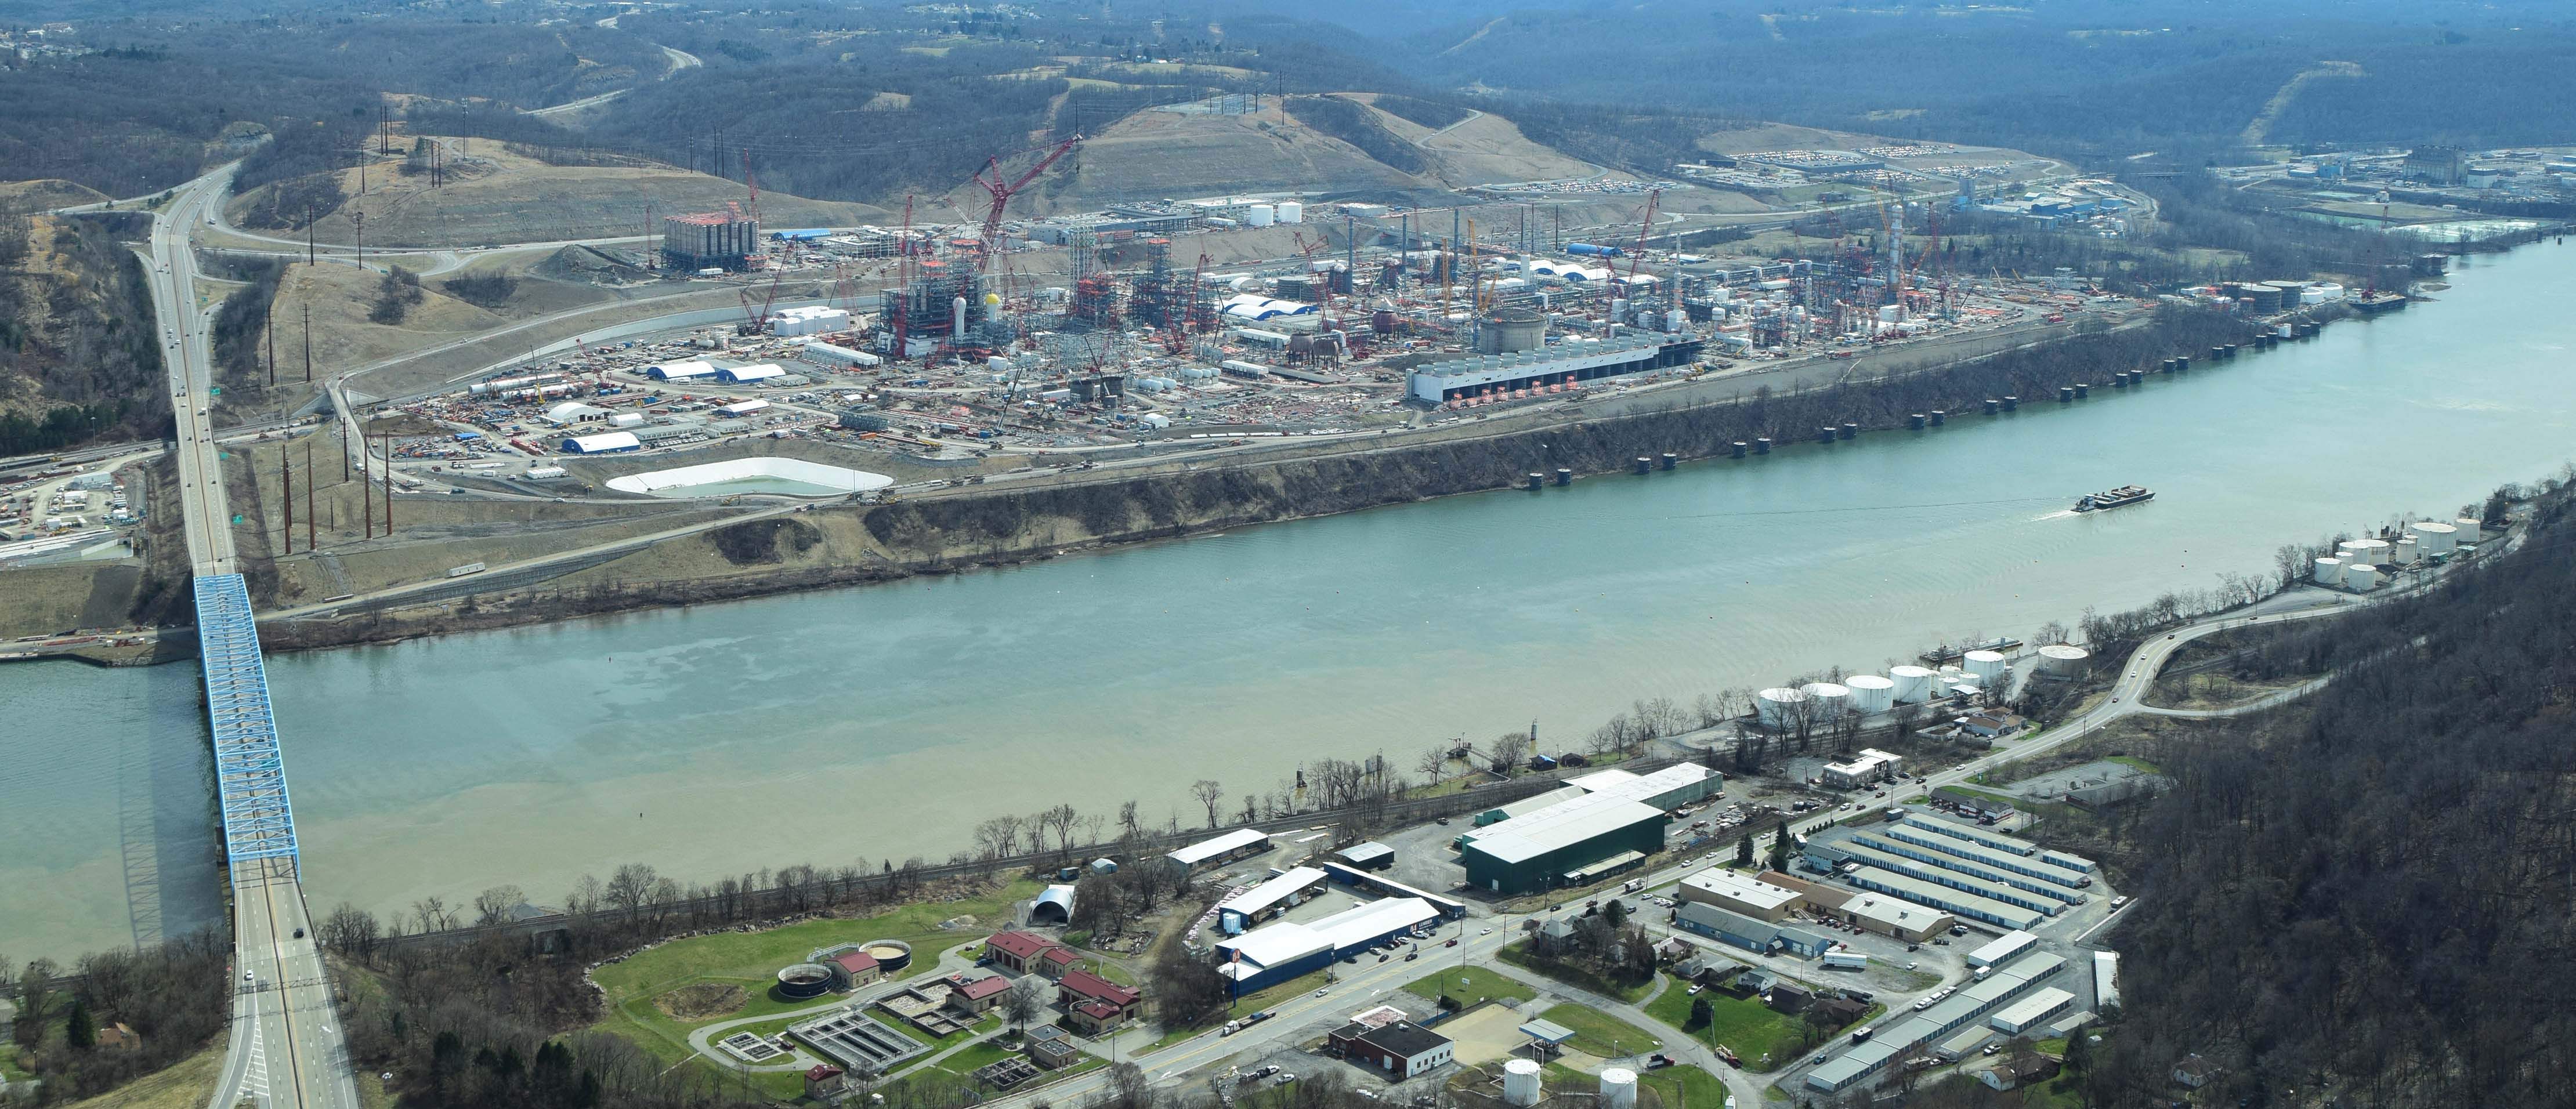
The Shell Ethane Cracker in Pennsylvania is projected to produce 1.6 million tons of plastic per year, which Governor Wolf states is part of a “sustainable energy future.” Photo by Ted Auch, aerial assistance by LightHawk.
But the data say otherwise.
Plastic does not address the issues of climate change. In fact, using natural gas for plastic perpetuates climate change. Climate & Plastics found that this year, “the production and incineration of plastic will add more than 850 million metric tons of greenhouse gases to the atmosphere—equal to the emissions from 136 one-thousand-megawatt coal power plants.” If plastic production grows as currently predicted, by 2030, emissions could reach 1.34 gigatons per year, or 291 new coal plants.
The rate of plastic production is directly at odds with global carbon emissions targets.
While plastic can be used for lightweight parts of electric vehicles or reusable materials, the plastic being produced by the current build out is primarily polyethylene plastic, most commonly used for packaging and single use products- plastic bags, bottles, jugs, containers, and plastic films and linings; products that countries and cities are phasing out.
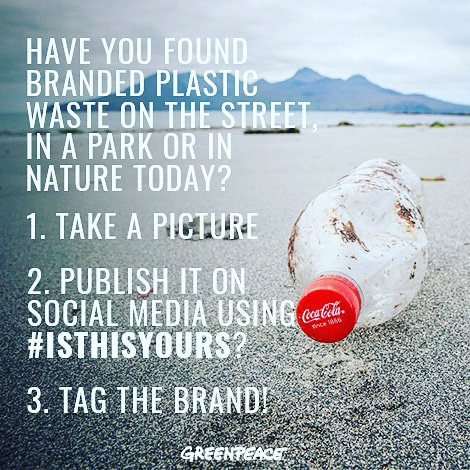
Source: Greenpeace Canada
While renewable energy is becoming increasingly available, so too are plastic alternatives. Across the world, communities are rethinking the products we use everyday. Thanks to historic legislation, zero waste stores, and towns, and plastic-free bloggers, it’s never been a better time to cut back on plastic – and the FracTracker team is doing our part.
Rebecca, our Administrative and Human Resources Specialist, has cut her plastic use by switching to toothpaste tablets and bars of soap. Karen, our Eastern Program Coordinator, makes her own reusable beeswax food wraps. And Erica Jackson and Isabelle Weber in the Pittsburgh office keep reusable utensils in their backpacks. The whole team is cutting back on single-use plastic products, and are always on the look-out for non oil and gas-based products.
We also realize that with companies like Coca Cola selling 3,000 plastic bottles every second, and Nestlé producing 1.7 million tons of plastic packaging a year, corporations play a key role in this movement.
Through the Story of Stuff’s #Messageinabottle project and Greenpeace’s #Isthisyours campaign, we’re also encouraging corporations to reimagine how the package and transport products.
Now YOU know, what will you do to help your company, community, or yourself #BreakFreeFromPlastic?

For Immediate Release
Contact: Lee Ziesche, lee@saneenergyproject.org, 954-415-6282
Interactive Map Shows Expansion of Fracked Gas Infrastructure in New York State
And showcases powerful community resistance to it
New York, NY – A little over a year after 55 New Yorkers were arrested outside of Governor Cuomo’s door calling on him to be a true climate leader and halt the expansion of fracked gas infrastructure in New York State, grassroots advocates Sane Energy Project re-launched the You Are Here (YAH) map, an interactive map that shows an expanding system of fracked infrastructure approved by the Governor.
“When Governor Cuomo announced New York’s climate goals in early 2019, it’s clear there is no room for more extractive energy, like fossil fuels.” said Kim Fraczek, Director of Sane Energy Project, “Yet, I look at the You Are Here Map, and I see a web of fracked gas pipelines and power plants trapping communities, poisoning our water, and contributing to climate change.”
Sane Energy originally launched the YAH map in 2014 on the eve of the historic People’s Climate March, and since then, has been working with communities that resist fracked gas infrastructure to update the map and tell their stories.
“If you read the paper, you might think Governor Cuomo is a climate leader, but one look at the YAH Map and you know that isn’t true. Communities across the state are living with the risks of Governor Cuomo’s unprecedented buildout of fracked gas infrastructure,” said Courtney Williams, a mother of two young children living within 400 feet of the AIM fracked gas pipeline. “The Governor has done nothing to address the risks posed by the “Algonquin” Pipeline running under Indian Point Nuclear Power Plant. That is the center of a bullseye that puts 20 million people in danger.”
Fracked gas infrastructure poses many of the same health risks as fracking and the YAH map exposes a major hypocrisy when it comes to Governor Cuomo’s environmental credentials. The Governor has promised a Green New Deal for New York, but climate science has found the expansion of fracking and fracked gas infrastructure is increasing greenhouse gas emissions in the United States.
“The YAH map has been an invaluable organizing tool. The mothers I work with see the map and instantly understand how they are connected across geography and they feel less alone. This solidarity among mothers is how we build our power ,” said Lisa Marshall who began organizing with Mothers Out Front to oppose the expansion of the Dominion fracked gas pipeline in the Southern Tier and a compressor station built near her home in Horseheads, New York. “One look at the map and it’s obvious that Governor Cuomo hasn’t done enough to preserve a livable climate for our children.”
“Community resistance beat fracking and the Constitution Pipeline in our area,” said Kate O’Donnell of Concerned Citizens of Oneonta and Compressor Free Franklin. “Yet smaller, lesser known infrastructure like bomb trucks and a proposed gas decompressor station and 25 % increase in gas supply still threaten our communities.”
The YAH map was built in partnership with FracTracker, a non-profit that shares maps, images, data, and analysis related to the oil and gas industry hoping that a better informed public will be able to make better informed decisions regarding the world’s energy future.
“It has been a privilege to collaborate with Sane Energy Project to bring our different expertise to visualizing the extent of the destruction from the fossil fuel industry. We look forward to moving these detrimental projects to the WINS layer, as communities organize together to take control of their energy future. Only then, can we see a true expansion of renewable energy and sustainable communities,” said Karen Edelstein, Eastern Program Coordinator at Fractracker Alliance.
Throughout May and June Sane Energy Project and 350.org will be traveling across the state on the ‘Sit, Stand Sing’ tour to communities featured on the map to hold trainings on nonviolent direct action and building organizing skills that connect together the communities of resistance.
“Resistance to fracking infrastructure always starts with small, volunteer led community groups,” said Lee Ziesche, Sane Energy Community Engagement Coordinator. “When these fracked gas projects come to town they’re up against one of the most powerful industries in the world. The You Are Here Map and ‘Sit, Stand Sing’ tour will connect these fights and help build the power we need to stop the harm and make a just transition to community owned renewable energy.”
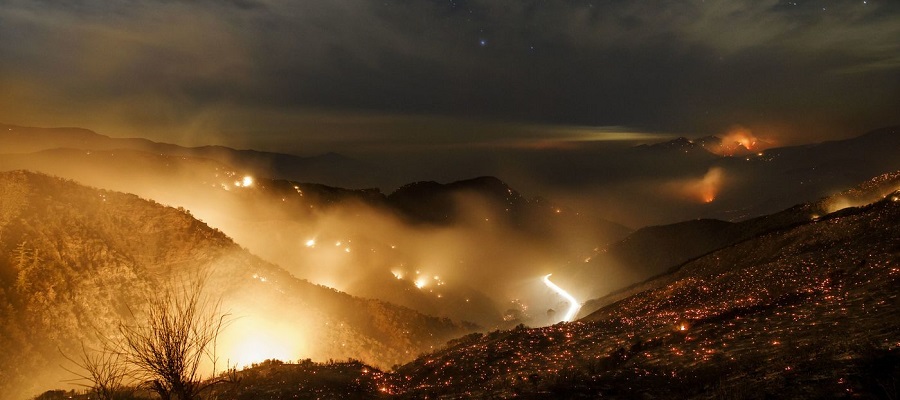
Never has the saying “adding fuel to the fire” been so literal.
California wildfires have been growing at unheard of rates over the last five years, causing record breaking destruction and loss of life. Now that we’ve had a little rain and perhaps a reprieve from this nightmare wildfire season, it is important to consider the factors influencing the risk and severity of fires across the state.
Oil and gas extraction and consumption are major contributors to climate change, the underlying factor in the recent frequent and intense wildfires. A lesser-known fact, however, is that many wildfires have actually burned in oil fields in California – a dangerous circumstance that also accelerates greenhouse gas emissions. Our analysis shows where this situation has occurred, as well as the oil fields most likely to be burned in the future.
First, we looked at where wildfires are currently burning across the state, shown below in Map 1. This map is from CAL FIRE and is continuously updated.
CAL FIRE map showing the locations and perimeters of California wildfires
The two largest wildfires in California recorded history occurred last year. The Mendocino Complex Fire burned almost a half million acres (1,857 square kilometers) in Mendocino National Forest. The Thomas Fire in the southern California counties of Ventura and Santa Barbara burned nearly 282,000 acres (1,140 square kilometers). A brutal 2017 fire season, however is now overshadowed by the ravages of 2018’s fires.
With the effects of climate change increasing the severity of California’s multi-year drought, each fire season seems to get worse. The Woolsey Fire in Southern California caused a record amount of property damage in the hills of Santa Monica and Ventura County. The Camp Fire in the historical mining town of Paradise resulted in a death toll that, as of early December, has more than tripled any other wildfire. And many people are still missing.
A most precarious situation erupts when a wildfire spreads to an oil field. Besides having a surplus of their super flammable namesake liquid, oil fields are also storage sites for various other hazardous and volatile chemicals. The Thomas Fire was such a scenario.
The Thomas fire burned through the steep foothills of the coastal Los Padres mountains into the oil fields. When in the oil fields, the oil pumped to the surface for production and the stores of flammable chemicals provided explosive fuel to the wildfire. While firefighters were able to get the majority of the fire “contained,” the oil fields were too dangerous to access. According to the community, oil fires remained burning for weeks before they were able to be extinguished.
The Ventura office of the Division of Oil Gas and Geothermal Resources (DOGGR) reported that the Thomas Fire burned through the Taylor Ranch oil fields and a half dozen other oil fields including the Ventura, San Miguelito, Rincon, Ojai, Timbe Canyon, Newhall-Portrero, Honor Rancho and Wayside Canyon. DOGGR Ventura officials said Newhall-Potrero was “half burned over.” Thomas also burned within a 1/3 mile of the Sespe oil field. Schools and other institutions closed down throughout the Los Angeles Basin, but DOGGR said there was no impact on oil and gas operations that far south. The fire spurred an evacuation of the Las Flores Canyon Exxon oil storage facility but thankfully was contained before reaching the facility.
View map fullscreen | How FracTracker maps work
The Thomas Fire was not the first time or the last time an oil field burned in a California wildfire. Map 2 above shows state wildfires from the last 20 years overlaid with maps of California oil fields, oil wells, and high threat wildfire zones. The map shows just the oil fields and oil and gas wells in California that have been burned by a wildfire.
We found that 160 of California’s 517 oil fields (31%) have been burned by encroaching wildfires, affecting more than 10,000 oil and gas well heads.
An ominous finding: the state’s highest threat zones for wildfires are located close to and within oil and gas fields.
The map shows that wildfire risk is greatest in Southern California in Ventura and Los Angeles counties due to the arid environment and high population density. Over half the oil fields that have burned in California are in this small region.
Reports show that climate change has become the greatest factor in creating the types of conditions conducive to uncontrollable wildfires in California. Climate scientists explain that climate change has altered the natural path of the Pacific jet stream, the high-altitude winds that bring precipitation from the South Pacific to North America.
In a recent study, researchers from the University of Idaho and Columbia University found that the impact of global warming is growing exponentially. Their analysis shows that since 2000, human-caused climate change prompted 75% more aridity — causing peak fire season to expand every year by an average of nine days. The Fourth National Climate Assessment details the relationship between climate change and wildfire prevalence, and comes to the same conclusion: impacts are increasing.
On the cause of wildfires, the report explains:
Compound extremes can include simultaneous heat and drought such as during the 2011–2017 California drought, when 2014, 2015, and 2016 were also the warmest years on record for the state; conditions conducive to the very large wildfires, that have already increased in frequency across the western United States and Alaska since the 1980s.
Both 2017 and 2018 have continued the trend of warmest years on record, and so California’s drought has only gotten worse. The report goes on to discuss the threat climate change poses to the degradation of utilities’ infrastructure. Stress from climate change-induced heat and drought will require more resources dedicated to maintaining utility infrastructure.
The timing of this report could not be more ironic considering the role that utilities have played in starting wildfires in California. Incidents such as transformer explosions and the degradation of power line infrastructure have been implicated as the causes of multiple recent wildfires, including the Thomas Fire and the most recent Woolsey and Camp wildfires – three of the most devastating wildfires in state history. As public traded corporations, these utilities have investors that profit from their contribution to climate change which, in turn, has created the current conditions that allow these massive wildfires to spread. On the other hand, utilities in California may be the least reliant on fossil fuels. Southern California Edison allows customers to pay a surcharge for 100% renewable service, and Pacific Gas and Electric sources just 20% of their electricity from natural gas.
As a result of the fire cases, each of which might be attributed to negligence, stock prices for the two utilities plummeted but eventually rebounded after the California Public Utilities Commission (CPUC) assured investors that the utilities would be “bailed out” in the case of a possible financial failure to the reproach of the general public. The CPUC assured that the state could bail out utilities if they were forced to finance recovery for the fires they may have caused.
CPUC President, Michael Picker, stated:
The CPUC is one of the government agencies tasked with ensuring that investor-owned utilities operate a safe and reliable grid… An essential component of providing safe electrical service is the financial wherewithal to carry out safety measures.
Along with regulation and oversight, part of the agency’s work involves ensuring utilities are financially solvent enough to carry out safety measures.
January 1, 2019 will mark the seventh year of drought in California. Each fall brings anxiety and dread for state residents, particularly those that live in the driest, most arid forests and chaparral zones. Data show that the wildfires continue to increase in terms of intensity and frequency as the state goes deeper into drought induced by climate change.
While California firefighters have been incredibly resourceful, over 70% of California forest land is managed by the federal government whose 2019 USDA Forest Service budget reduces overall funding for the National Forest System by more than $170 million. Moving forward, more resources must be invested in supporting the health of forests to prevent fires with an ecological approach, rather than the current strategy which has focused predominantly on the unsustainable practice of fuel reduction and the risky tactics of “fire borrowing”. And of course, the most important piece of the puzzle will be addressing climate change.
For information on protecting your home from wildfires, see this Military Home Search’s Guide.
By Kyle Ferrar, Western Program Coordinator, FracTracker Alliance
Feature image by Marcus Yam, LA Times
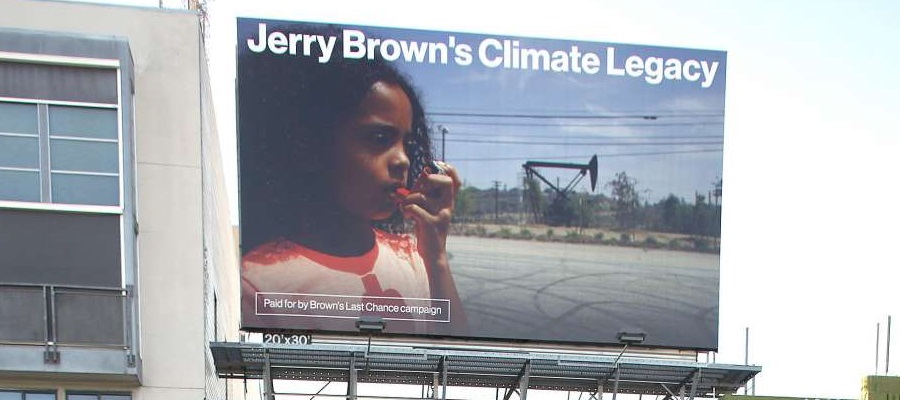
California has become a battleground for real climate action. The state Governor, Jerry Brown prides himself in his own climate leadership, and California has pushed EU nations and countries worldwide to take climate change seriously. As a final tribute to his own tenure as a term-limited governor, Brown has organized and hosted a Global Climate Action Summit, September 12-14th. The summit convenes an international invitation list of “climate leaders” to, in their words:
“Take Ambition to the Next Level.” It will be a moment to celebrate the extraordinary achievements of states, regions, cities, companies, investors and citizens with respect to climate action. It will also be a launchpad for deeper worldwide commitments and accelerated action from countries—supported by all sectors of society—that can put the globe on track to prevent dangerous climate change and realize the historic Paris Agreement.
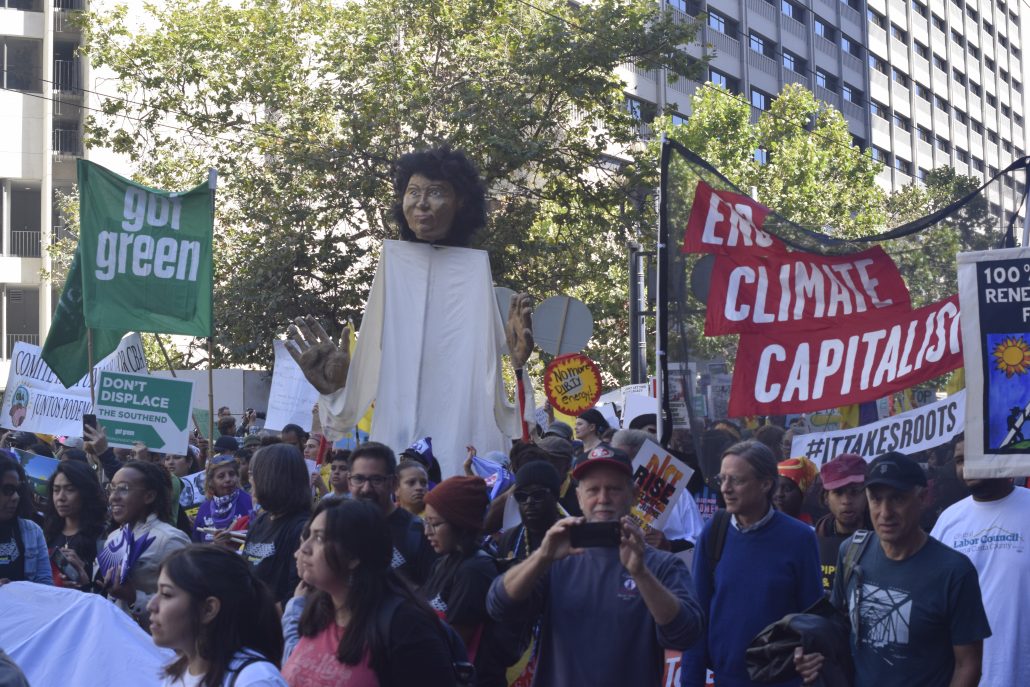
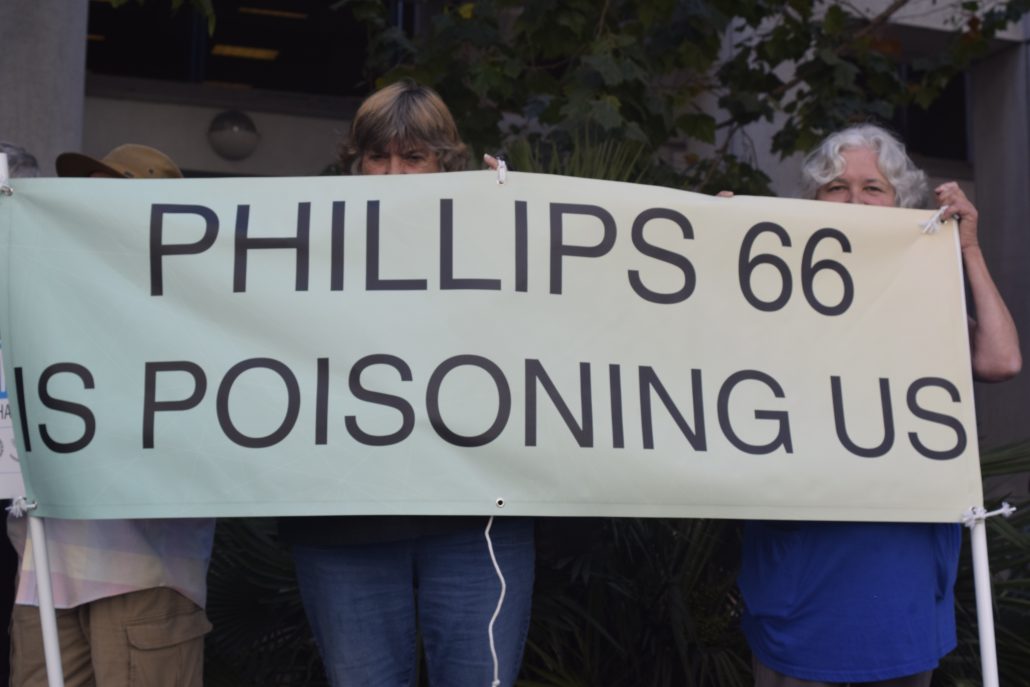
Meanwhile, frontline communities, community organizers, and grassroots organizations contest the perspective that real change has been made. While investors and green capitalists celebrate, frontline communities fight daily for clean air and water. In solidarity with and led by frontline communities, activists have protested the summit, in an attempt to hold policy makers accountable to those most affected by the fossil fuel industry.
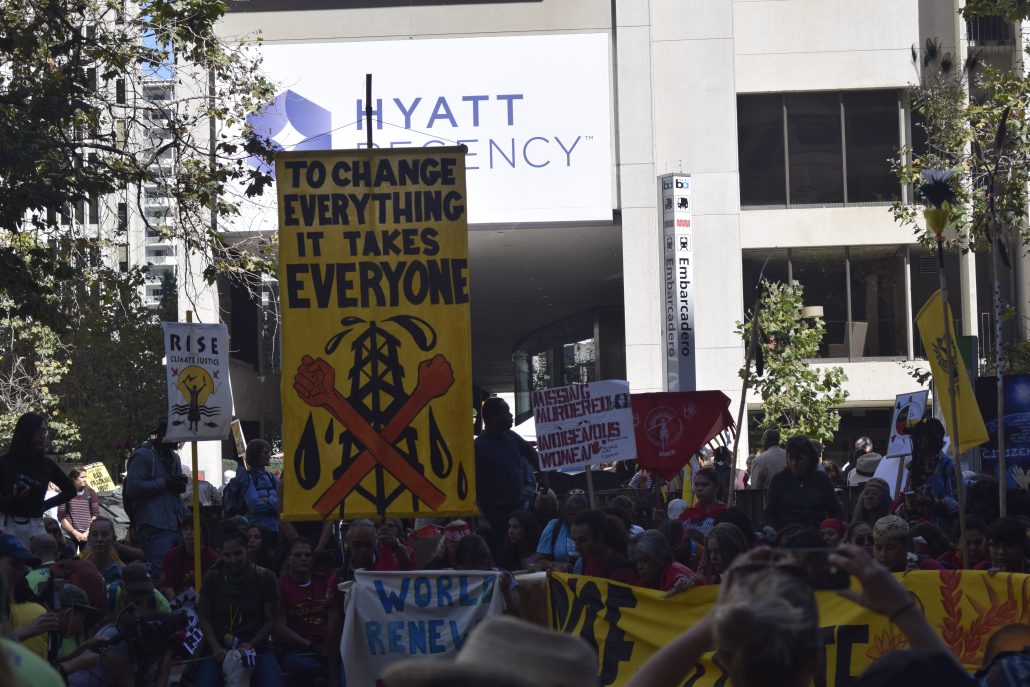
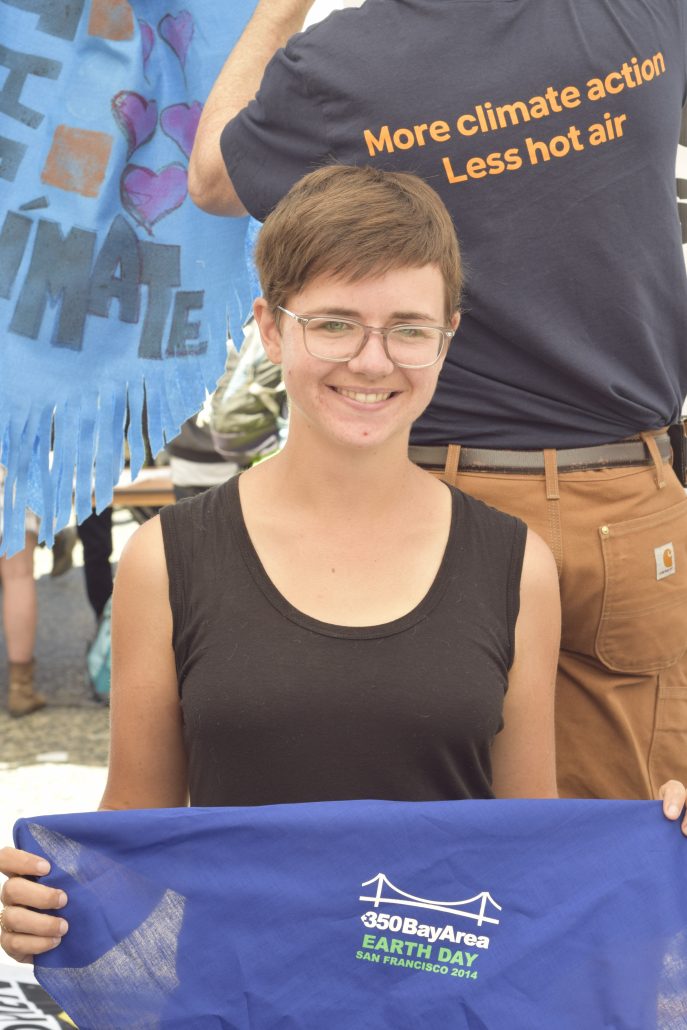
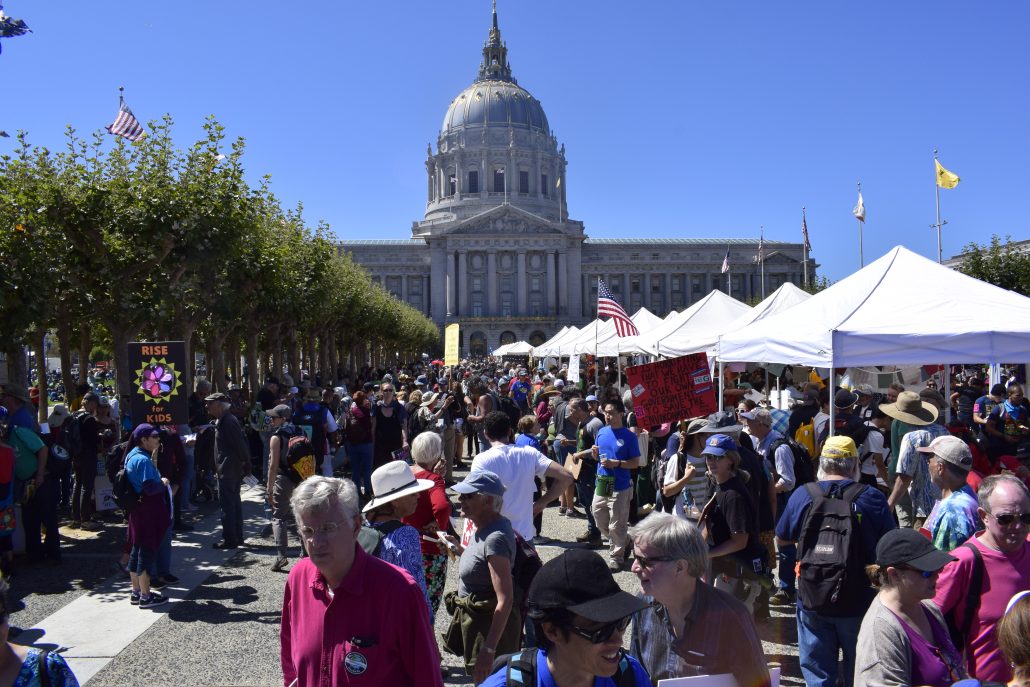
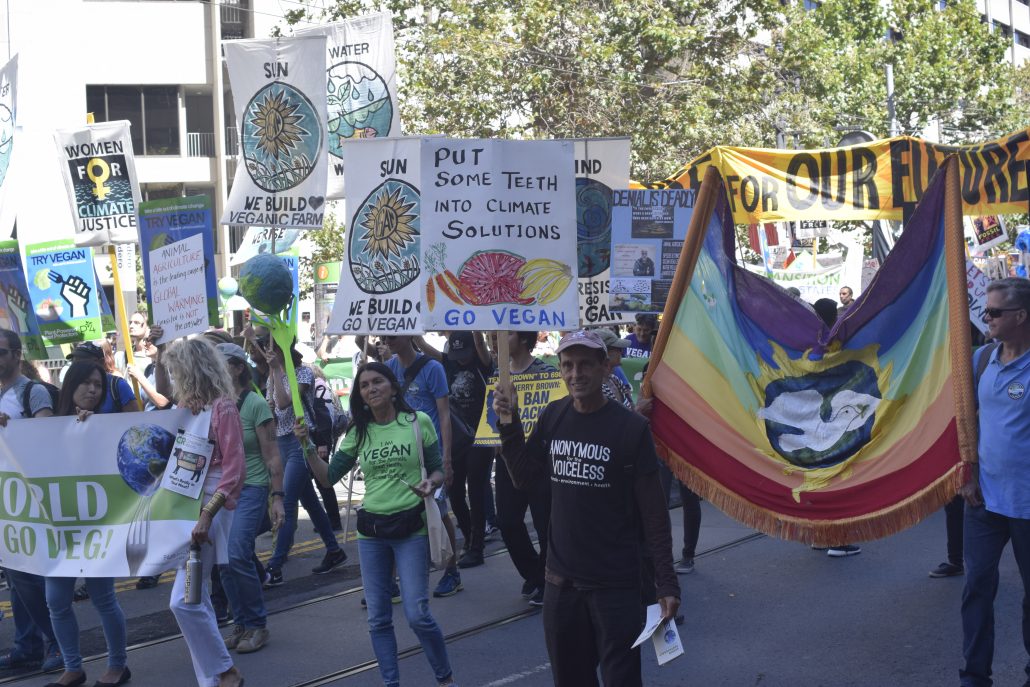
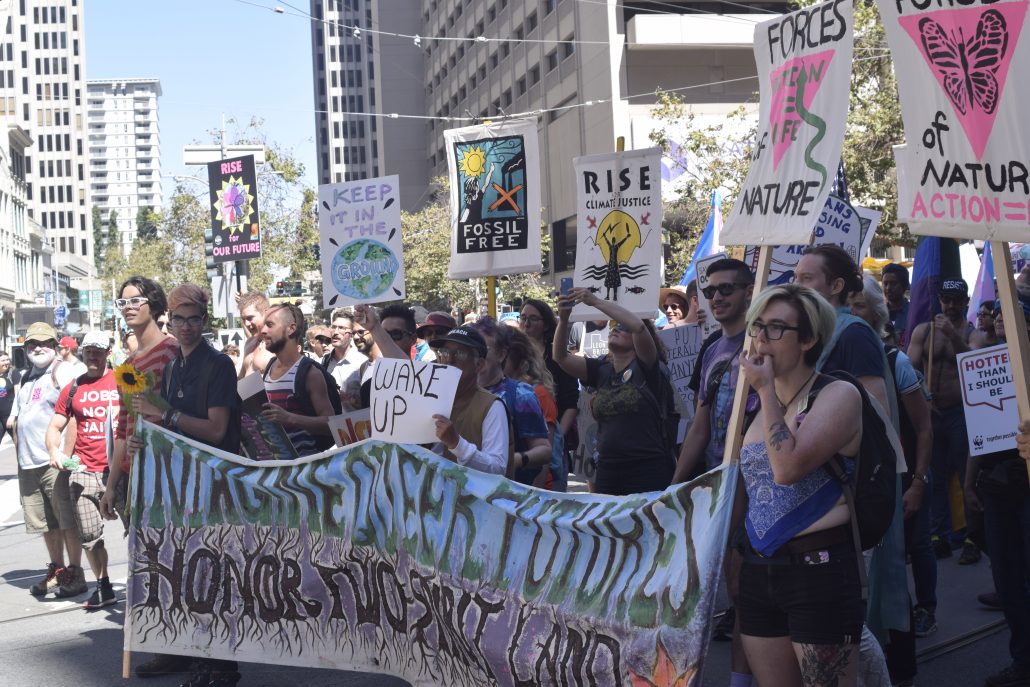
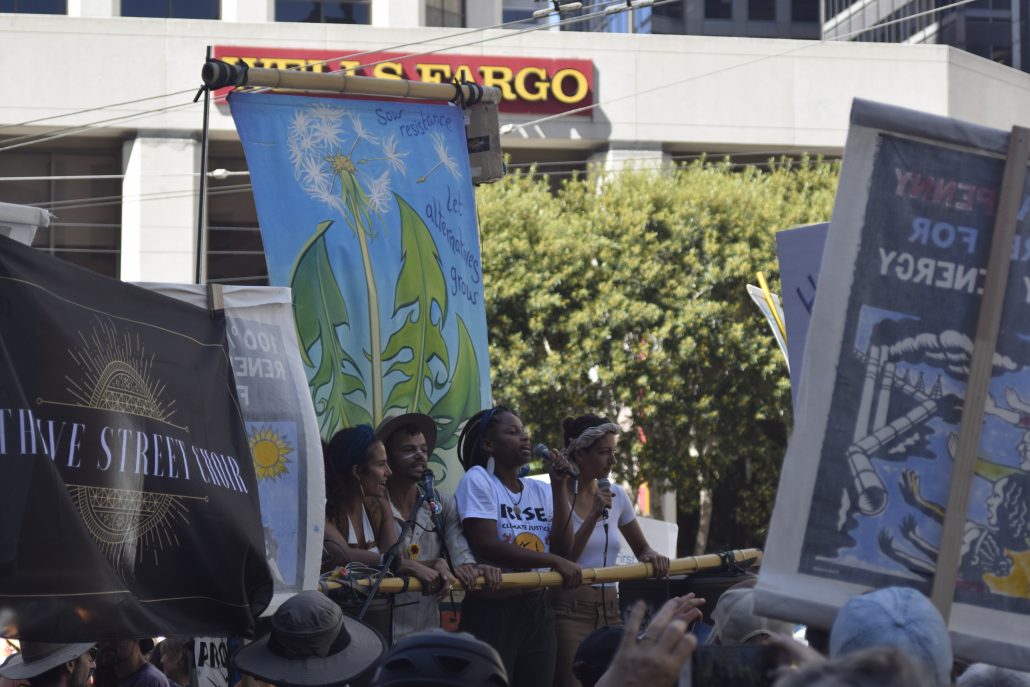
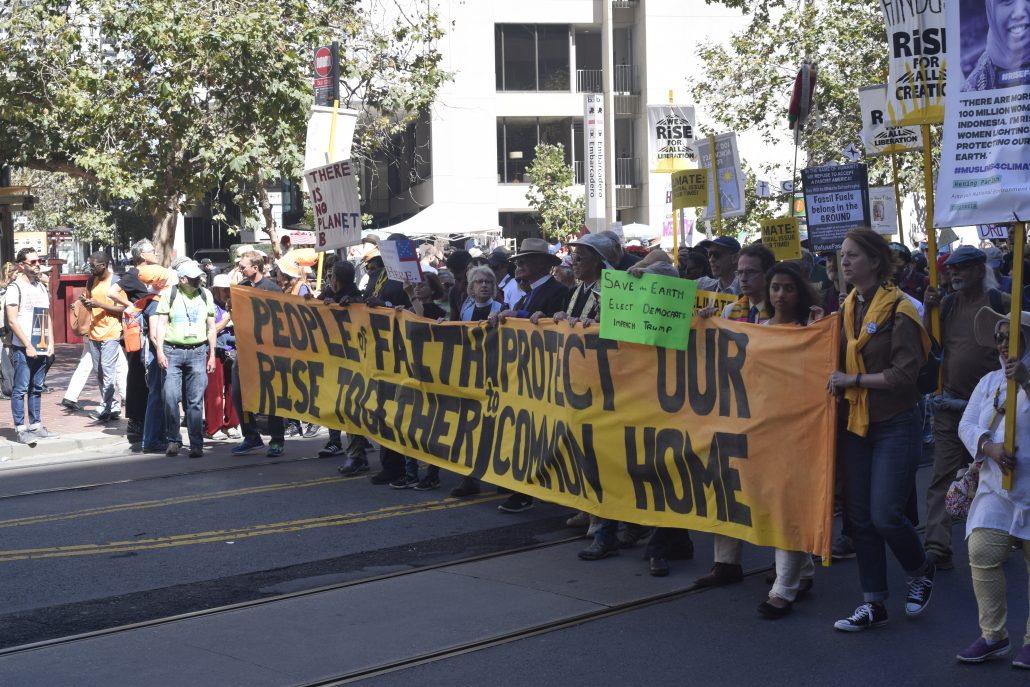
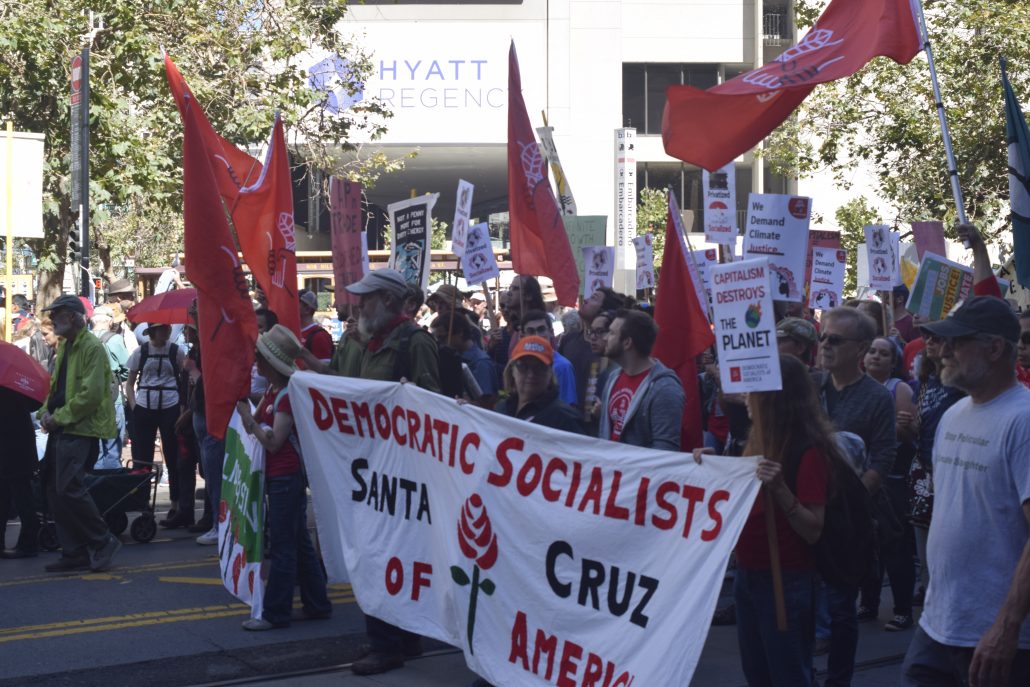
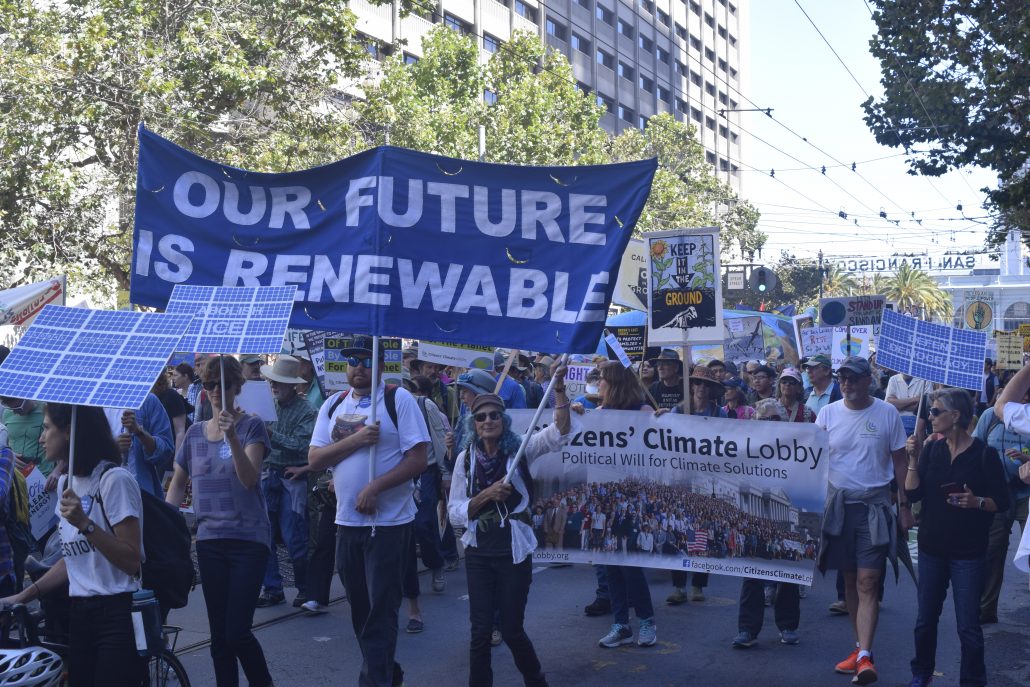
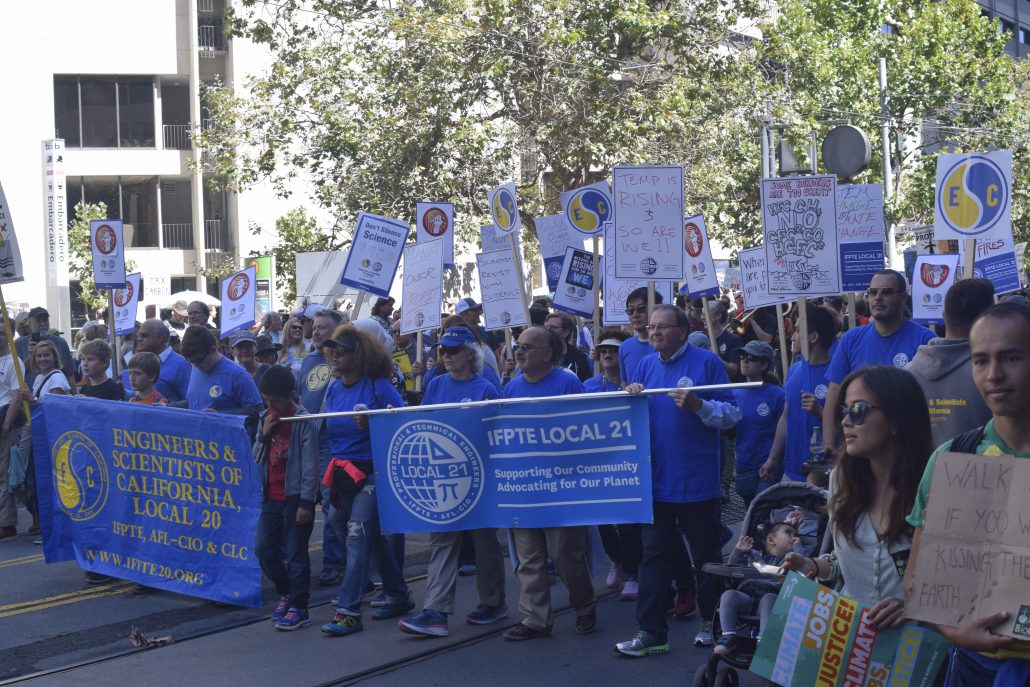
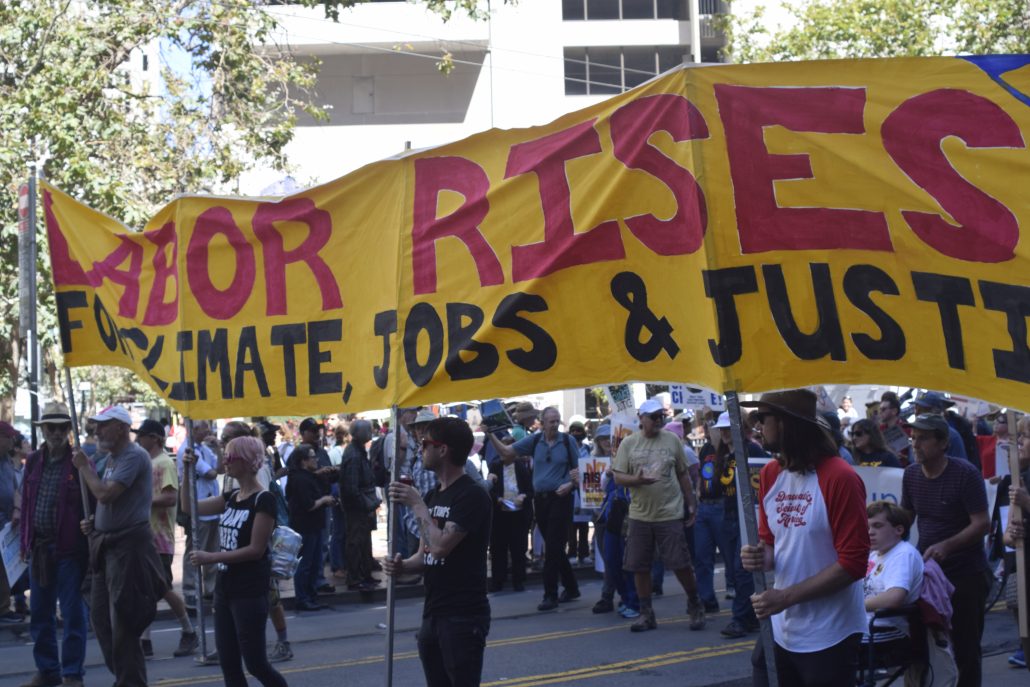
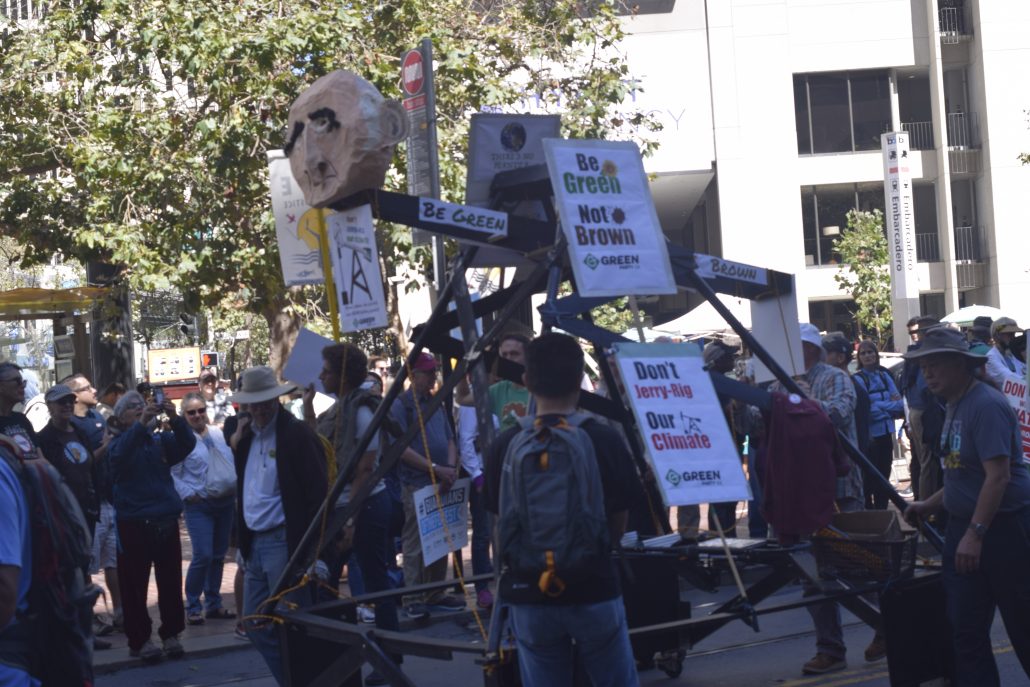
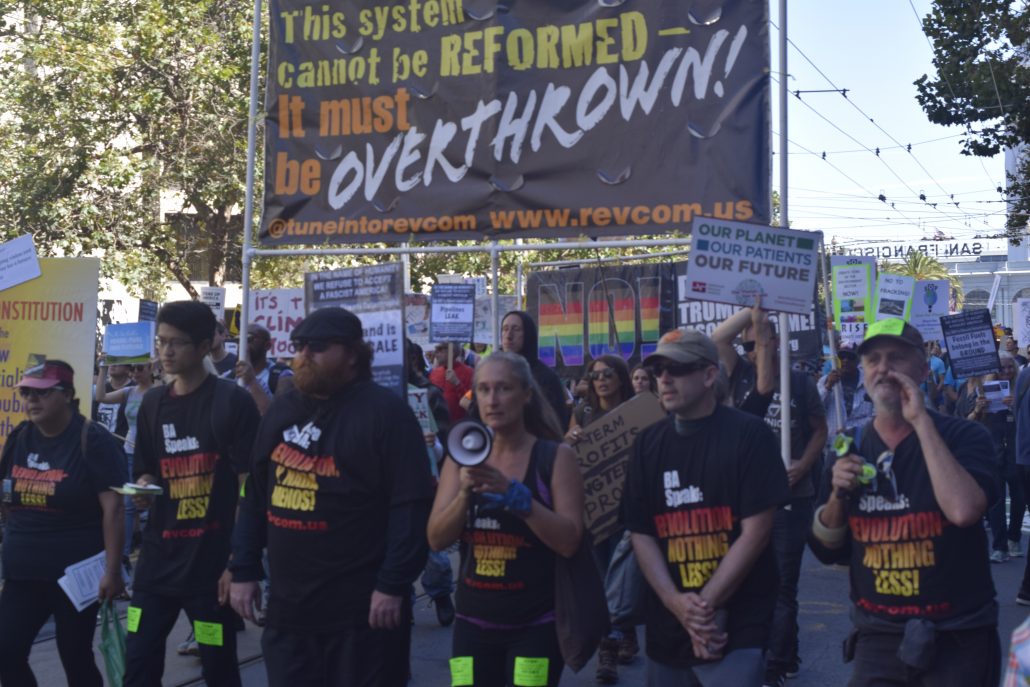
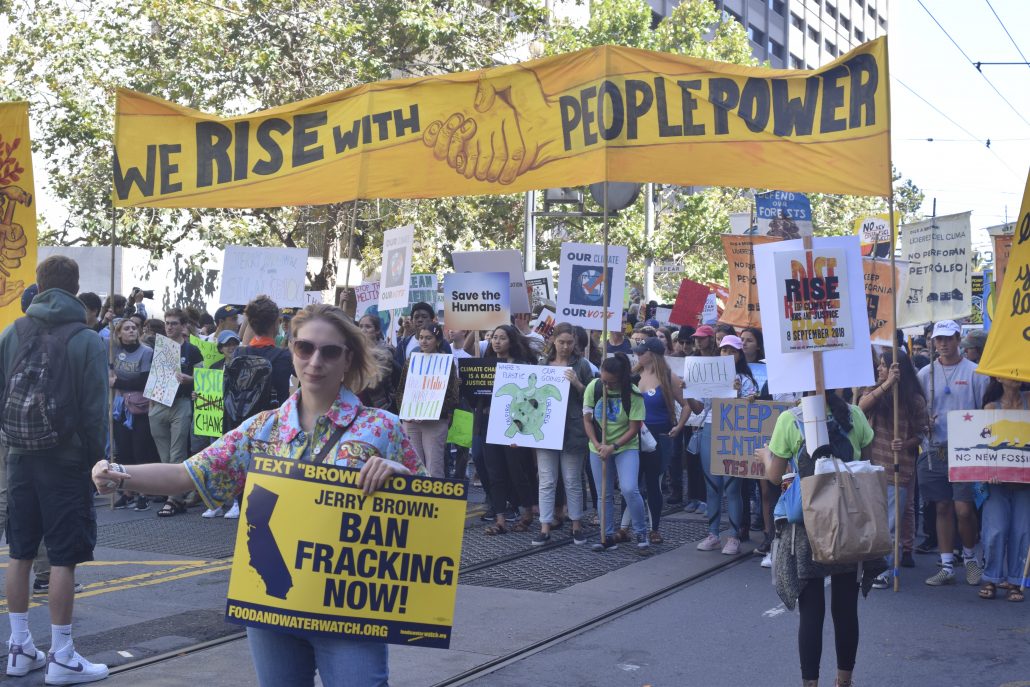
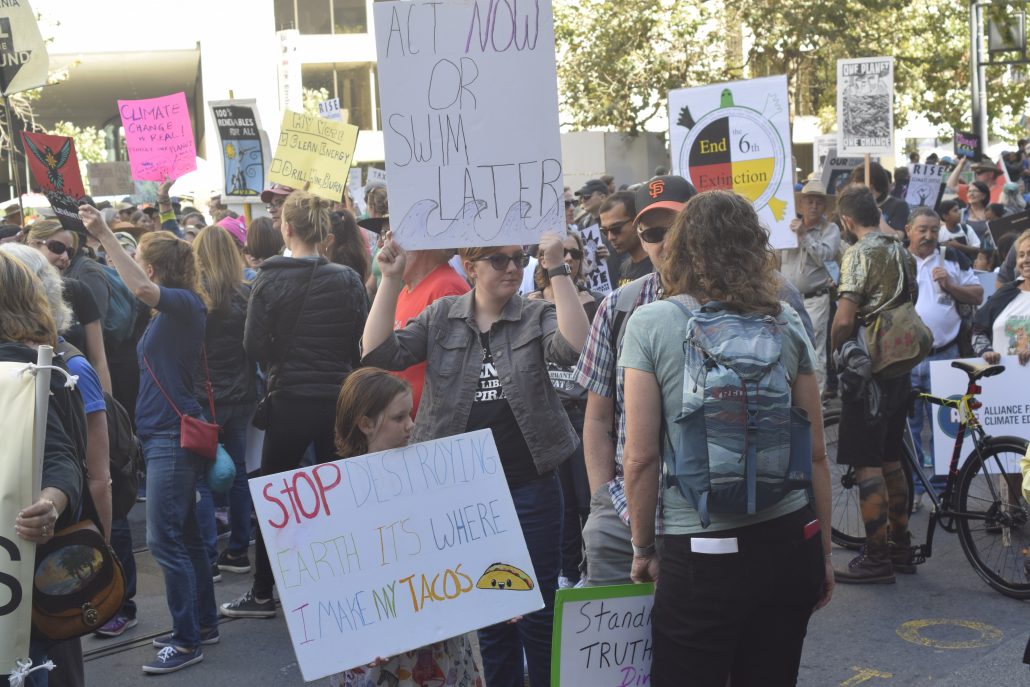
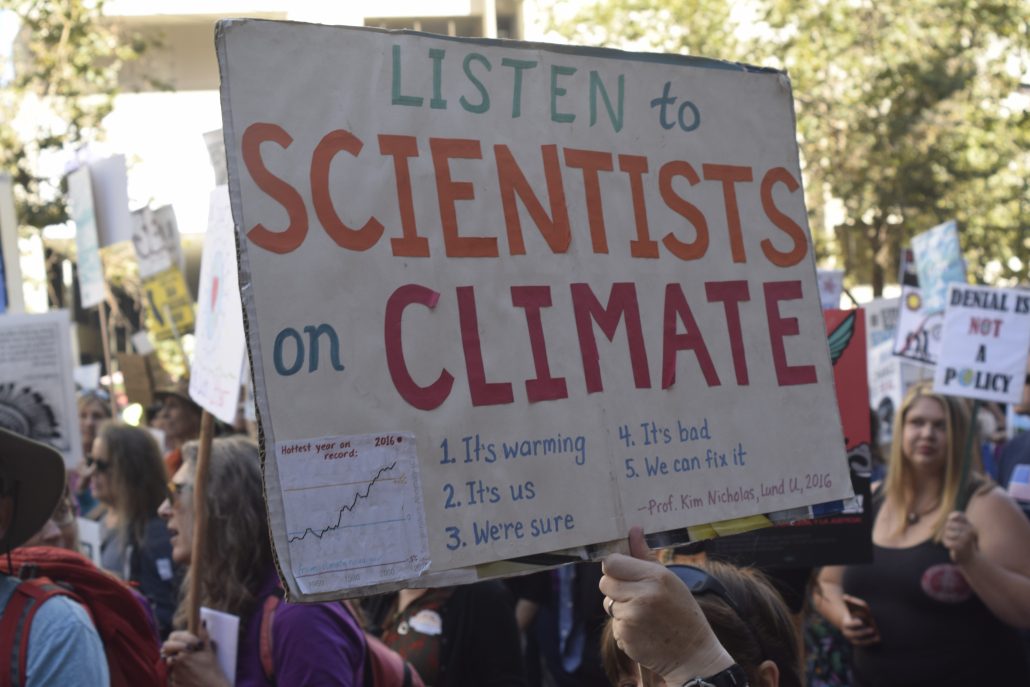
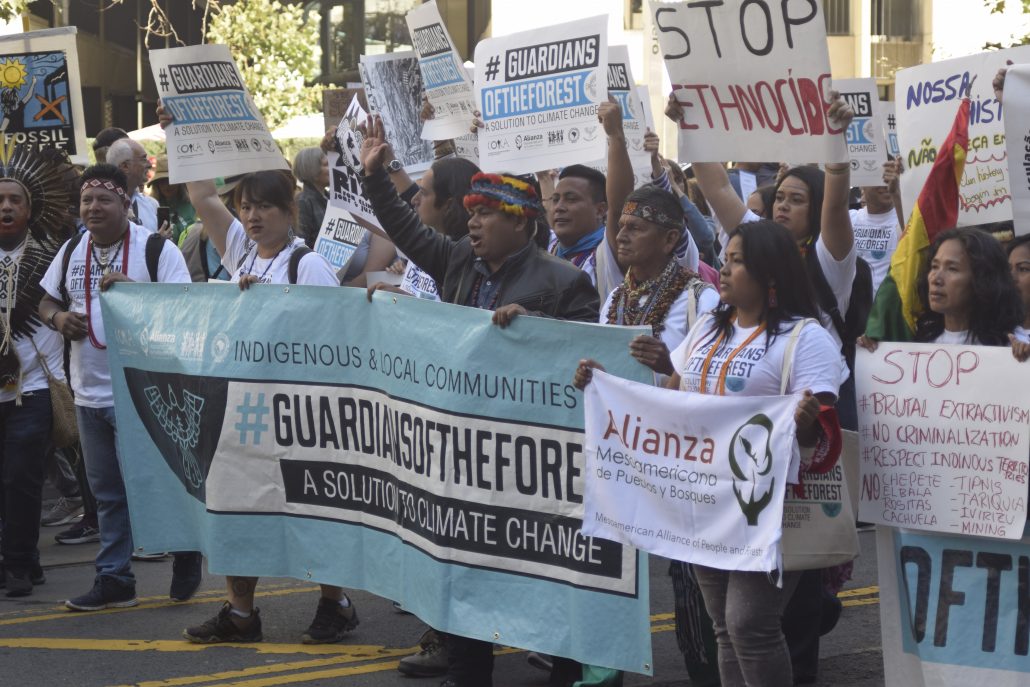
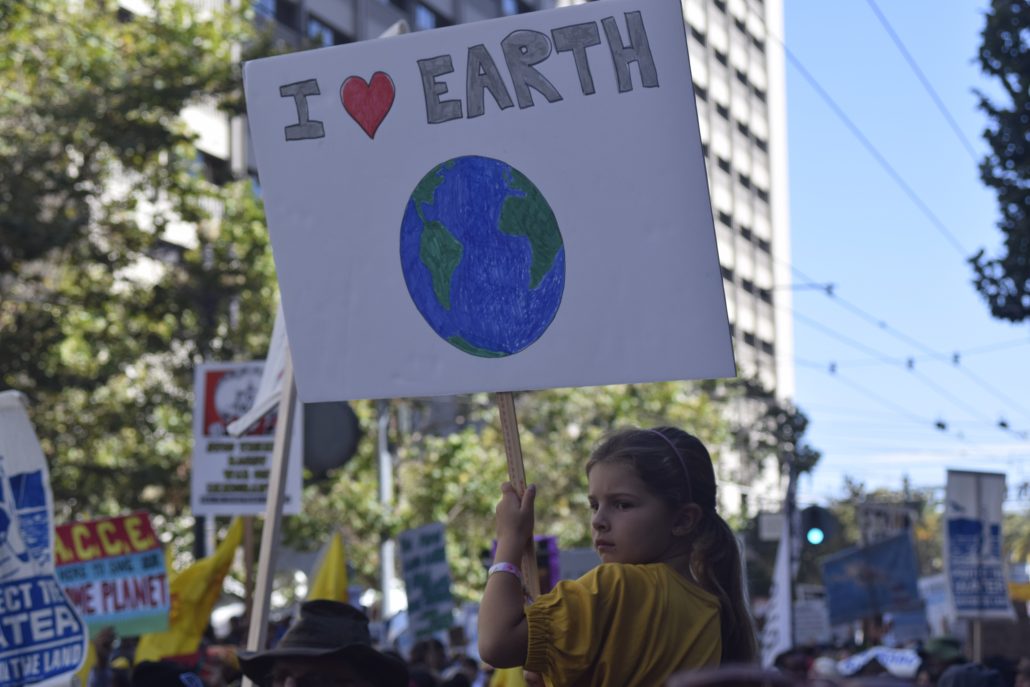
One quarter of a million people worldwide, and well over 30,000 in San Francisco hit the streets during the Rise for Climate last Saturday, September 8th. With over 900 actions taking place simultaneously people worldwide demanded real climate action from their local leaders. FracTracker Alliance staff helped coordinate and participated in events nationwide.
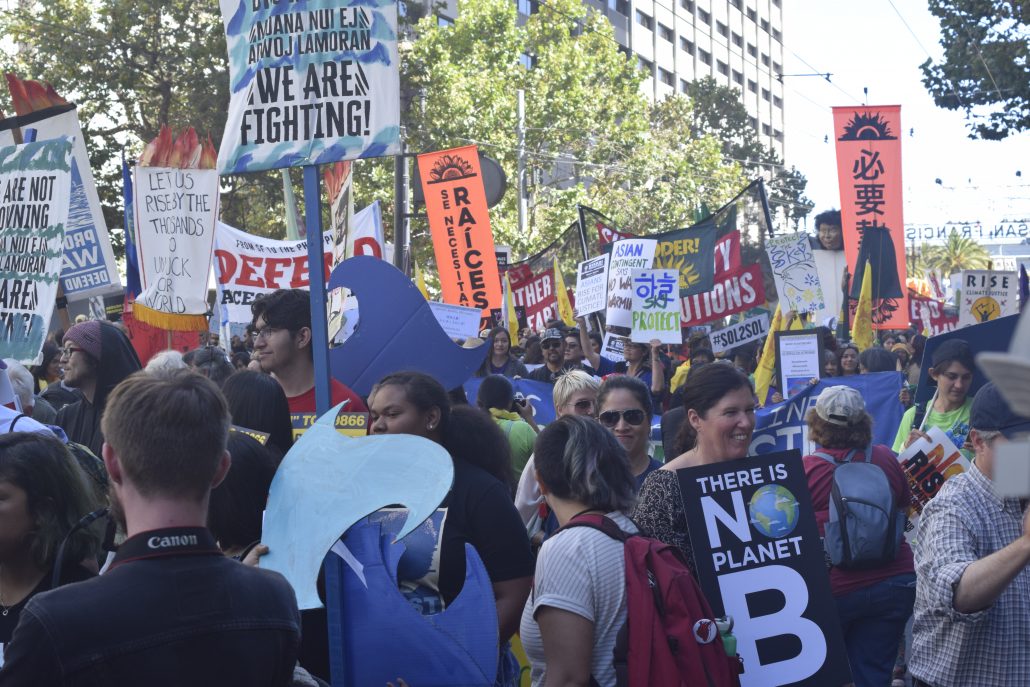
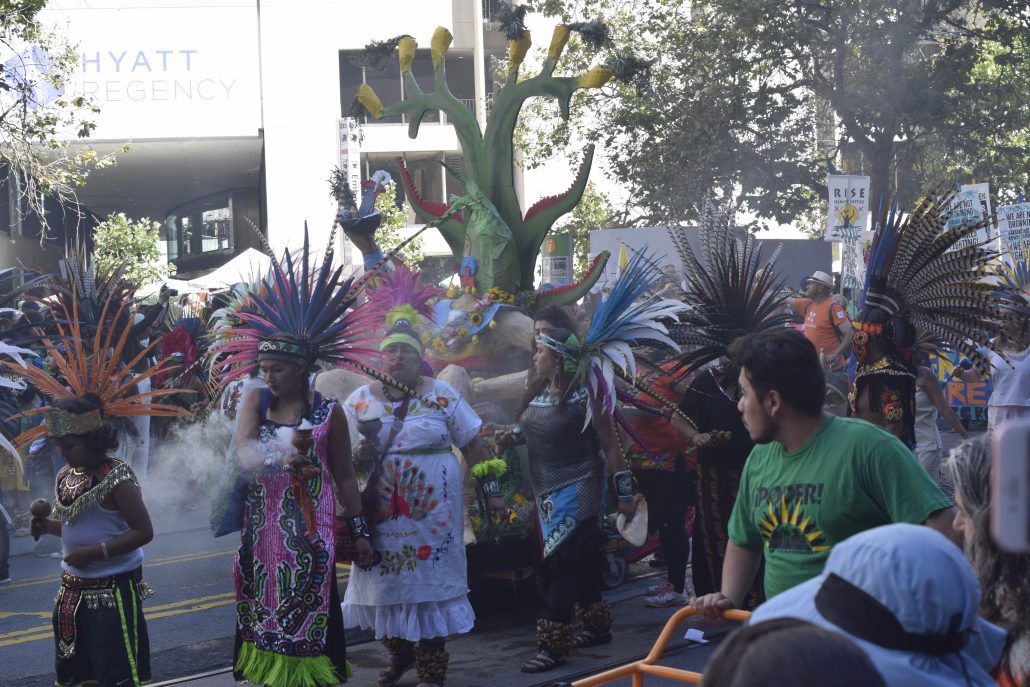
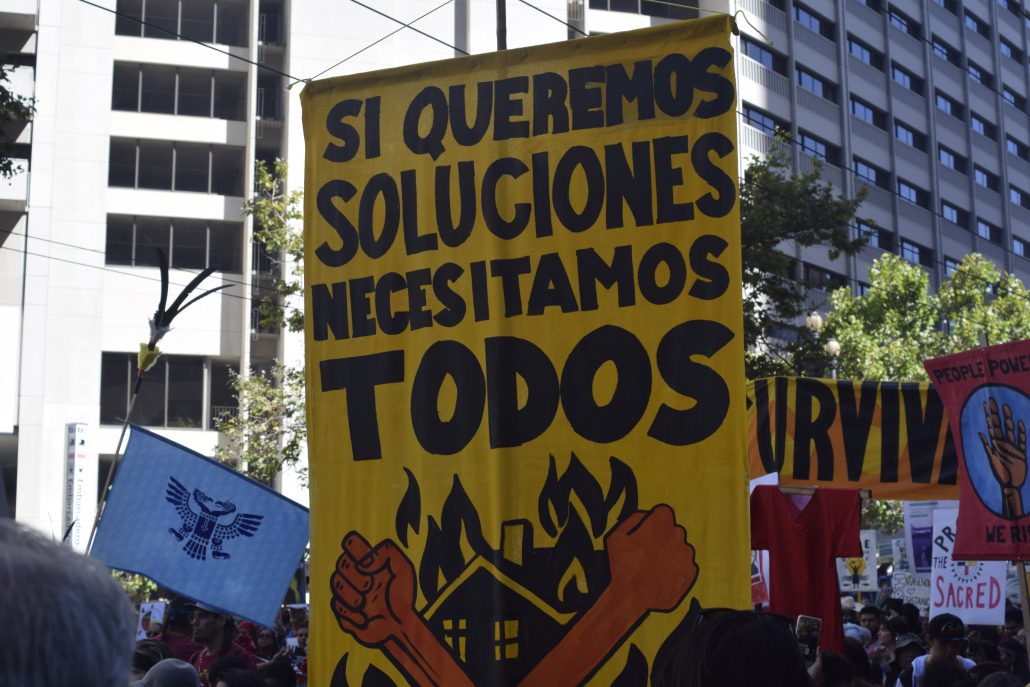
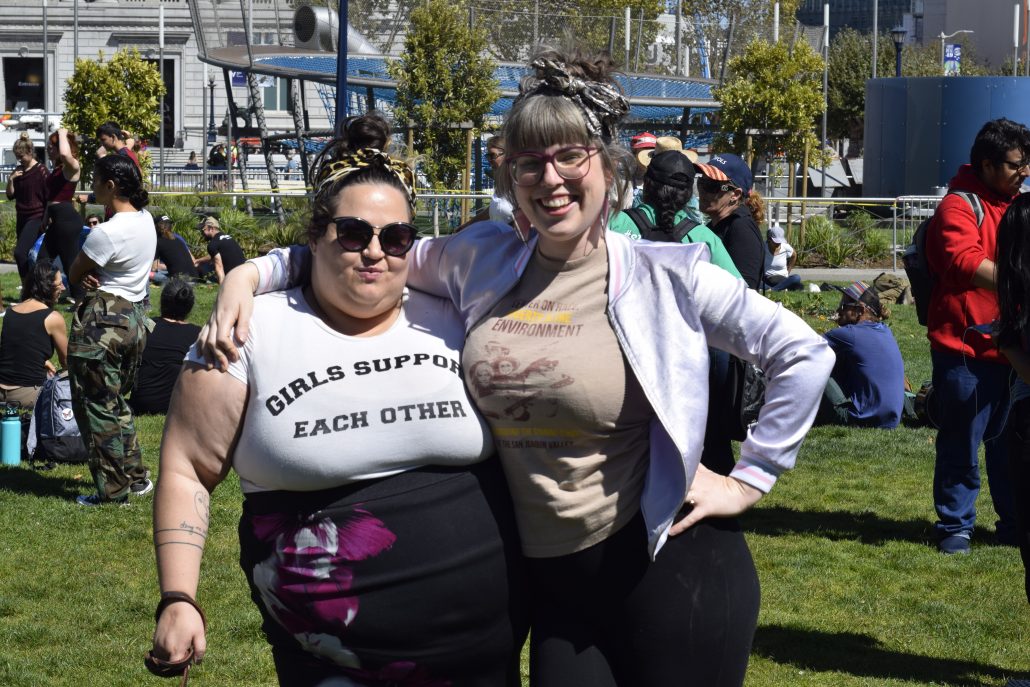
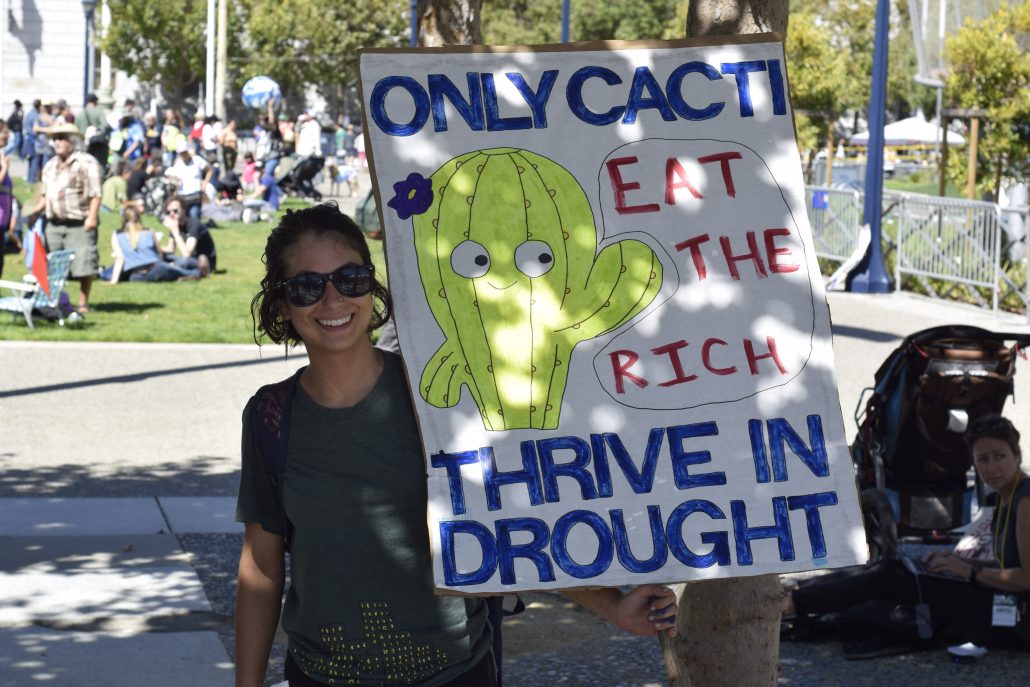
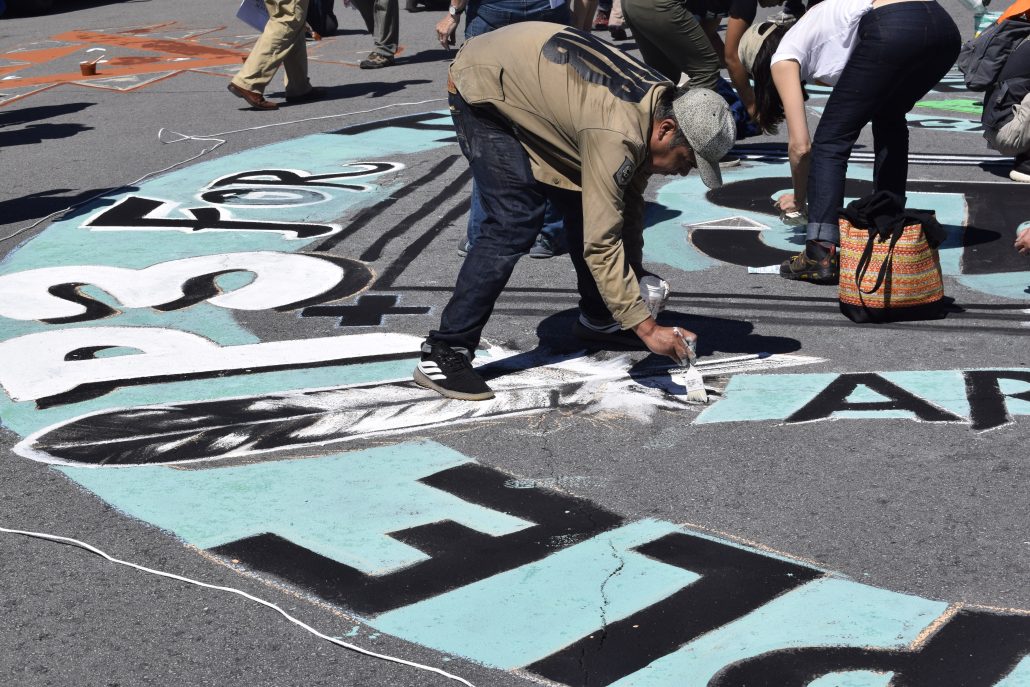
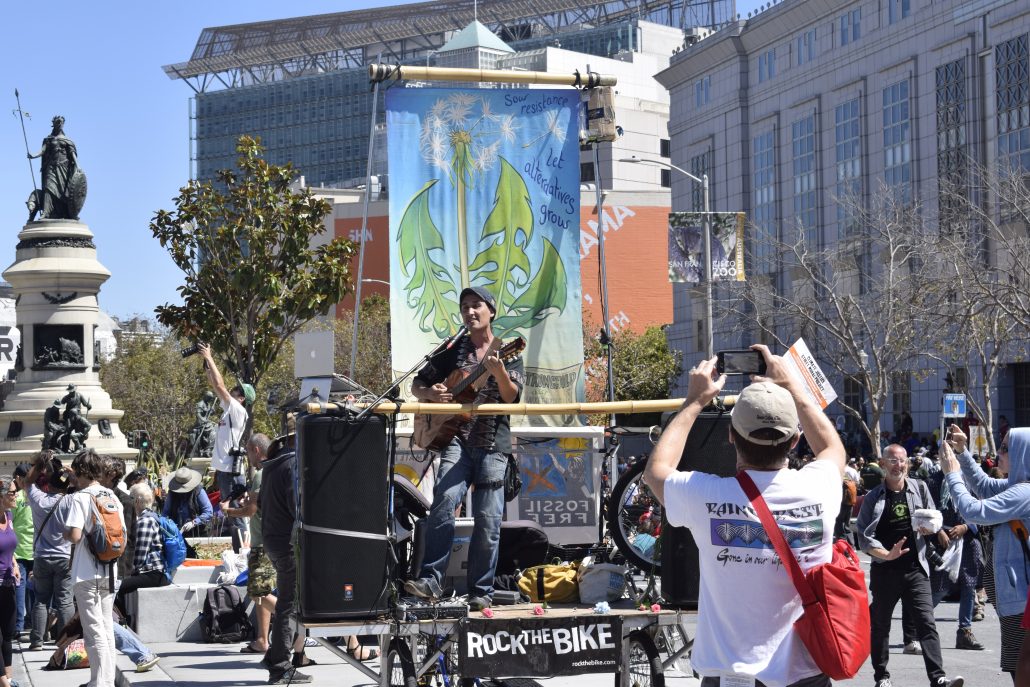
In San Francisco, the march was led by members of the Indigenous community, making up the Indigenous Bloc, on the frontlines of the action. The day officially started with prayers from Indigenous leaders and a moment of silence for Indigenous Peoples that have been most harmed by the effects of climate change. Dozens of various other movements followed the Indigenous Bloc in a parade of support. FracTracker took the opportunity to document this monumental event, and photos from the march are shown below.
March Photos
For California and international “climate leaders” in attendance, Rise kicked off a long week of climate action culminating with the Global Action Climate Summit. The week is full of activities geared towards movement building, including the Solidarity to Solutions Summit (#sol2sol) by It Takes Roots; Women’s Assembly for Climate Justice, hosted by Women’s Earth and Climate Action Network; and mass actions including a march and occupation of the Global Climate Action Summit!
To mark such a momentous movement, the Brown administration signed a new bill into law, SB100. The new law, authored by Kevin De León (D-Los Angeles), pledges that all of California’s electricity will come from clean power sources by 2045. Brown said, “California is committed to doing whatever is necessary to meet the existential threat of climate change.” This is the most ambitious state climate policy in the U.S. The legislation barely passed the state Legislature after nearly two years of debate, with opponents arguing that it would lead to higher electric bills for all Californians.
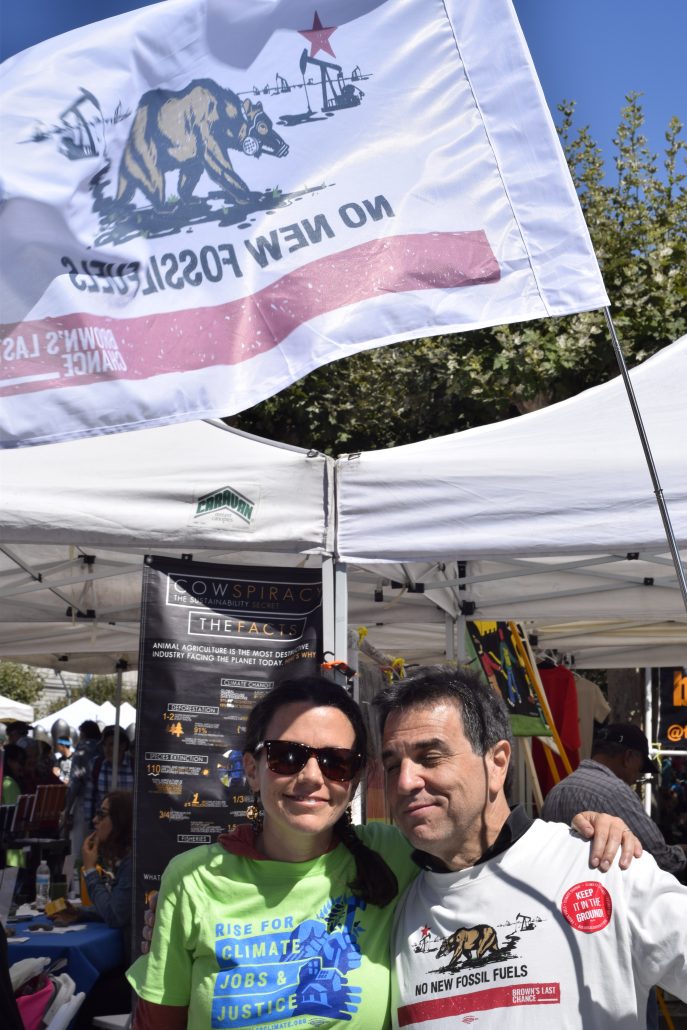
In opposition to the feel-good, pat-yourself-on-the-back feelings from delegates at the summit, frontline communities and activists respond that the SB100 legislation does nothing to stop harms to frontline communities caused by extraction and the supply side of the fossil fuel economy. The Against Climate Capitalism campaign is a coalition of Diablo Rising Tide teamed up with Idle No More SF Bay, the Ruckus Society, It Takes Roots, Indigenous Environmental Network and the Brown’s Last Chance. Members of the coalition have been outspoken proponents organizing in support of real climate leadership. The coalition is pushing for Governor Jerry Brown and the California legislature to end the extraction of new fossil fuels in California. The green groups making up these larger coalition networks encompass a broad range research and advocacy groups, from international groups like Greenpeace to local grassroots movements from Los Angeles and California’s Central Valley. FracTracker Alliance is also a campaign member.
The goal of the campaign is to keep fossil fuels in the ground, and supports a just transition from a fossil fuel economy to clean energy sources. A petition to pressure California Governor Jerry Brown to end fossil fuel extraction can be found on their website. The California legislature and the Brown administration has consistently failed to address the impacts of extraction in its own backyard. While frontline communities are suffering, the Brown administration continues to take the easy way out with future legislation such as SB100, which does nothing to address the environmental justice spector of actual oil drilling and production. In response to SB100, the campaign has issued response:
With these poignant criticisms, it begs the question; how can Governor Jerry Brown continue to ignore the actual cause of climate change? Brown has passed legislation ensuring that everyday Californians will bear the costs for clean energy utilities, but has done nothing to hold accountable the actual culprits responsible for climate change, the oil and gas corporations extracting the 5.7 million barrels of oil per year from California soil.
By Kyle Ferrar, Western Program Coordinator
Cover photo: Brown’s Las Change Billboard. Photo by Liz Hafalia, The Chronicle
For many cities in the Eastern U.S., flash flood warnings and road closings characterized the summer of 2018. Now, hurricane season is upon us.
It’s been the wettest summer to date for Williamsport PA, Luray VA, and Baltimore MD. Several places set records for the wettest “year-through-August,” including Harrisburg PA and Wilmington NC. Washington D.C. and Pittsburgh are just two of many cities to reach their average yearly total rainfall with a third of the year left.
With the record-breaking rains come record-breaking floods, signaling devastation for local officials, residents, and… pipeline operators.
In June, construction on the Mountain Valley Pipeline in Virginia was suspended after heavy rainfall made it difficult for construction crews to control erosion. A landslide caused an explosion on the Leach Xpress Pipeline in West Virginia. The pipeline was built on a steep slope, and the weather made for challenging conditions to remediate the blast.
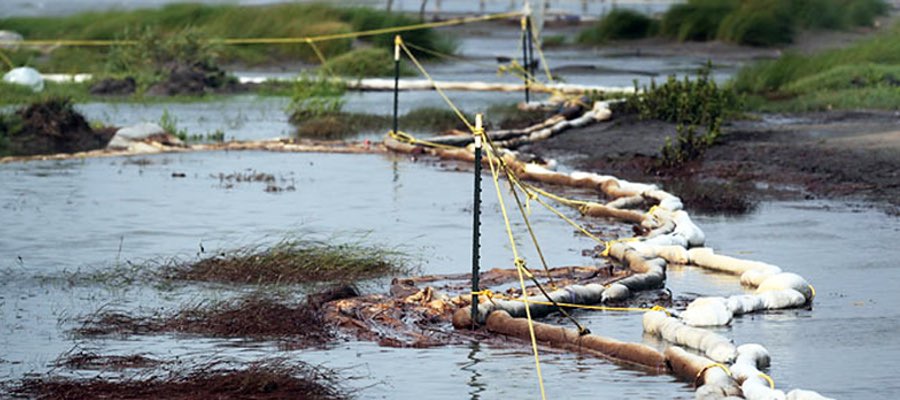
Then came the explosion of the Revolution Pipeline in Beaver County just this week on September 10th. Fire from the blast destroyed a house, a barn, two garages, several vehicles, six high tension electric towers, and shut down a section of a highway. Thankfully, residents were able evacuate their homes in time and no injuries were reported.
While the explosion is still under investigation, the cause of the explosion is believed to be a landslide, which occurred following days of heavy rain.
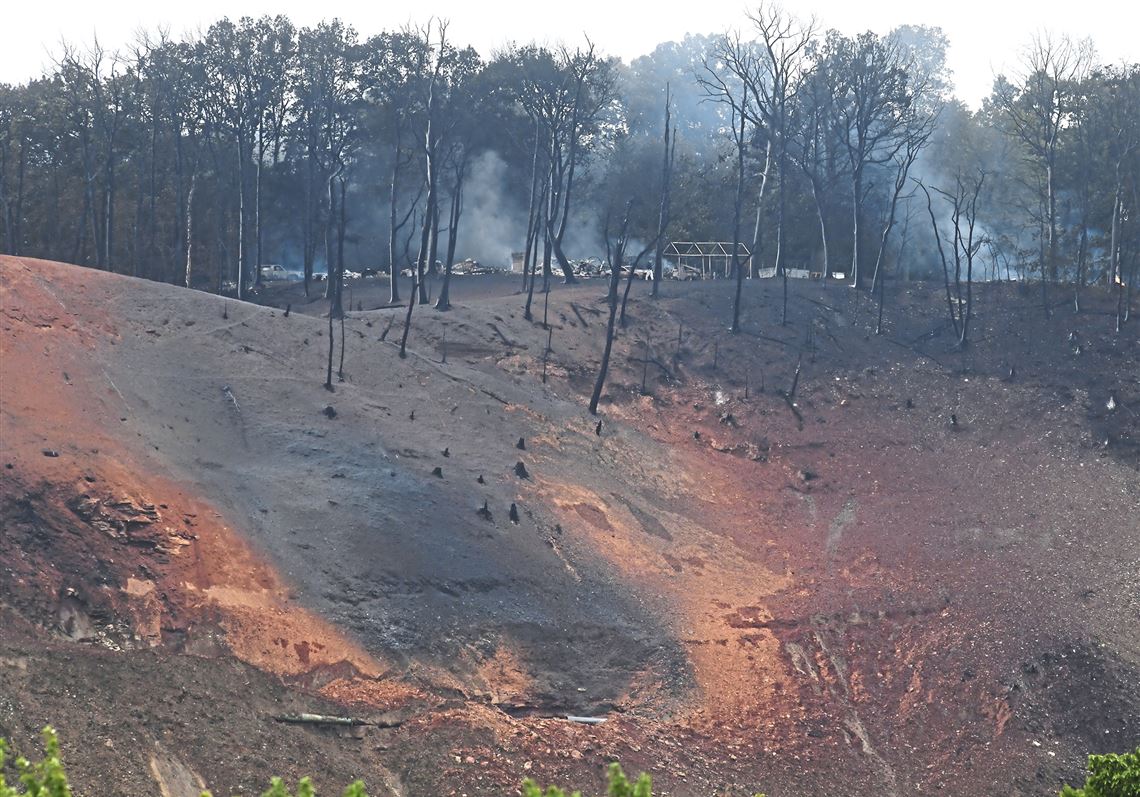
The burnt hillside near the site of the Revolution Pipeline explosion. Photo courtesy of Darrell Sapp, Post Gazette
Heavy rain can cause the ground to shift and swell, triggering devastating landslides, damaging pipelines, and creating leaks. Flooding can also make it difficult for crews to locate sites of leaks and repair pipelines.
Storms cause problems during pipeline construction, as well. Work areas and trenches can alter the flow of floodwaters and spill water onto farmland or backyards. At drilling sites, rain water can carry spills of bentonite, a drilling mud, into waterways.
Still, pipeline operators continue to plan and build along steep slopes, landslide prone areas, and through floodways and waterways. For instance, the route of Shell’s proposed Falcon Pipeline, in Pennsylvania, West Virginia, and Ohio, passes through many areas that are crucial for managing heavy rains.
As highlighted by a recent Environmental Health News piece to which we contributed, Falcon’s route passes through 25 landslide prone areas, a few of which are in residential neighborhoods. In fact, one landslide-prone portion of the pipeline is just 345 feet from a home.
In Beaver County alone, the pipeline route passes through 21,910 square feet of streams, 455,519 square feet of floodway, and 60,398 square feet of wetland:
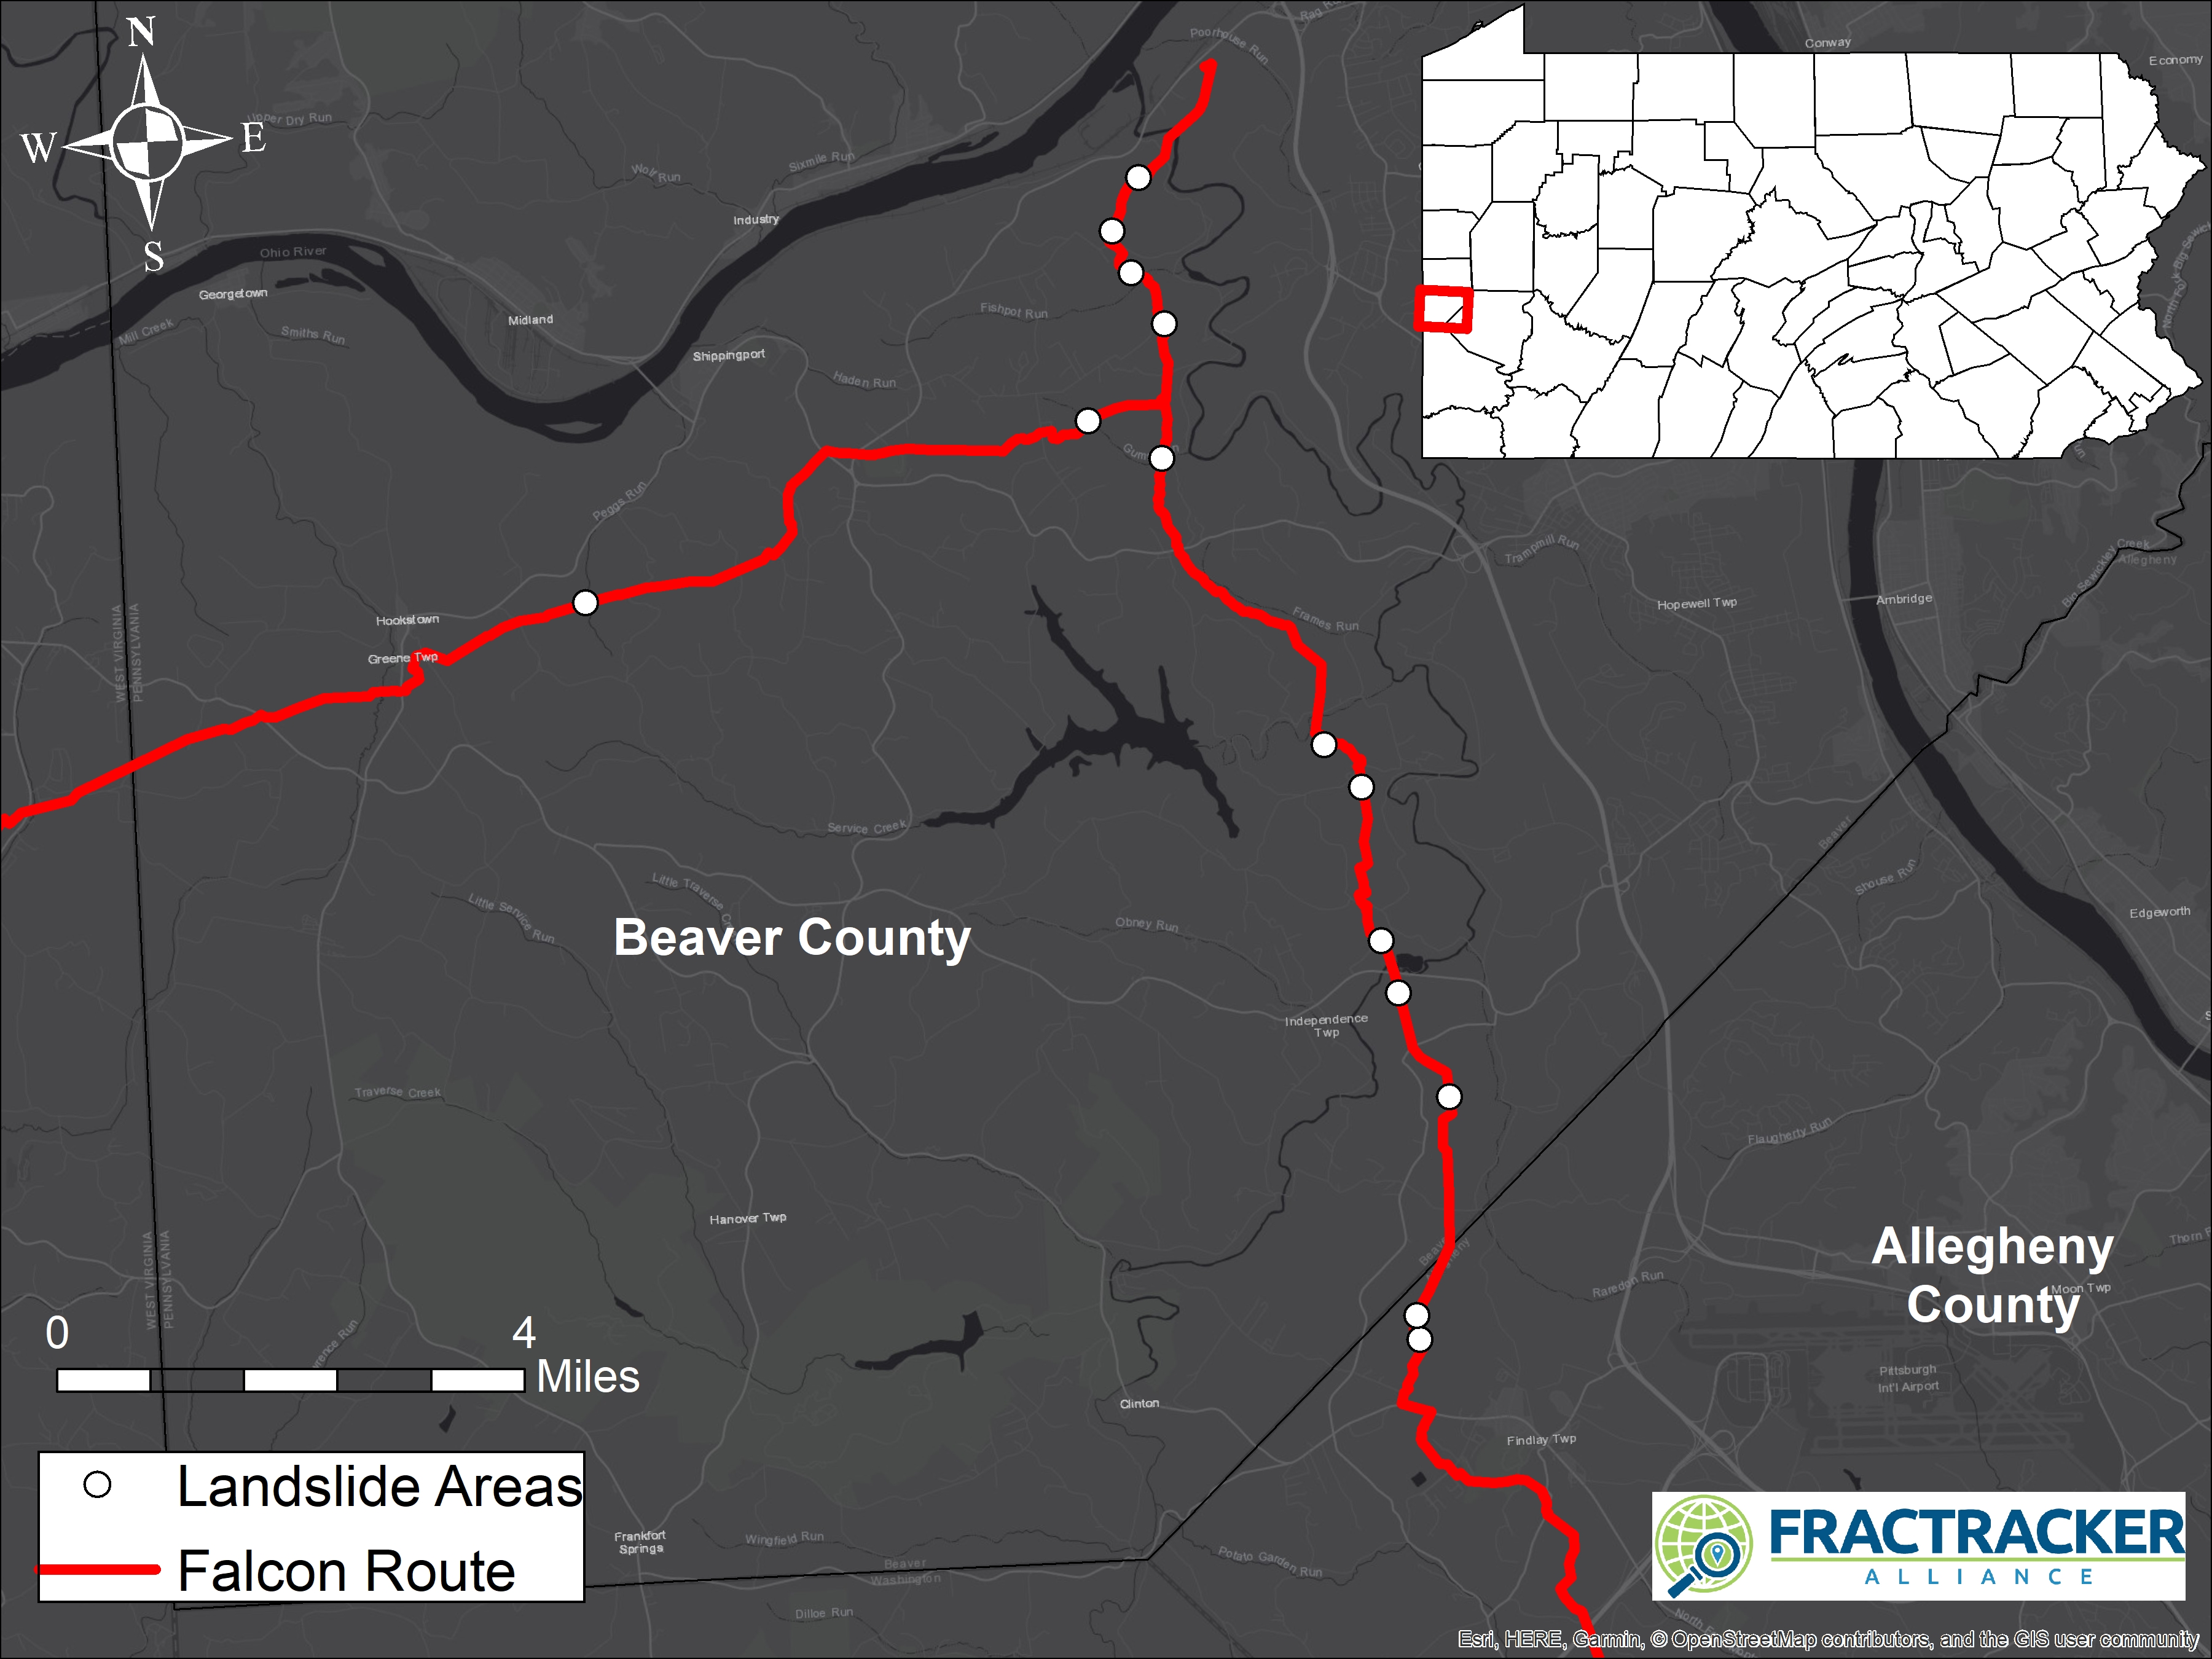
Map of the Falcon Pipeline’s route through Beaver County, with locations Shell has identified as prone to landslides.
What can be done to prevent pipeline leaks, explosions, and spills?
Along the Texas Gulf Coast, robust plans are in the works to protect oil and gas infrastructure. In August of 2017, Hurricane Harvey suspended a large portion of oil and gas operations in Texas. Now, the state has a $12 billion publicly-funded plan to build a barrier along the coast. The 60-mile-long structure would consist of seawalls, earthen barriers, floating gates, and steel levees. It will protect homes and ecosystems, as well as one of the world’s largest sites of petrochemical activity.
In July, the state fast-tracked $3.9 billion for three storm barriers around oil facilities. The industry is also moving inland to the Ohio River Valley, where it intends to build a petrochemical hub away from hurricane risk.
Herein lies the irony of the situation: The oil and gas industry is seeking refuge from the problems it is worsening.
Weather events are intensified by rising ocean and atmospheric temperatures. Scientists have reached a consensus on what’s causing these rises: increasing concentrations of greenhouse gasses (such as carbon dioxide and methane), released by burning fossil fuels. Protecting oil and gas infrastructure will allow the industry to continue polluting, thereby amplifying the problem.
In the short term, I suggest better protection of floodplains and waterways to keep residents and the environment safe. Accounting for frequent, heavy rains will help pipeline operators develop better erosion and sediment control plans. More protections for landslide prone areas near homes could save human and animal lives.
However, continuing to spend time, resources, and money to protect infrastructure from problems that the fossil fuel industry is exacerbating isn’t logical. Renewable energy will slow the effects of climate change that intensify weather events. Resources such as solar and wind also come with significantly less risk of explosion. Let’s be logical, now.
By Erica Jackson, Community Outreach & Communications Specialist
Energy use — whether for heating, cooking, transportation, or manufacturing — is a fact of life for humans on our planet. From the most subsistence-level village life, to the largest metropolises in the world, energy is consumed. But fossil fuels are not a sustainable source of energy. Fossil fuels, by their very nature, are finite in quantity, and increasingly more expensive to extract as the most accessible stores are tapped.
Fossil fuel consumption by-products are driving CO2 and methane to accumulate in the atmosphere, leading towards what most scientists think will be a tipping point to irreversible climate chaos (see image below).
Alternatives to fossil fuels not only exist, but in many cases, are becoming more affordable (see additional information on solar afforability here) than the environmentally-destructive oil, gas, and coal-burning options. Technological advances are changing the way people around the world can live, with cleaner, greener, and more equitable energy sources, as well as more conservation-focused consumption patterns.
Recognizing the benefits to transitioning away from fossil fuels, communities across the US and world-wide, are saying NO to fossil fuel extraction and YES to renewable energy: solar, wind, geothermal, and hydro power, as well as electric vehicles when the electricity that supplies them is renewably generated. Below, and in the following map, we are tracking this movement to a clean energy future.
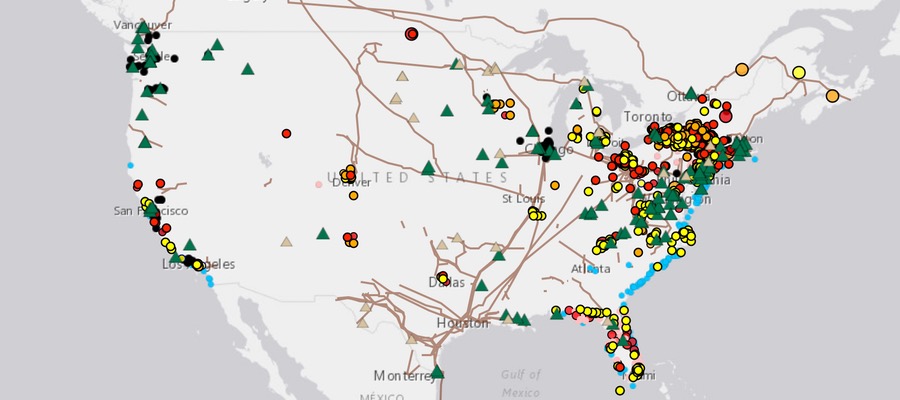
The Resistance – Movements Against Fossil Fuels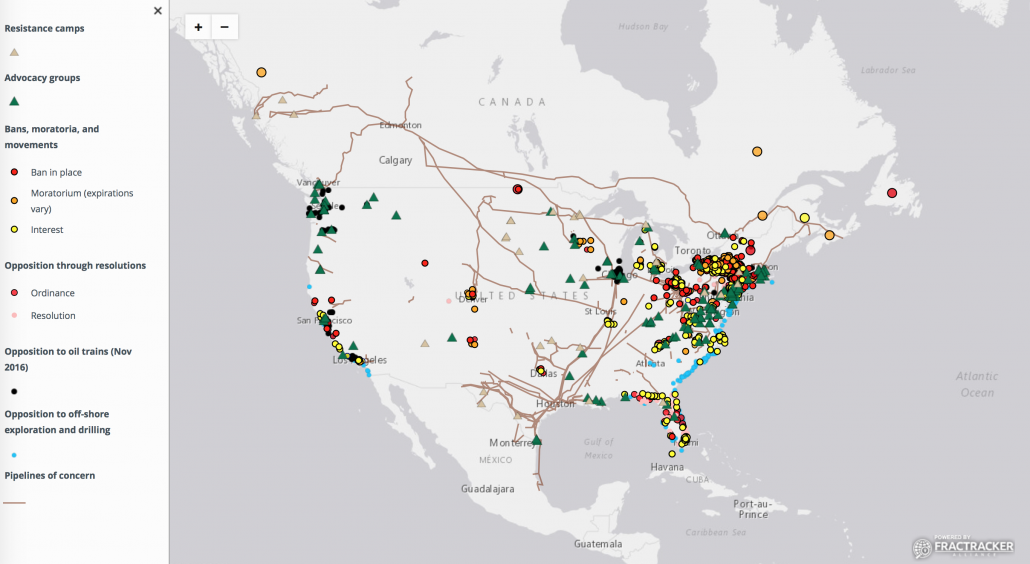 View Live Map | How FracTracker maps work
At least 35 communities in California and Washington State have passed resolutions against off-shore drilling. On the East Coast, from Florida to New York State, 44 municipalities have passed resolutions opposing seismic blasting, a form of exploration for oil and gas that has disastrous impacts on marine life, including threatened and endangered marine mammals. What’s further, 105 communities have come out against a combination of offshore drilling and seismic blasting, and at least 26 have taken a stand against offshore drilling.
In Florida, where several bills that would prohibit fracking statewide have been in play for the past few years, individual municipalities have registered their opposition. 43 have signed resolutions opposing fracking, and 7 communities, including Zephyr Hills, Cape Coral, Bonita Springs, Coconut Creek, Dade City, Estero, and St. Petersburg, have passed full ordinances against fracking within their boundaries. In addition to resolutions against drilling in 25 Florida counties, 13 counties in Florida have passed legislation fully banning fracking. These counties are Alachua, Bay, Brevard, Citrus, Indian River, Madison, Osceola, Pinellas, Seminole, St. Lucie, Volusia, Wakulla, and Walton.
In Connecticut, where the geology is not suitable for oil and gas extraction, communities are still proactively protecting themselves against one byproduct of extreme oil and gas extraction: fracking waste disposal. While historically, there are no known instances of fracking waste being exported to Connecticut for disposal, as of March 2018, 46 municipalities are considering rules to ban future disposal of oil and gas wastes within their boundaries, while another 45 have already outlawed the practice, as of late May 2018.
New York State has had a state-wide ban against high-volume hydraulic fracturing since December of 2014. New York led the way in home-rule backed municipal bans and moratoria (temporary prohibitions). Since 2011, 92 NYS municipalities have instituted bans against fracking, and 96 towns, cities, and village have passed moratoria — most of which have now expired. At least another 88 municipalities have also considered banning the practice, prior to the more comprehensive state-wide ban.
The state of Vermont has also banned fracking, and Maryland has instituted a long-term moratorium. Outside of New York State, another 51 municipalities — from Australia to Italy, and New Jersey to California — have passed local ordinances banning fracking. Five countries — Bulgaria, France, Ireland, Germany, and Scotland — have banned the practice altogether. The countries of Wales, The Netherlands, and Uruguay have active moratoria. Moratoria are also currently in place in Cantabria, Spain; Victoria, Australia; Newfoundland, Canada; Paraná, Brazil; Entre Rios, Argentina; and the Eastern Band of Cherokee Indians, as well as the Turtle Mountain Band of Chippewa Indians.
Coordinated efforts are happening — across state lines, linking urban and rural communities — to fight new fossil fuel infrastructure on local and regional levels. On both sides of the New York / Connecticut border, communities are uniting against the Cricket Valley Energy Center, an 1,100 MW fracked gas-powered plant that opponents say presents environmental and human health risks and diverts NYS’s renewable energy focus back to fossil fuels.
More than 30 communities in Pennsylvania along the route of the proposed PennEast pipeline have passed resolutions opposing that pipeline. Nearly 80 communities in New York and New Jersey have come out against the proposed Pilgrim Pipeline, designed to carry light crude from the Port of Albany to the Atlantic Coast refineries. And a plan by Crestwood/ Stagecoach Energy to store hydrocarbons in abandoned salt caverns along the shores of Seneca Lake in the scenic Finger Lakes Region of central New York met unprecedented sharp opposition. As of early 2018, over 32 towns and counties, and close to 400 local businesses had signed resolutions opposing the gas storage plans. Pressure from business and government interests likely contributed to scaling down of the storage plans from butane, ethane, and natural gas, to only LNG.
A 2013 ban on fracking in Hawai’i was met initially with some puzzlement, since there are no oil and gas deposits within the lava-created rock that makes up the Big Island. However, this ban was not against fracking for gas; rather, it dealt with fracking to harness geothermal energy. The Puna Geothermal Venture Plant, located on Hawaii’s highly geologically active East Rift Zone, was controversial when it was built twenty-five years ago. Now, with lava already on the property and poised to potentially inundate the facility, opponents are pushing for its complete closure — if the plant survives the massive flow from Kilauea, now devastating Lower Puna, that started in early May 2018.
Fossil fuels are transported through a variety of mechanisms. Pipelines are the most common means of conveyance; the US Energy Information Administration (EIA) estimates that 3 million miles of oil and gas transmission and delivery pipelines crisscross the US. The Bureau of Transportation Statistics estimated in 2014 that there were nearly 1.6 million miles of gas transmission pipelines in the US, and another 160,521 miles of oil pipelines. Pipeline safety has been a concern for years, and as pipeline build-out continues, so does the litany of accidents due to failures.
A widely used alternative to moving light crude via pipelines is to transport it by rail, from oil fields in Canada and the Dakotas to coastal refineries. In 2014, crude oil production from North Dakota was nearly 1 million barrels per day. The same year, Texas was producing 2.9 million barrels per day. Statistics from the Association of American Railroads (NY Times, 4/12/2014) indicate that in 2013, 407,642 carloads (700 barrels = 1 carload) of crude oil were shipped across the US. That’s more than 285 million barrels, or about 80% of the crude oil shipped to port, that were transported via rail.
Accidents resulting from the derailment of freight cars carrying crude oil can be disastrous to both human communities, and to the environment. The Lac-Mégantic derailment in July, 2013 resulted in a death toll of 47, and the near complete devastation of the downtown of this small Quebec town. Benzene contamination at the site was heavy, and the Chaudière River was contaminated with 26,000 gallons of the light crude, which impacted towns 50 miles downstream.
The disaster at Lac-Mégantic led to a rallying cry among policy-makers, regulators, and environmentalists, who continued to raise awareness of the risks of “crude by rail”, or, as the freight cars are often known, “bomb trains”. Within 2 years after the disaster, over 180 communities from Washington State, to California, to New York, and New Jersey, passed local resolutions demanding better safety regulations, and exhorting officials to stop shipping crude through their communities.
Earlier research by FracTracker Alliance on “bomb train” routes through major New York urban centers like Buffalo and Rochester showed dozens of K-12 public and private schools are within the ½-mile blast zones. Without adequate evacuation plans, the injury or loss of life — were a derailment to happen within the cities — could be extensive. The importance of public critique about the transportation of light crude by rail cannot be overstated.
communities making it happen
The answer to a clean and renewable energy future, while rooted in the resistance to fossil fuel build out, consists of much more than protesting, and saying “NO”. A clean energy future requires goal-setting, and a vision to commit to change. It takes communities investing in a healthy future for all community members—today, tomorrow, and into the next century.
Clean, Renewable Energy Movements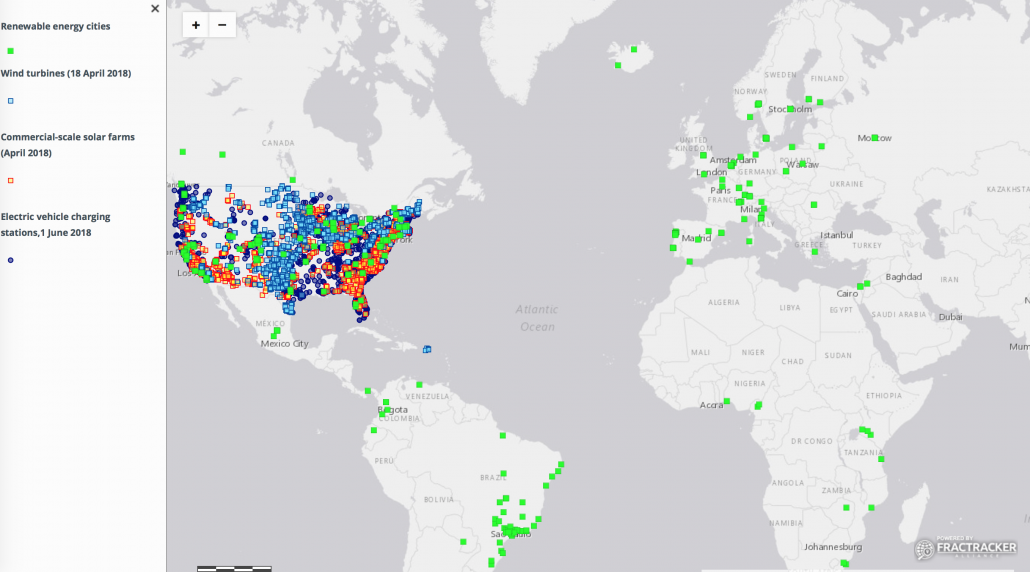 View Live Map | How FracTracker maps work
To that end, nearly 350 communities worldwide (so far) have set tangible goals to transition off fossil fuels – see map above. These communities are our beacons for a sustainable planet. They take seriously the dangerous ecological cascades posed by climate change and have made creative and conscious commitments to future generations of Earth’s biota.
As of early 2018, at least 62 cities in the US have set goals for being powered by renewable energy before the middle of the 21st century according to Sierra Club’s tally of municipalities striving for clean energy power. Five of these communities — Kodiak Island, AK; Rock Port, MO; Greensburg, KS, Burlington, VT; and Aspen, CO, have already met their goals. EcoWatch collected information on over 100 cities around the world that are now powered by at least 70% renewables, and the organization CDP noted close to 200 cities and towns with ambitious targets for renewable power within the next two decades.
Across the US, over 27,300 MW of commercial solar has been installed as of April, 2018. And currently, wind turbines provide close to 59,000 MW of clean energy, nationwide. As of June, 2018, there were more than 18,000 electric vehicle charging stations across the country. While many municipalities are committed to replacing fossil fuels with renewable energy sources, we have a long way to go. Change must happen exponentially in order to meet ambitious goals of even 50% renewable energy in the next decade. For example, in 2011, New York State was meeting approximately 19% of its energy needs from renewable energy—largely from hydropower. Governor Cuomo’s “50 by 30” plan—mandating a clean energy standard of 50% renewables by 2030—sets forth goals that will require aggressive advocacy, the will of decision-makers, economic funding and incentives, education, and the steadfast insistence of the citizenry if we are to have a chance at slowing climate change and curbing greenhouse gas emissions.
On every continent of the planet, there are citizen-based movements to address the impacts of coal on the environment. CoalSwarm has compiled a dynamic listing on a country-by-country basis. Similarly, a sister project, FrackSwarm, is a clearinghouse for citizen’s movements around the world that are addressing the impacts of fracking. Both CoalSwarm and FrackSwarm advocate strongly for a movement to clean energy everywhere. Both sites feature detailed background information on movements around the world and are partner projects to SourceWatch and the Center for Media and Democracy.
Halt the Harm Network, another organization closely allied with FracTracker Alliance, has developed a robust network of groups leading the fights against the oil and gas industry. Their database is searchable by skills, geography, and interests. Many of the organizations included in their database are also included in this map of resistance advocacy and activism groups fighting for a clean energy future.
Last, but not least, in 2017, FracTracker Alliance partnered with E2 to create a resource called “Mapping Clean Energy: New York”. You can view the maps that show clean energy jobs, solar, wind, and electric vehicle resources here. FracTracker also developed clean energy interactive maps for Pennsylvania, Ohio, Illinois, Michigan, and Missouri.
FracTracker will continue to update our Clean Energy Action Maps project, and actively solicit input and feedback from the public. If your advocacy group is not listed on our maps above, please complete the form at the bottom of the project page. We’ll compile public input, and regularly add new organizations to this resource.
Of note: We will soon be retiring our Alliance Map in favor of these maps, as we believe it is extremely important to capture the depth and breadth of the movements against fossil fuels and in support of renewables. This project is our effort to make connections across the globe, whether or not we are in direct communication with the groups on the maps.
If you have any questions about this work, please email: info@fractracker.org.
By Guest Author: Austin Sachs, Director and founder of Protect and Divest
In most major social movements where there is an imbalance power, divestment has been a necessary part for progress, whether in South Africa or now in the environmental movement against fossil fuels. Yet, too often in the environmental movement, divestment is only pursued when all other options have run their course and failed. If we want a climate neutral society for generations to come, we must pursue divestment alongside all other actions – and alongside this divestment, a reinvestment into a society we want to see.
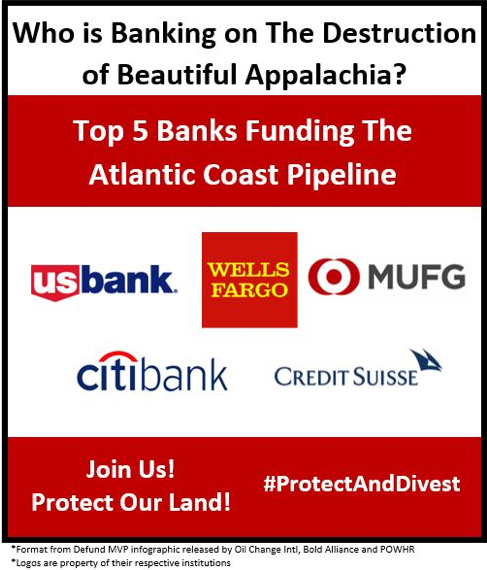
So where does this all start? Divestment begins with each of us looking into our financial accounts and seeing who we are funding with them. And that is exactly what Protect and Divest did last year. We researched the funding of the Atlantic Coast, Mountain Valley, Sabal Trail and Atlantic Sunrise pipelines to know where our money was going.
Along the entire East Coast, the TransCo Pipeline connects all these pipelines, but this infrastructure is also all connected by the same banks who are funding each and every single pipeline project. These banks range from the US banks of Wells Fargo, JP Morgan Chase, US Bank, CitiBank, and Bank of America to the International banks of the Royal Bank of Canada (RBC), Scotiabank and the Bank of Tokyo Mitsubishi UFJ. What we truly found is that no one bank is guilty alone – The entire financial industry is banking on the destruction of our beautiful home!
So where do we go if the banking industry is against a sustainable future? Well, luckily the entire industry is not against sustainability, and some heavily promote it. One of these options is Amalgamated Bank, who has promised to never invest depositor’s money into fossil fuels. Across this nation are countless credit unions doing the same for their members, who see money as a necessary tool of sustainability.
Protect and Divest has now launched our Divest the Commonwealth campaign to take our pledge one step further and move Virginia’s government funds out of fossil fuels, as well. Over $330 million dollars of the Virginia Retirement System is invested in fossil fuels. And of the stock of Duke Energy, one of the main builders of the Atlantic Coast Pipeline, 10 state pensions plans hold over $785 million in it. If the banks are guilty, so are our government pensions and funds. And it’s not like there are no sustainable options. Blackrock, the FTSE Group, and the National Resources Defense Council (NRDC) have come together to develop the FTSE ex-Fossil Fuels Index Series, a fossil fuel free index fund.
Divest the Commonwealth is working to build grassroots effort to move this money. We have started and are supporting city council resolutions from Harrisonburg, VA to Arlington, VA to Richmond, VA and are adding more weekly. Together, the cities and counties of Virginia will begin to bring about the future we want to see. Together, we will create a future we can be proud of.
Join us today and divest today! Every dollar, signature, and voice counts in making sure our money is where our mouth is. This is the way we create a world we want to live and one that we can tell our children about!
For more information visit: protectanddivest.weebly.com, or visit their Facebook page at: facebook.com/protectandivest.
Austin Sachs is the director and founder of Protect and Divest, created to build a market solution to climate change. Brought to the environmental movement by the Standing Rock crisis, Austin has worked endlessly to create a world we can all be proud within the economic and political models existing today!
![]()
216 Franklin St, Suite 400, Johnstown, PA 15901
Phone: +1 (717) 303-0403 | info@fractracker.org
FracTracker Alliance is a 501(c)3 non-profit: Tax identification number: 80-0844297
