Fossil Fuel Subsidies: The $760 Billion Lie About ‘Free Market’ Energy
Fossil fuels dominate the U.S. energy market, but not because of free competition. With $760 billion in annual subsidies, oil and gas companies are propped up by taxpayer dollars.


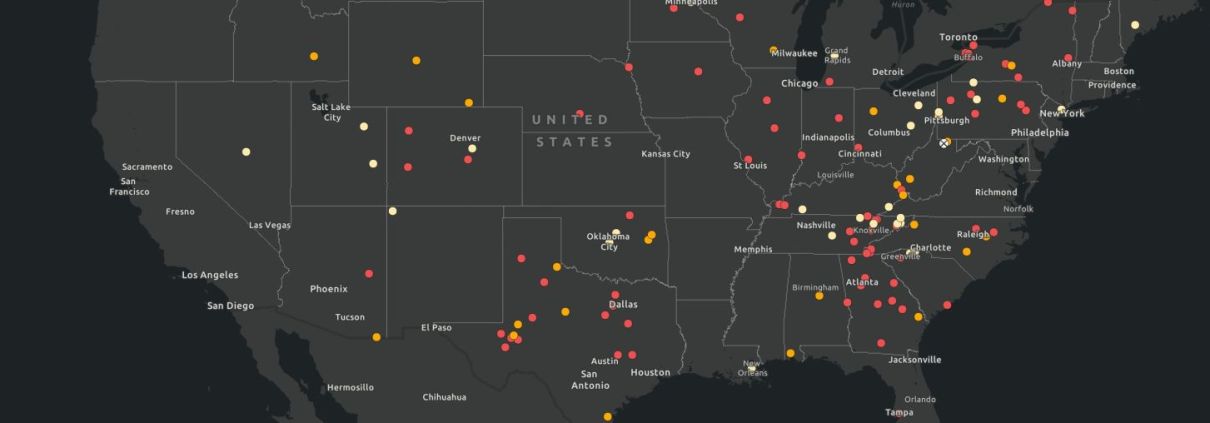
 FracTracker Alliance, 2024
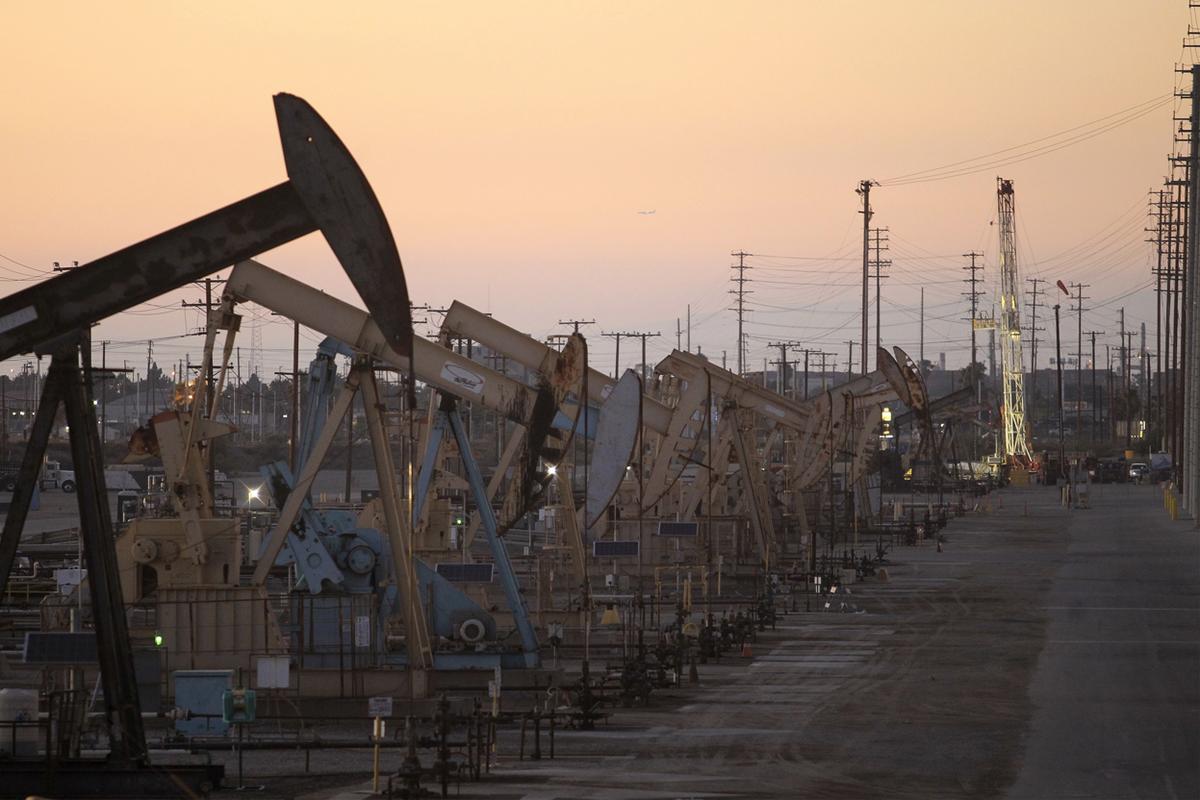