
The world is watching as bitcoin battle brews in the US
If Gov. Cuomo wants to lead the nation on climate, he has to address the impacts of proof of work cryptocurrency mining industry in New York.
If Gov. Cuomo wants to lead the nation on climate, he has to address the impacts of proof of work cryptocurrency mining industry in New York.

Kyle Ferrar, Western Program Coordinator for FracTracker Alliance, contributed to the December 2020 memo, “Recommendations to CalGEM for Assessing the Economic Value of Social Benefits from a 2,500’ Buffer Zone Between Oil & Gas Extraction Activities and Nearby Communities.”
Below is the introduction, and you can find the full memo here.
The purpose of this memo is to recommend guidelines to CalGEM for evaluating the economic value of the social benefits and costs to people and the environment in requiring a 2,500 foot setback for oil and gas drilling (OGD) activities. The 2,500’ setback distance should be considered a minimum required setback. The extensive technical literature, which we reference below, analyzes health benefits to populations when they live much farther away than 2,500’, such as 1km to 5km, but 2,500’ is a minimal setback in much of the literature. Economic analyses of the benefits and costs of setbacks should follow the technical literature and consider setbacks beyond 2,500’ also.
The social benefits and costs derive primarily from reducing the negative impacts of OGD pollution of soil, water, and air on the well-being of nearby communities. The impacts include a long list of health conditions that are known to result from hazardous exposures in the vulnerable populations living nearby. The benefits and costs to the OGD industry of implementing a setback are more limited under the assumption that the proposed setback will not impact total production of oil and gas.
The comment letter submitted by Voices in Solidarity against Oil in Neighborhoods (VISIÓN) on November 30, 2020 lays out an inclusive approach to assessing the health and safety consequences to the communities living near oil and gas extraction activities. This memo addresses how CalGEM might analyze the economic value of the net social benefits from reducing the pollution suffered by nearby communities. In doing so, this memo provides detailed recommendations on one part of the broader holistic evaluation that CalGEM must use in deciding the setback rule.
This memo consists of two parts. The first part documents factors that CalGEM should take into account when evaluating the economic benefits and costs of the forthcoming proposed rule. These include factors like the adverse health impacts of pollution from OGD, the hazards causing them and their sources, and the way they manifest into social and economic costs. It also describes populations that are particularly vulnerable to pollution and its effects as well as geographic factors that impact outcomes.
The second part of this memo documents the direct and indirect economic benefits of the proposed rule. Here, the memo discusses the methods and data that should be leveraged to analyze economic benefits of reducing exposure to OGD pollution through setbacks. This includes the health benefits, impacts on worker productivity, opportunity costs of OGD activity within the proposed setback, and the fact that impacted communities are paying the external costs of OGD.
Please find the full memo here.
Fracking has been raised as an issue that could determine the outcome of the 2020 US presidential election. Republican candidates have cited erroneous figures of how many fracking jobs exist in Pennsylvania, and have falsely claimed that Democratic presidential candidate Joe Biden and running mate Kamala Harris seek to ban fracking. And while the Democratic candidates have made suggestive comments in the past, they have made their position clear. As Senator Harris stated in the vice presidential debate: “I will repeat, and the American people know, that Joe Biden will not ban fracking. That is a fact.”
The debate around this issue is not on whether or not fracking should be banned– something neither party advocates– but rather around the facts. Republican candidates have inflated the extent of fracking jobs by up to 3500 percent. But the natural gas industry and the fracking boom have failed to deliver the job growth and prosperity that was predicted by proponents a decade ago. In reality, the total number of jobs in the natural gas industry in Pennsylvania never reached more than 30,000 over the last five years and is now less with the industry’s economic decline.
The total number of jobs in the natural gas industry in Pennsylvania never reached more than 30,000 over the last five years and is now less with the industry’s economic decline.
The debate should not be around the facts- those are already firmly established. The debate should be around how to best support fossil fuel workers in the inevitable transition to cleaner energy. What does a just transition that supports workers and the climate look like?
FracTracker Alliance and The Breathe Project have compiled a fact sheet to help us answer this question based on where Pennsylvania currently stands.
![]()
![]()
Breathe Project
Energy Innovation Center – Suite 140
1435 Bedford Avenue
Pittsburgh, PA 15219
The Breathe Project and FracTracker Alliance have crafted the following messaging for refuting the conflated job numbers being touted by pro-fossil fuel organizations and political candidates regarding fracking and jobs in Pennsylvania that, in some cases, has inflated natural gas jobs in the state by 3500 percent.
The natural gas industry and the fracking boom have failed to deliver the job growth and prosperity that was predicted by proponents a decade ago. The total number of jobs in the natural gas industry in Pennsylvania never reached more than 30,000 over the last five years and is now less with the industry’s economic decline.
FACT: The Pa. Dept. of Labor and Industry (DLI) reported that direct employment in natural gas development totaled 19,623 in 2016. This was down from 28,926 total natural gas development jobs in 2015. This includes jobs in drilling, extraction, support operations and pipeline construction and transportation. (StateImpact, 2016)
Pa. DLI calculated the employment figures using data from six data classifications at the U.S. Bureau of Labor Statistics — specifically, the North American Industry Classification System (NAICS) codes for cured petroleum and natural gas extraction, natural gas liquid extraction, drilling oil and gas wells, support activities for oil and gas operations, oil and gas pipeline and related structures and pipeline transportation of natural gas. (Natural Gas Intel, 2016)
Inflated estimates of fracking-related jobs in Pennsylvania under previous Gov. Tom Corbett included regulators overseeing the industry as gas jobs, truck drivers, and those working in highway construction, steel mills, coal-fired power plants, sewage treatment plants, and others. Pa. Gov. Tom Wolf’s administration revised the way gas industry jobs were calculated to reflect a more accurate depiction of jobs in the sector.
FACT: Food & Water Watch calculated that there were 7,633 jobs pre-boom (2001 – 2006), which rose to 25,960 oil and gas industry jobs post-boom (2016 – 2018). (FWW, March 2020)
Food & Water Watch created a more accurate model using a definition that encompasses only jobs directly involved with domestic oil and gas production, specifically: oil and gas extraction; support activities for oil and gas operations; drilling oil and gas wells; oil and gas pipeline construction; and pipeline transportation.
FACT: The Food & Water Watch analysis also reports that misleadingly broad definitions in industry-supported job reports overstated the industries’ scope. The industry analysis included broad swaths of manufacturing industries including “fertilizer manufacturing,” convenience store workers, and gas station workers, which accounted for nearly 35 percent of all oil and gas jobs in their analysis. (FWW, PwC at 5 and Table 4 at 9, 2019)
FACT: As a point of comparison, in 2019, close to 1 million state residents were working in healthcare, 222,600 in education, and over 590,000 in local and state government. (Pennsylvania Bureau of Labor Statistics, July, 2020)
FACT: To forecast fracking-related job growth, the American Petroleum Institute used a model with exaggerated multipliers and faulty assumptions, such as the amount of purchases made from in-state suppliers, and it double counted jobs, leading to wildly optimistic estimates. (Ohio River Valley Institute, August 2020)
FACT: In addition, many of the jobs claimed in a 2017 American Chemistry Council Appalachian petrochemical economic impact study would arise in plastics manufacturing, which raises two concerns. First, both the ACC study and subsequent reports by the U.S. Department of Energy assume that 90% of the ethylene and polyethylene produced by imagined Appalachian cracker plants would be shipped out of the region to be used in manufacturing elsewhere in the country and the world. Of the 10% that would presumably stay in the region, much or most of it would serve to replace supplies that the region’s plastics manufacturers currently source from the Gulf Coast. (Ohio River Valley Institute, August 2020)
The fracking and petrochemical industries create unsustainable boom and bust cycles that do not holistically improve local economies.
FACT: Economic analyses show that the oil and gas industry is a risky economic proposition due to the current global oversupply of plastics, unpredictable costs to the industry, a lower demand for plastics, and increased competition. The analyses call into question industry’s plans to expand fracking and gas infrastructure in the region. (IEEFA, August 2020)
FACT: Plans to build petrochemical plants in Beaver County, Pennsylvania and Belmont, Ohio, for the sole purpose of manufacturing plastic nurdles will not be as profitable as originally portrayed. (IEEFA Report, June 2020)
A clean energy economy is the only way forward.
FACT: The Dept. of Energy’s U.S. Energy and Employment Report (2017) and E2 Clean Jobs Pennsylvania Report (2020) shows that clean energy jobs in Pennsylvania employ twice as many people as the fossil fuel industry prior to the pandemic.
FACT: The 4-state region of Ohio, West Virginia, Kentucky and Pennsylvania has formed a coalition of labor, policy experts and frontline community leaders called Reimagine Appalachia. This coalition is in the process of addressing the vast number of jobs in renewable and clean energy industries in a report that will be published this fall.
Reimagine Appalachia seeks major federal funding packages that will create jobs, rebuild infrastructure and addresses climate change that will ensure that no one is left behind going forward.
Sources
O’Leary, Sean. “The Not-So-Natural Gas Boom,” Westvirginiaville.com, Aug. 10, 2020.
O’Leary, Sean. “Lies, damned lies, and economic impact studies,” Ohio River Valley Institute, Aug. 31, 2020.
O’Leary, Sean. “Game Unchanged . . . But, Not Unchangeable,” Ohio River Valley Institute, Aug. 11, 2020. Food & Water Watch. “Phantom Jobs: Fracking Job Creation Numbers Don’t Add Up,” March 2020.
Natural Gas Intel
Pa. Dept. of Environmental Protection Energy Programs. 2020 Pennsylvania Energy Employment Report,
Institute for Energy Economics and Financial Analysis (IEEFA). “IEEFA report: Financial risks loom for Shell’s Pennsylvania petrochemicals complex,” June 4, 2020.
IEEFA. “Petrochemicals may be another bad bet for the oil industry,” Aug. 19, 2020.
E2. “Clean Jobs Pennsylvania 2020,” April 15, 2020.
Natural Gas Intel. “Direct Employment in Natural Gas Development Declines by One-Third in Pennsylvania,” Dec. 23, 2016.
PennLive. “How many jobs has Marcellus Shale Really Created?” Jan. 5, 2019.
StateImpact, “Pa. oil and gas jobs down 32 percent since last year,” Dec. 23, 2016.
The Breathe Project is a coalition of citizens, environmental advocates, public health professionals and academics using the best available science and technology to improve air quality, eliminate climate pollution and make our region a healthy, prosperous place to live.
FracTracker Alliance is a 501(c)3 organization that maps, analyzes, and communicates the risks of oil, gas, and petrochemical development to advance just energy alternatives that protect public health, natural resources, and the climate.
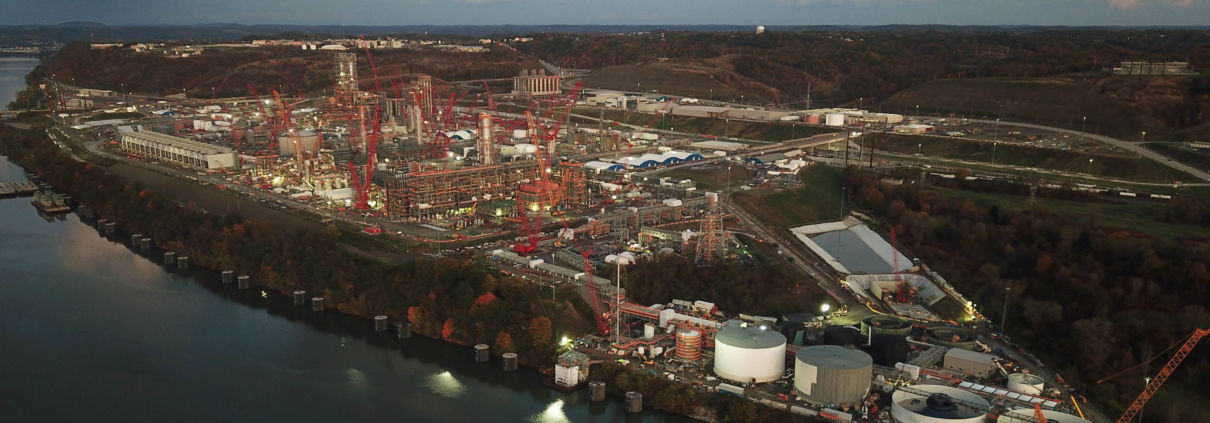
Feature image of construction of the Royal Dutch Shell cracker plant in Beaver County, Pennsylvania, October 2019. Ted Auch, FracTracker Alliance.
COVID-19 and the oil and gas industry are at odds. Air pollution created by oil and gas activities make people more vulnerable to viruses like COVID-19. Simultaneously, the economic impact of the pandemic is posing major challenges to oil and gas companies that were already struggling to meet their bottom line. In responding to these challenges, will our elected leaders agree on a stimulus package that prioritizes people over profits?
People living in areas with poor air quality may be more vulnerable to COVID-19, a disease that affects the lungs. Poor air quality is linked to higher rates of asthma and chronic obstructive pulmonary disease (COPD), even without a pandemic.
Air pollution from oil and gas development can come from compressor stations, condensate tanks, construction activity, dehydrators, engines, fugitive emissions, pits, vehicles, and venting and flaring. The impact is so severe that for every three job years created by fracking in the Marcellus Shale, one year of life is lost due to increased exposure to pollution.
Yes, air quality has improved in certain areas of China and elsewhere due to decreased traffic during the COVID-19 pandemic. But despite our eagerness for good news, sightings of dolphins in Italian waterways does not mean that mother earth has forgiven us or “hit the reset button.”
Significant environmental health concerns persist, despite some improvements in air quality. During the 2003 SARS outbreak, which was caused by another coronavirus, patients from areas with the high levels of air pollution were twice as likely to die from SARS compared to those who lived in places with little pollution.
On March 8th, Stanford University environmental resource economist Marshall Burke looked at the impacts of air quality improvements under COVID-19, and offered this important caveat:
“It seems clearly incorrect and foolhardy to conclude that pandemics are good for health. Again I emphasize that the effects calculated above are just the health benefits of the air pollution changes, and do not account for the many other short- or long-term negative consequences of social and economic disruption on health or other outcomes; these harms could exceed any health benefits from reduced air pollution. But the calculation is perhaps a useful reminder of the often-hidden health consequences of the status quo, i.e. the substantial costs that our current way of doing things exacts on our health and livelihoods.”
This is an environmental justice issue. Higher levels of air pollution tend to be in communities with more poverty, people of color, and immigrants. Other health impacts related to oil and gas activities, from cancer to negative birth outcomes, compromise people’s health, making them more vulnerable to COVID-19. Plus, marginalized communities experience disproportionate barriers to healthcare as well as a heavier economic toll during city-wide lockdowns.
The COVID-19 health crisis is setting off major changes in the oil and gas industry. The situation may thwart plans for additional petrochemical expansion and cause investors to turn away from fracking for good.
Oil, gas, and petrochemical producers were facing financial uncertainties even before COVID-19 began to spread internationally. Now, the economics have never been worse.
In 2019, shale-focused oil and gas producers ended the year with net losses of $6.7 billion. This capped off the decade of the “shale revolution,” during which oil and gas companies spent $189 billion more on drilling and other capital expenses than they brought in through sales. This negative cash flow is a huge red flag for investors.
“North America’s shale industry has never succeeded in producing positive free cash flows for any full year since the practice of fracking became widespread.” IEEFA
Shale companies in the United States produce more natural gas than they can sell, to the extent that they frequently resort to burning gas straight into the atmosphere. This oversupply drives down prices, a phenomenon that industry refers to as a “price glut.”
The oil-price war between Russia and Saudi Arabia has been taking a toll on oil and gas prices as well. Saudi Arabia plans to increase oil production by 2 – 3 million barrels per day in April, bringing the global total to 102 million barrels produced per day. But with the global COVID-19 lockdown, transportation has decreased considerably, and the world may only need 90 million barrels per day.
If you’ve taken Econ 101, you know that when production increases as demand decreases, prices plummet. Some analysts estimate that the price of oil will soon fall to as low as $5 per barrel, (compared to the OPEC+ intended price of $60 per barrel).
Oil and gas industry lobbyists have asked Congress for financial support in response to COVID-19. Two stimulus bills in both the House and Senate are currently competing for aid.
Speaker McConnell’s bill seeks to provide corporate welfare with a $415 billion fund. This would largely benefit industries like oil and gas, airlines, and cruise ships. Friends of the Earth gauged the potential bailout to the fracking industry at $26.287 billion. In another approach, the GOP Senate is seeking to raise oil prices by directly purchasing for the Strategic Petroleum Reserve, the nation’s emergency oil supply.
Speaker Pelosi’s proposed stimulus bill includes $250 billion in emergency funding with stricter conditions on corporate use, but doesn’t contain strong enough language to prevent a massive bailout to oil and gas companies.
Hopefully with public pressure, Democrats will take a firmer stance and push for economic stimulus to be directed to healthcare, paid sick leave, stronger unemployment insurance, free COVID-19 testing, and food security.
Fracking companies were struggling to stay afloat before COVID-19 even with generous government subsidies. It’s becoming very clear that the fracking boom is finally busting. In an attempt to make use of the oversupply of gas and win back investors, the petrochemical industry is expanding rapidly. There are currently plans for $164 billion of new infrastructure in the United States that would turn fracked natural gas into plastic.

The location of the proposed PTTGC Ethane Cracker in Belmont, Ohio. Go to this map.
There are several fundamental flaws with this plan. One is that the price of plastic is falling. A new report by the Institute for Energy Economics and Financial Analysis (IEEFA) states that the price of plastic today is 40% lower than industry projections in 2010-2013. This is around the time that plans started for a $5.7 billion petrochemical complex in Belmont County, Ohio. This would be the second major infrastructural addition to the planned petrochemical buildout in the Ohio River Valley, the first being the multi-billion dollar ethane cracker plant in Beaver County, Pennsylvania.
Secondly, there is more national and global competition than anticipated, both in supply and production. Natural gas and petrochemical companies have invested in infrastructure in an attempt to take advantage of cheap natural gas, creating an oversupply of plastic, again decreasing prices and revenue. Plus, governments around the world are banning single-use plastics, and McKinsey & Company estimates that up to 60% of plastic production could be based on reuse and recycling by 2050.
Sharp declines in feedstock prices do not lead to rising demand for petrochemical end products.
Third, oil and gas companies were overly optimistic in their projections of national economic growth. The IMF recently projected that GDP growth will slow down in China and the United States in the coming years. And this was before the historic drop in oil prices and the COVID-19 outbreak.
“The risks are becoming insurmountable. The price of plastics is sinking and the market is already oversupplied due to industry overbuilding and increased competition,” said Tom Sanzillo, IEEFA’s director of finance and author of the report.
Oil, gas, and petrochemical companies are facing perilous prospects from demand and supply sides. Increasing supply does not match up with decreasing demand, and as a result the price of oil and plastics are dropping quickly. Tens of thousands of oil and gas workers are being fired, and more than 200 oil and gas companies have filed for bankruptcy in North America in the past five years. Investors are no longer interested in propping up failing companies.
Natural gas accounts for 44% of electricity generation in the United States – more than any other source. Despite that, the cost per megawatt hour of electricity for renewable energy power plants is now cheaper than that of natural gas power plants. At this point, the economy is bound to move towards cleaner and more economically sustainable energy solutions.
It’s not always necessary or appropriate to find a “silver lining” in crises, and it’s wrong to celebrate reduced pollution or renewable energy achievements that come as the direct result of illness and death. Everyone’s first priority must be their health and the health of their community. Yet the pandemic has exposed fundamental flaws in our energy system, and given elected leaders a moment to pause and consider how we should move forward.
It is a pivotal moment in terms of global energy production. With determination, the United States can exercise the political willpower to prioritize people over profits– in this case, public health over fossil fuel companies.
Top photo of petrochemical activity in the Houston, Texas area. By Ted Auch, FracTracker Alliance. Aerial assistance provided by LightHawk.
Ohio continues to increase fracked gas production, facilitated by access to freshwater and lax radioactive waste disposal requirements.
View map fullscreen | How FracTracker maps work
A little under a year ago, FracTracker released a map and associated analysis, “A Disturbing Tale of Diminishing Returns in Ohio,” with respect to Utica oil and gas production, highlighting the increasing volume of waste injected in wastewater disposal wells, and trends in lateral length in fracked wells from 2010 to 2018. In this article, I’ll provide an update on Ohio’s Utica oil and gas production in 2018 and 2019, the demands on freshwater, and waste disposal. After looking at the data, I recommend that we holistically price our water resources and the ways in which we dispose of the industry’s radioactive waste in order to minimize negative externalities.
Recently, I’ve been inspired by the works of Colin Woodward[1] and Marvin Harris, who outline the struggle between liberty and the common good. They relate this to the role that commodities and increasing resource intensity play in maintaining or enhancing living standards. This quote from Harris’s “Cannibals and Kings” struck me as the 122 words that most effectively illustrate the impacts of the fracking boom that started more than a decade ago in Central Appalachia:
“Regardless of its immediate cause, intensification is always counterproductive. In the absence of technological change, it leads inevitably to the depletion of the environment and the lowering of the efficiency of production since the increased effort sooner or later must be applied to more remote, less reliable, and less bountiful animals, plants, soils, minerals, and sources of energy. Declining efficiency in turn leads to low living standards – precisely the opposite of the desired result. But this process does not simply end with everybody getting less food, shelter, and other necessities in return for more work. As living standards decline, successful cultures invent new and more efficient means of production which sooner or later again lead to the depletion of the natural environment.” From Chapter 1, page 5 of Marvin Harris’ “Cannibals and Kings: The Origins of Cultures, 1977
In reflecting on Harris’s quote as it pertains to fracking, I thought it was high time I updated several of our most critical data sets. The maps and data I present here speak to intensification and the fact that the industry is increasingly leaning on cheap water withdrawals, landscape impacts, and waste disposal methods to avoid addressing their increasingly gluttonous ways. To this point, the relationship between intensification and resource utilization is not just the purview of activists, academics, and journalists anymore; industry collaborators like IHS Markit admitting as much in their latest analysis pointing to the fact that oil and gas operators “will have to drill substantially more wells just to maintain current production levels and even more to grow production”. Insert Red Queen Hypothesis analogy here!
The four updated data sets presented here are: 1) oil, gas, and wastewater production, 2) surface and groundwater withdrawal rates for the fracking industry, 3) freshwater usage by individual Ohio fracked wells, and 3) wastewater disposal well (also referred to as Class II injection wells) rates.
Below are the most important developments from these data updates as it pertains to intensification and what we can expect to see in the future, with or without the ethane cracker plants being trumpeted throughout Appalachia.
From a production standpoint, total oil production has increased by 30%, while natural gas production has increased by 50% year over year between the last time we updated this data and Q2-2019 (Table 1).
According to the data we’ve compiled, the rate of growth for wastewater production has exceeded oil and is nearly equal to natural gas at 48% from 2017 to 2018. On average the 2,398 fracked wells we have compiled data for are producing 27% more wastewater per well now than they did at the end of 2017.
| ————–2017————– | ————–2019————– | |||||
| Oil (million barrels) | Gas (million Mcf) | Brine (million barrels) | Oil (million barrels) | Gas (million Mcf) | Brine (million barrels) | |
| Max | 0.51 | 12.92 | 0.23 | 0.62 | 17.57 | 0.32 |
| Total | 83.14 | 5,768.47 | 76.01 | 108.15 | 8,679.12 | 112.28 |
| Mean | 0.40 | 2.79 | 0.37 | 0.45 | 3.62 | 0.47 |
Table 1. Summary statistics for 2,398 fracked wells in Ohio from a production perspective from 2017 to Q2 2019.
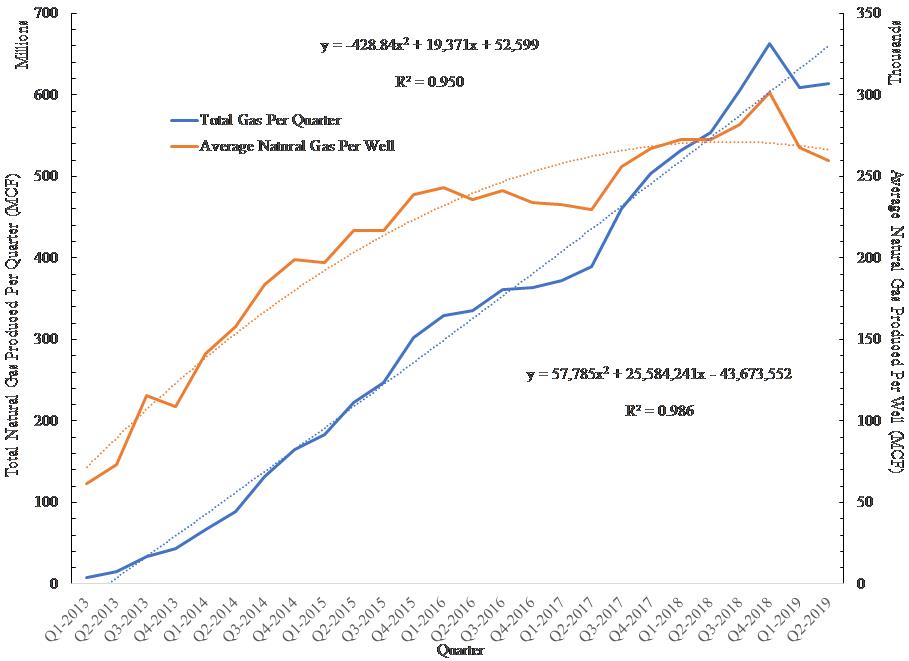
Figure 1. Total fracked gas produced per quarter and average fracked gas produced per well in Ohio from 2013 to Q2-2019.
The increasing amount of resources and number of wells necessary to achieve marginal increases in oil and gas production is a critical factor to considered when assessing industry viability and other long-term implications. As an example, in Ohio’s Utica Shale, we see that total production is increasing, but as IHS Markit admits, this is only possibly by increasing the total number of producing wells at a faster rate. As is evidenced in Figure 1, somewhere around the Winter of 2017-2018, the production rate per well began to flatline and since then it has begun to decrease.
Since last we updated the industry’s water withdrawal rates, the Ohio Department of Natural Resources (ODNR) has begun to report groundwater rates in addition to surface water. The former now account for nine sites in seven counties, but amount to a fraction of reported withdrawals to date (around 00.01% per year in 2017 and 2018). The more disturbing developments with respect to intensification are:
1) Since we last updated this data, 59 new withdrawal sites have come online. There are currently 569 sites in total in ODNR’s database. This amounts to a nearly 12% increase in the total number of sites since 2017. With this additional inventory, the average withdrawal rate across all sites has increased by 13% (Table 2).
2) Since 2010, the demand for freshwater to be used in fracking has increased by 15.6% or 693 million gallons per year (Figure 2).
3) We expect to see an inflection point when water production will increase to accommodate the petrochemical buildout with cracker plants in Dilles Bottom, OH; Beaver County, PA; and elsewhere. In 2018 alone, the oil and gas industry pulled 4.69 billion gallons of water from the Ohio River Valley. Since 2010, the industry has permanently removed 22.96 billion gallons of freshwater from the Ohio River Valley. It would take the entire population of Ohio five years to use the 2018 rate in their homes.[2]
As we and others have mentioned in the past, this trend is largely due to the bargain basement price at which we sell water to the oil and gas sector throughout Appalachia.[3] To increase their nominal production returns, companies construct longer laterals with orders of magnitude more water, sand, and chemicals. At this rate, the fracking industry’s freshwater demand will have doubled to around 8.8-.9.5 billion gallons per year by around 2023. Figure 3 demonstrates that average fracked lateral length continues to increase to the tune of +15.7-21.2% (+1,564-2,107 feet) per quarter per lateral. This trend alone is more than 2.5 times the rate of growth in oil production and roughly 24% greater than the rate of growth in natural gas production (See Table 1).
4. The verdict is even more concerning than it was a couple years ago with respect to water demand increasing by 30% per quarter per well or an average of 4.73 million gallons (Figure 4). The last time we did this analysis >1.5 years ago demand was rising by 25% per quarter or 3.84 million gallons. At that point I wouldn’t have guessed that this exponential rate of water demand would have increased but that is exactly what has happened. Very immediate conversations must start taking place in Columbus and at the region’s primary distributor of freshwater, The Muskingum Watershed Conservancy District (MWCD), as to why this is happening and how to push back against the unsustainable trend.
| 2017 | 2018 | |
| Sites | 510 | 569 |
| Maximum (billion gallons) | 1.059 | 1.661 |
| Sum (billion gallons) | 18.267 | 22.957 |
| Mean (billion gallons) | 0.358 | 0.404 |
Table 2. Summary of fracking water demands throughout Ohio in 2017 when we last updated this data as well as how those rates changed in 2018.

Figure 2. Hydraulic fracturing freshwater demand in total across 560+ sites in Ohio from 2010 to 2018 (million gallons per year).
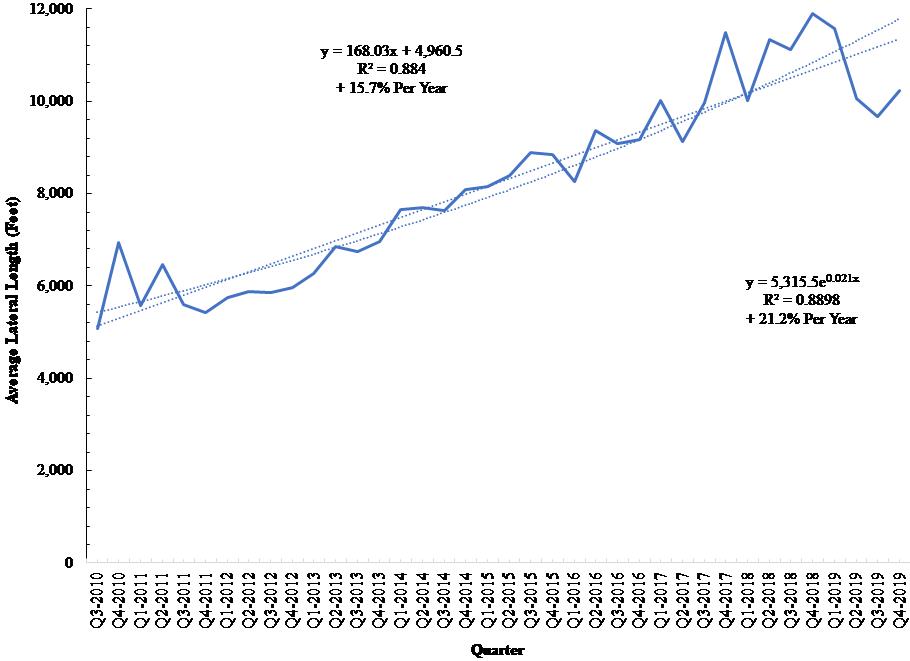
Figure 3. Average lateral length for all of Ohio’s permitted hydraulically fractured laterals from from Q3-2010 to Q4-2019, along with average rates of growth from a linear and exponential standpoint (feet).
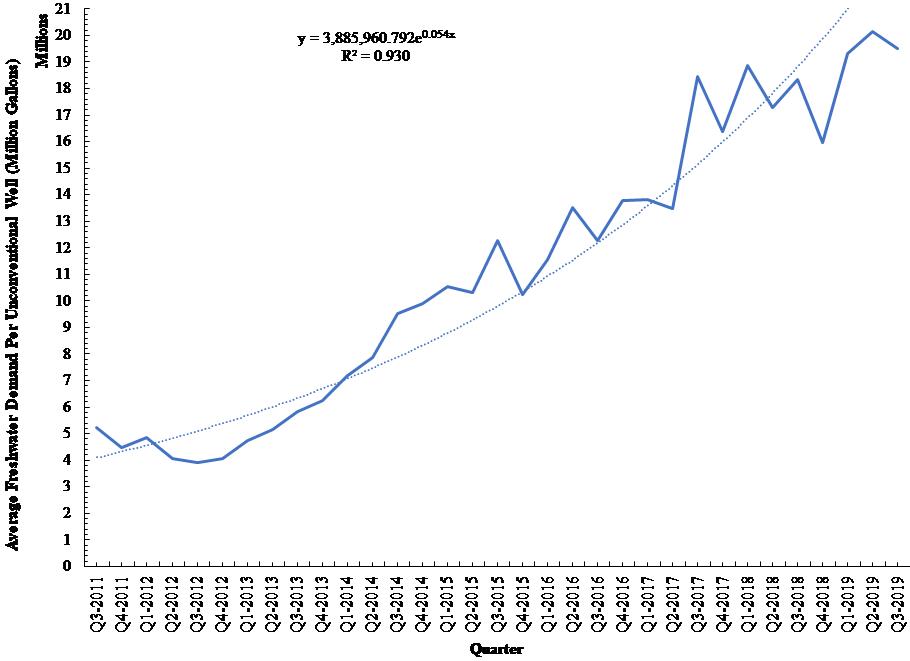
Figure 4. Average Freshwater Demand Per Unconventional Well in Ohio from Q3-2011 to Q3-2019 (million gallons).
When it comes to fracking wastewater disposal, the picture is equally disturbing. Average disposal rates across Ohio’s 220+ wastewater disposal wells increased by 12.1% between Q3-2018 and Q3-2019 (Table 3). Interestingly, this change nearly identically mirrors the change in water withdrawals during the same period. What goes down– freshwater – eventually comes back up.
Across all of Ohio’s wastewater disposal wells, total volumes increased by nearly 22% between 2018 and the second half of 2019. However, the more disturbing trend is the increasing focus on the top 20 most active wastewater disposal wells, which saw an annual increase of 17-18%. These wells account for nearly 50% of all waste and the concern here is that many of the pending wastewater disposal well permits are located on these sites, within close proximity, and/or are proposed by the same operators that operate the top 20.
When we plot cumulative and average disposal rates per well, we see a continued exponential increase. If we look back at the last time, we conducted this analysis, the only positive we see in the data is that at that time, average rates of disposal per well were set to double by the Fall of 2020. However, that trend has tapered off slightly — rates are now set to double by 2022.
Each wastewater disposal well is seeing demand for its services increase by 2.42 to 2.94 million gallons of wastewater per quarter (Figure 5). Put another way, Ohio’s wastewater disposal wells are rapidly approaching their capacity, if they haven’t already. Hence why the oil and gas industry has been frantically submitting proposals for additional waste disposal wells. If these wells materialize, it means that Ohio will continue to be relied on as the primary waste receptacle for the fracking industry throughout Appalachia.
| Variable | ——————-All Wells——————- | ——————-Top 20——————- | ||||
| To Q3-2018 | To Q3-2019 | % Change | To Q3-2018 | To Q3-2019 | % Change | |
| Number of Wells | 223 | 243 | +9.0 | ——- | ——- | ——- |
| Max (MMbbl) | 1.12 | 1.20 | +7.1 | ——- | ——- | ——- |
| Sum (MMbbl) | 203.19 | 247.05 | +21.6 | 101.43 | 119.31 | +17.6 |
| Average (MMbbl) | 0.91 | 1.02 | +12.1 | 5.07 | 5.97 | +17.8 |
Table 3. Summary Statistics for Ohio’s Wastewater Disposal Wells (millions of barrels (MMbbl)).

Figure 5. Average Fracking Waste Disposal across all of Ohio’s Wastewater Disposal Wells and the cumulative amount of fracking waste disposed of in these wells from Q3-2010 to Q2-2019 (million barrels).
Using the Pennsylvania natural gas data merged with the Ohio wastewater data, we were able to put a finer point on how much wastewater would be produced with a 100,000 barrel ethane cracker like the one PTT Global Chemical has proposed for Dilles Bottom, Ohio. The following are our best estimate calculations assuming 1 barrel of condensate is 20-40% ethane. These calculations required that we take some liberties with the merge of the ratio of gas to wastewater in Ohio with the ratio of gas to condensate in Pennsylvania:
But wait, here is the real stunner:
Therefore, we estimate the fracked wells supplying the proposed PTTGC ethane cracker will generate between 20.76 million and 41.52 million gallons of wastewater per day. That is 3.8 to 7.6 times the amount of wastewater currently received by Ohio’s wastewater disposal wells.
What does this means in terms of truck traffic? We can assume that at least 80% of the trucks that transport wastewater are the short/baby bottle trucks which haul 110 barrels per trip. This means that our wastewater estimates would require between 4,493 and 8,987 truck trips per day, respectively. The pressures this amount of traffic will put on Appalachian roads and communities will be hard to measure and given the current state of state and federal politics and/or oversight it will be even harder to measure the impact inevitable spills and accidents will have on the region’s waterways.
There is no reason to believe these trends will not persist and become more intractable as the industry increasingly leans on cheap waste disposal and water as a crutch. The fracking industry will continue to present shareholders with the illusion of a robust business model, even in the face of rapid resource depletion and precipitous production declines on a per well basis.
I am going to go out on a limb and guess that unless we more holistically price our water resources and the ways in which we dispose of the industry’s radioactive waste, there will be no other supply-side signal that we could send that would cause the oil and gas industry to change its ways. Until we reach that point, we will continue to compile data sets like the ones described above and included in the map below, because as Supreme Court Justice Louis Brandeis once said, “Sunlight is the best disinfectant!”
By Ted Auch, Great Lakes Program Coordinator, FracTracker Alliance with invaluable data compilation assistance from Gary Allison
[1] Colin Woodward’s “American Character: A history of the epic struggle between individual liberty and the common good” is a must read on the topic of resource utilization and expropriation.
[2] https://pubs.er.usgs.gov/publication/cir1441
[3] In Ohio the major purveyor of water for the fracking industry is the Muskingum Watershed Conservancy District (MCWD) and as we’ve pointed out in the past they sell water for roughly $4.50 to $6.50 per thousand gallons. Meanwhile across The Ohio River the average price of water for fracking industry in West Virginia in the nine primary counties where fracking occurs is roughly $8.38 per thousand gallons.
Quarterly oil, gas, brine, and days in production for 2,390+ Unconventional Utica/Point Pleasant Wells in Ohio from 2010 to Q2-2019
https://fractracker.org/wp-content/uploads/2019/12/Production_To_Q2_2019_WithExcel.zip
Ohio Hydraulic Fracturing Freshwater and Groundwater Withdrawals from 2010 to 2018
https://fractracker.org/wp-content/uploads/2019/12/OH_WaterWithdrawals_2010_2018_WithExcel.zip
Lateral length (Feet) for 3,200+ Fracked Utica/Point Pleasant Wells in Ohio up to and including wells permitted in December, 2019
https://fractracker.org/wp-content/uploads/2020/01/OH_Utica_December_2019_StatePlane_Laterals.zip
Freshwater Use for 2,700+ Unconventional Wells in Ohio from Q3-2011 to Q3-2019
https://fractracker.org/wp-content/uploads/2019/12/OH_FracFocus_December_2019_WithExcel.zip
Quarterly Volume Disposal (Barrels) for 220+ Ohio Class II Salt Water Disposal Wells from 2010 to Q4-2019
https://fractracker.org/wp-content/uploads/2019/12/OH_ClassII_Loc_Vols_10_Q4_2019_WithExcel.zi
Since the advent of unconventional shale gas drilling, some effects have been immediate, some have emerged over time, and some are just becoming apparent. Two reports recently published by the Delaware Riverkeeper Network advance our understanding of the breadth of the impacts of fracking in Pennsylvania. The first report, written by FracTracker, reviews research on the ways fracking impacts the health of Pennsylvanians. The second report by ECONorthwest calculates the economic costs of the industry.
“Fracking is heavily impacting Pennsylvania in multiple ways but the burden is not being fairly and openly calculated. These reports reveal the health effects and economic costs of fracking and the astounding burdens people and communities are carrying,” said Maya van Rossum, the Delaware Riverkeeper.
Learn what the latest science and analysis tells us about the costs of fracking, who is paying now, and what the future price is forecasted to be.
“Categorical Review of Health Reports on Unconventional Oil and Gas Development; Impacts in Pennsylvania,” FracTracker Alliance, 2019 Issue Paper
“The Economic Costs of Fracking in Pennsylvania,” ECONorthwest, 2019 Issue Paper
“The FracTracker Alliance conducted a review of the literature studying the impact of unconventional oil and gas on health. Findings of this review show a dramatic increase in the breadth and volume of literature published since 2016, with 89% of the literature reporting that drilling proximity has human health effects. Pennsylvanian communities were the most studied sample populations with 49% of reviewed journal articles focused on Marcellus Shale development. These studies showed health impacts including cancer, infant mortality, depression, pneumonia, asthma, skin-related hospitalizations, and other general health symptoms were correlated with living near unconventional oil and gas development for Pennsylvania and other frontline communities.”
–Kyle Ferrar, FracTracker Alliance Western Program Coordinator
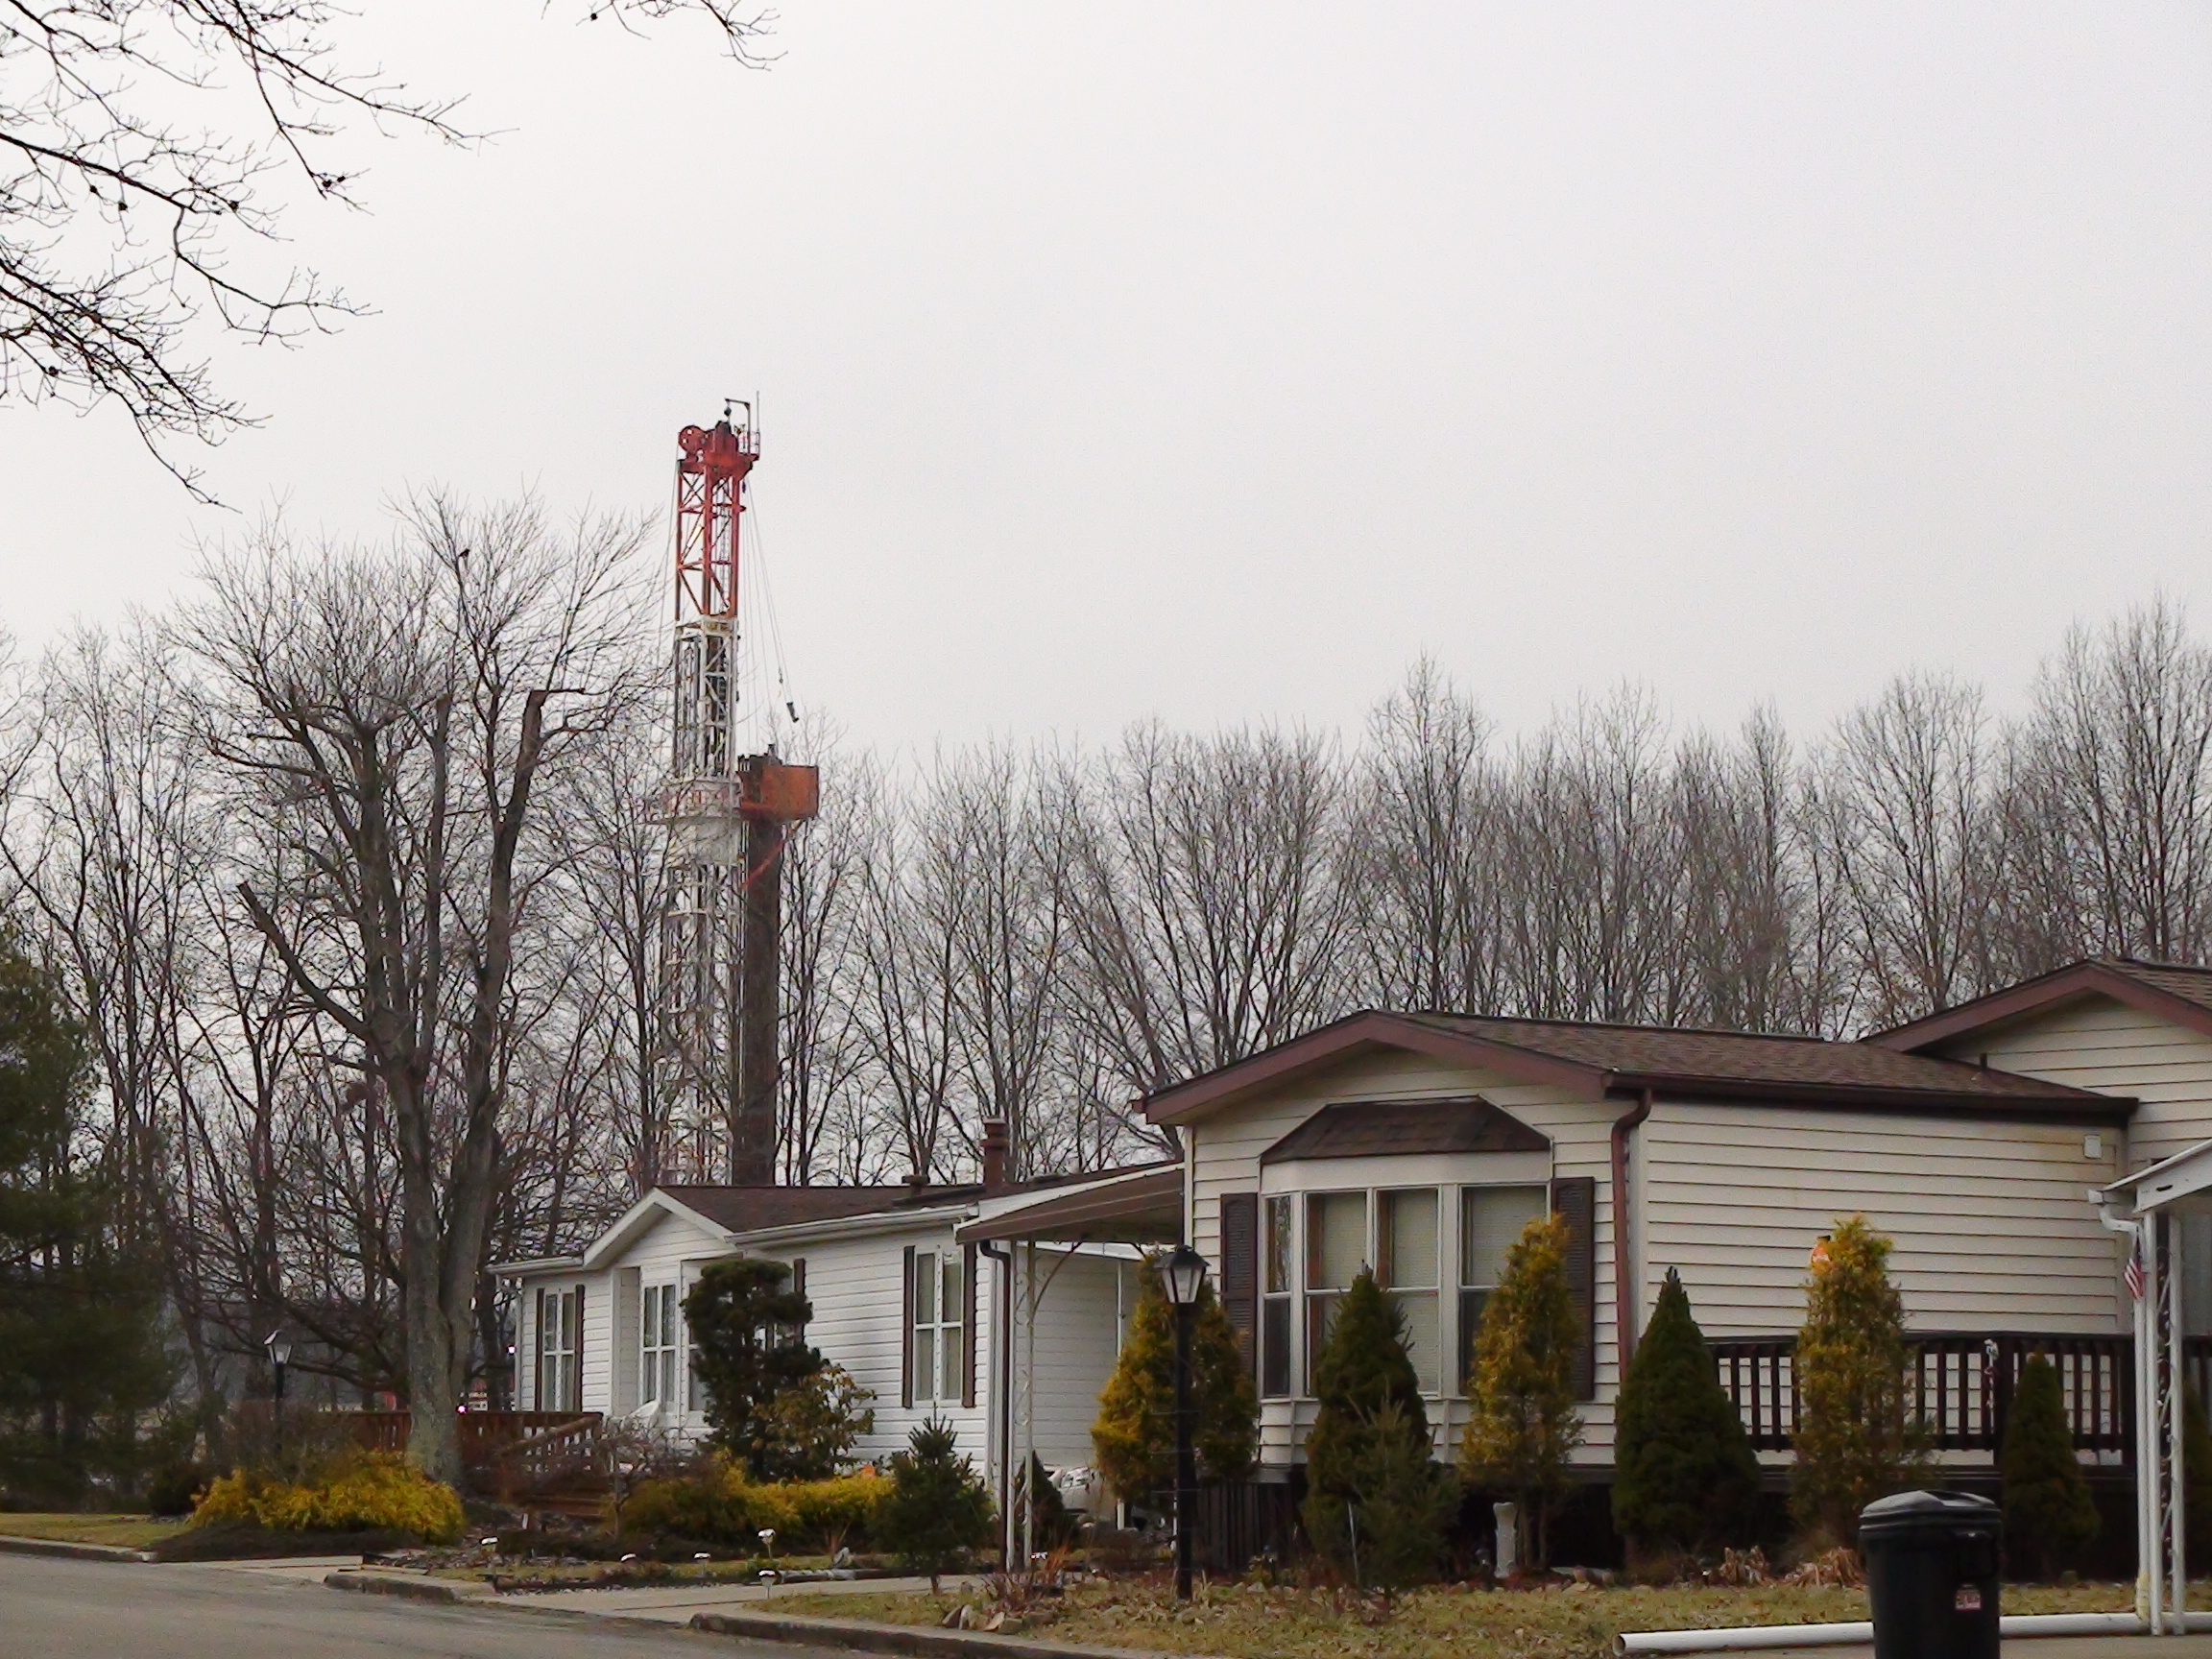
Rig and house. Westwood Lake Park. Photo by J Williams, 2013.
“Fracking wells have an extensive presence across Pennsylvania’s landscape – 20 percent of residents live within 2 miles of a well. This is close enough to cause adverse health outcomes. Collectively we found annual costs of current fracking activity over $1 billion, with cumulative costs given continued fracking activity over the next 20 years of over $50 billion in net present value for the effects that we can monetize. The regional economic benefits also seem to be less than stated, as the long-term benefits for local economies are quite low, and can disrupt more sustainable and beneficial economic trajectories that might not be available after a community has embraced fracking.”
–Mark Buckley, Senior Economist at the natural resource practice at
ECONorthwest
These reports on the health effects and economic impacts of unconventional oil and natural gas development yield disheartening results. There are risks of extremely serious health issues for families in impacted areas, and the long term economic returns for communities are negative.
Arming ourselves with knowledge is an important first step towards the renewable energy transformation that is so clearly needed. The stakes are too high to allow the oil and natural gas industries to dictate the physical, social, and economic health of Pennsylvanians.
Plastic has been getting a lot of negative press lately.
It’s killing marine life, forming vortexes in the ocean, and being burned instead of recycled. But until recently, most of the attention has focused on plastic pollution – the waste that turns up after a product has served its purpose.
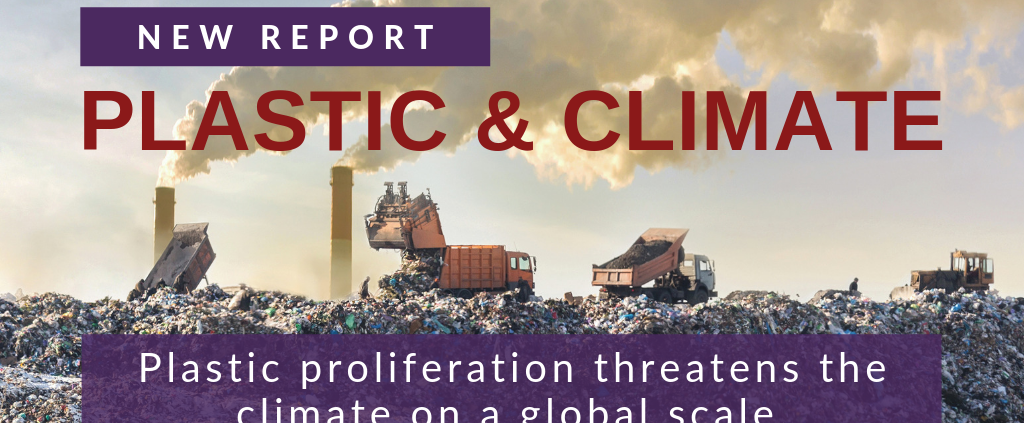
Now that’s changed- the Center for International Environmental Law (CIEL) has recently released “Hidden Costs of a Plastic Planet;” two reports that show us the consequences of plastic across its entire lifecycle. The first, Plastic & Health, explores human health impacts, while the second Plastic & Climate, tackles greenhouse gas emissions.
For the first time, we know the full scope of plastic’s impact – and it’s not looking good.
FracTracker is proud to partner with CIEL and several other organizations, including Earthworks, 5 Gyres, TEJAS, UPSTREAM, GAIA, Exeter University, and Environmental Integrity Project to release these reports.
Access the full reports and executives summaries here:
These reports make it clear: the impacts of plastic are serious, and they’re everywhere. We have the evidence to justify an immediate global move away from our disposable, single-use lifestyle. Tackling this toxic crisis will require action across all levels of society- corporations must consider the full life cycle of their products, policy makers must enact plastic reduction measures, and of course, industry needs to rectify its toxic impacts. Eager to encourage these entities to take action, the FracTracker team is committed to doing our own part to solve this plastics problem, and we hope that it inspires individuals, companies, community leaders, and politicians to join in.
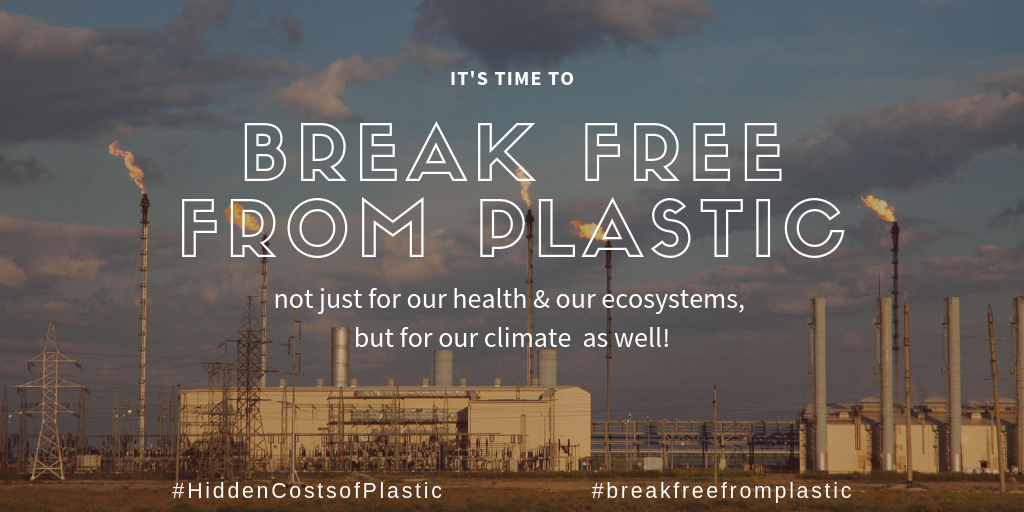
Here’s what we’re doing to help the world #BreakFreeFromPlastic:
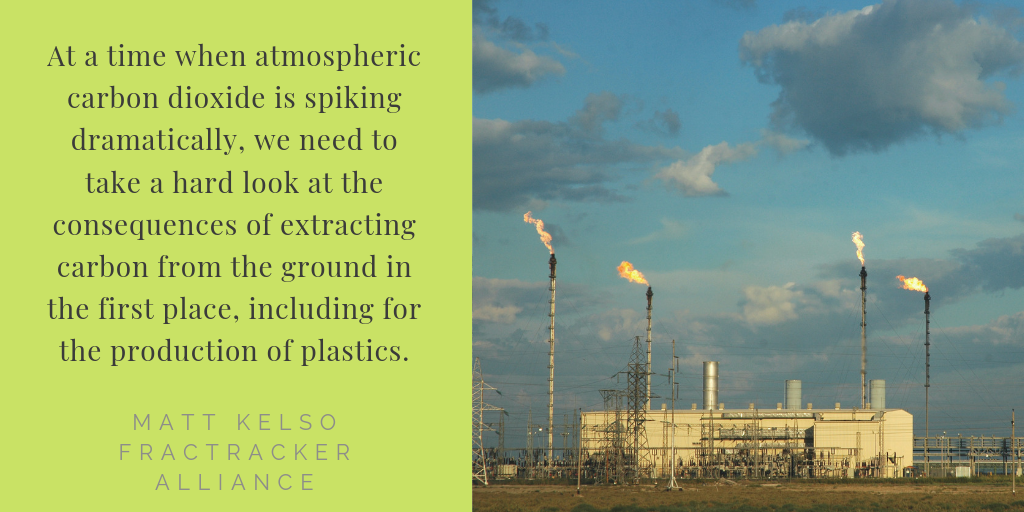
Since over 99% of plastic is made from oil and gas, keeping fossil fuels in the ground is the only way to eliminate all of plastic’s toxic impacts. Plastic & Climate found that extracting and transporting oil and gas for plastic production releases over 100 million metric tons of carbon dioxide equivalents per year. There are many opportunities for these releases to occur, including from methane leakage and flaring, the drilling process, deforestation of forests for pipelines and well pads, and emissions from truck traffic.
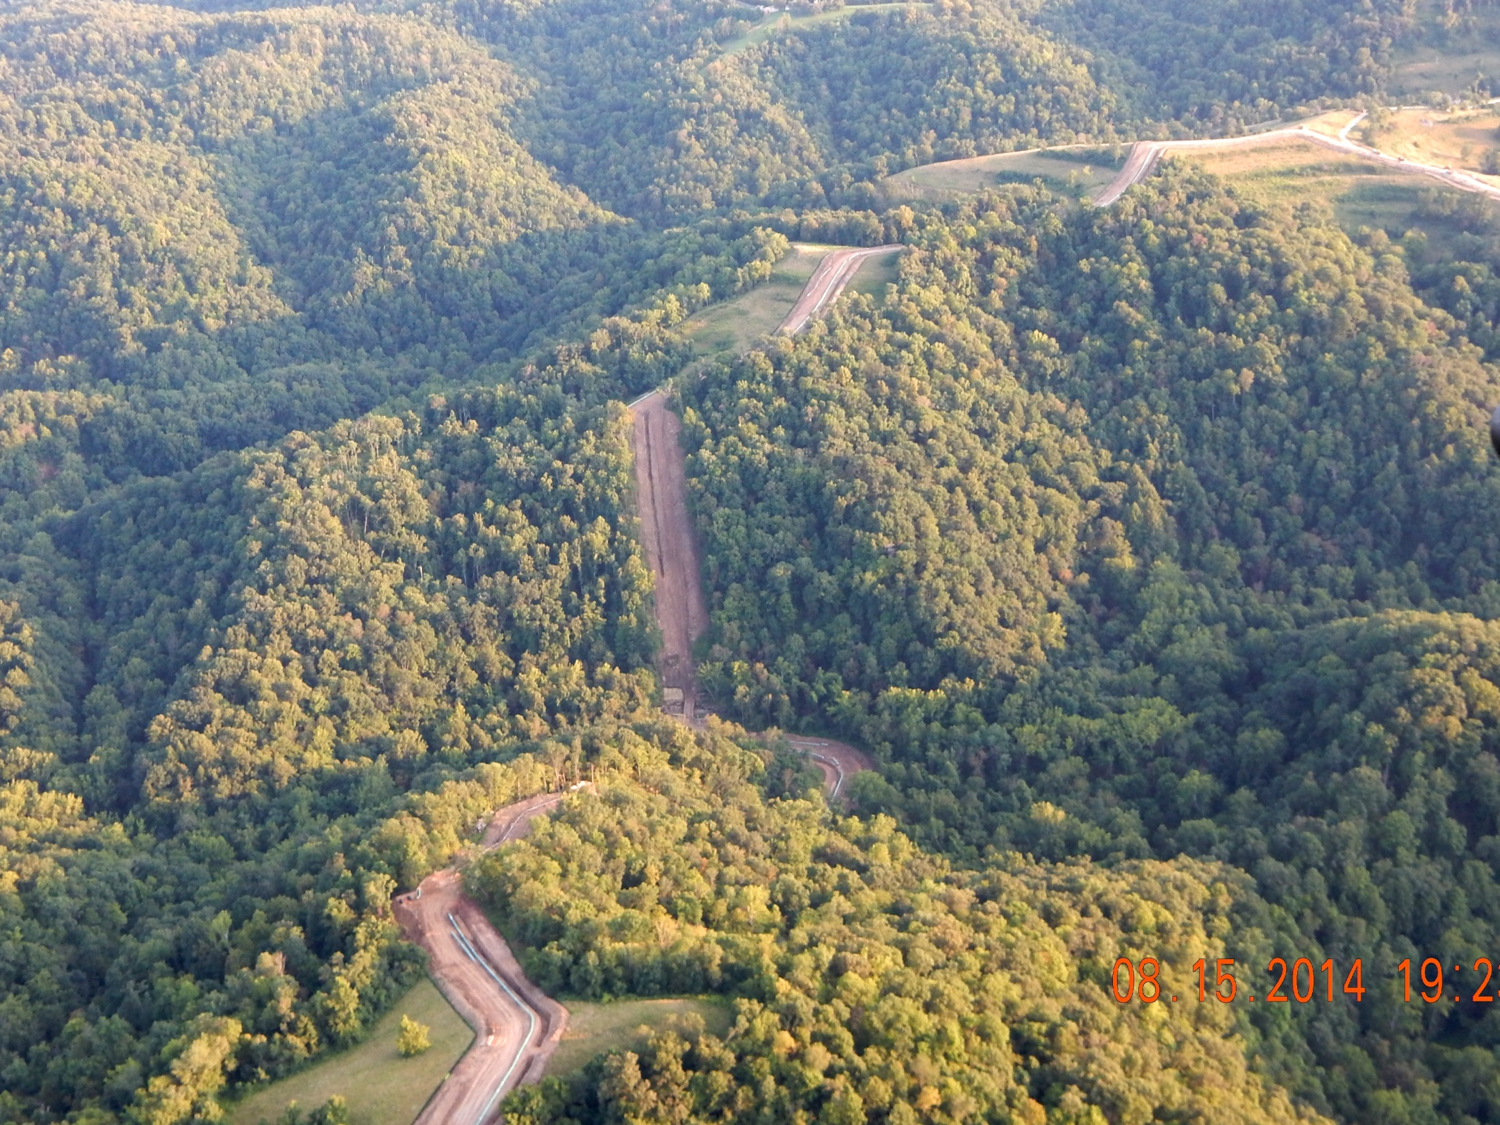
Pipeline construction causes deforestation, releasing carbon stored in trees and preventing further carbon sequestration
The FracTracker team will continue to study, map, and analyze the risks of this industry to encourage both a switch to renewable energy and a movement away from plastic production.
Unconventional technology has opened up access to large reserves of natural gas liquids, such as ethane, and plastic manufacturing is one way to increase demand for this glut. In fact, the oil and gas industry is hoping to increase demand for plastic worldwide by 40%! Two regions with access to natural gas liquids that are rapidly expanding plastics manufacturing capacity are the Gulf Coast and the Ohio River Valley.
Eager to justify this build-out, politicians and industries tout the ways plastic is part of a sustainable future. They say that without investing in plastic, we’re not taking full advantage of our resources, and that by using natural gas to make plastic instead of burning it, we’re keeping greenhouse gasses from entering the atmosphere. Speaking on manufacturing plastic from natural gas with public radio station WHYY, Pennsylvania’s Governor Wolf stated:
“I want to move to a point where what we’re using the gas for is for products that go into that sustainable energy future: lightweight products…so that we’re not burning this, we’re actually creating products that would make that energy future that we all want, that would address the issues of climate change in an effective way.”
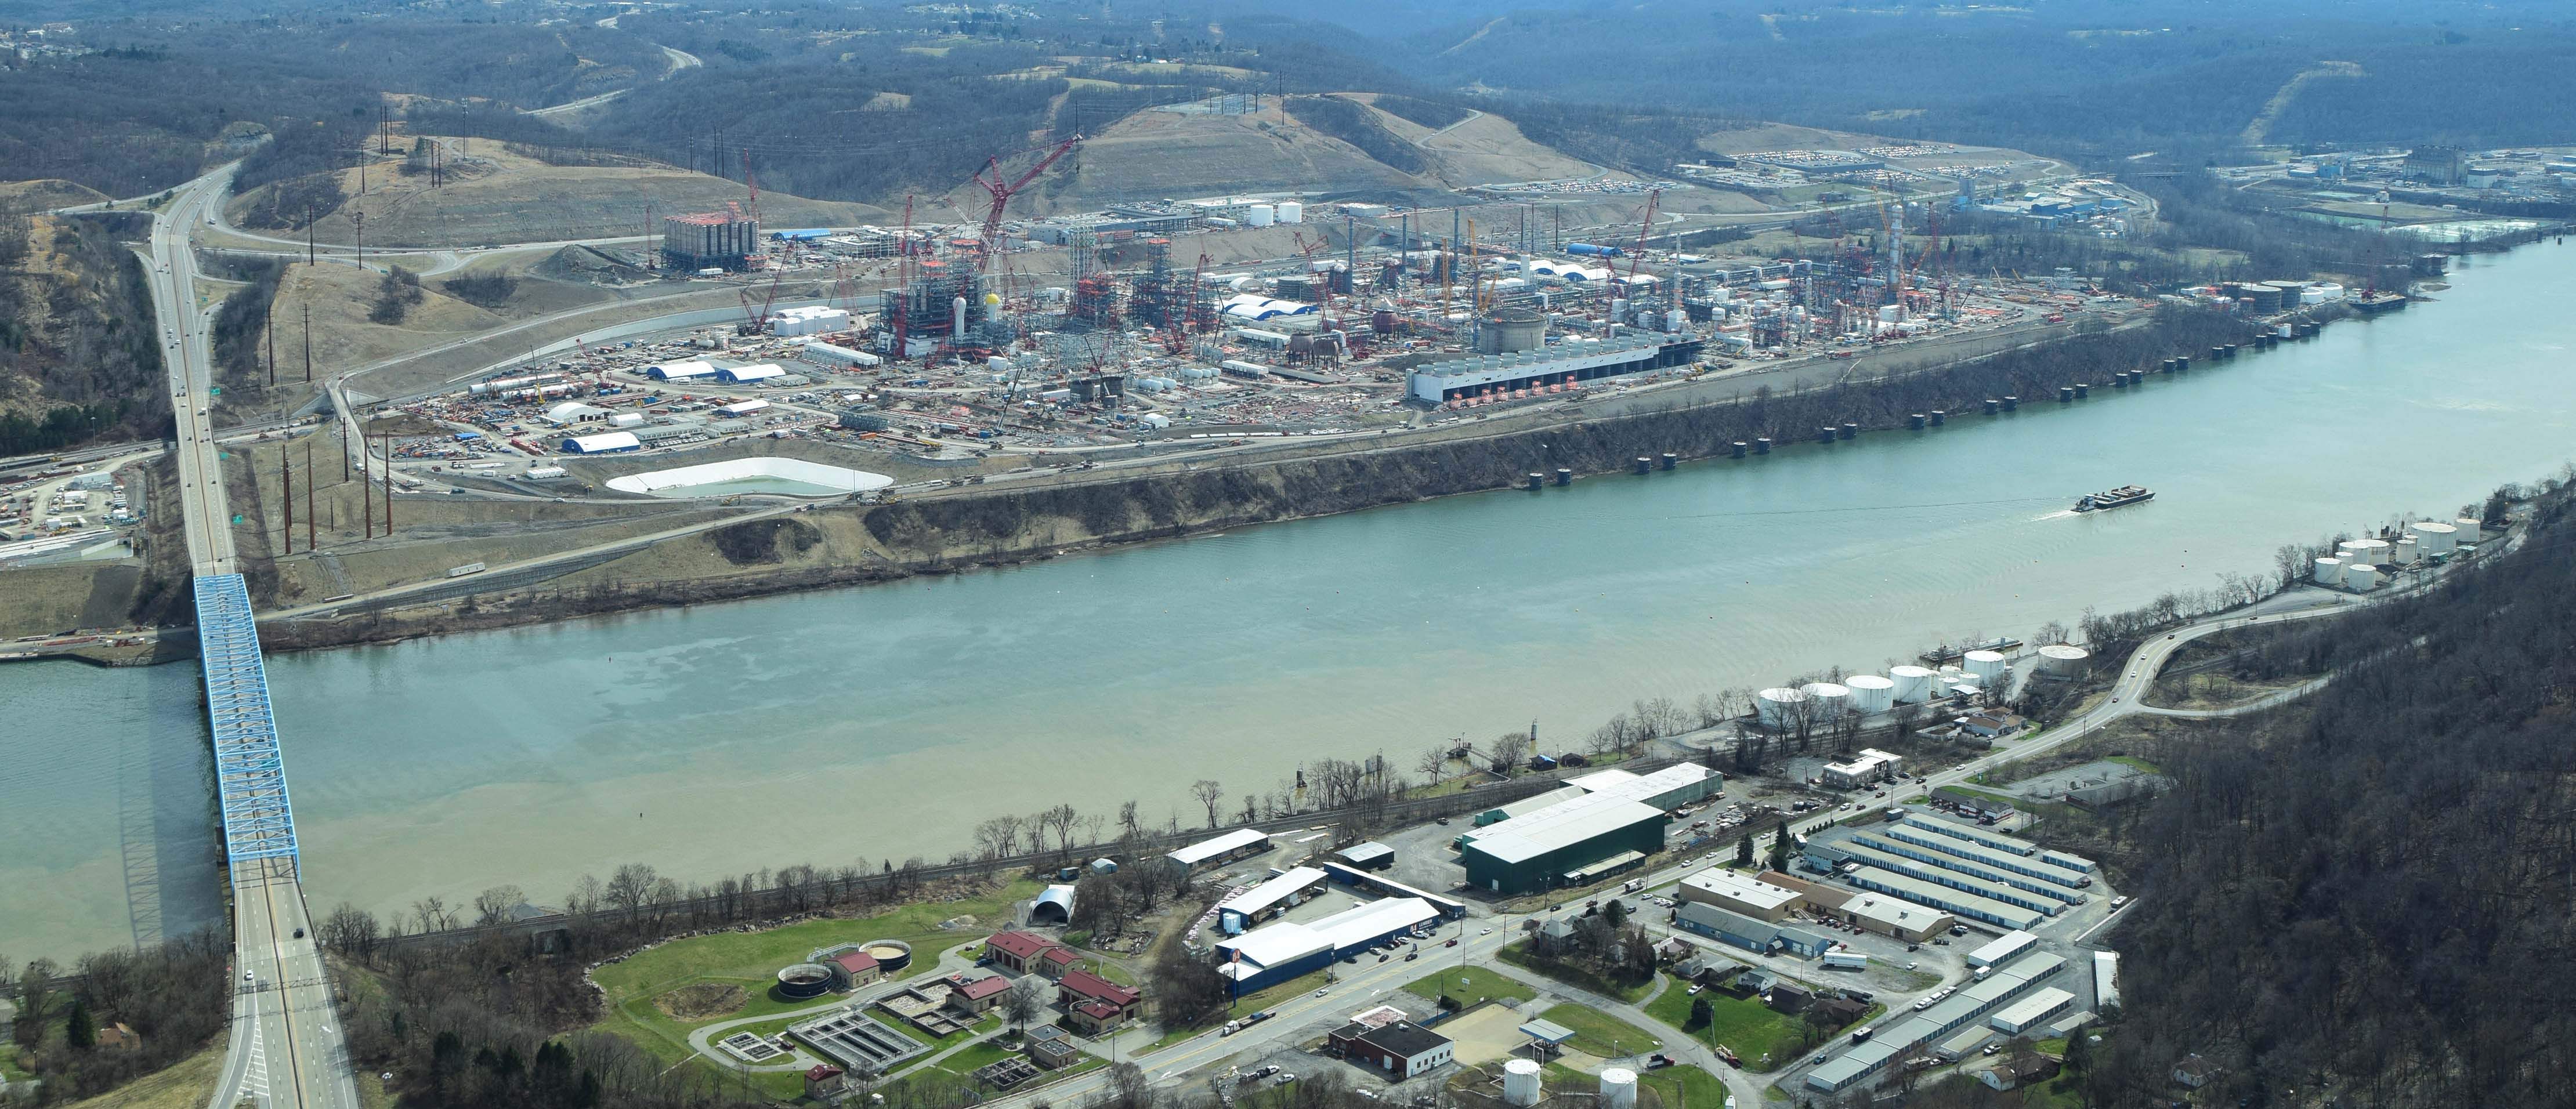
The Shell Ethane Cracker in Pennsylvania is projected to produce 1.6 million tons of plastic per year, which Governor Wolf states is part of a “sustainable energy future.” Photo by Ted Auch, aerial assistance by LightHawk.
But the data say otherwise.
Plastic does not address the issues of climate change. In fact, using natural gas for plastic perpetuates climate change. Climate & Plastics found that this year, “the production and incineration of plastic will add more than 850 million metric tons of greenhouse gases to the atmosphere—equal to the emissions from 136 one-thousand-megawatt coal power plants.” If plastic production grows as currently predicted, by 2030, emissions could reach 1.34 gigatons per year, or 291 new coal plants.
The rate of plastic production is directly at odds with global carbon emissions targets.
While plastic can be used for lightweight parts of electric vehicles or reusable materials, the plastic being produced by the current build out is primarily polyethylene plastic, most commonly used for packaging and single use products- plastic bags, bottles, jugs, containers, and plastic films and linings; products that countries and cities are phasing out.

Source: Greenpeace Canada
While renewable energy is becoming increasingly available, so too are plastic alternatives. Across the world, communities are rethinking the products we use everyday. Thanks to historic legislation, zero waste stores, and towns, and plastic-free bloggers, it’s never been a better time to cut back on plastic – and the FracTracker team is doing our part.
Rebecca, our Administrative and Human Resources Specialist, has cut her plastic use by switching to toothpaste tablets and bars of soap. Karen, our Eastern Program Coordinator, makes her own reusable beeswax food wraps. And Erica Jackson and Isabelle Weber in the Pittsburgh office keep reusable utensils in their backpacks. The whole team is cutting back on single-use plastic products, and are always on the look-out for non oil and gas-based products.
We also realize that with companies like Coca Cola selling 3,000 plastic bottles every second, and Nestlé producing 1.7 million tons of plastic packaging a year, corporations play a key role in this movement.
Through the Story of Stuff’s #Messageinabottle project and Greenpeace’s #Isthisyours campaign, we’re also encouraging corporations to reimagine how the package and transport products.
Now YOU know, what will you do to help your company, community, or yourself #BreakFreeFromPlastic?
Utica oil and gas production, Class II injection well volumes, and lateral length trends from 2010-2018
The US Energy Information Administration (EIA) recently announced that Ohio’s recoverable shale gas reserves have magically increased by 11,076 billion cubic feet (BCF). This increase ranks the Buckeye State in the top 5 for changes in recoverable shale natural gas reserves between 2016 and 2017 (pages 31- 32 here). After reading the predictable and superficial media coverage, we thought it was time to revisit the data to ask a pertinent question: What is the fracking industry costing Ohio?
According to the EIA’s report, Ohio currently sits at #7 on their list of proven reserves. It is estimated there are 27,021 BCF of shale gas beneath the state (Figure 1).
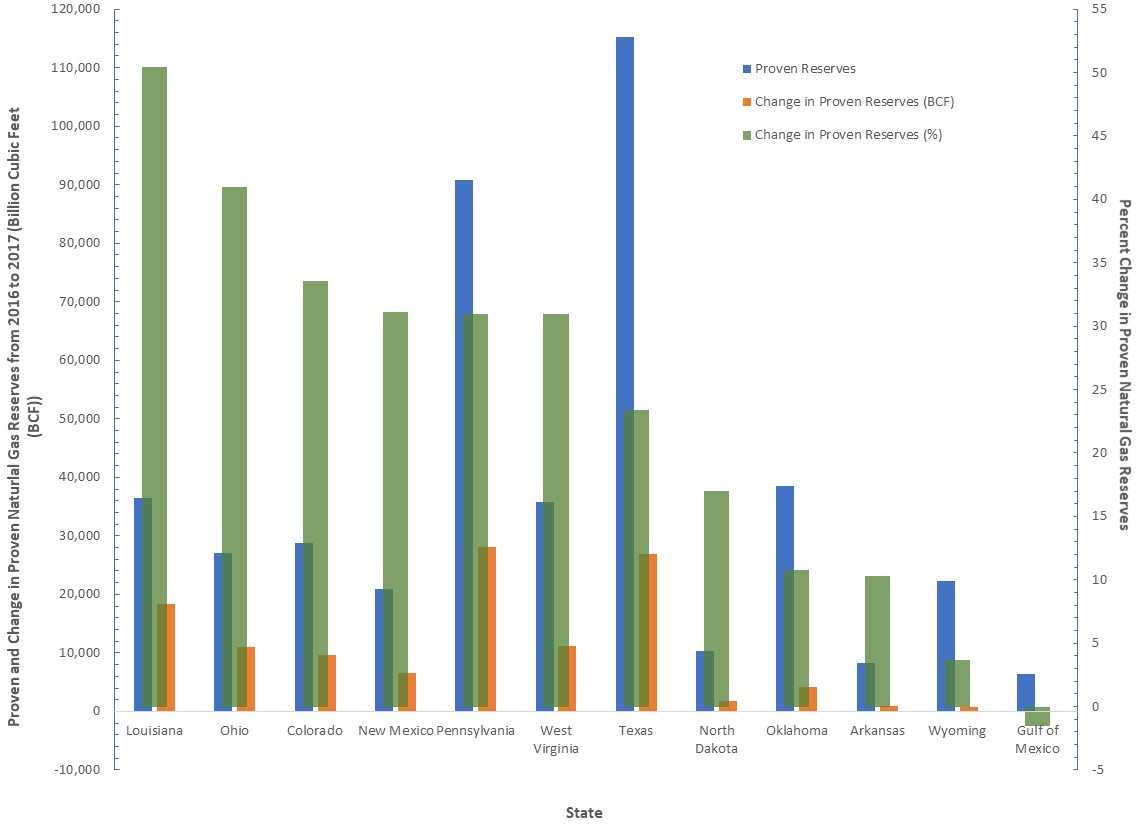
Figure 1. Proven and change in proven natural gas reserves from 2016 to 2017 for the top 11 states and the Gulf of Mexico (calculated from EIA’s “U.S. Crude Oil and Natural Gas Proved Reserves, Year-End 2017”).
There are a few variations in the way the oil and gas industry defines proven reserves:
…an estimated quantity of all hydrocarbons statistically defined as crude oil or natural gas, which geological and engineering data demonstrate with reasonable certainty to be recoverable in future years from known reservoirs under existing economic and operating conditions. Reservoirs are considered proven if economic producibility is supported by either actual production or conclusive formation testing. – The Organization of Petroleum Exporting Countries
… the quantity of natural resources that a company reasonably expects to extract from a given formation… Proven reserves are classified as having a 90% or greater likelihood of being present and economically viable for extraction in current conditions… Proven reserves also take into account the current technology being used for extraction, regional regulations and market conditions as part of the estimation process. For this reason, proven reserves can seemingly take unexpected leaps and drops. Depending on the regional disclosure regulations, extraction companies might only disclose proven reserves even though they will have estimates for probable and possible reserves. – Investopedia
Neither of the definitions above address the large volume of water or wastewater infrastructure required to tap into “proven reserves.” While compiling data for unconventional wells and injection wells, we noticed that the high-volume hydraulic fracturing (HVHF) industry is at a concerning crossroads. In terms of “energy return on energy invested,” HVHF is requiring more and more resources to stay afloat.
OH quarterly Utica oil & gas production along with quarterly Class II injection well volumes:
The map below shows oil and gas production from Utica wells (the primary form of shale gas drilling in Ohio). It also shows the volume of wastewater disposed in Class II salt water disposal injection wells.
View map fullscreen | How FracTracker maps work
Publications like the aforementioned EIA article and language out of Columbus highlight the nominal increases in fracking productivity. They greatly diminish, or more often than not ignore, how resource demand and waste production are also increasing. The data speak to a story of diminishing returns – an industry requiring more resources to keep up gross production while simultaneously driving net production off a cliff (Figure 2).
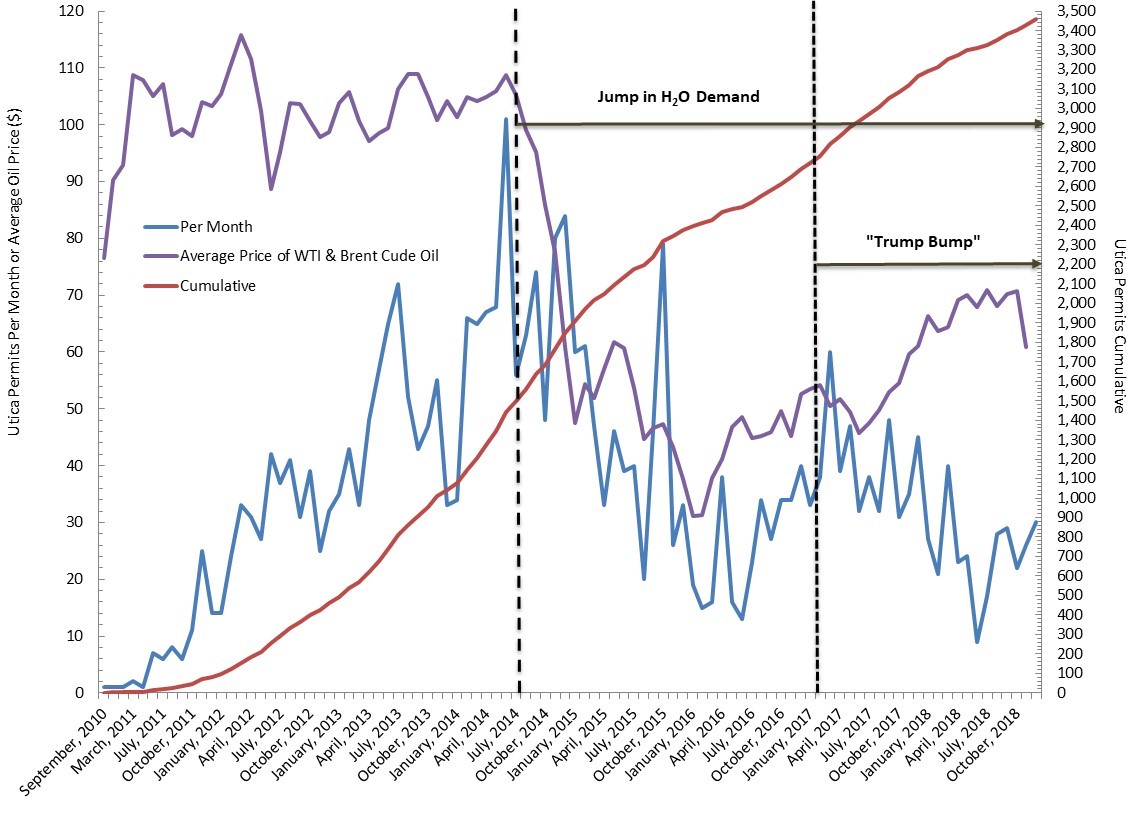
Figure 2. Number of Utica permits in Ohio on a cumulative and monthly basis along with the average price of West Texas Intermediate (WTI) and Brent Crude oil per barrel from September 2010 to December 2018
In the following analysis, we look at the declining efficiency of the HVHF industry throughout Ohio. The data spans the end of 2010 to middle of 2018. We worked with Columbus-area volunteer Gary Allison to conduct this analysis; without Gary’s help this work and resulting map, would not have been possible.
A little more than five years ago today, a significant shift took place in Ohio, as the number of producing gas wells increased while oil well numbers leveled off. The industry’s permitting high-water mark came in June of 2014 with 101 Utica permits that month (a level the industry hasn’t come close to since). The current six-month permitting average is 25 per month.
As the ball dropped in Times Square ringing in 2014, in Ohio, a decoupling between oil and gas wells was underway and continues to this day. The number of wells coming online annually increased by 229 oil wells and 414 gas wells.
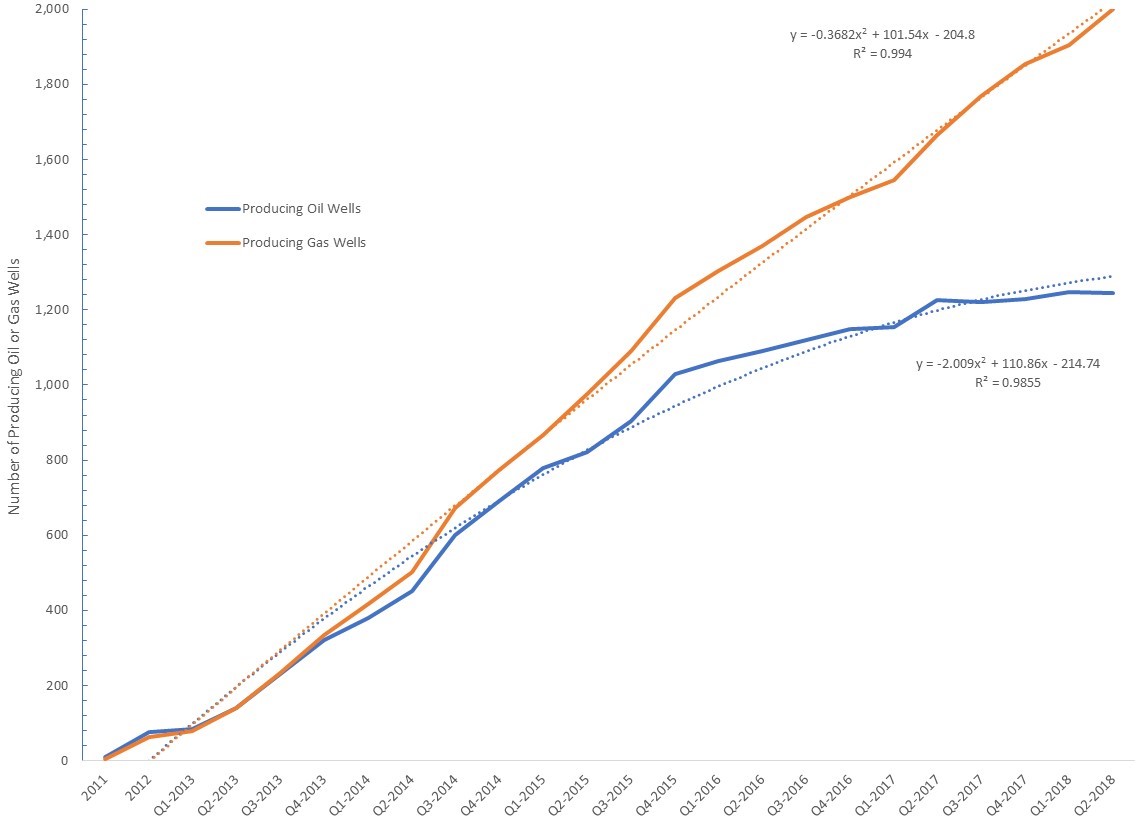
Figure 3. Number of producing oil and gas wells in Ohio’s Utica Shale Basin from 2011 to Q2-2018
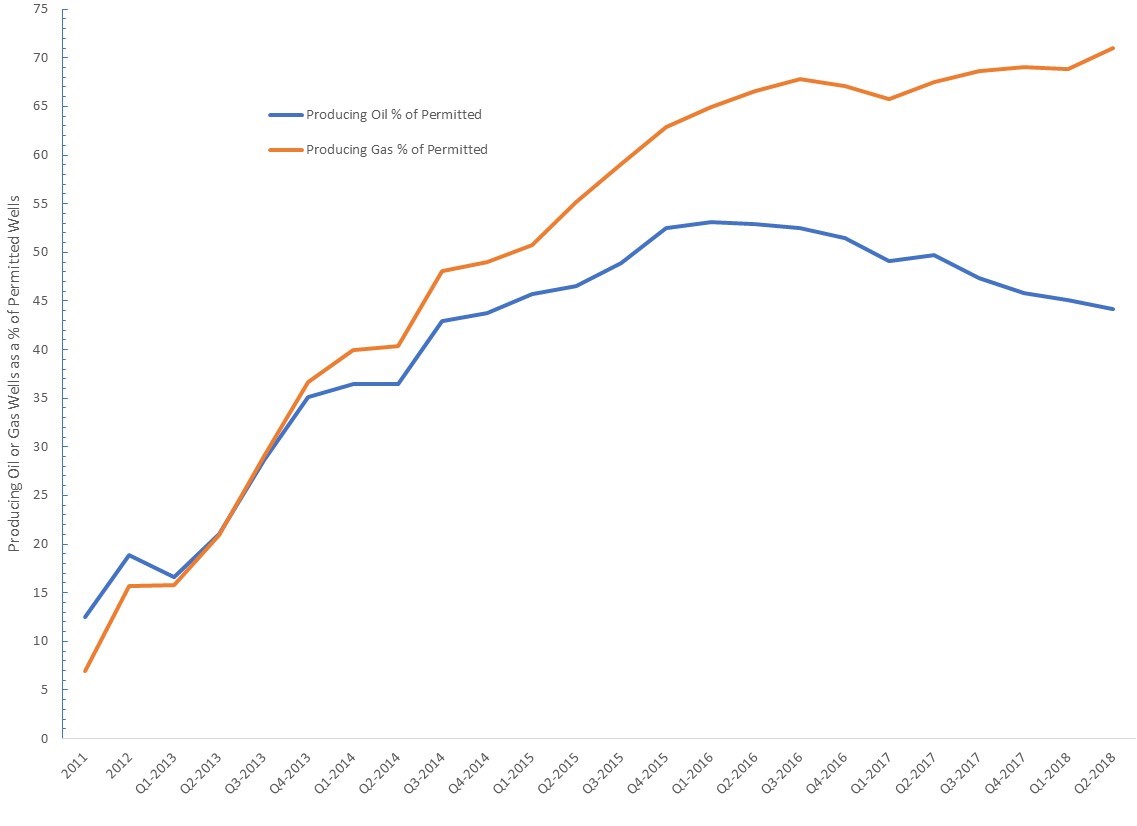
Figure 4. Producing oil and gas wells as a percentage of permitted wells in Ohio’s Utica Shale Basin from 2011 to Q2-2018
The ringing in of 2014 also saw an increase in the number of producing wells as a percentage of those permitted. In 2014, the general philosophy was that the HVHF industry needed to permit roughly 5.5 oil wells or 7 gas wells to generate one producing well. Since 2014, however, this ratio has dropped to 2.2 for oil and 1.4 for gas well permits.
Put another way, the industry’s ability to avoid dry wells has increased by 13% for oil and 18% for gas per year. As of Q2-2018, viable oil wells stood at 44% of permitted wells while viable gas wells amounted to 71% of the permitted inventory (Figure 4).
from the top-left to the bottom-right
To understand how quickly production is declining in Ohio, we compiled annual (2011-2012) and quarterly (Q1-2013 to Q2-2018) production data from 2,064 unconventional laterals.
First, we present average data for the nine oldest wells with respect to oil and gas production on a per day basis (Note: Two of the nine wells we examined, the Geatches MAH 3H and Hosey POR 6H-X laterals, only produced in 2011-2012 when data was collected on an annual basis preventing their incorporation into Figures 6 and 7 belwo). From an oil perspective, these nine wells exhibited 44% declines from year 1 to years 2-3 and 91% declines by 2018 (Figure 5). With respect to natural gas, these nine wells exhibited 34% declines from year 1 to years 2-3 and 79% declines by 2018 (Figure 5).

Figure 5. Average daily oil and gas production decline curves for the above seven hydraulically fractured laterals in Ohio’s Utica Shale Basin, 2011 to Q2-2018
Four of the nine wells demonstrated 71% declines by the second and third years and nearly 98% declines by by Q2-2018 (Figure 6). These declines lend credence to recent headlines like Fracking’s Secret Problem—Oil Wells Aren’t Producing as Much as Forecast in the January 2nd issue of The Wall Street Journal. Four of the nine wells demonstrated 49% declines by the second and third years and nearly 81% declines by Q2-2018 (Figure 7).
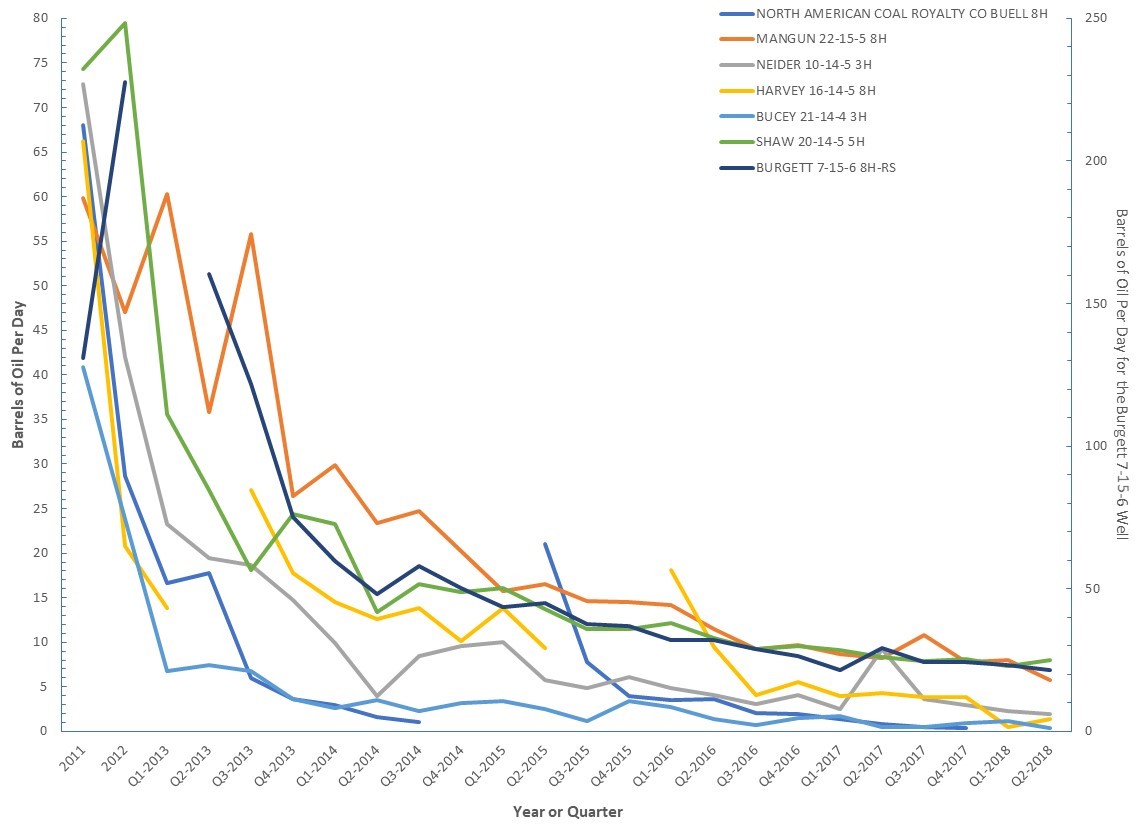
Figure 6. Oil production decline curves for seven hydraulically fractured laterals in Ohio’s Utica Shale Basin from 2011 to Q2-2018
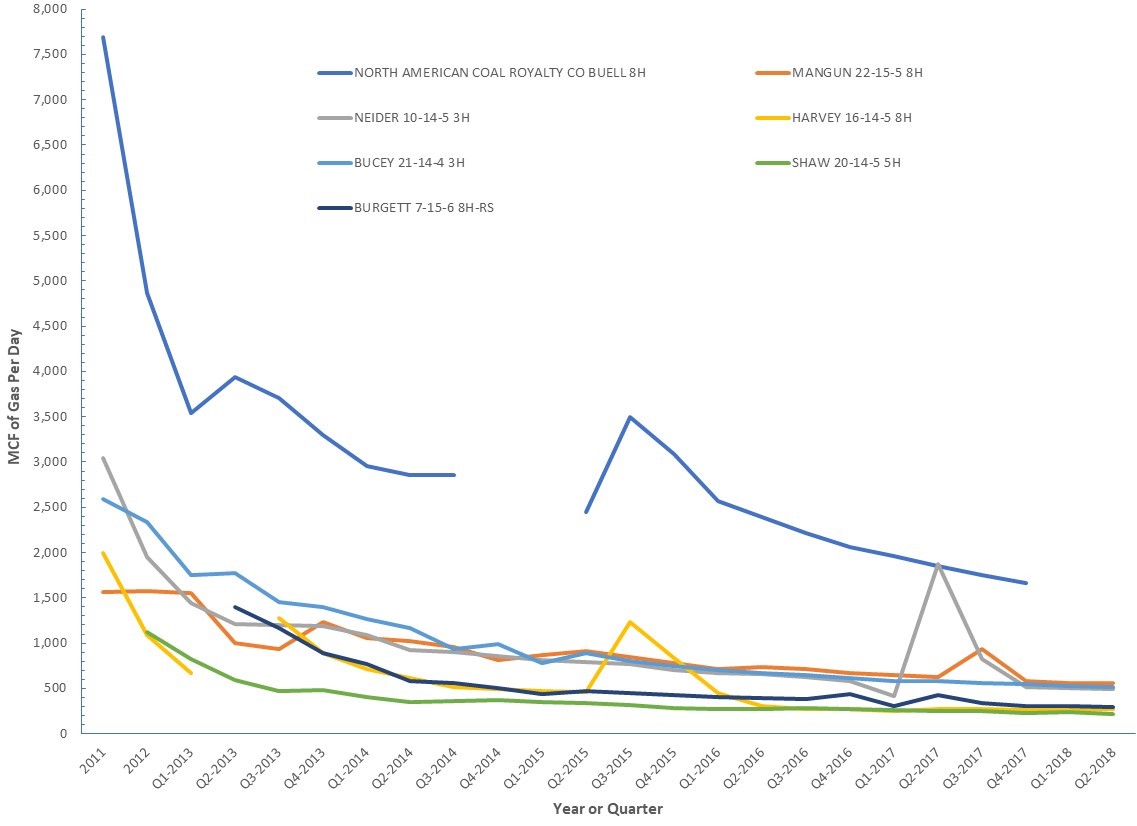
Figure 7. Natural gas production decline curves for seven hydraulically fractured laterals in Ohio’s Utica Shale Basin from 2011 to Q2-2018
from bottom-left to the top-right
An analysis of fracking’s environmental and economic impact is incomplete if it ignores waste production and disposal. In Ohio, there are 226 active Class II Salt Water Disposal (SWD) wells. Why so many?

Figure 8. Ohio’s unconventional gas laterals and Class II salt water disposal injection wells. Weighted by cumulative production and waste disposal volumes to Q3-2018.
We graphed average per well (barrels) and cumulative (million barrels) disposal rates from Q3-2010 to Q3-2018 for these wells. The data shows an average increase of 24,822 barrels (+1.05 million gallons) per well, each year.
That’s a 51% per year increase (Figure 9).
A deeper dive into the data reveals that the top 20 most active Class II wells are accepting more waste than ever before: an astounding annual per well increase of 728,811 barrels (+30.61 million gallons) or a 230% per year increase (Figure 10). This divergence resulted in the top 20 wells disposing of 4.95 times the statewide average between Q3-2010 and Q2-2013. They disposed 13.82 times the statewide average as recently as Q3-2018 (Figure 11).

Cumulative and average well volumes for all 226 of Ohio’s Class II Salt Water Disposal wells from Q3-2010 to Q3-2018
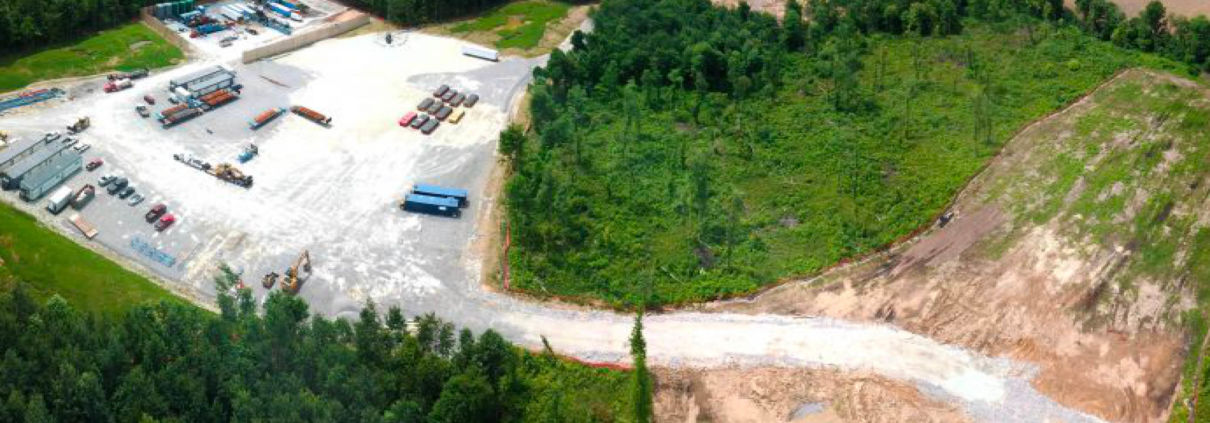
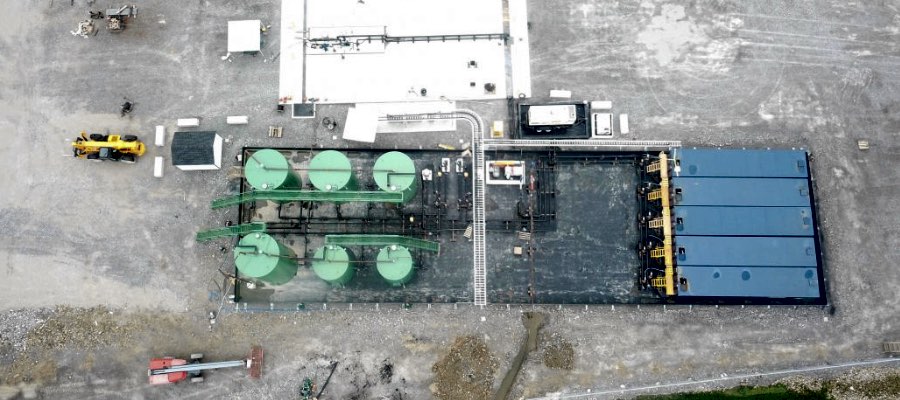
All of this means that we are putting an increasing amount of pressure on fewer and fewer wells. The trickle out, down, and up of this dynamic will foist a myriad of environmental and economic costs to areas surrounding wells. As an example, the images below are injection wells currently under construction in Brookfield, Ohio, outside Warren and minutes from the Pennsylvania border.
More concerning is the fact that areas of Ohio that are injection well hotspots, like Warren, are proposing new fracking-friendly legislation. These disturbing bills would lubricate the wheels for continued expansion of fracking waste disposal and permitting. House bills 578 and 393 and Senate Bill 165 monetize and/or commodify fracking waste by giving townships a share of the revenue. Such bills “…would only incentivize communities to encourage more waste to come into their existing inventory of Class II… wells, creating yet another race to the bottom.” Co-sponsors of the bills include Democratic Reps. Michael O’Brien, Glenn Holms, John Patterson, and Craig Riefel.
The above trends reflect an equally disturbing trend in lateral length. Ohio’s unconventional laterals are growing at a rate of 9.1 to 15.6%, depending on whether you buy that this trend is linear or exponential (Figure 12). This author believes the trend is exponential for the foreseeable future. Furthermore, it’s likely that “super laterals” in excess of 3-3.5 miles will have a profound impact on the trend. (See The Freshwater and Liquid Waste Impact of Unconventional Oil and Gas in Ohio and West Virginia.)
This lateral length increase substantially increases water demand per lateral. It also impacts Class II well disposal rates. The increase accounts for 76% of the former and 88% of the latter when graphed against each other (Figure 13).

Figure 12. Ohio Utica unconventional lateral length from Q3-2010 to Q4-2018
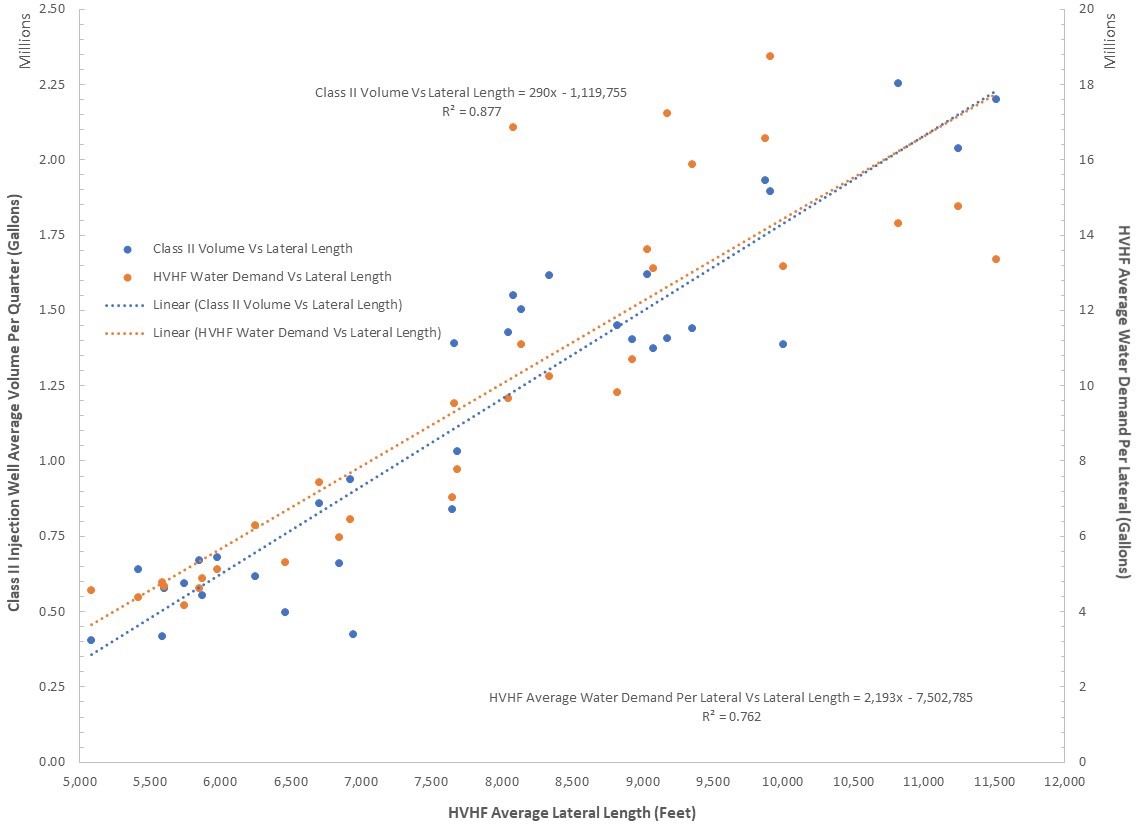
Figure 13. Ohio Utica unconventional water demand and Class II SWD injection well disposal volumes vs lateral length from Q3-2010 to Q4-2018.
This relationship between production, resource demand, and waste disposal rates should disturb policymakers, citizens, and the industry. One way to this problem is to more holistically price resource utilization (or stop oil and gas development entirely).
Unfortunately, states like Ohio are practically giving water away to the industry.
Politicians are constructing legislation that would unleash injection well expansion. This would allow disposal to proceed at rates that don’t address supply-side concerns. It’s startling that an industry and political landscape that puts such a premium on “market forces” is unwilling to address these trends with market mechanisms.
We will continue to monitor these trends and hope to spread these insights to states like Oklahoma and Texas in the future.
By Ted Auch, Great Lakes Program Coordinator, FracTracker Alliance – with invaluable data compilation assistance from Gary Allison
FracTracker is a proponent of data transparency, and so we often share the data we use to construct our maps analyses. Click on the links below to download the data associated with the present analysis:

California has become a battleground for real climate action. The state Governor, Jerry Brown prides himself in his own climate leadership, and California has pushed EU nations and countries worldwide to take climate change seriously. As a final tribute to his own tenure as a term-limited governor, Brown has organized and hosted a Global Climate Action Summit, September 12-14th. The summit convenes an international invitation list of “climate leaders” to, in their words:
“Take Ambition to the Next Level.” It will be a moment to celebrate the extraordinary achievements of states, regions, cities, companies, investors and citizens with respect to climate action. It will also be a launchpad for deeper worldwide commitments and accelerated action from countries—supported by all sectors of society—that can put the globe on track to prevent dangerous climate change and realize the historic Paris Agreement.
Meanwhile, frontline communities, community organizers, and grassroots organizations contest the perspective that real change has been made. While investors and green capitalists celebrate, frontline communities fight daily for clean air and water. In solidarity with and led by frontline communities, activists have protested the summit, in an attempt to hold policy makers accountable to those most affected by the fossil fuel industry.
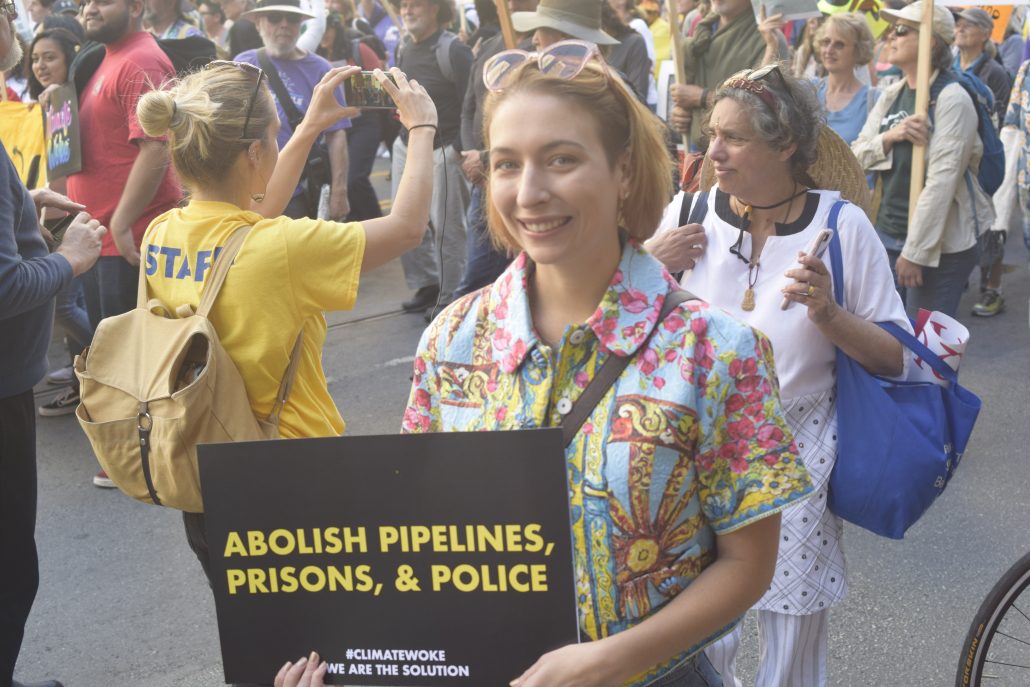
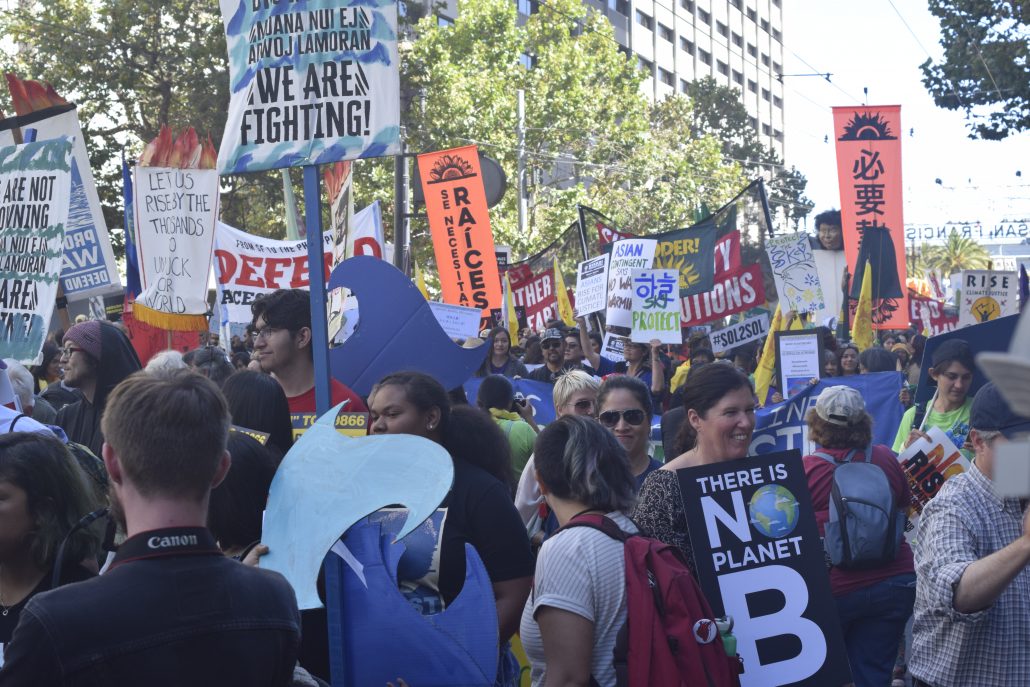
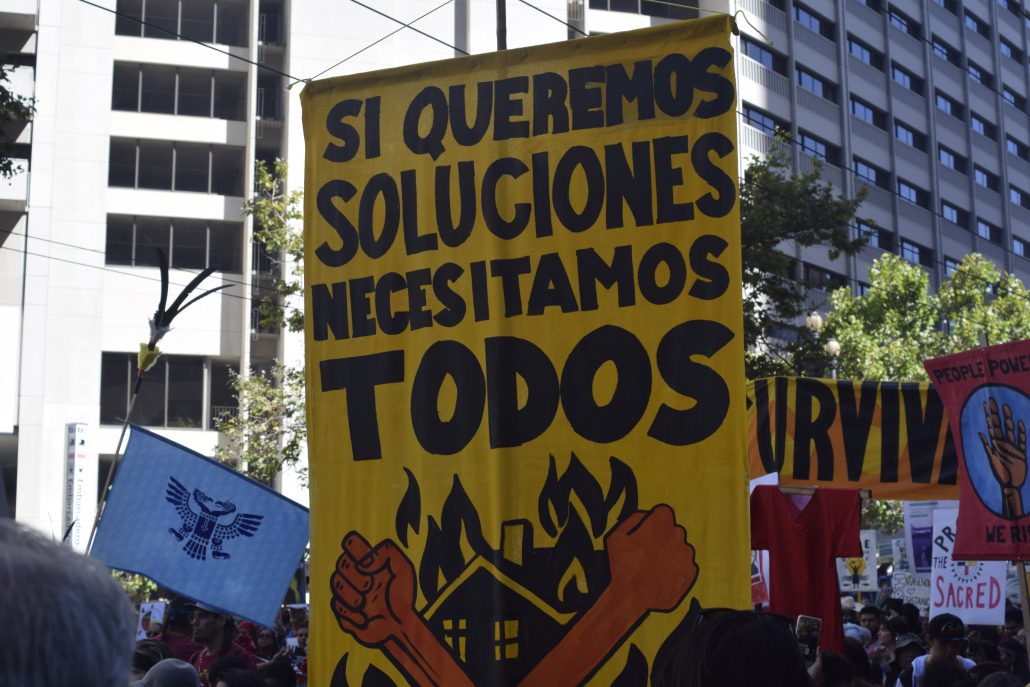
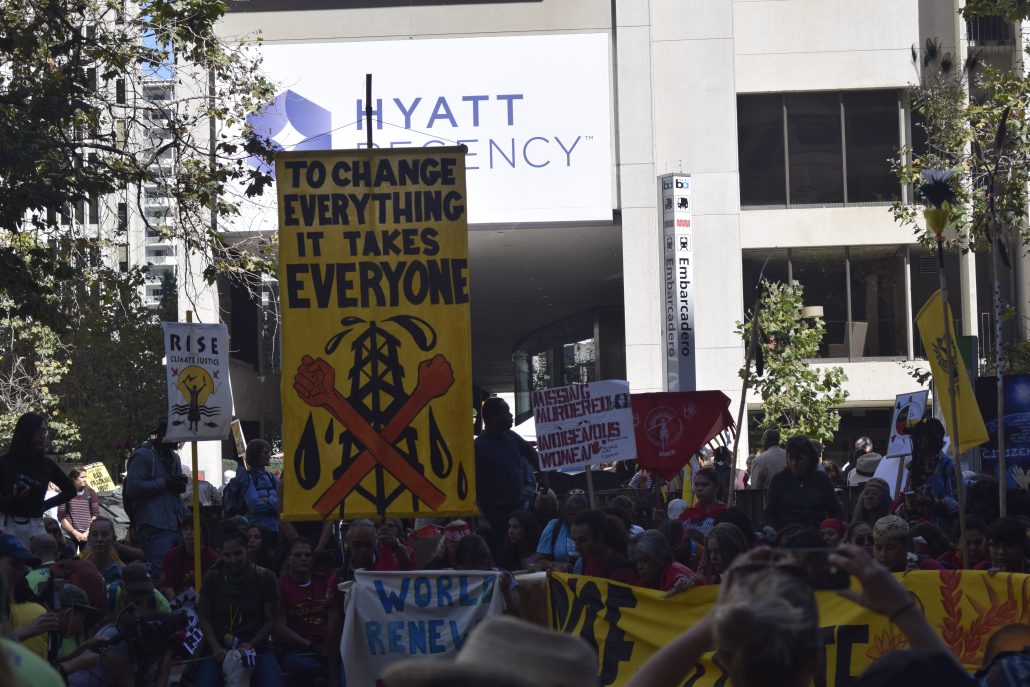
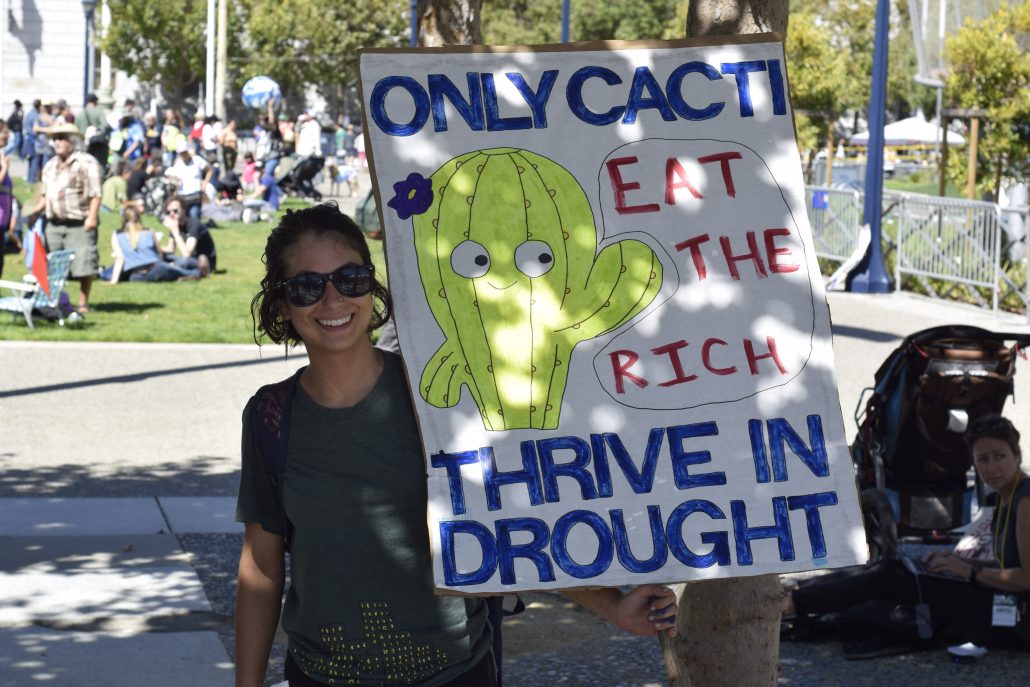
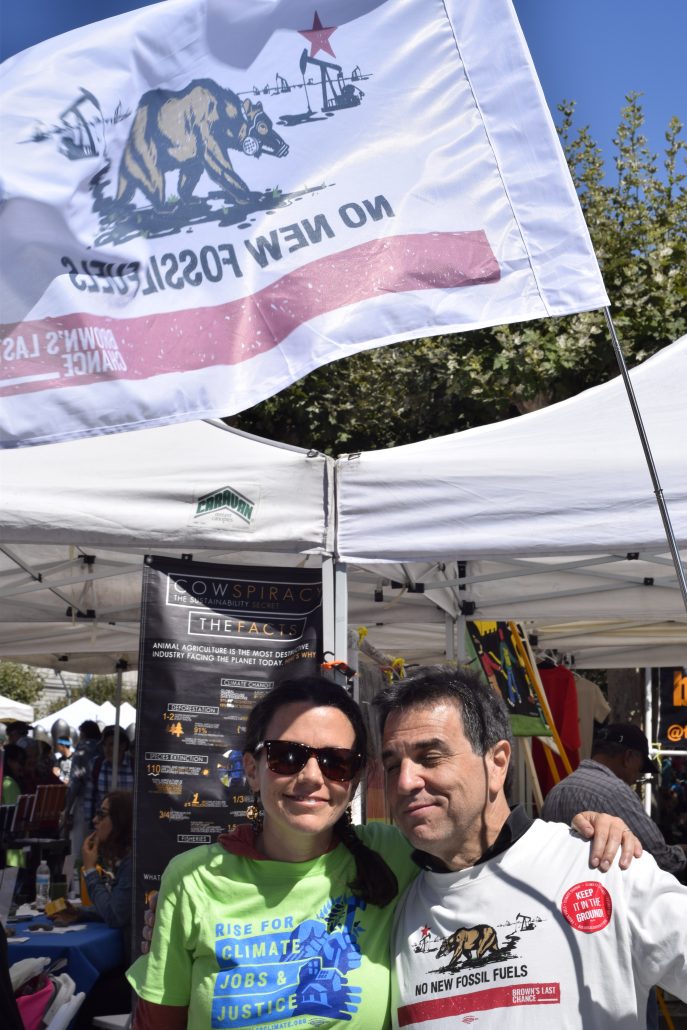
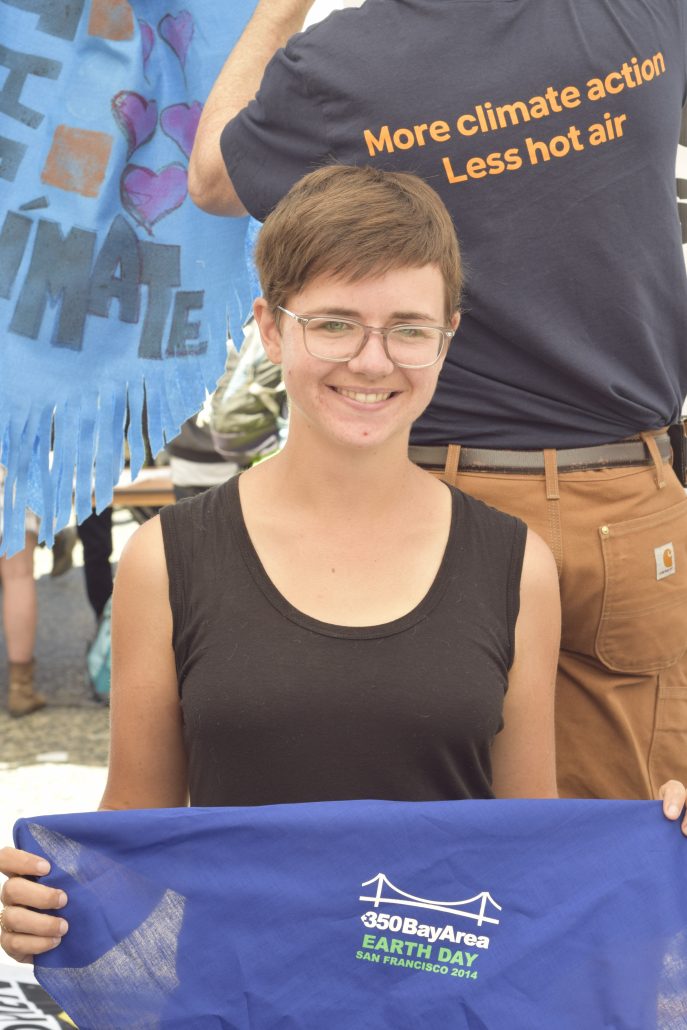
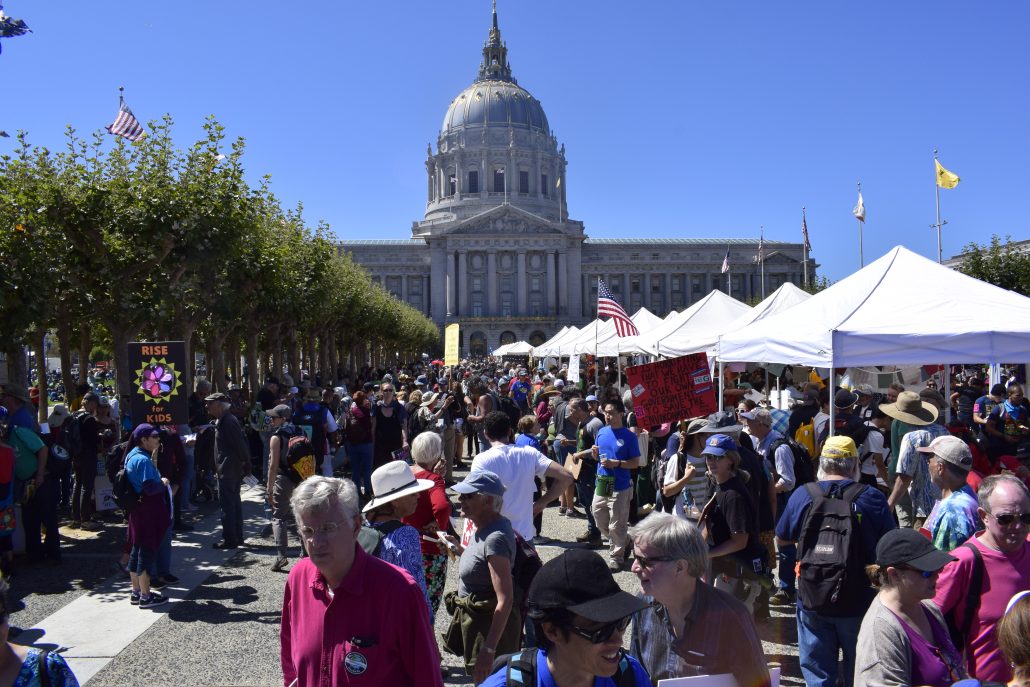
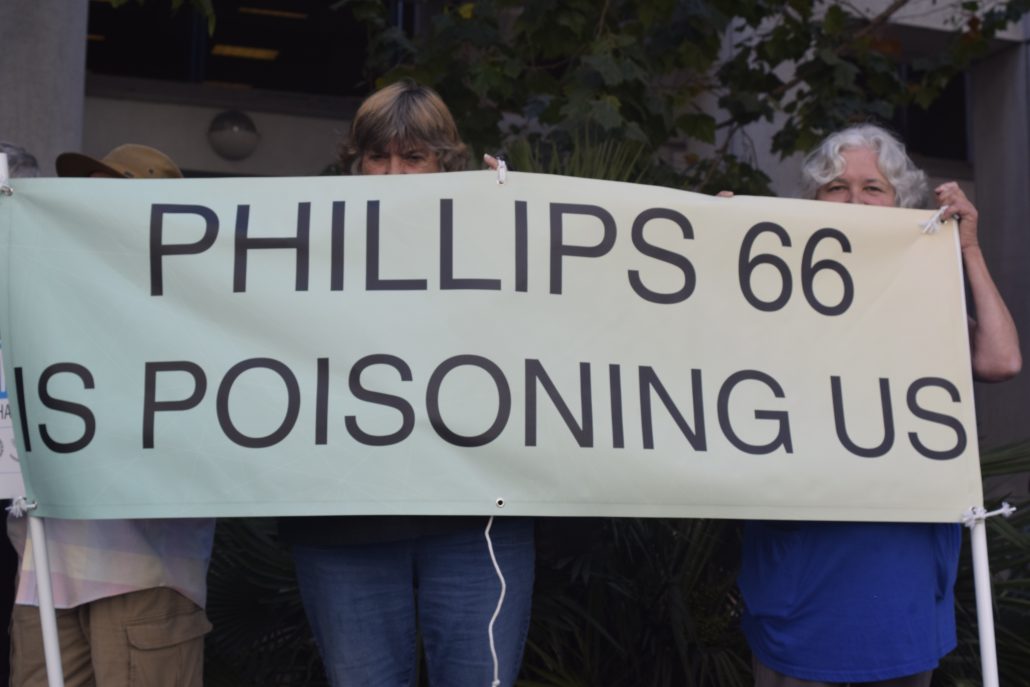
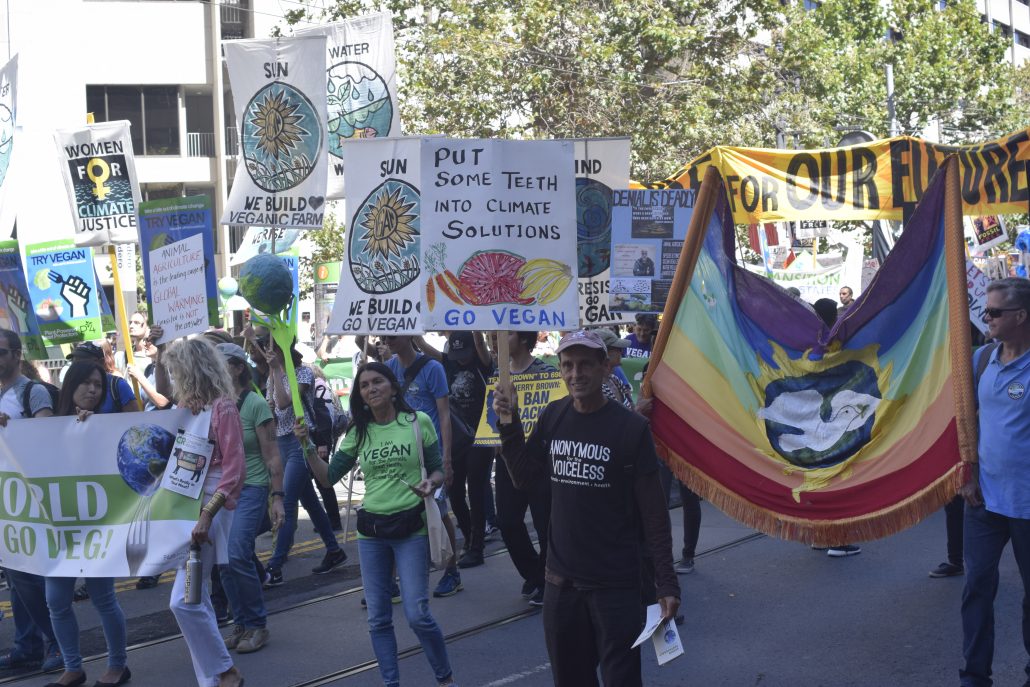
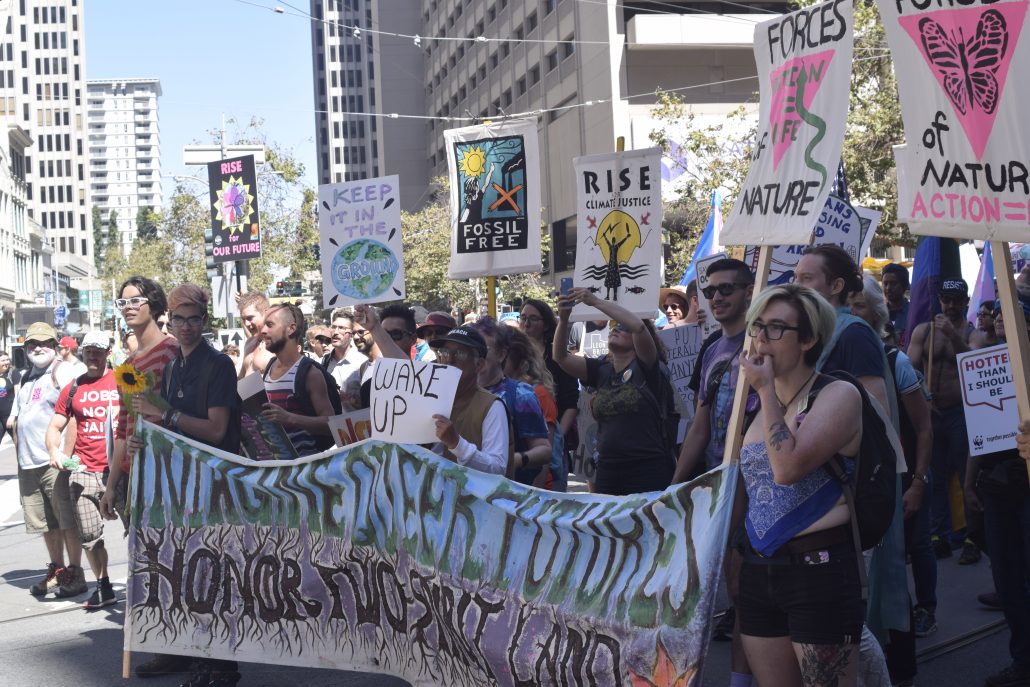
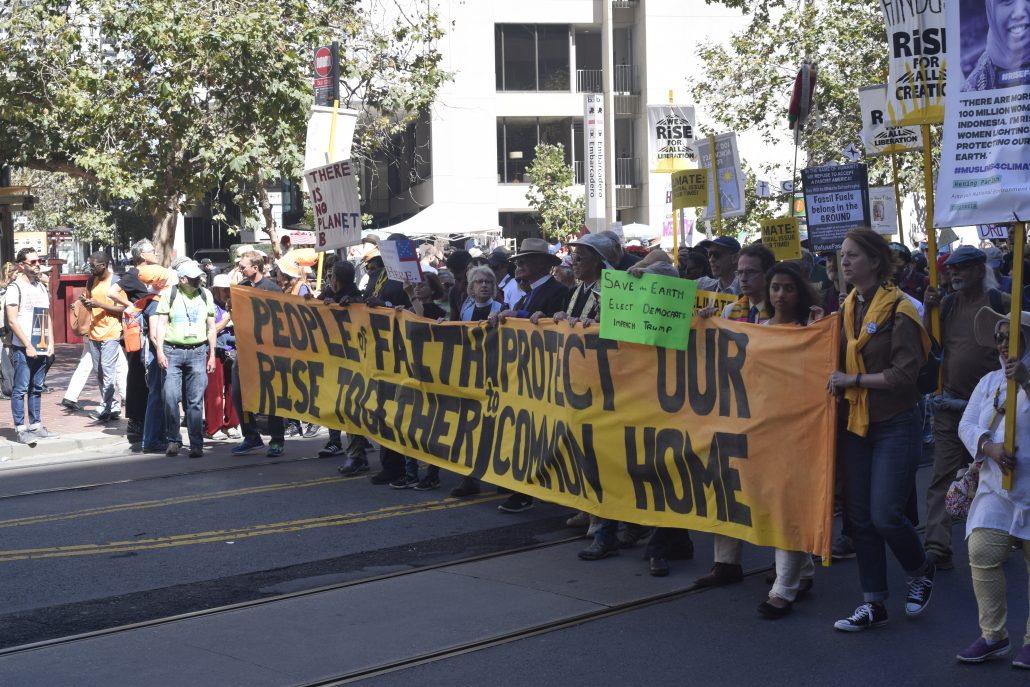
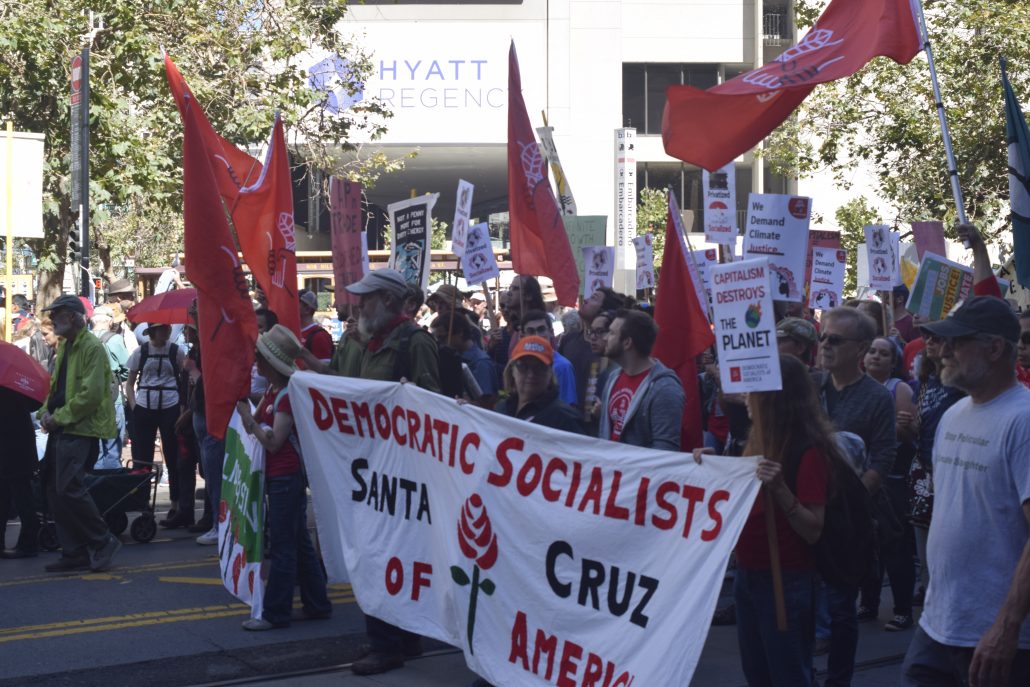
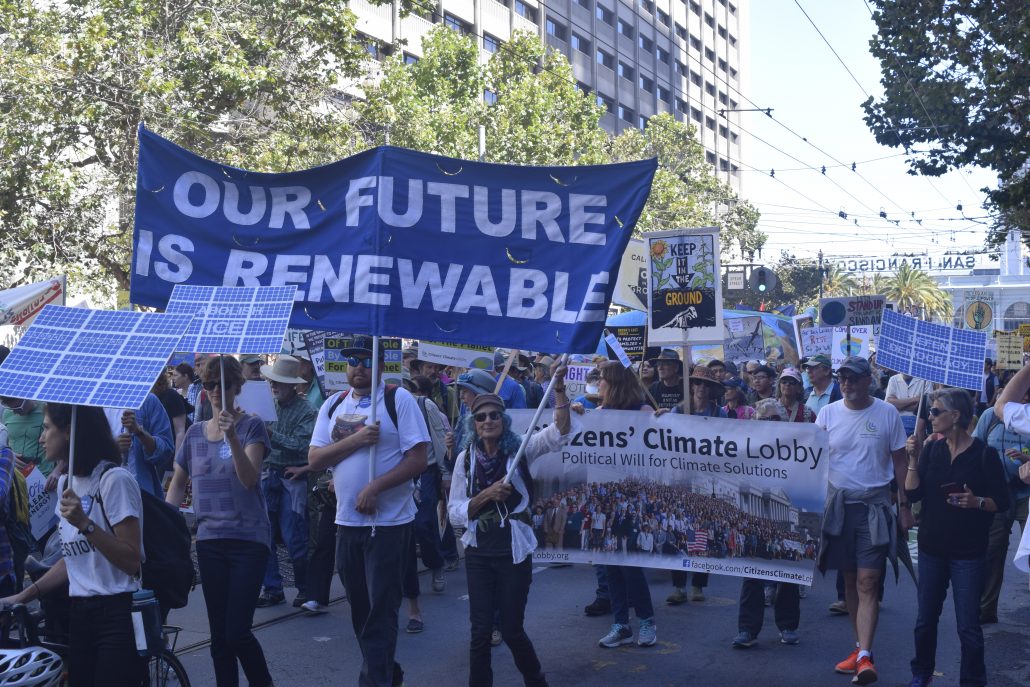
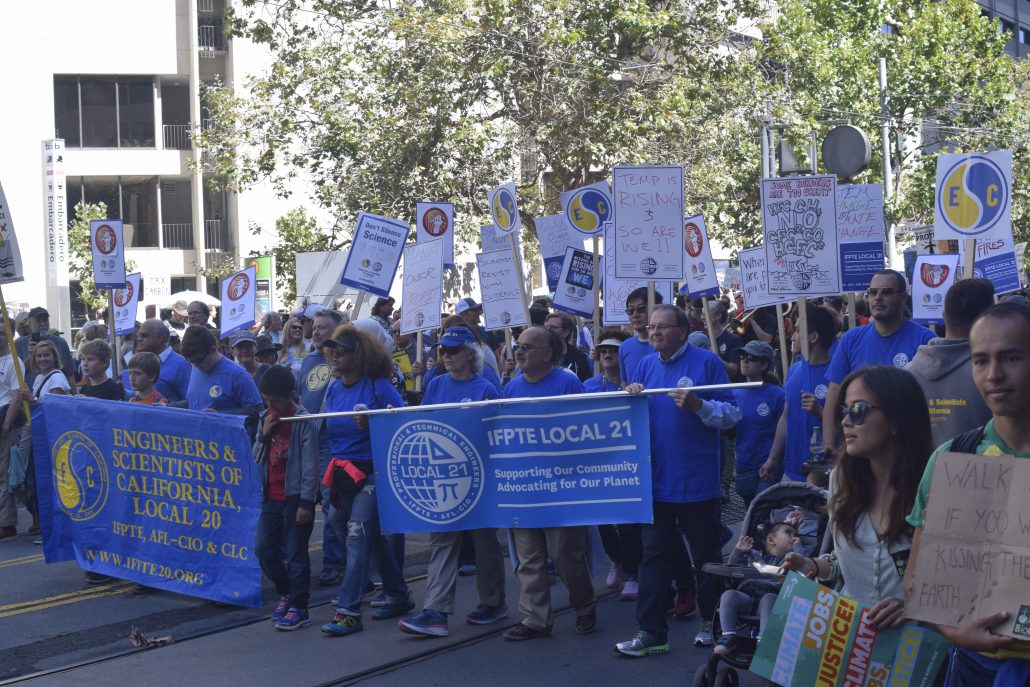
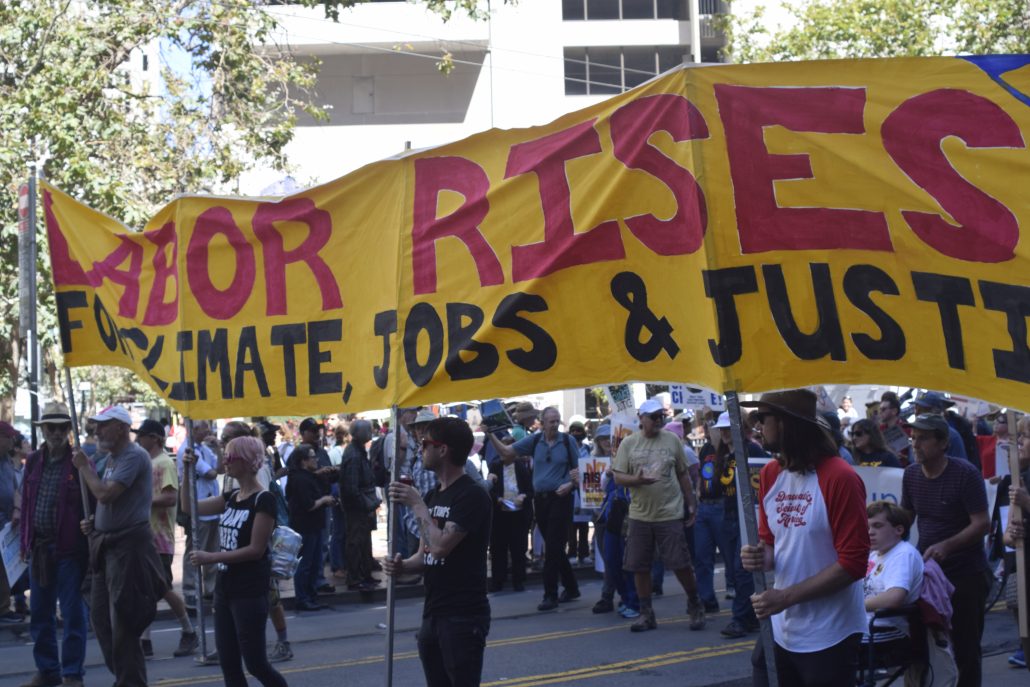
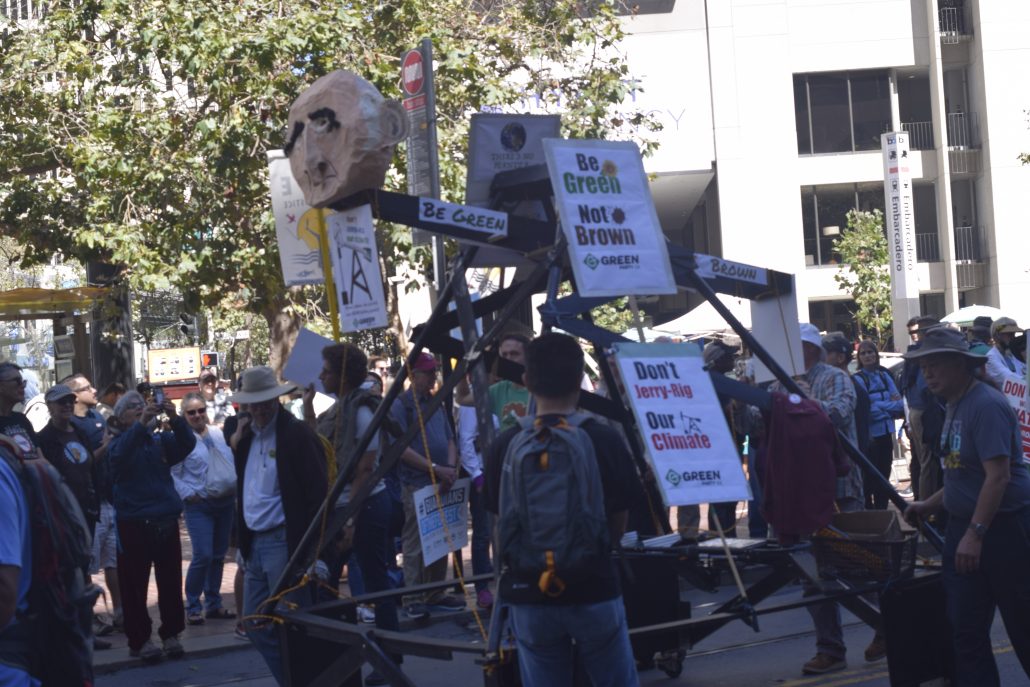
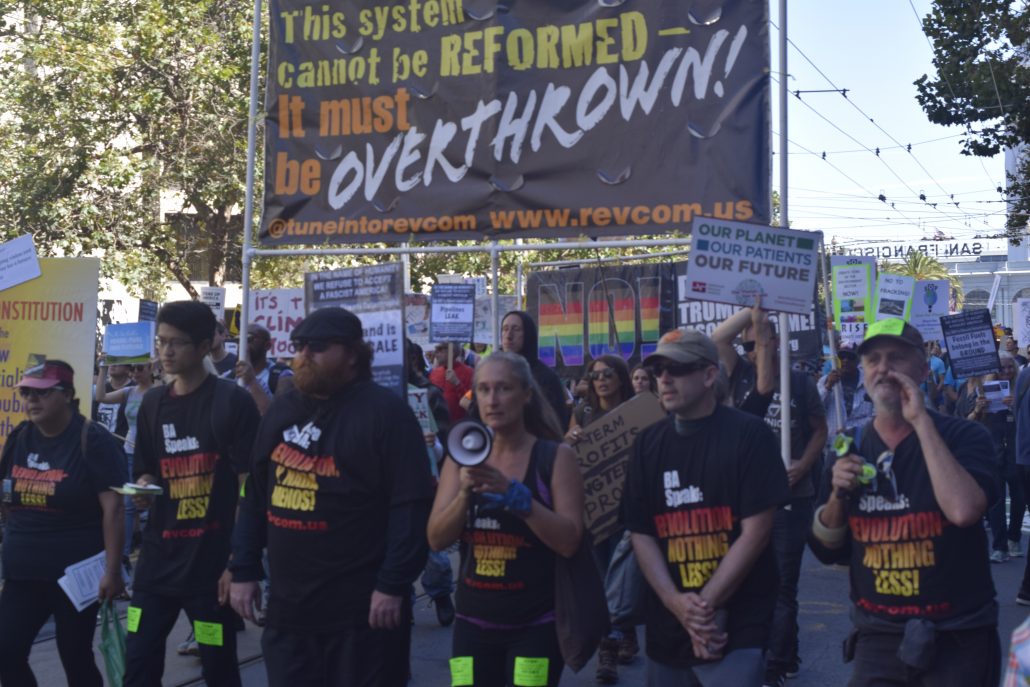
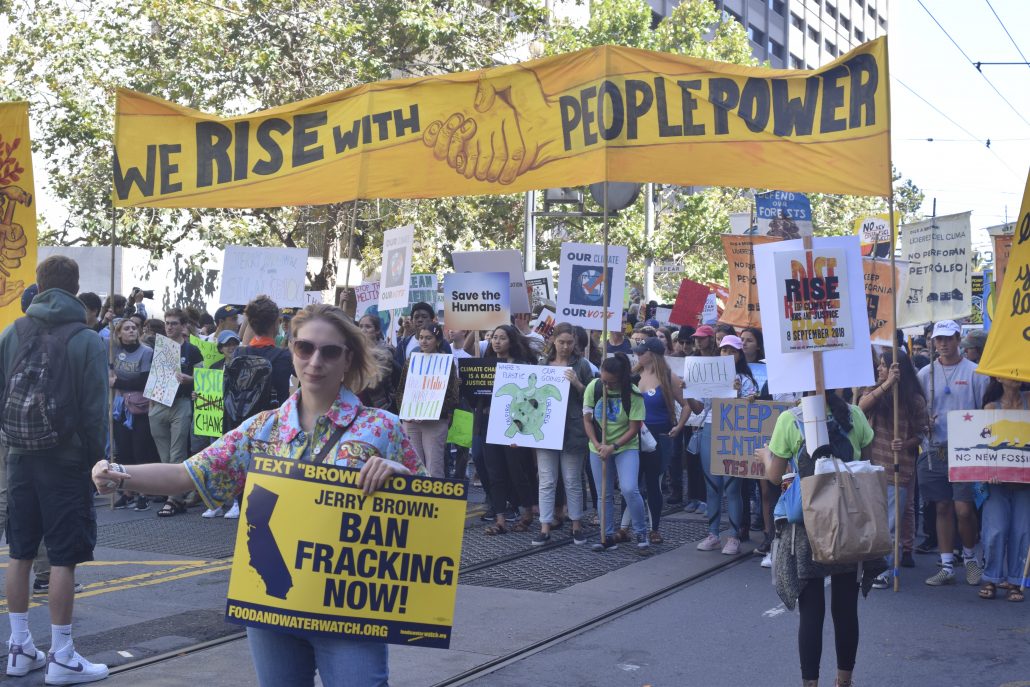
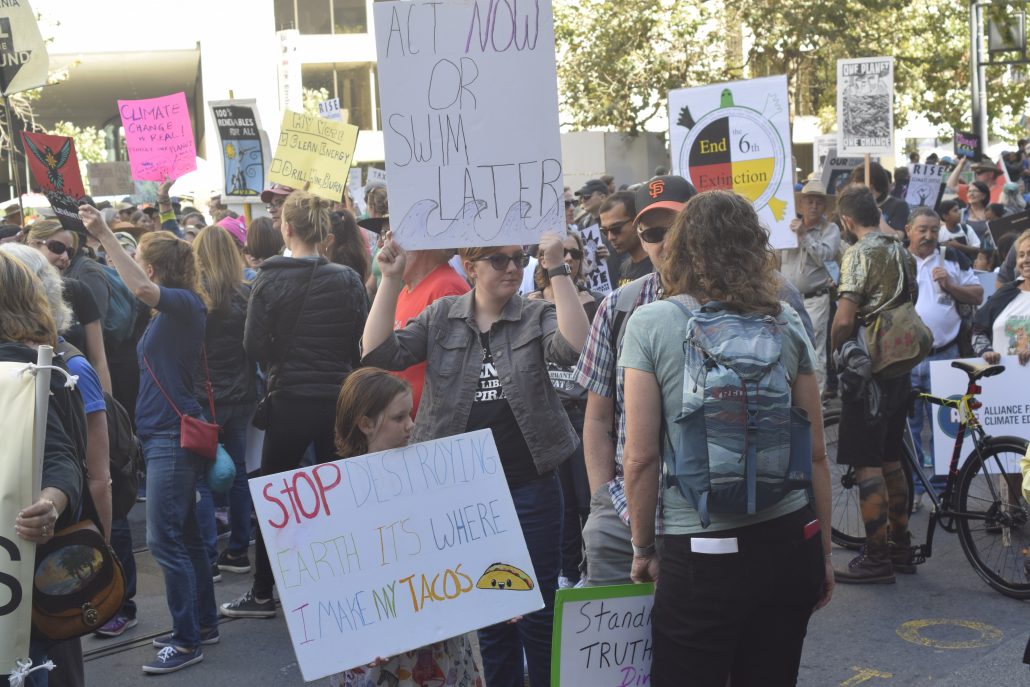
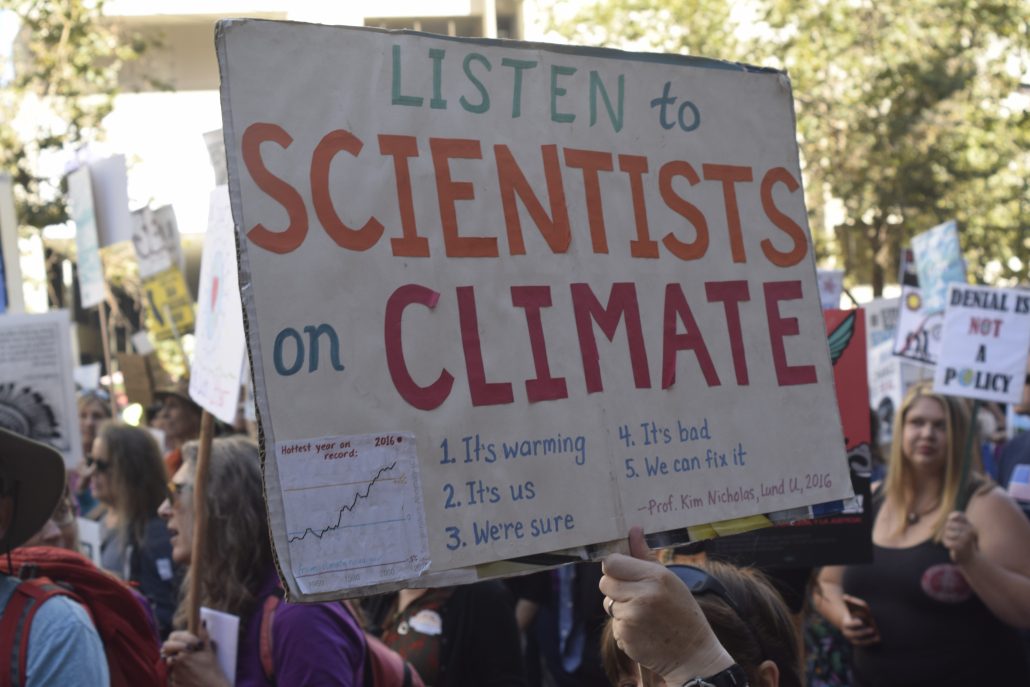
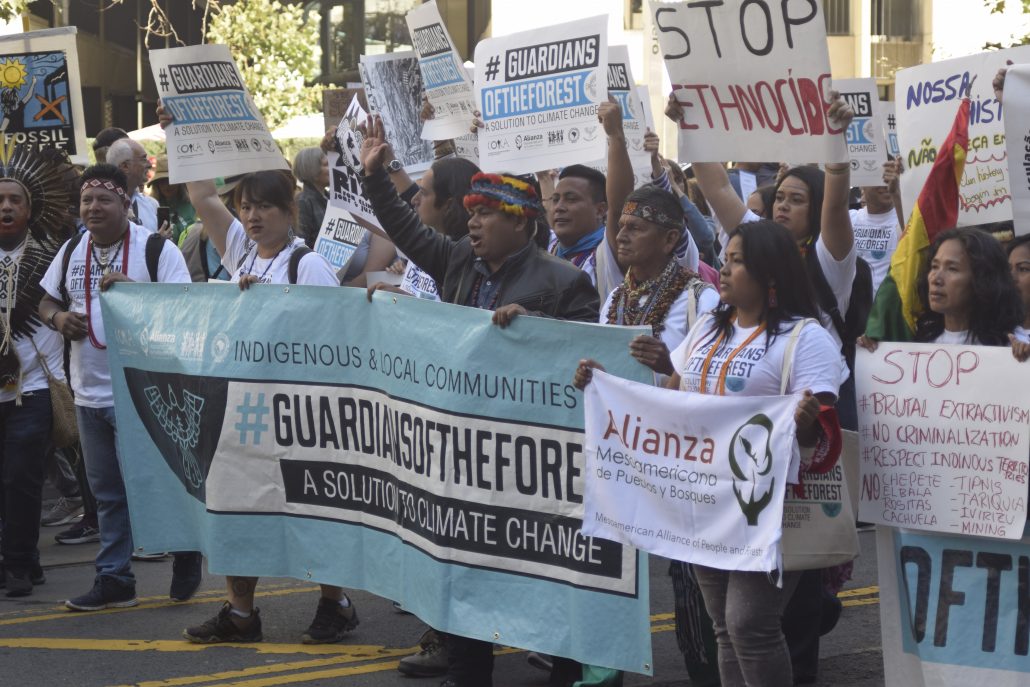
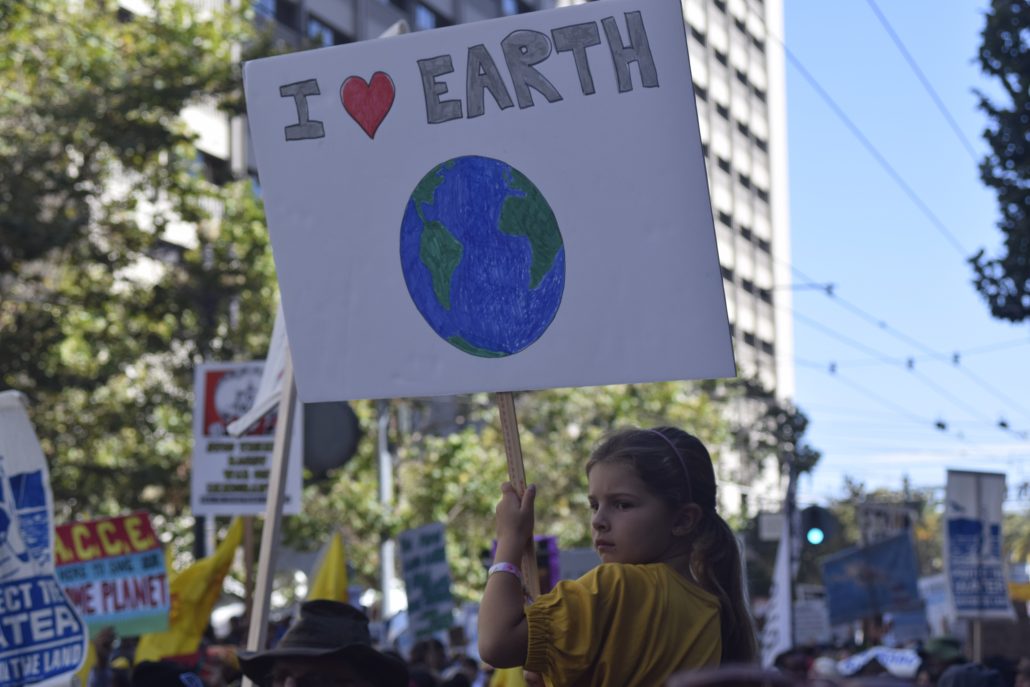
One quarter of a million people worldwide, and well over 30,000 in San Francisco hit the streets during the Rise for Climate last Saturday, September 8th. With over 900 actions taking place simultaneously people worldwide demanded real climate action from their local leaders. FracTracker Alliance staff helped coordinate and participated in events nationwide.
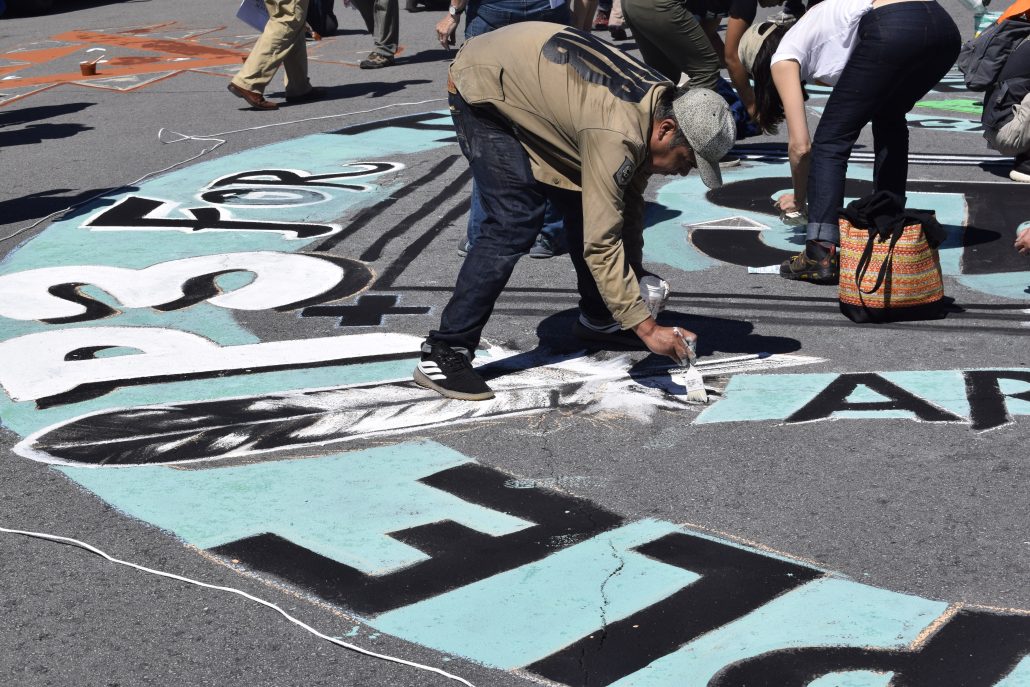
In San Francisco, the march was led by members of the Indigenous community, making up the Indigenous Bloc, on the frontlines of the action. The day officially started with prayers from Indigenous leaders and a moment of silence for Indigenous Peoples that have been most harmed by the effects of climate change. Dozens of various other movements followed the Indigenous Bloc in a parade of support. FracTracker took the opportunity to document this monumental event, and photos from the march are shown below.
March Photos
For California and international “climate leaders” in attendance, Rise kicked off a long week of climate action culminating with the Global Action Climate Summit. The week is full of activities geared towards movement building, including the Solidarity to Solutions Summit (#sol2sol) by It Takes Roots; Women’s Assembly for Climate Justice, hosted by Women’s Earth and Climate Action Network; and mass actions including a march and occupation of the Global Climate Action Summit!
To mark such a momentous movement, the Brown administration signed a new bill into law, SB100. The new law, authored by Kevin De León (D-Los Angeles), pledges that all of California’s electricity will come from clean power sources by 2045. Brown said, “California is committed to doing whatever is necessary to meet the existential threat of climate change.” This is the most ambitious state climate policy in the U.S. The legislation barely passed the state Legislature after nearly two years of debate, with opponents arguing that it would lead to higher electric bills for all Californians.
In opposition to the feel-good, pat-yourself-on-the-back feelings from delegates at the summit, frontline communities and activists respond that the SB100 legislation does nothing to stop harms to frontline communities caused by extraction and the supply side of the fossil fuel economy. The Against Climate Capitalism campaign is a coalition of Diablo Rising Tide teamed up with Idle No More SF Bay, the Ruckus Society, It Takes Roots, Indigenous Environmental Network and the Brown’s Last Chance. Members of the coalition have been outspoken proponents organizing in support of real climate leadership. The coalition is pushing for Governor Jerry Brown and the California legislature to end the extraction of new fossil fuels in California. The green groups making up these larger coalition networks encompass a broad range research and advocacy groups, from international groups like Greenpeace to local grassroots movements from Los Angeles and California’s Central Valley. FracTracker Alliance is also a campaign member.
The goal of the campaign is to keep fossil fuels in the ground, and supports a just transition from a fossil fuel economy to clean energy sources. A petition to pressure California Governor Jerry Brown to end fossil fuel extraction can be found on their website. The California legislature and the Brown administration has consistently failed to address the impacts of extraction in its own backyard. While frontline communities are suffering, the Brown administration continues to take the easy way out with future legislation such as SB100, which does nothing to address the environmental justice spector of actual oil drilling and production. In response to SB100, the campaign has issued response:
With these poignant criticisms, it begs the question; how can Governor Jerry Brown continue to ignore the actual cause of climate change? Brown has passed legislation ensuring that everyday Californians will bear the costs for clean energy utilities, but has done nothing to hold accountable the actual culprits responsible for climate change, the oil and gas corporations extracting the 5.7 million barrels of oil per year from California soil.
By Kyle Ferrar, Western Program Coordinator
Cover photo: Brown’s Las Change Billboard. Photo by Liz Hafalia, The Chronicle
![]()
216 Franklin St, Suite 400, Johnstown, PA 15901
Phone: +1 (717) 303-0403 | info@fractracker.org
FracTracker Alliance is a 501(c)3 non-profit: Tax identification number: 80-0844297
 Ted Auch
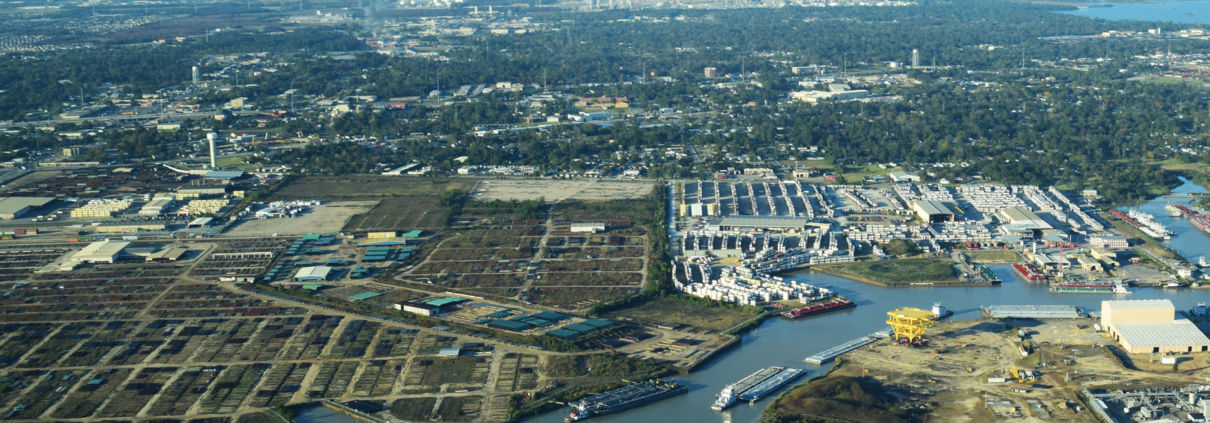 Photo by Ted Auch, FracTracker Alliance, with aerial support by LightHawk
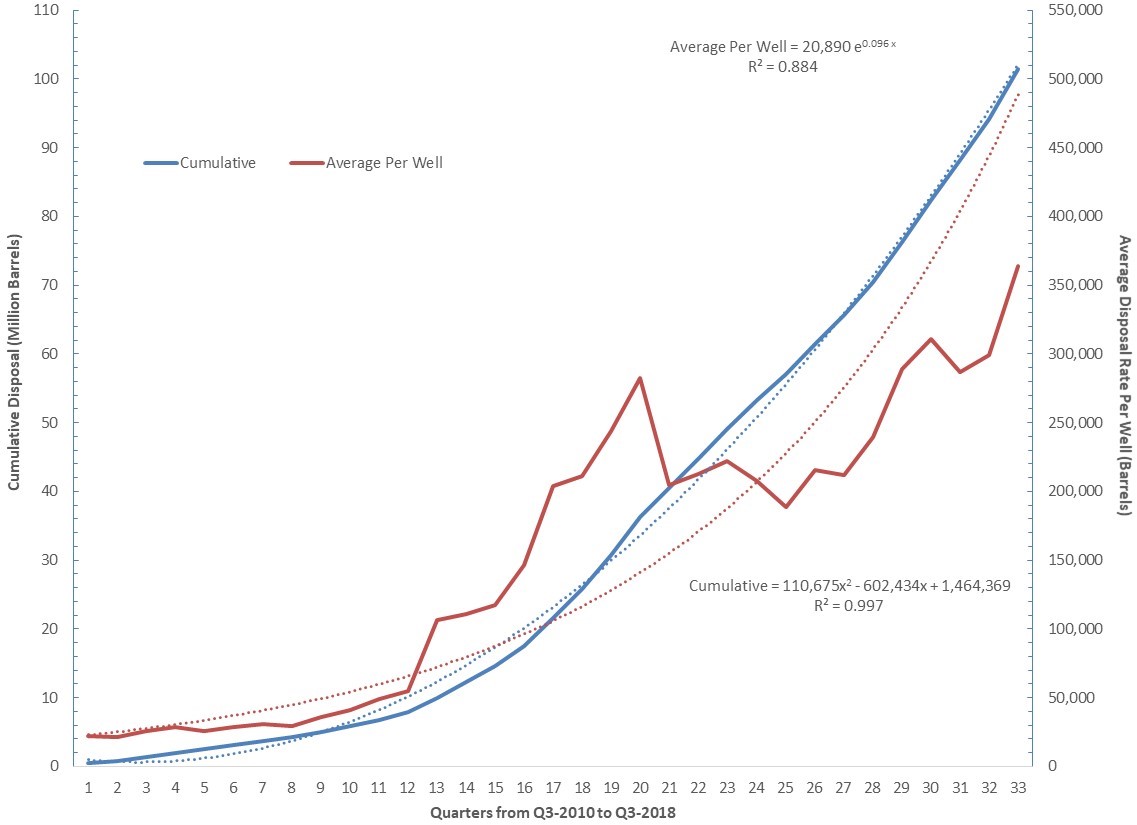


 Injection Well under construction, Brookfield, Ohio")
 Injection Well construction entrance, Brookfield, Ohio")
 Injection Well under construction, Brookfield, Ohio")


 Injection Well under construction, Brookfield, Ohio")
 Injection Well under construction, Brookfield, Ohio")