Talking about fracking all day, every day, can be a bit of a downer. Here at FracTracker, we find hope in the advances of clean energy across the country and around the world. This time around, let’s see how Missouri’s clean energy sector is fairing. Long story short – while it seems their clean energy is a bit behind in the game, at least they are trying.
In collaboration with our partners at Environmental Entrepreneurs (E2), FracTracker Alliance produced a series of maps investigating current clean energy businesses and sites where renewable energy is and can be generated. They aim to describe Missouri’s clean energy economy – and how much room it has to grow. Here is a sneak peak at some of these maps, below:
Map 1, above, shows clean renewable energy generation in Missouri. Solar and wind are the most dominant forms of renewable energy in Missouri. Missouri’s clean energy generating capacity is highest in the northwest corner of the state, where several large wind-energy projects are located. The state has 6 wind farms in this region including the newly-announced 100 MW Hawthorne Wind Farm and 49 MW High Prairie Wind Farm. In total, Missouri produces 1,000 MW of wind energy from about 500 turbines. Solar power is more dominant across the rest of the state, especially with schools’ solar energy generation around Kansas City and St. Louis and solar farms throughout the rest of the state, including Pulaski, Macon, and Bates counties. All in all, about 702 megawatts of wind and solar capacity are installed currently, with another 458 megawatts currently proposed to be built.
However, much more potential remains to be tapped as shown in Map 2, above. This holds true across solar, wind, and other renewable energy sources – particularly in the southwest corner of the state, where solar energy potential is the highest.
Missouri has up to 275,000 MW of wind potential energy, and these maps of energy potential show that overall, approximately 75% of the state has above-average potential for solar power. This is an important statistic since coal fueled 81% of Missouri’s electricity in 2017; only two other states burned more in 2017. Also, the new addition of bidirectional natural gas flow to the Rockies Express Pipeline means stiffer competition for renewables from the natural gas market.
It looks like the transition to clean energy in Missouri is happening, but there is always work to be done (nerdy “energy” joke). According to the E2 Missouri Clean Jobs Report, there is a lot of room for the clean energy sector to develop.
The potential does exist for the sector to drive economic growth in the state by being a major contributor to job growth. According the Environmental Entrepreneur’s Midwest Advocate Micaela Preskill, the industry in Missouri is slated to grow another 4.5% through 2019. Recent hires in the sector show that the workforce is very ethnically diverse, with the percentage of minority new hires doubling the average state demographics. Also 14% of new hires are veterans. Map 3, above, displays over 400 businesses, including energy efficiency contractors and renewable energy installers, which cover all 34 state senate districts. Surveys indicate that 80 percent of businesses working in clean energy in Missouri employ fewer than 25 individuals, illustrating the importance of small businesses in the clean-energy sector.
With the new state policies that support the transition from fossil fuels and the growing clean energy economy, Missouri is on a path to becoming more sustainably focused. This is particularly important because of the state’s past and present reliance on coal, and the availability of natural gas. More investment of state and federal resources in the clean energy sector could provide the boost that benefits state’s health, environment and economy through new jobs and manufacturing.
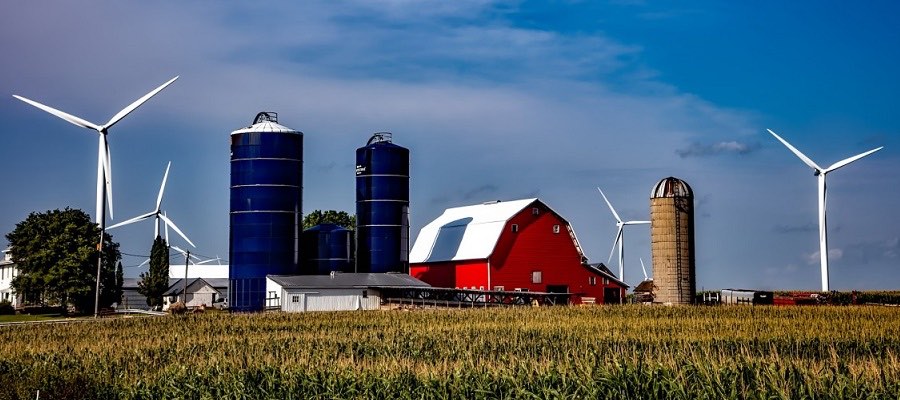
Behind in the Game Feature Image: Wind and farm. Creative Commons license.
https://fractracker.org/wp-content/uploads/2018/08/FarmWind-Feature.jpg400900Kyle Ferrar, MPHhttps://fractracker.org/wp-content/uploads/2025/09/2025-Wordmark-Logo.pngKyle Ferrar, MPH2018-08-22 11:30:442021-04-15 14:57:40Missouri’s clean energy is behind in the game, but at least they’re trying
By Guest Author: Austin Sachs, Director and founder of Protect and Divest
In most major social movements where there is an imbalance power, divestment has been a necessary part for progress, whether in South Africa or now in the environmental movement against fossil fuels. Yet, too often in the environmental movement, divestment is only pursued when all other options have run their course and failed. If we want a climate neutral society for generations to come, we must pursue divestment alongside all other actions – and alongside this divestment, a reinvestment into a society we want to see.
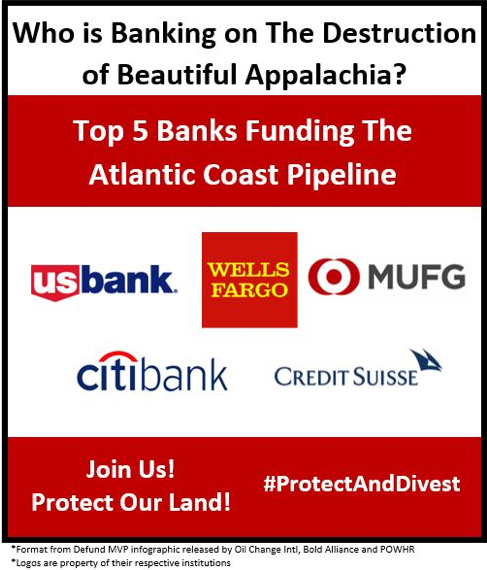
So where does this all start? Divestment begins with each of us looking into our financial accounts and seeing who we are funding with them. And that is exactly what Protect and Divest did last year. We researched the funding of the Atlantic Coast, Mountain Valley, Sabal Trail and Atlantic Sunrise pipelines to know where our money was going.
Along the entire East Coast, the TransCo Pipeline connects all these pipelines, but this infrastructure is also all connected by the same banks who are funding each and every single pipeline project. These banks range from the US banks of Wells Fargo, JP Morgan Chase, US Bank, CitiBank, and Bank of America to the International banks of the Royal Bank of Canada (RBC), Scotiabank and the Bank of Tokyo Mitsubishi UFJ. What we truly found is that no one bank is guilty alone – The entire financial industry is banking on the destruction of our beautiful home!
So where do we go if the banking industry is against a sustainable future? Well, luckily the entire industry is not against sustainability, and some heavily promote it. One of these options is Amalgamated Bank, who has promised to never invest depositor’s money into fossil fuels. Across this nation are countless credit unions doing the same for their members, who see money as a necessary tool of sustainability.
Protect and Divest has now launched our Divest the Commonwealth campaign to take our pledge one step further and move Virginia’s government funds out of fossil fuels, as well. Over $330 million dollars of the Virginia Retirement System is invested in fossil fuels. And of the stock of Duke Energy, one of the main builders of the Atlantic Coast Pipeline, 10 state pensions plans hold over $785 million in it. If the banks are guilty, so are our government pensions and funds. And it’s not like there are no sustainable options. Blackrock, the FTSE Group, and the National Resources Defense Council (NRDC) have come together to develop the FTSE ex-Fossil Fuels Index Series, a fossil fuel free index fund.
Divest the Commonwealth is working to build grassroots effort to move this money. We have started and are supporting city council resolutions from Harrisonburg, VA to Arlington, VA to Richmond, VA and are adding more weekly. Together, the cities and counties of Virginia will begin to bring about the future we want to see. Together, we will create a future we can be proud of.
Join us today and divest today! Every dollar, signature, and voice counts in making sure our money is where our mouth is. This is the way we create a world we want to live and one that we can tell our children about!
Austin Sachs is the director and founder of Protect and Divest, created to build a market solution to climate change. Brought to the environmental movement by the Standing Rock crisis, Austin has worked endlessly to create a world we can all be proud within the economic and political models existing today!
https://fractracker.org/wp-content/uploads/2018/05/Divest-Cover.jpg400900Guest Authorhttps://fractracker.org/wp-content/uploads/2025/09/2025-Wordmark-Logo.pngGuest Author2018-05-29 10:00:542021-04-15 15:01:18Divestment – A Necessary Step Towards a Climate Neutral Society
Over 50% of land in the United States is dedicated to agriculture. Oil and gas development, particularly hydraulic fracturing or “fracking,” is taking place near many of these farms.
Farms feed us, and unfortunately they are not protected from the impacts of fracking. Even if drilling can be done responsibly, accidents happen. In Colorado, for example, two spills occur on average per day, 15% of which result in water contamination. [1] Risking our food supply is not only a risk to our health – it’s a risk to national security.
Food Independence
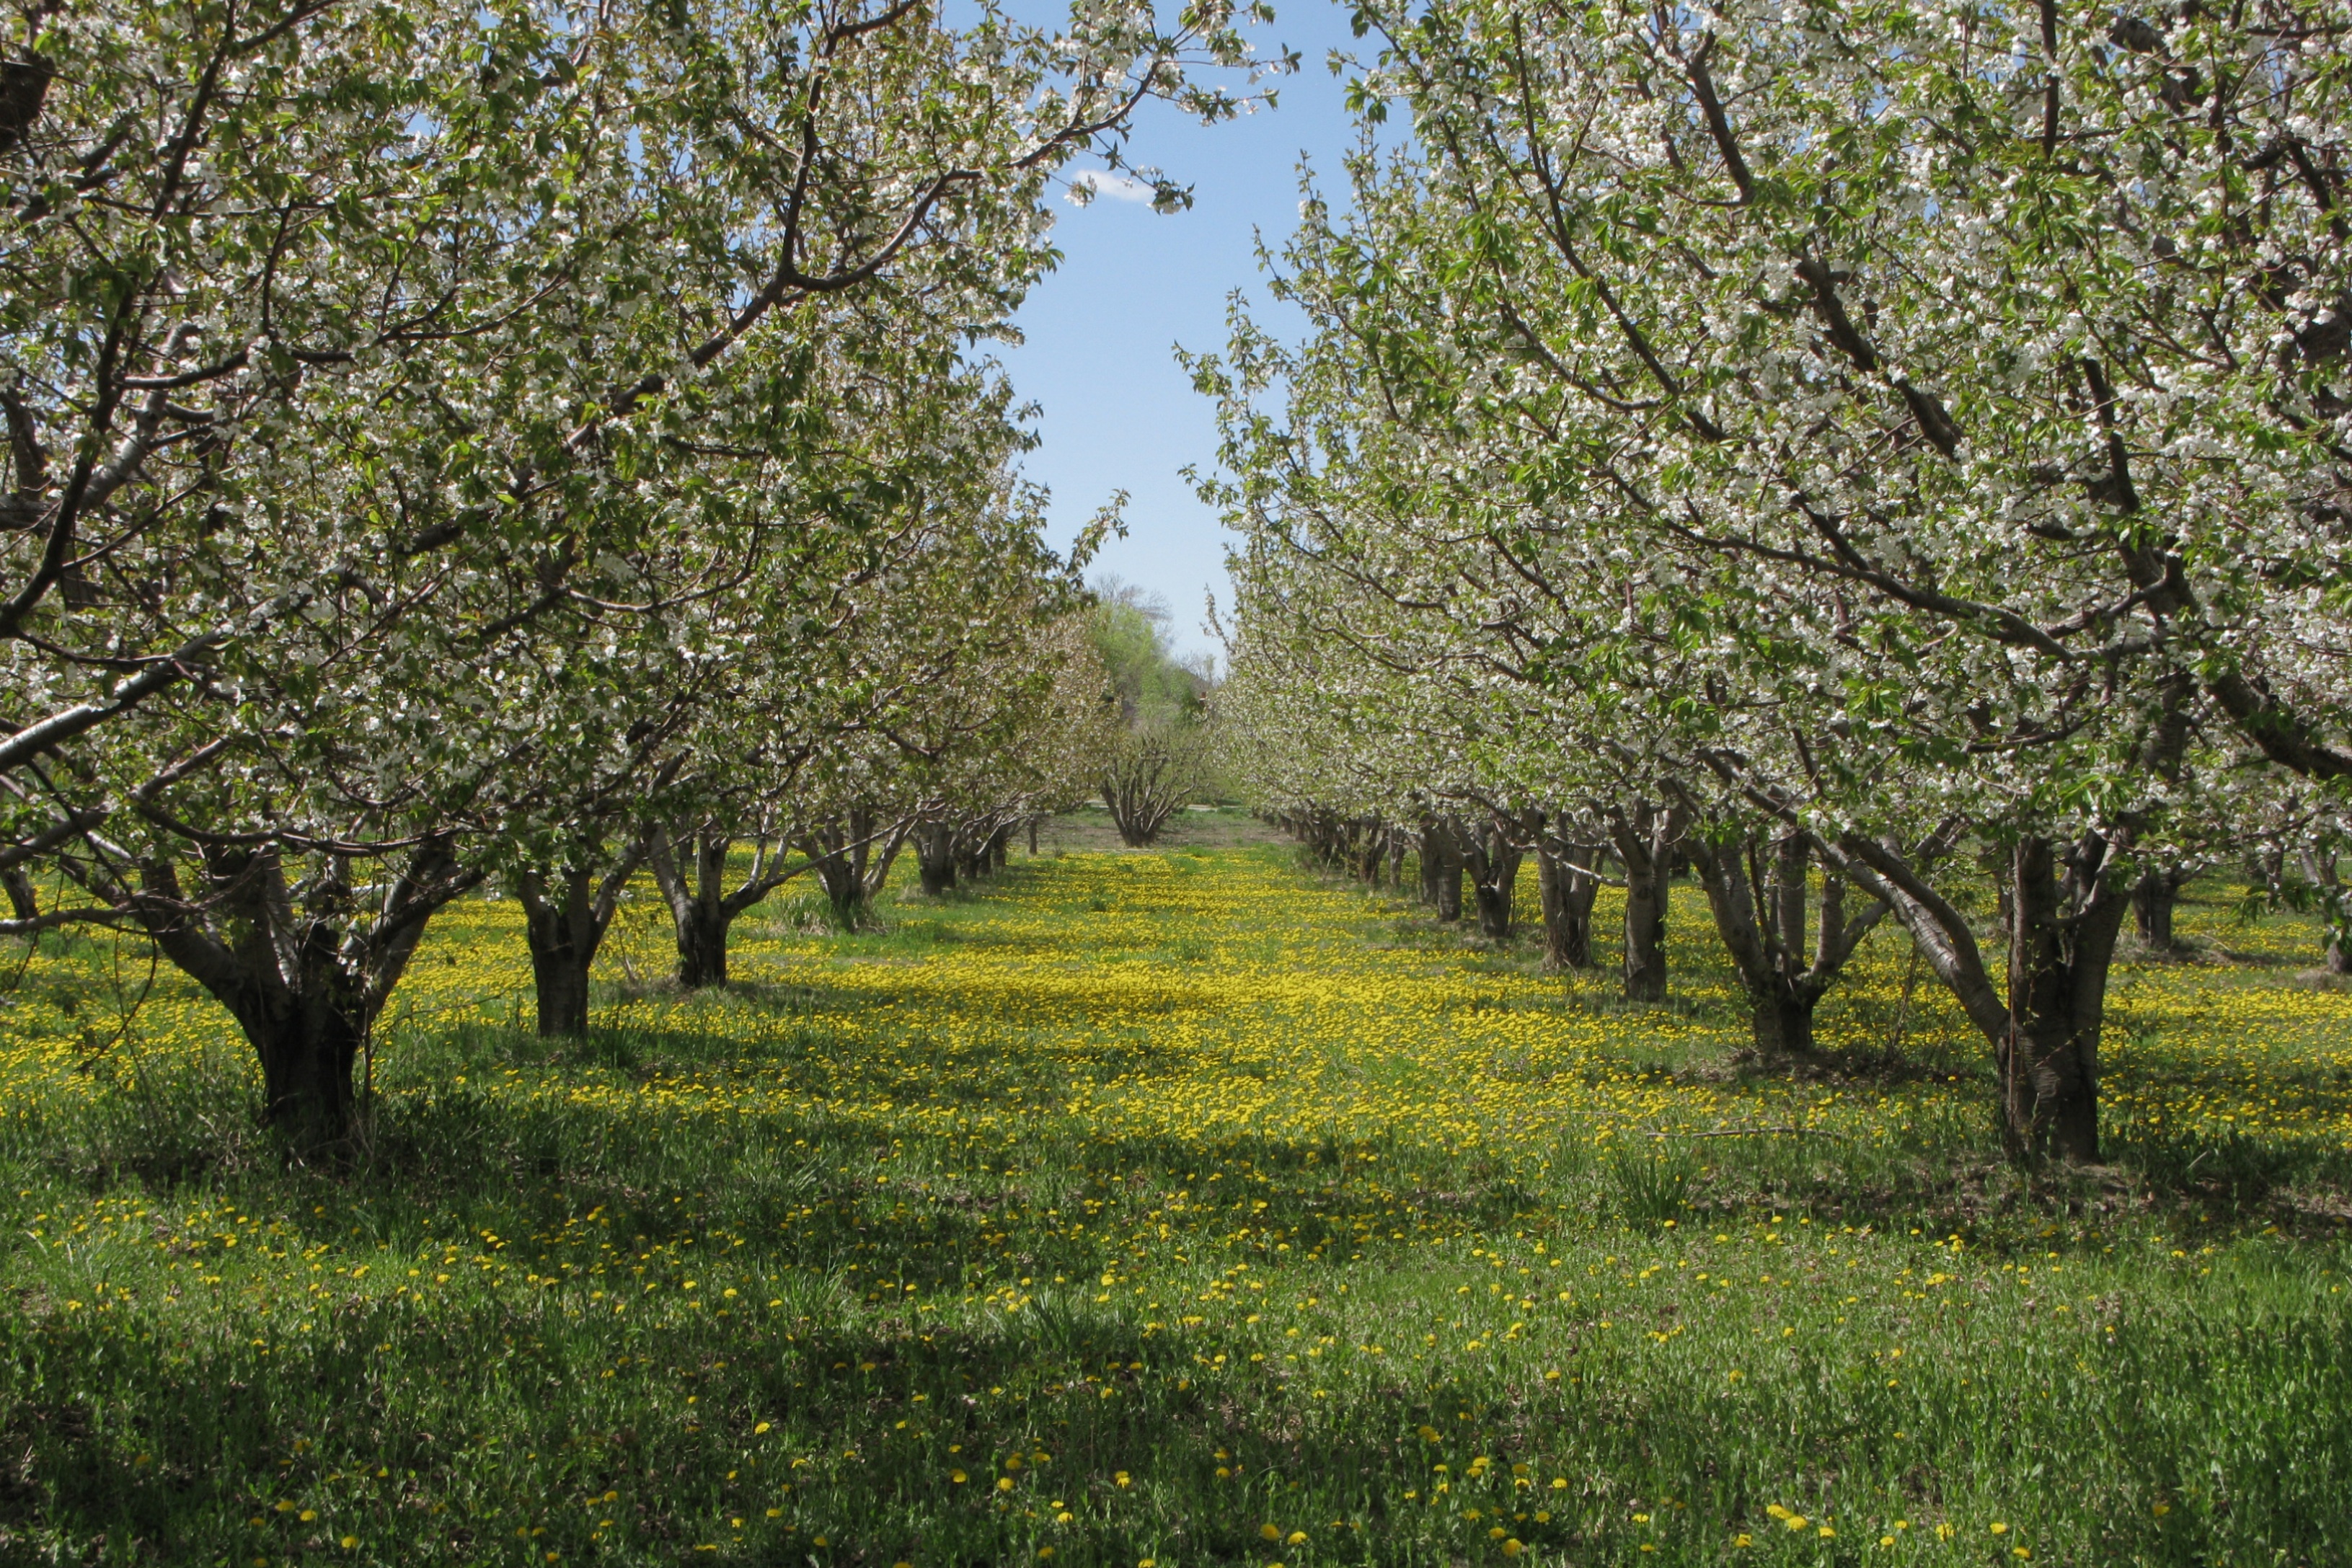
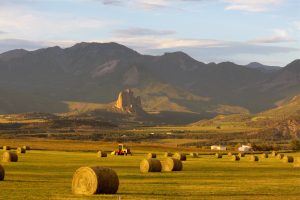
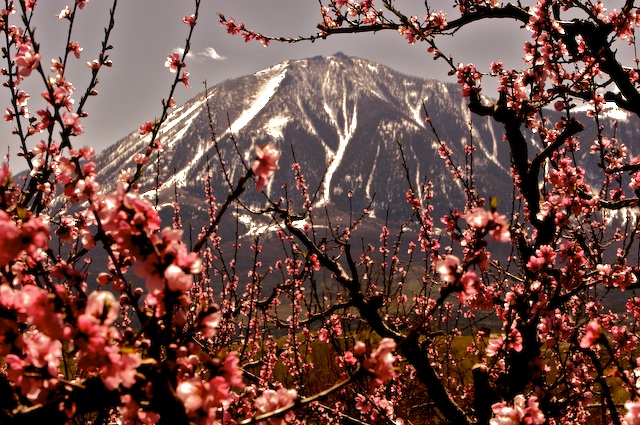
Rocky Mountain apple orchard. Photo by Celia Roberts
Domestic oil and gas production has been promoted by the industry as a means to provide the U.S. with energy independence. The argument goes something like this: “We need to be a net exporter of energy so as to reduce our reliance on foreign countries for these resources, especially countries in the Middle East.” This ignores the point that for energy security we might want to keep rather than export fossil fuels.
However, energy independence and food independence are inextricably linked.
Considering that the basic human needs are clean water, food, shelter, and safety — along with energy — we need to think about self-reliance; we can’t be dependent on foreign countries for our food. The U.S. is currently a net exporter of agricultural products, and California produces 50% of the food consumed in the U.S. But what would happen if our foodsheds became contaminated?
Drilling Proximity – Why the concern?
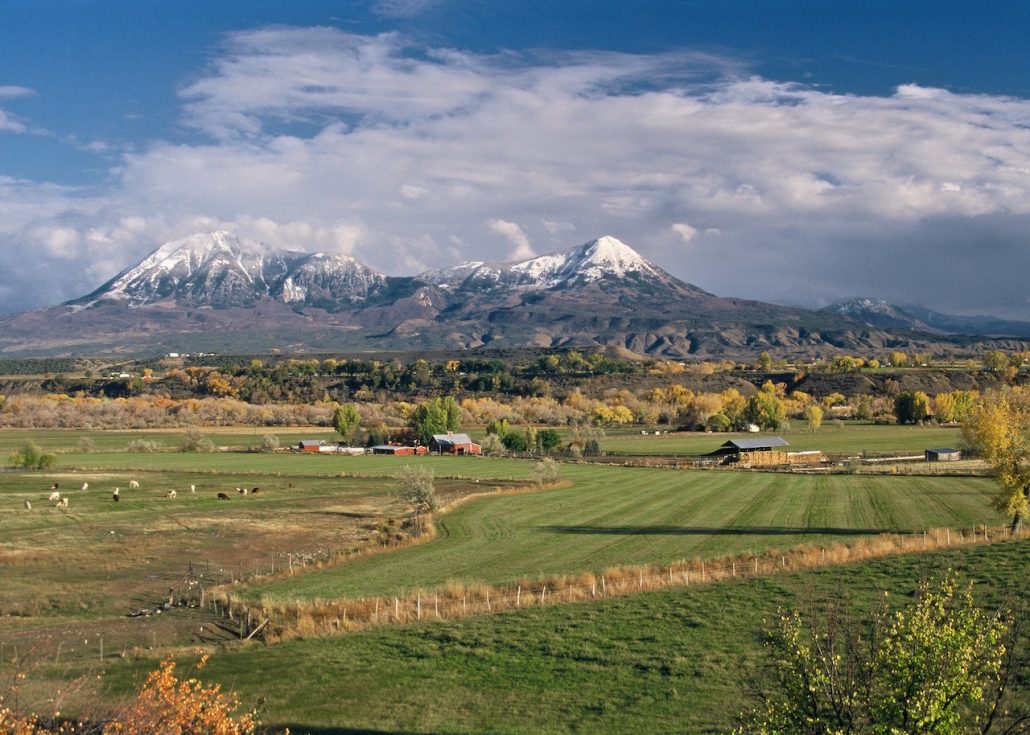
Front Range, Colorado working landscape at risk of unconventional oil & gas drilling. Photo by Rita Clagget
Over 58% of US agricultural market value and 74% of US farms – both conventional and organic – operate within shale basins, active shale plays, and the primary frac sand geologies.
Why is this so important? Why be concerned? Here are just a few reasons:
People can be exposed to the compounds involved with oil and gas extraction through spills, emissions, and other processes. The top five health impacts associated with these chemicals are: respiratory, nervous system, birth defects, and reproductive problems, blood disorders, and cancer.[2]
Rural gas gathering pipelines are unregulated; operators have no obligation to publicly report about incremental failures along the pipeline that may contaminate soil and water as long as they don’t require evacuations.[3]
Oil and gas operators are exempt from certain provisions of several environmental laws designed to protect public health and safety, including the Safe Water Drinking Act, The Resource Conservation and Recovery Act, The Emergency Planning and Community Right-to-Know Act, The Clean Water Act, The Clean Air Act, and The Comprehensive Environmental Response, Compensation, and Liability Act. These exemptions, in a way, permit oil and gas operators to contaminate water supplies with chemicals from their operations, in particular hydraulic fracturing fluids and produced wastewater.[4]
The gold standard of clean, chemical-free food is the USDA National Organic Program Standards, as governed by the Organic Foods Production Act. Unfortunately, organic certification does not require testing for oil and gas chemicals in water being used in organic production. The organic standard is satisfied as long as state, water, and food safety agencies deem the water safe. To our knowledge these agencies do not test for oil and gas chemicals.[5]
Based on available data spills occur regularly. Recent research has identified that the mixture of chemicals from fracking fluid and produced wastewater interact in a way that can lead to soil accumulation of these chemicals. Potentially, then, the chemicals may be absorbed by plants.[6] Fifteen chemicals often used in fracking have been identified as toxic, persistent and fast-traveling.[7] Some farms – such as those in Southern California – are being irrigated with produced water from oil and gas operations. Additionally, every single farm in the San Jaoquin Valley is within eight miles of oil and gas operations.[8]
There is significant Competition for water between natural gas production and agriculture. This includes growing commodity crops for energy, such as ethanol. Natural gas operations result in removing water quantity available for agriculture, and changing the water quality, which affects the agricultural product. In drought stricken areas, water scarcity is already an issue. In addition, extreme heat as a result of climate change is putting more stress on farmers operating in already depleted watersheds. Layered on all of this is the growing realization that precipitation regimes are gradually – and in many places dramatically – transitioning from many smaller and more predictable events to fewer, more intense, and less predictable rain and snow events which is are harder for the landscape to capture, process, and store for agricultural and/or other uses.
Operating costs: Farmers are already operating under razor- thin margins, with the cost of inputs continually increasing and the resilience of the soils and watersheds they rely upon coming into question with unconventional oil and gas’ expansion across the Midwest and Great Plains.
Public Lands
Over 45% of lands in the Western United States are owned by the federal government. Opening up public lands—by the Bureau of Land Management, United State Forest Service in particular—is controversial on multiple levels. As it relates to food security and independence, the issue often missed is that many headwaters to prime farmland reside on federal lands, along with the majority of cattle grazing.
There isn’t enough private land in the West for oil and gas operators to reach their production goals. They have to drill on public lands in order to scale up production and develop an export market for domestic natural gas. This means that public lands, taxpayer funded public lands, could potentially be used to irreparably harm prime agricultural and grazing lands (foodsheds). More alarming, is that the Trump Administration is focused on unfettered development, extraction and distribution of natural gas resources, including opening up public lands to oil and gas leasing and gutting regulations that protect us from pollution and public health risks.
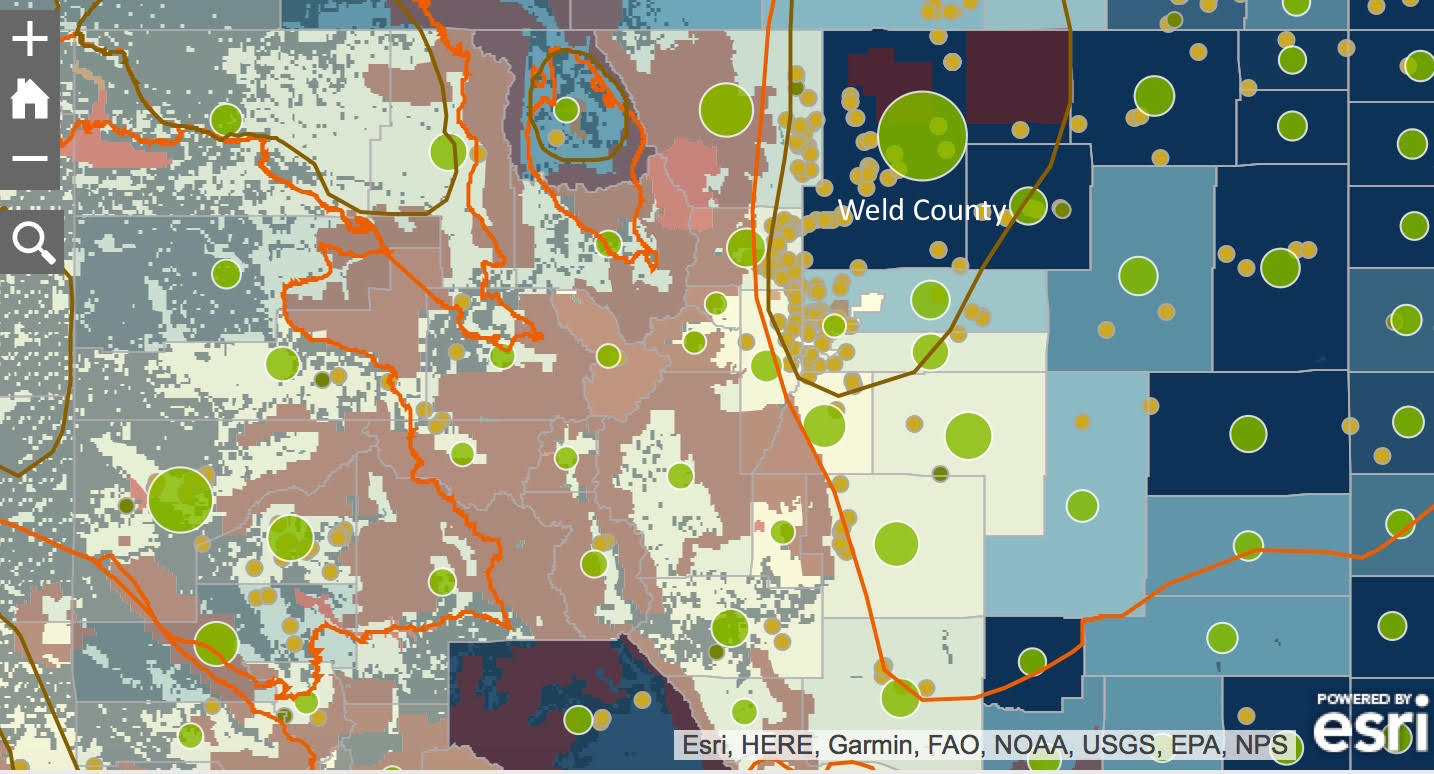
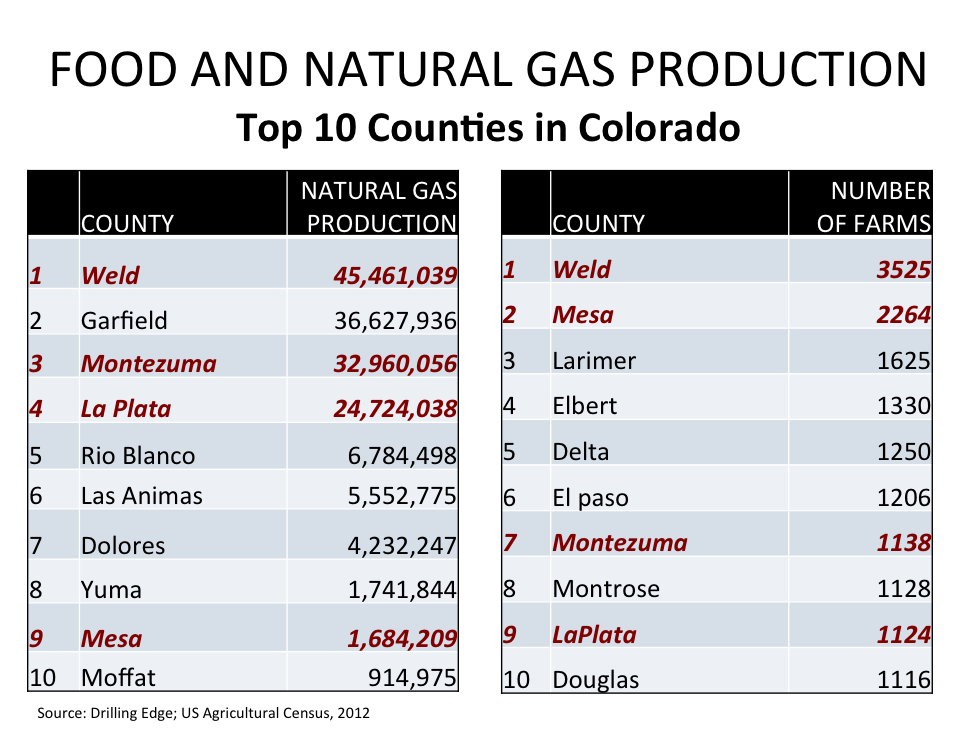
The map we have developed shows that many of the largest farms in the West are surrounded by public lands. Sixty-percent of Colorado farms are surrounded by public lands, which are within shale basins or active shale plays. Four of the top natural gas producing counties in Colorado are also four of the top agricultural producing counties: Weld, Mesa, Montezuma, and LaPlata counties. The third, fifth, sixth, eighth and tenth agricultural producing counties in the State are surrounded by public lands within shale basins, respectively,: Larimer, Delta, El Paso, Montrose and Douglas counties. The 6,325 farms in these counties represent 17% of all Colorado farms, and 29% (nearly half) of Colorado at-risk farms for being surrounded by public lands and within shale basins.
Colorado: Public lands surround majority of farms.
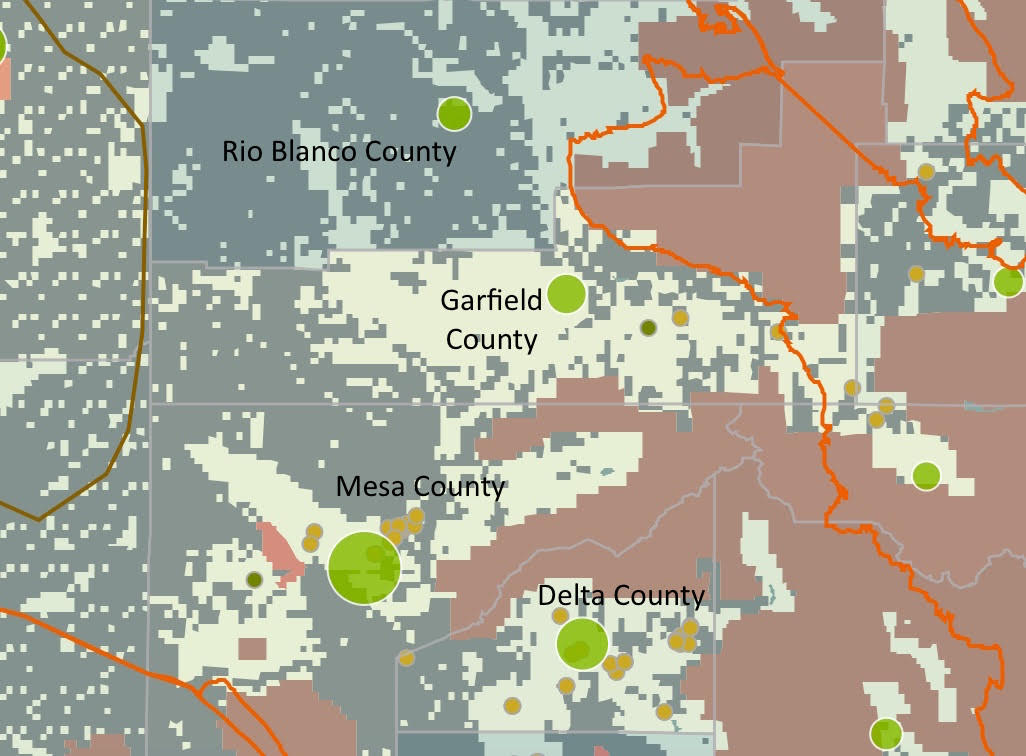
Colorado: Map zoomed into 3 of top agricultural producing and natural gas producing counties in Colorado, illustrating how they are surrounded by public lands.
These farms, headwaters, and public lands need to be protected if we are to maintain food independence and security. Producing potentially contaminated food is neither food independence, nor food security.
Policy Implications
Why should policy makers and health insurers care? Chronic and terminal illnesses are on the rise. Healthcare costs have nowhere to go but up as long as the environment we live in, the food we eat, the water we drink, and the air we breathe continue to be polluted at such a large scale. Attempts to reduce healthcare costs by insuring all Americans will have no impact if they are all sick. The insurance model only works when there are more healthy people in the pool than unhealthy people.
Mapping Conventional & Organic U.S. Farms
Below is an interactive map showing agricultural production in the U.S. You can use the map to zoom in at the county level to understand better the type of agricultural production taking place, as well as the value of the agricultural products at the county level.
U.S. Conventional and Organic Farms and Their Productivity Near Shale Plays and Basins
This map excludes Alaska for a variety of reasons[9]. We include over 180 unique data points for each county across five categories: 1) Crops and Plants, 2) Economics, 3) Farms, 4) Livestock and Animals, and 5) Operators. We then break these major categories into 20 subcategories.
Table 1. Subcategories Utilized in the “US Shale Plays and Basins Along with Agricultural Productivity By County” map above
Categories
Subcategories
Crops and Plants
Field Crops Harvested
Fruits, Tree Nuts, Berries, Nursery and Greenhouse
Hay and Forage Crops Harvested
Seed Crops Harvested
Vegetables and Melons Harvested
Economics
Buildings, Machinery and Equipment on Operation
Farm Production Expenses
Farm-Related Income and Direct Sales
Farms by Value of Sales
Market Value of Agricultural Products Sold
Farms
Agricultural Chemicals Used
Farms
Farms by Size
Farms by Type of Organization
Land in Farms and Land Use
Livestock and Animals
Livestock, Poultry, and Other Animals
Operators
Characteristics of Farm Operators
Hired Farm Labor
Primary Occupation of Operator
Tenure of Farm Operators and Farm Operations
Analysis Results
In total, there are 589,922 and 1,369,961 farms in US Shale Plays and Basins, respectively, averaging between 589 and 646 acres in size and spread across 2,146 counties (Figure 1). These farm counties produce roughly $87.31- 218.32 billion in agricultural products each year with the highest value per-acre being the Monterey and Monterey-Temblor Formations of Southern California, the Niobrara Formation in North Central Colorado, Eastern Barnett in North Central Texas, the Antrim in Michigan, and the Northern Appalachian Shale Basins of Pennsylvania, New York, and Ohio (Figures 2a/2b). Roughly 52% of all agricultural revenue generated in US Shale Play counties comes from livestock, poultry, and derivative products vs. a national average of 44% (Figure 3).
Put another way, the value of US Shale Basin agricultural infrastructure would rank as the 9th largest economy worldwide, between Italy and Brazil.
Family-owned farms are at the greatest risk. While corporations tend to own larger acreage farms, only 8.2% of US farms are owned by corporations. This figure is nearly halved in US Shale Plays, with 4.5% of farms owned by corporations, or 95% owned by families or individuals.
Figures 1, 2a, 2b, and 3 above show the number of farms near drilling, as well as variations in the value of agricultural products produced in those regions.
Risk vs. Benefits in CO
Oil and gas activity is regulated on a somewhat patchwork basis, but generally it is overseen at the state level subject to federal laws. New York and Maryland are the only two states that ban fracking, while communities around the country have invoked zoning laws to ban fracking or impose moratoriums on a smaller scale. However, in Colorado, the Colorado Oil and Gas Conservation Commission has exclusive jurisdiction over oil and gas regulation in the State. There, fracking bans imposed by local communities, with a large number of farms, have been found to be unconstitutional by the Colorado Supreme Court.
Weld County is Colorado’s leading producer of cattle, grain, and sugar beets. Weld is the richest agricultural county in the U.S. east of the Rocky Mountains, the fourth richest overall nationally, and the largest natural gas producer in CO. Compare this to the North Fork Valley on the Western Slope of CO, which is home to the largest concentration of organic farms in the state, one of two viticultural (wine making) areas in the state, and has a reputation for being a farm-to-table hub. Delta County, in which the North Fork Valley is located, is known for its sustainable agriculture initiatives. Uniquely, Delta County is one of the few agricultural areas in the country so far untouched by the fracking boom – but that could all change. The Bureau of Land Management is considering opening 95% of BLM lands and minerals within and surrounding Delta County to oil and gas leasing.
Protecting Food Supplies
Oil and gas extraction is taking place on both private and public lands across the country. Prime and unique agricultural lands need to be protected from these industrial activities if we are to maintain food independence and ensure a healthy food supply. As demonstrated by the map above, agricultural communities in active shale plays may already in trouble. To prevent further damages on day-to-day food staples, it is imperative to increase awareness about this consequential issue.
How can people trust that the food they eat is safe to consume? Families trust farmers, food brands, school and office cafeterias, and restaurants to the extent that the food supply chain is regulated and maintained. If most of the food produced in the U.S. is within active shale plays, and the water/soil is not being tested for oil and gas chemicals, that supply chain is at risk. The secure production of our food – via clean air, water, and soil – is tantamount to lasting food independence.
Farming Testimonials
I am the leader of Slow Food Western Slope, which functions as a chapter of Slow Food USA. We envision a world in which all people can eat food that is good for them, good for the people who grow it and good for the planet: good, clean and fair food for all. Our chapter promotes and supports over 70 farmers, orchardists, ranchers, agricultural businesses and winemakers of the North Fork Valley – all of which depend on good and clean water, air and soil. With its industrial footprint and potential damage to landscape, air, water, soil and human health, extraction industries have no place in the future of the North Fork Valley. We can build a new economy around clean food, outdoor recreation, healthy lifestyle and small nonthreatening businesses.
Jim BrettSlow Food Western Slope
Agricultural land is much more valuable in the long-run than the short-term gains promised from oil and gas extraction… As farmers we are attuned to crop, soil, and water conditions especially as a result of weather. If it’s too hot, too dry, too wet, too cold then there is no food. Natural gas extraction is an undeniable factor in changing climate and is incompatible with the practice of sustainable agriculture.
Mark WaltermireOwner of Thistle Whistle Farm in Hotchkiss, CO
References and More Information
FracTracker Alliance raised awareness of this issue in 2015 when it mapped the proximity of organic farms to oil and gas wells. In that mapping analysis, it was discovered that 11% of organic farms are within ½ mile of oil and gas development. Did you know that less than 1% of agricultural lands in the United States are used to grow crops without chemicals, and that 42% of those organic farms produce food for human consumption?
This research prompted the question of what about the other 99% of agricultural lands used to grow crops and raise livestock utilizing chemicals and other conventional methods in the United States. The majority of dairy, grains, beef, poultry, fruits, vegetables, and animal feed for livestock are produced on conventional farms. Where are they located, and do we know how they are being impacted by oil and gas development?
The majority of the US population lives in urban centers and is disconnected from the American farm, including how and where food is produced. People trust their farmer, food brands, school and office cafeterias, and restaurants to the extent that they trust their supply chain, and to the extent that the farmers trust their water supply and soils. If the majority of the food produced in the U.S. is within active shale plays, and the water and soil are not being tested for oil and gas chemicals, this research questions how people can trust that their food is safe to consume. If we are to maintain our food independence and health, not only do consumers need to understand that the food supply is at risk in order to exercise their rights to protect it at the local, state, and federal levels, but policymakers need to be informed with this data to make better decisions around oil and gas development regulations and development proposals that impact our foodsheds.
Issues with Alaskan agricultural data include incomplete reporting and large degrees of uncertainty in the data relative to the Lower 48.
By Natasha Léger, Interim Executive Director, Citizens for a Healthy Community and Ted Auch, Great Lakes Program Director, FracTracker Alliance
https://fractracker.org/wp-content/uploads/2017/02/Agriculture-Feature-Feb2017.jpg400900Ted Auch, PhDhttps://fractracker.org/wp-content/uploads/2025/09/2025-Wordmark-Logo.pngTed Auch, PhD2017-06-07 01:35:232021-04-15 15:02:42Health vs. Power – Risking America’s Food for Energy
In 4th grade, every Wisconsin student learns about their state. Topics pertaining to Wisconsin’s economy, geography, and history along with ethnicity and traditions are introduced and explored. State facts and anecdotes are discussed and naturally memorized. The one that stood out to me the most was how Wisconsin became known as the “Badger State.”
The origin of the badger nickname is from mining. The 4th grade story I remember was that miners were too busy to build houses so they moved into abandoned mineshafts and/or dug their own burrows. These men became known as “badgers.” The 4th grade version of myself thought that was real impressive. I pictured strong, hard working men fiercely toiling away in the earth like mythical creatures, helping make Wisconsin what it is today.
It made for a great story.
Back to Reality
The reality and documentation of the times suggests something different. Most miners lived in cabins or other structures above ground. There most certainly were a few outliers on the fringe of mining society who burrowed their own holes or lived in abandoned underground mines, but the adult version of myself has a hard time imagining that the term used to describe such men – badgers – was used as a compliment.
Either way, the result is the same. Word spread and eventually Wisconsin became known as the Badger State. The state may be known worldwide for its cheese and agriculture, but there was mining in Wisconsin long before the first dairy cow. While the state was earning its nickname, mining was a prominent reason for the early success of the region.
Dairy Farming in WI
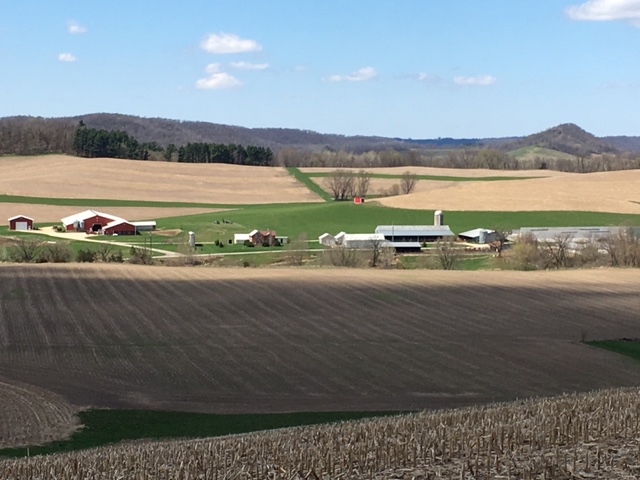
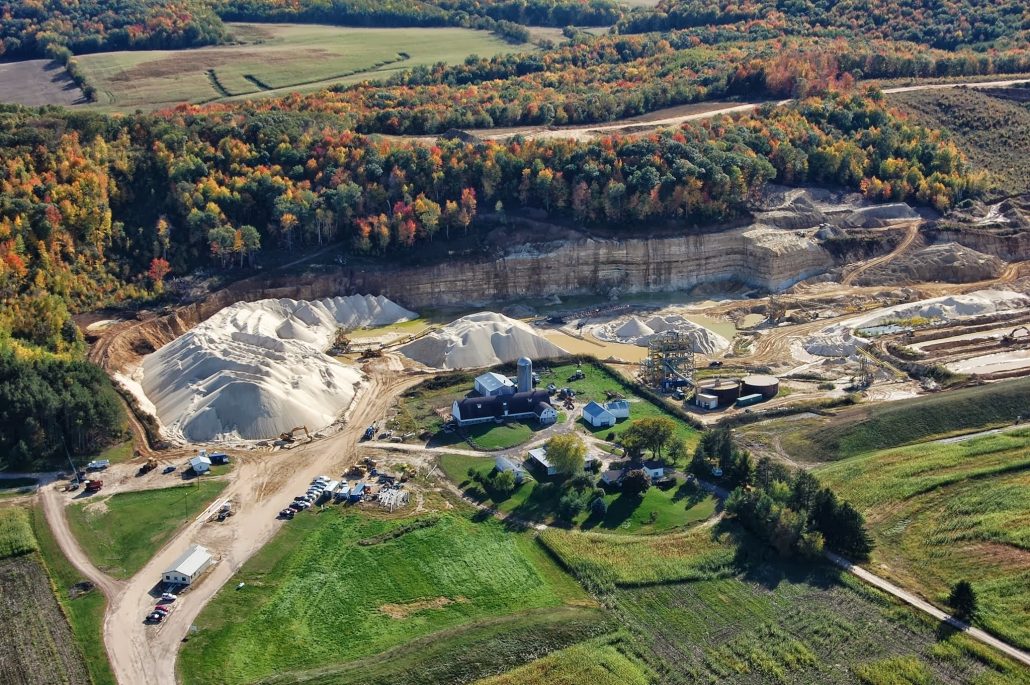
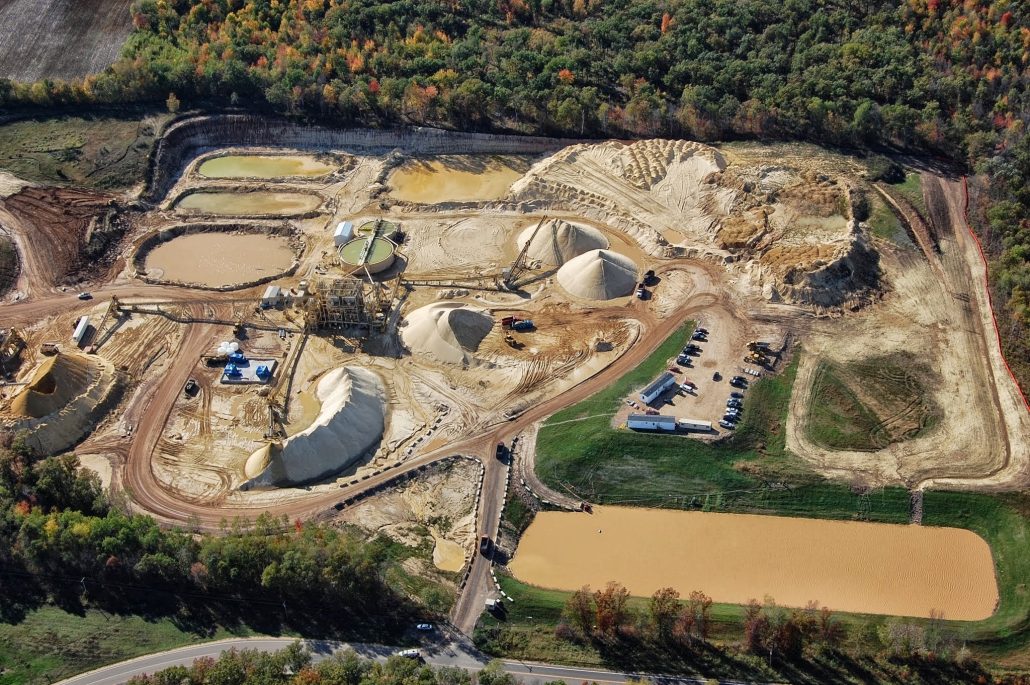
The 700 acre Jereczek Homestead Dairy in Dodge Township, Trempealeau County, Wisconsin first established in 1873 and now being operated by the 6th generation of Jereczeks.
Our farm is in Trempealeau County, Wisconsin – a driftless area – meaning the land was not covered by glaciers during the last ice age. The terrain is hilly and uneven, with tree-topped bluffs and hills overlooking valleys. The valleys, ranging from deep and narrow to wide and shallow, bump and flow into each other. Over the years, our farm has received its fair share of breaker rock, crushed rock, and gravel from the prevalent rock quarries. Sandstone deposits are huge and close to the surface. As a kid, there was a ledge in the cow pasture, where I hunted through chunks of sandstone for fossils.
As with everything else in the world, dairy farming continues to change. Most barns sit derelict and hold only memories of cows as they fade into the landscape. Small farms that clung to the valley walls have been sold to bigger operations, sit vacant, or have been built over. A lot of once prime farmland has been converted into houses with ridiculously large lawns. In 1990, Wisconsin had over 34,000 licensed dairy herds. Now there are just over 9,000.
We are the last dairy farm in our valley. Parallel to the trend, my childhood herd of 40 cows has turned to 200, which is about an average-sized herd. Margins are tighter than ever. Consistent help is hard to find. Milk prices are a terrible rollercoaster ride – it seems to take forever for them to go up, but when they fall, it’s fast and sickening. In the dairy business world, survival is a measure of success.
Frac Sand Mining Perceptions
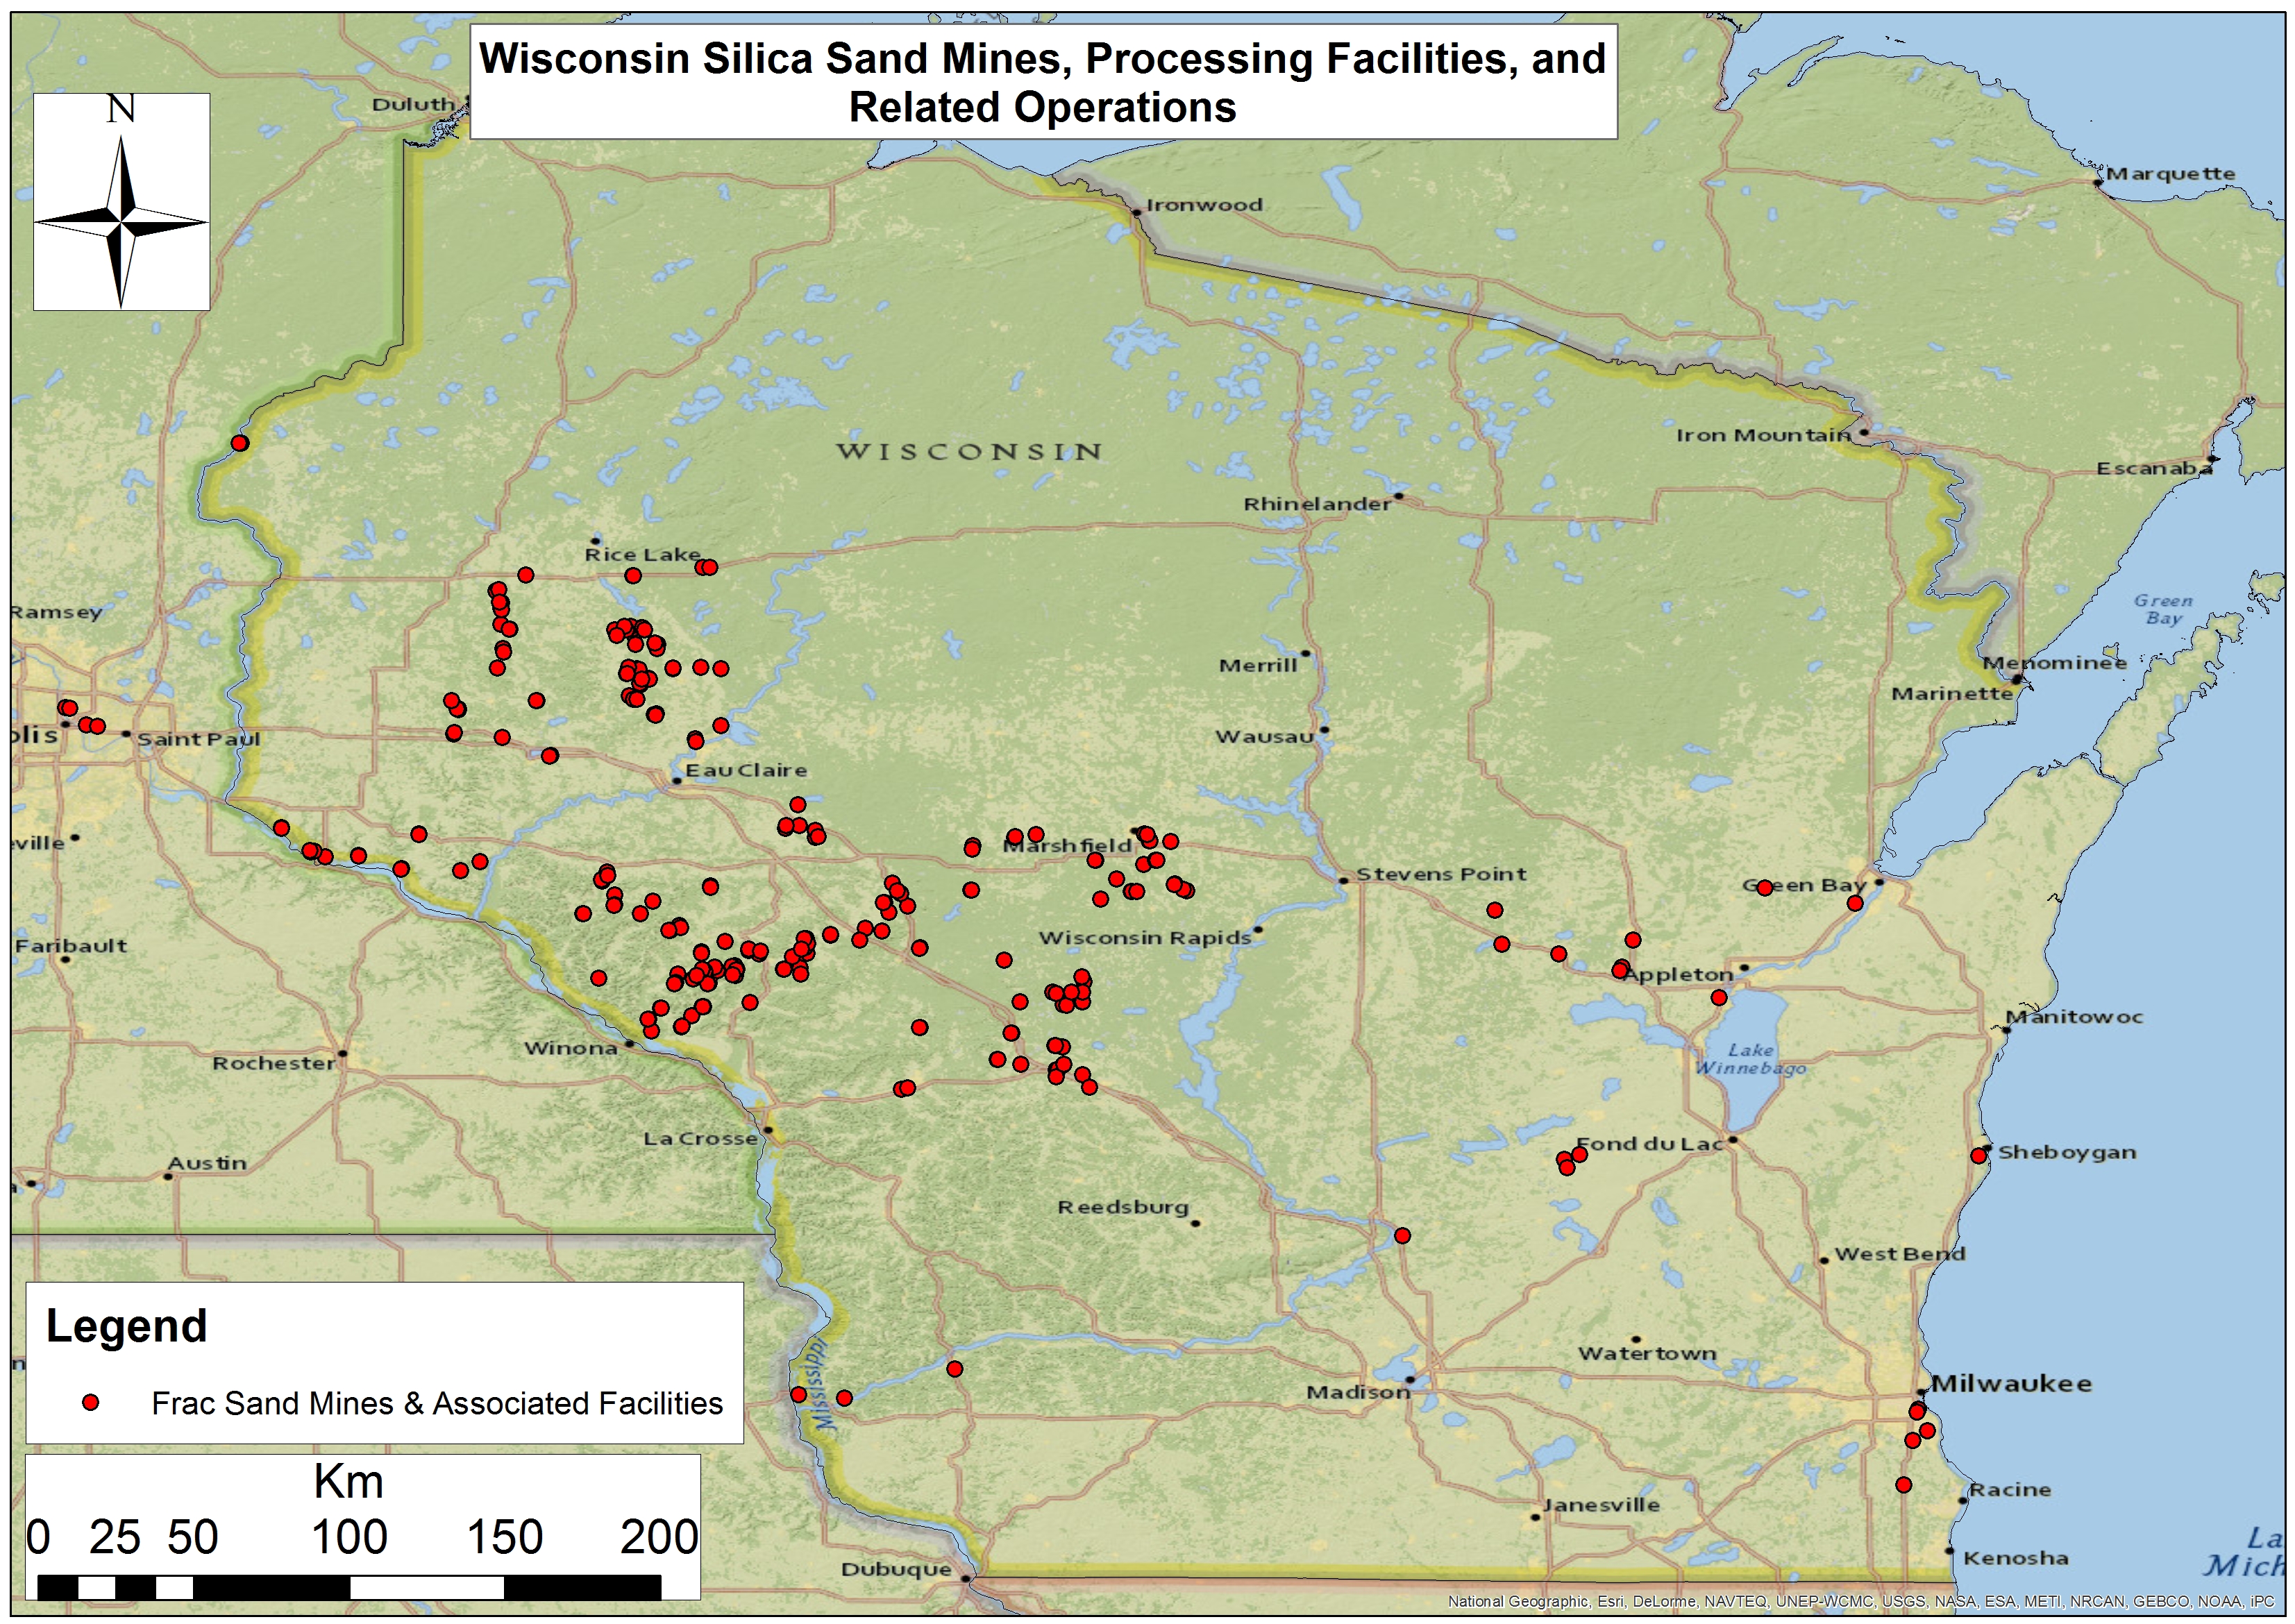
Wisconsin Frac Sand Mines, Processing Facilities, and Related Operations
The term frac sand is relatively new to me. I always assumed sand was sand and had given the word sand a negative connotation. Sand’s large particles don’t hold moisture or nutrients well, so sandy fields tend to perform poorly. But what if that sand has value for something else? What if there is a market for this sand much like a market for corn or soybeans?
Farmers tend to be resourceful. Every asset is scrutinized and employed to the fullest. Every acre is pushed. But what about what may lie beneath the soil? Sand mining has been going on in Wisconsin for well over a hundred years, but the recent surge in fracking has created an enormous demand for frac sand – and there are many people and companies set to take advantage of the boom.
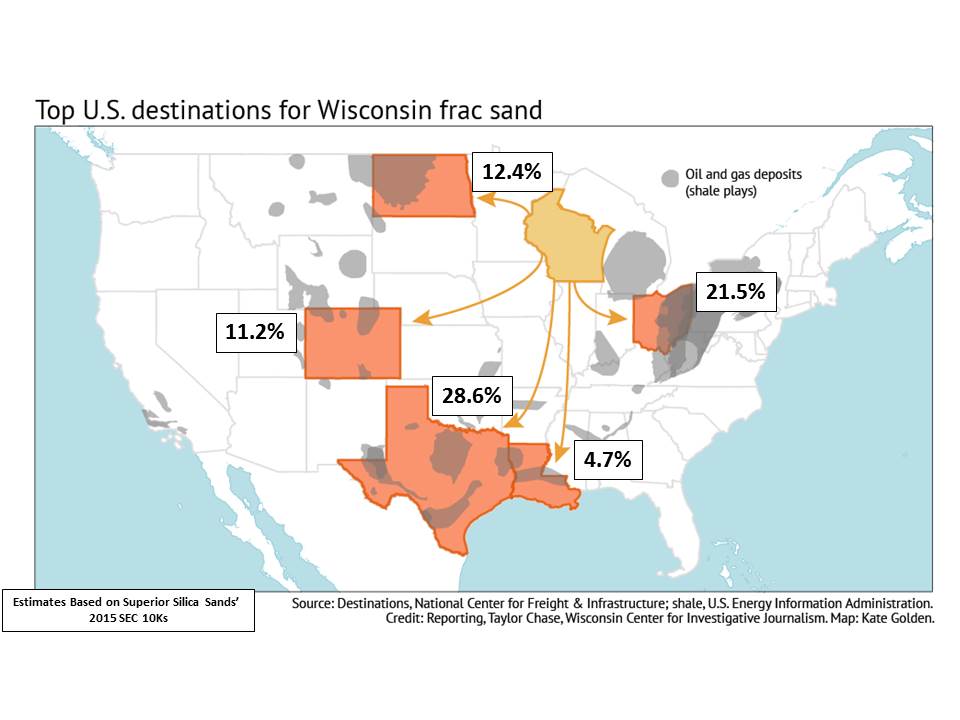
Top U.S. Destinations for Wisconsin’s Frac Sands Estimated from Superior Silica Sands’ 2015 SEC 10Ks
Trempealeau County has zoning and planning ordinances to protect its industries and way of life. These aggressive ordinances allow more citizen input than other county’s ordinances. Public hearings are required, and orderly processes are enforced. With the economics involved with frac sand mining, citizens got educated very quickly. Much like abortion or immigration, frac sand has become a polarizing subject. Strong emotions built up by personal ideologies have pushed this topic to a boiling point. The for and against groups trade barbs without much convincing being done on either side. Frac sand mining editorials are common in local papers with those against appearing to be the most vocal and emotional.
New Player, New Approach
One such editorial detailed the approach a sand company took to obtaining a property. A local farmer had a sand mine company representative approach him with an oversized check written out to him for a sizable amount of money for his land. It was as though the sand rep was taking a page out of the Publishers Clearing House’s playbook. The farmer turned down the check. The sand rep left and returned a short time later with a significantly larger offer. The farmer was equally surprised and insulted. He found out later a few neighbors turned down similar proposals.
So what’s the deal with such a brazen approach? Intentions from this company may well have been good. Many people believed the sand mines were a win-win opportunity. Companies were selling hype – there was no way for anything but success. Extreme optimism. Sand mines were going to increase the tax base, fund schools and roads. Concerns were minimized, and residents were told what they wanted to hear. Such talk produced plenty of skeptics.
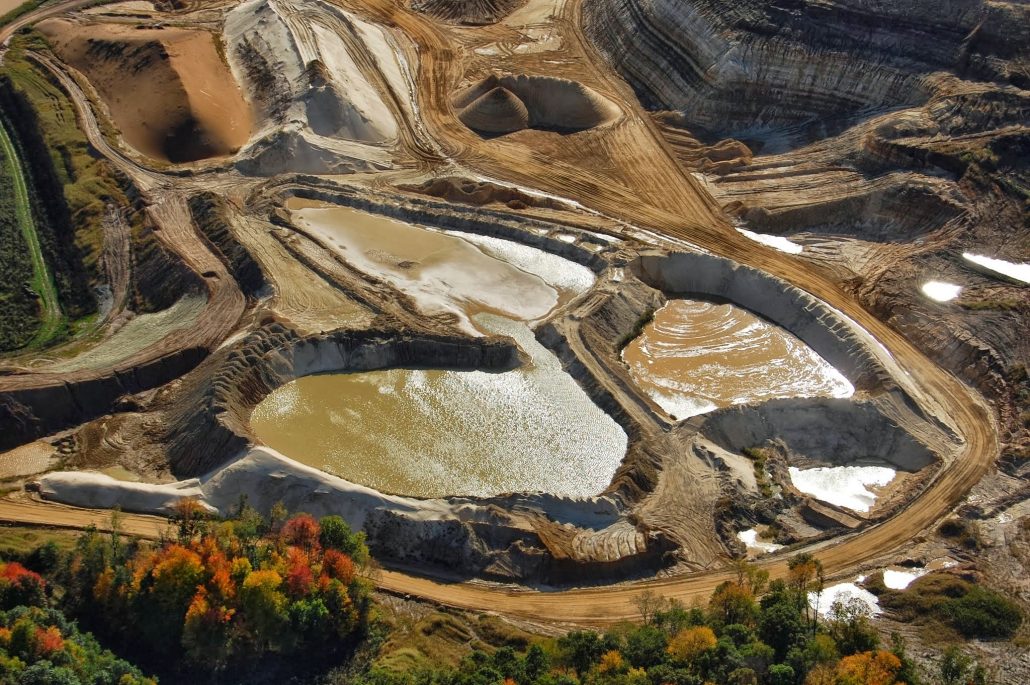
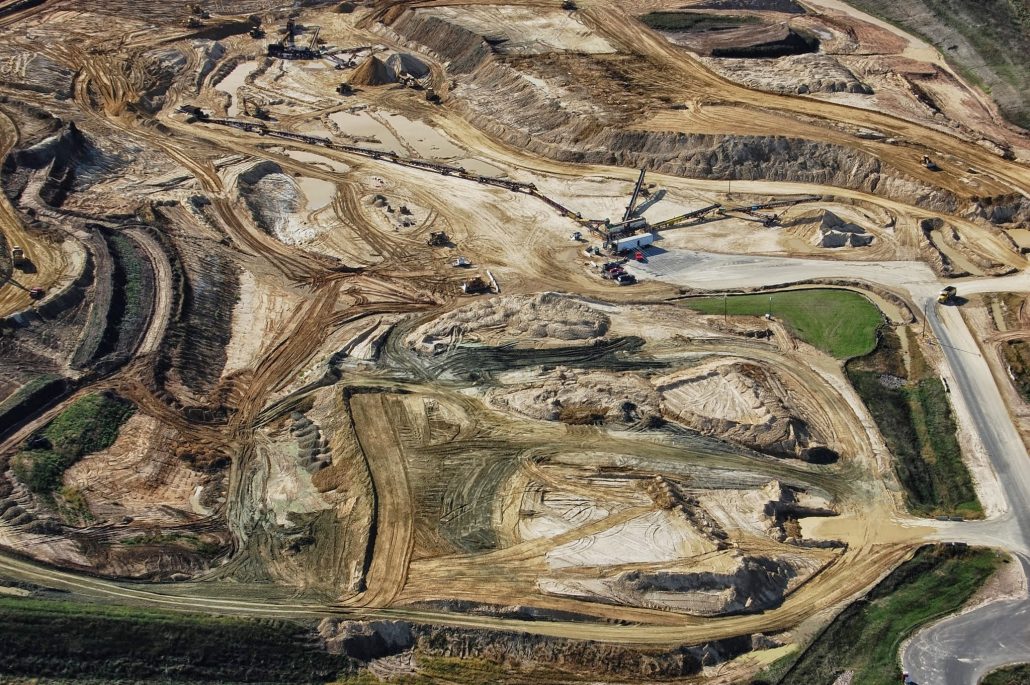
Environmental Costs of Frac Sand Mining
With both dairying and fracking, there is an environmental cost. Whether you milk 10, 100, or 1,000 cows – there are environmental pressures. With sand mining, the environmental effects are well documented. It is important, if not just practical, to measure these with the fiscal rewards. And where does this money go and who benefits the most? But, most importantly, who must deal with the consequences?
The risks of sand mines can be mitigated if proper regulations are taken seriously. With the extra scrutiny, a magnifying glass was placed over the sand mines, and what was found only proved the skeptics right. Trapping or pooling storm water seemed to be a learning process for sand mine companies; reported in 2012, every operating sand mine in Trempealeau County had storm water runoff violations. In 2014, over half of the sand mines in all of Wisconsin had violated environmental regulations imposed by the Department of Natural Resources. Add to this loss of surrounding property values, damage to roads, and a damper on quality of life – and you’ll create a substantial amount of public backlash.
As was mentioned earlier, mining Is not new to the state. There are many multi-generational mining companies who have the experience, tradition, and financial network to abide by current standards and environmental regulations. Nobody likes to be told what to do. No industry is out there begging for more regulations. Often, the rules are in place to protect – not hinder – those that use environmentally safe and humane practices. Dairying has its own unique regulations – some are good, some not so much, and some downright stupid. Yet, overall it can be argued that these regulations protect the industry and the environment.
One heated topic in the dairy industry involves the sale of raw (unpasteurized) milk. It is illegal for any dairy in the state to sell raw milk. I have been drinking raw milk straight from the bulk tank since before I can remember. Our whole family did. Now, I still drink it and so do all my children from the age of a year and a half on up. None of us has ever had trouble with it. However, I am in complete agreement that the sale of raw milk should be illegal. All it takes is for one child to get terribly sick (which most certainly would happen) and for that kid lying on a hospital bed being blasted by every news network in the nation. These images create strong negative emotions that reverberate throughout society. The potential costs far outweigh the economic benefits from such a sale. Sure, some people are upset, but the greater good is maintained by taking away a risky practice.
The same principle works for mining. Rules and regulations get negative press and reaction, but who stands to lose the most from environmental catastrophes related to mining – the company in business 90-some years or the startup mining ventures trying to capture lightning in a bottle? Some companies have built years of trust and compatibility and support for their local communities. These are businesses that will remain after the sand rush has fizzled.
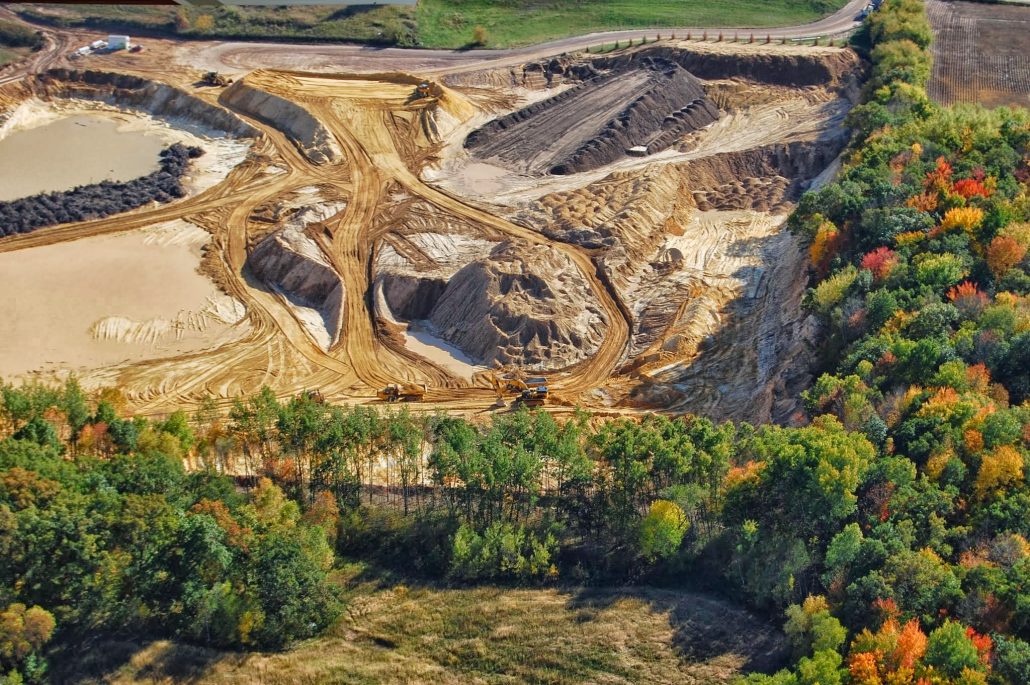
Booms and Busts, Ups and Downs
The frac sand industry is going through the same economic cycle as the dairy industry. The sand companies are getting better at what they do and increase their production capacity. Like milk, sand is a commodity. As the price of sand decreased, production increased to maintain profits. The dairy industry does the same thing, by expanding and improving efficiency to get more milk to catch those dollars slipping away. However, when the market is flush with milk or bombed with sand, they’re just doing more damage to themselves. This is a simplified take on the industry, as there are many global factors that come into play, but the overall pattern tends to remain. As the dairy industry can attest, this fluctuating cycle is not sustainable for all producers.
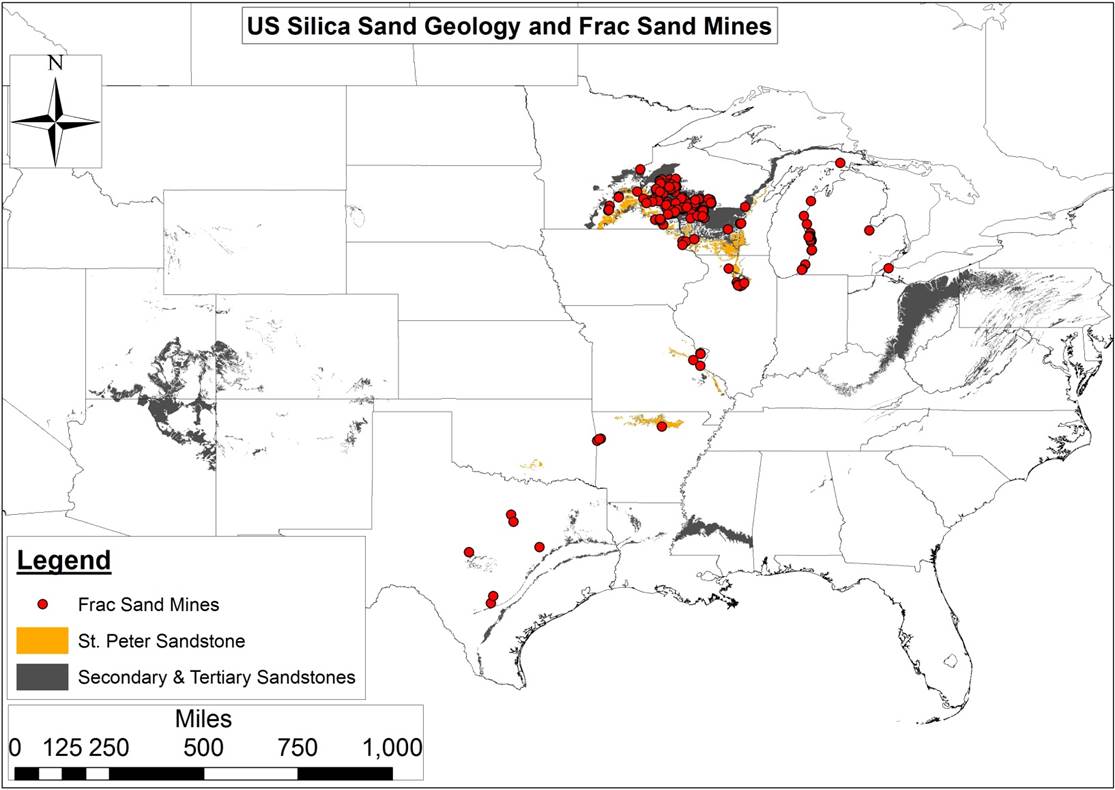
Primary and Secondary US Silica Sand Geologies and Existing Frac Sand Mines
Worse yet for the sand industry, this cycle has occurred in hyper speed. At first, just the small mines cut production. Outcompeted by larger operations, production at smaller mines was no longer profitable. Soon, the larger mines cut production due to the weakening demand. Many mines in the permit or early production phases never got started. Unlike the dairy industry, there was no rollercoaster effect because prices have yet to return to prior levels. The bubble, it seems, had popped.
With any kind of new mine developed comes the environmental impacts. Yet, I find the fervent negative reaction to such practices directly related to the end result. Fracking. Fracking isn’t magic. They’re not just mixing water with this sand and forcing oil and gas out of the ground. Harmful chemicals are being added to the mix. Worst yet, the quantity and potency of such chemicals is kept secret, closely guarded from the public. Harmful chemicals are being legally pumped into the ground. All the short-term gains will have long-term consequences. This is where I believe a significant backlash for new mines comes from. The end result. Can you imagine what the public’s perception of dairy farms would be if milk was mixed with chemicals and pumped into the ground?
The Future of Dairy Farming in Wisconsin
The 2016 presidential election has breathed some life into the frac sand industry. The new president promises to cut regulations interfering with business, and thus far has kept those promises. The environment will not be a detriment to his goals. Sand companies are returning with ads in the local papers, looking for qualified applicants and offering great salaries. In contrast, the dairy industry is stuck in a rollercoaster spiral. Milk prices have been too low for far too long. The dairy dispersal continues with some very good cows being sold and very good dairymen and women calling it quits. Naturally, some land will be sold. To what end remains to be seen. But it is a safe bet, the frac sand mining ride has not ended.
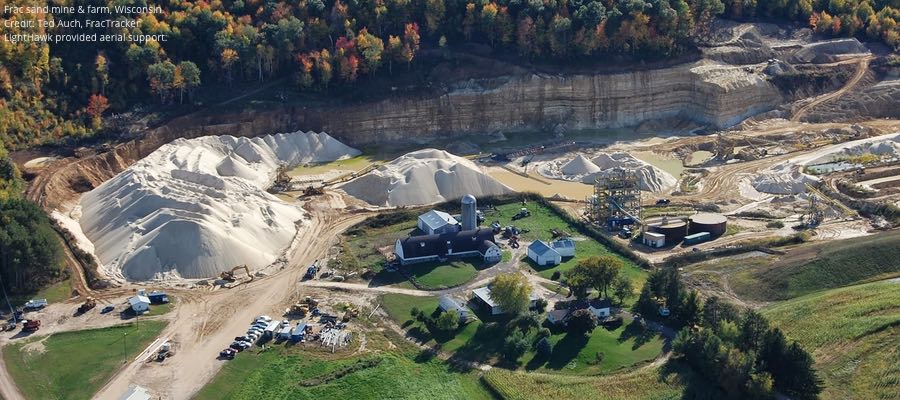
https://fractracker.org/wp-content/uploads/2017/04/Frac-sand-mine-WI-Feature.jpg400900Guest Authorhttps://fractracker.org/wp-content/uploads/2025/09/2025-Wordmark-Logo.pngGuest Author2017-04-19 16:22:422021-04-15 15:03:09Fracking in Dairy Country
In March 2017, FracTracker Alliance conducted a review of the available Pennsylvania oil and gas fine data released publicly by the PA Department of Environmental Protection (DEP) to identify trends in industry-related fines over time and by particular operators. In total, the DEP has assessed nearly $36 million in fines to oil and gas extraction and pipeline operators since January 1, 2000. Such fines are associated with over 42,000 violations issued1 by DEP in that time frame, covering 204,000 known oil and gas locations,2 as well as 91,000 miles of pipelines3 within the Commonwealth.
Understanding the Data Structure
The amount of money that the Pennsylvania Department of Environmental Protection (DEP) fines oil and gas (O&G) operations is included in the DEP’s compliance report published on their website. Even though fines data are made available, they are not necessarily straight-forward, and caution must be taken not to over-estimate the total number of assessed fines.
Records of fines are associated with enforcement identification codes on the compliance report. A single fine is often applied to numerous violations, and the full amount of the fine is listed on every record in this subset. Therefore, the total dollar amount of fines assessed to O&G companies appears overstated. For example, if a $400,000 fine were assessed to settle a group of 10 violations, that figure will appear on the report 10 times, for an apparent aggregate of $4,000,000 in fines. To get an accurate representation of fines assessed, we need to isolate fines associated with particular enforcement ID numbers, which are used administratively to resolve the fines.
This process is further complicated by the fact that, on occasion, such enforcement ID numbers are associated with more than one operator. This issue could result from a change in the well’s operator (or a change of the operator’s name), a group of wells in close proximity that are run by different operators, or it might point to an energy extraction company and a midstream company sharing responsibility for an incident. Sometimes, the second operator listed under an enforcement ID is in fact “not assigned.” The result is that we cannot first summarize by operator and then aggregate those subtotals without overstating the total amount of the assessed fines. In all, 62 of the enforcement ID numbers apply to more than one operator, but this figure amounts to less than one percent of the nearly 15,000 distinct enforcement ID numbers issued by DEP.
Conventional & Unconventional Violations & Fines
Oil and gas wells in Pennsylvania are categorized as either conventional or unconventional, with the latter category intended to represent the modern, industrial-scaled operations that are commonly referred to as “fracking wells.” Contrastingly, conventional wells are supposed to be the more traditional O&G wells that have been present in Pennsylvania since 1859. The actual definition of these wells leaves some blurring of this distinction, however, as almost all O&G wells now drilled in Pennsylvania are stimulated with hydraulic fracturing to some degree, and some of the conventional wells are even drilled horizontally – just not into formations that are technically defined as unconventional. For the most part, however, unconventional remains a useful distinction indicating the significant scale of operations.
Table 1. Summary of oil and gas wells, violations, and fines in Pennsylvania
Category
Conventional
Unconventional
(blank)
Total
Wells
193,655
10,291
0
203,946
Violations
27,223
6,126
9,026
42,375
Fines
$7,000,203
$13,689,032
$21,563,722
$35,949,495*
Fines per Violation
257
2,235
2,389
848
Fines per Well
36
1330
–
176.27
Violations per Well
0.14
0.60
–
0.21
Wells per Violation
7.11
1.68
–
4.81
* The total fine amount issued is not a summary of the three preceding categories, as some of the fines appear in multiple categories
Ninety-five (95)% of the state’s 204,000 O&G wells are classified as conventional, so it should not be surprising to see that this category of wells accounts for a majority of violations issued by the department. However, fines associated with these violations are less frequent, and often less harsh; the $7 million in fines for this category accounts for only 19% of the total assessed penalties. In contrast, the total penalties that have been assessed to unconventional wells in the state are nearly twice that of conventional wells, despite accounting for just 5% of the state’s well inventory
On the 54,412 records on the compliance report, 10,518 (19%) do not indicate whether or not it is an unconventional well. The list of operators includes some well-known conventional and unconventional drilling operators, and hundreds of names of individuals or organizations where O&G drilling is not their primary mode of business (such as municipal authorities and funeral homes). This category also contains violations for midstream operations, such as pipelines and compressor stations. Altogether, 3,795 operators have entries that were not categorized as either conventional or unconventional on the compliance report, and 124 of these operators were issued fines. One additional complication is that some of the violations and fines that fall into this category are cross-referenced in the conventional and unconventional categories, as well.
The resulting impact of these factors is that the blank category obscures the trends for violations and fines in the other two categories. While tempting to reclassify well data in this category as either conventional or unconventional, this would be a tall task due to the sheer number of records involved, and would likely result in a significant amount of errors. Therefore, the FracTracker Alliance has decided to present the data as is, along with an understanding of the complexities involved.
Most Heavily Fined Operators
Despite the numerous caveats listed above, we can get a clear look at the aggregated fines issued to the various O&G operators in the state by constructing our queries carefully. Table 2 shows the top 12 recipients of O&G-related fines assessed by DEP since 2000. Ten of these companies are on the extraction side of the business, and the total number of well permits issued4 to these companies since 2000 are included on the table. By looking at the permits instead of the drilled wells, we discover the operator that was originally associated with the drilling location, whereas the report of drilled wells associates the current operator associated with the site, or most recent operator in the event that the location is plugged and abandoned.
Stonehenge Appalachia and Williams Field Services operate in the midstream sector. Combining the various business name iterations and subsidiaries would be an enormous task, which we did not undertake here, with the exception of those near the top of the list. This includes Vantage Energy Appalachia, which was combined with records from Vantage Energy Appalachia II, and the compliance history of Rice Energy is the sum of three subsidiaries, the drilling company Rice Drilling B, and two pipeline companies, Rice Midstream Holdings and Rice Poseidon Midstream.
Table 2. Top 12 operators that have been assessed oil and gas-related fines by DEP since 2000
Operator
Total Fines
Conventional Permits
Unconventional Permits
Violations
Fines / Violation
Fines / Permit
Range Resources Appalachia LLC
$5,717,994
2,104
2,206
819
$6,982
$1,327
Chesapeake Appalachia LLC
$3,120,123
18
3,072
754
$4,138
$1,010
Rice Energy*
$2,336,552
442
165
$14,161
$5,286
Alpha Shale Res LP
$1,681,725
3
62
31
$54,249
$25,873
Stonehenge Appalachia LLC
$1,500,000
–
–
294
$5,102
–
Cabot Oil & Gas Corp
$1,407,275
19
902
726
$1,938
$1,528
CNX Gas Co LLC
$1,274,330
1,613
677
387
$3,293
$556
WPX Energy Appalachia LLC
$1,232,500
347
159
$7,752
$3,552
Chevron Appalachia LLC
$1,077,553
2
604
113
$9,536
$1,778
Vantage Energy Appalachia LLC**
$1,059,766
3
300
35
$30,279
$3,498
Williams Field Services Co, LLC
$872,404
–
–
158
$5,522
–
XTO Energy Inc
$739,712
1,962
461
383
$1,931
305
* Fines for Rice Energy here represent the sum of three subsidiaries, the drilling company Rice Drilling B, and two pipeline companies, Rice Midstream Holdings and Rice Poseidon Midstream.
** Fines for Vantage Energy Appalachia were combined with records from Vantage Energy Appalachia II.
Predictably, many of the entries on this list are among the most active drillers in the state, including Range Resources and Chesapeake Appalachia. However, Alpha Shale Resources has the dubious distinction of leading the pack with the highest amount of fines per violation, as well as the highest amount of fines per permit. Fitting in with the theme, the story here is complicated by the fact that Alpha had a joint venture with Rice, before selling them their stake in a group of wells and midstream operations that were fined $3.5 million by DEP.5 On this compliance report, the fines from this incident are split between the two companies.
Fines Issued Over Time
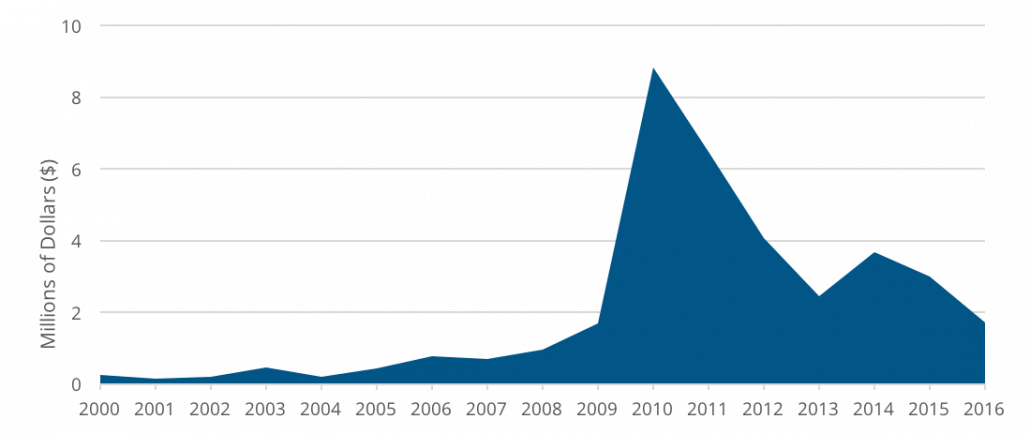
It is worth taking a look at how O&G related fines have varied over time, as well (Figure 1, shown in millions of dollars). Numerous factors could contribute to changes in trends, such as the number of available DEP inspectors,6 the amount of attention being paid to the industry in the media, differing compliance strategies employed by various political administrations, or changes in practices in the field, which could in turn be impacted by significant fines issued in the past.
Figure 1. O&G Fines Issued by DEP, 2000 through 2016
The notable spike in fines issued from 2010 to 2012 corresponds with the peak of unconventional drilling in the state – 4,908 of these industrial scaled wells were drilled during those three years, amounting to 48% of all unconventional wells in PA. In contrast, only 504 unconventional wells were drilled in 2016, or around a quarter of the total for 2011. In this context, the reduction in fines since the early part of the decade seems reasonable.
The association with the number of unconventional wells falls apart a bit in the years 2013 to 2014, however. These two years saw an average of 1,293 unconventional wells drilled, but the fines issued amounted to only 35% of the 2011 total.
Considerable strides have been made in the public accessibility of oil and gas data available from the PA DEP since FracTracker started requesting and reviewing this information in 2009. Still, there are many gaps in the datasets, such as geolocation details for 10 of the 20 largest fines issued by the department. FracTracker hopes external analyses like this one will help to close such gaps and identify operators who, too, need to improve their compliance records.
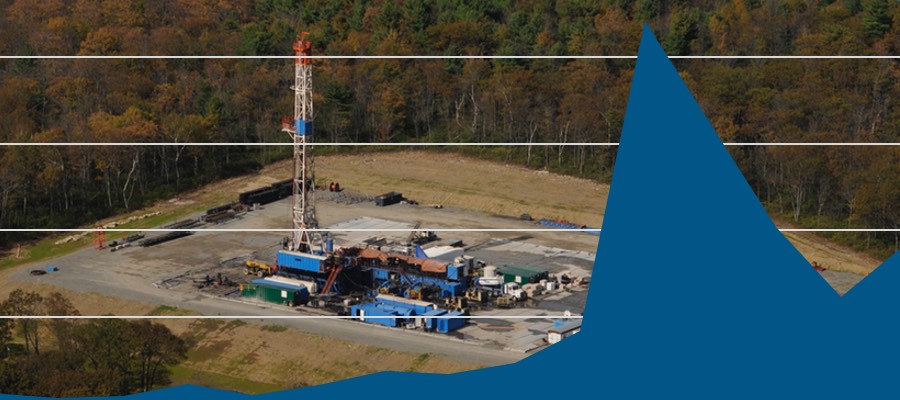
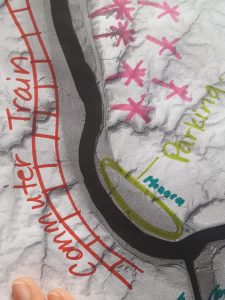
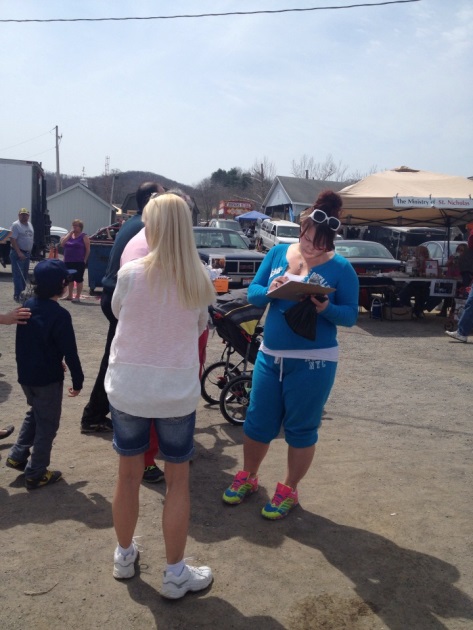
At a Re-Imagine Beaver County gathering in Pennsylvania earlier this month, static maps became dynamic in the hands of those who live in and around the region depicted. Residents of this area in the greater Pittsburgh region gathered to depict a new vision for Beaver County, PA. This county is currently faced with the proposal of a massive Shell-owned petrochemical facility – also called a “cracker” – and further build-out that could render the area a northern version of Louisiana’s “Chemical Corridor.” Participants at this event, from Beaver County and beyond, were encouraged to collectively envision a future based on sustainable development. The picture they created was one that welcomes change – but requires it to be sustainable and for the benefit of the community that makes it happen.
Figure 1: Participants study a map of Beaver County. Photo credit: Sophie Riedel.
Re-Imagine Beaver County Participants
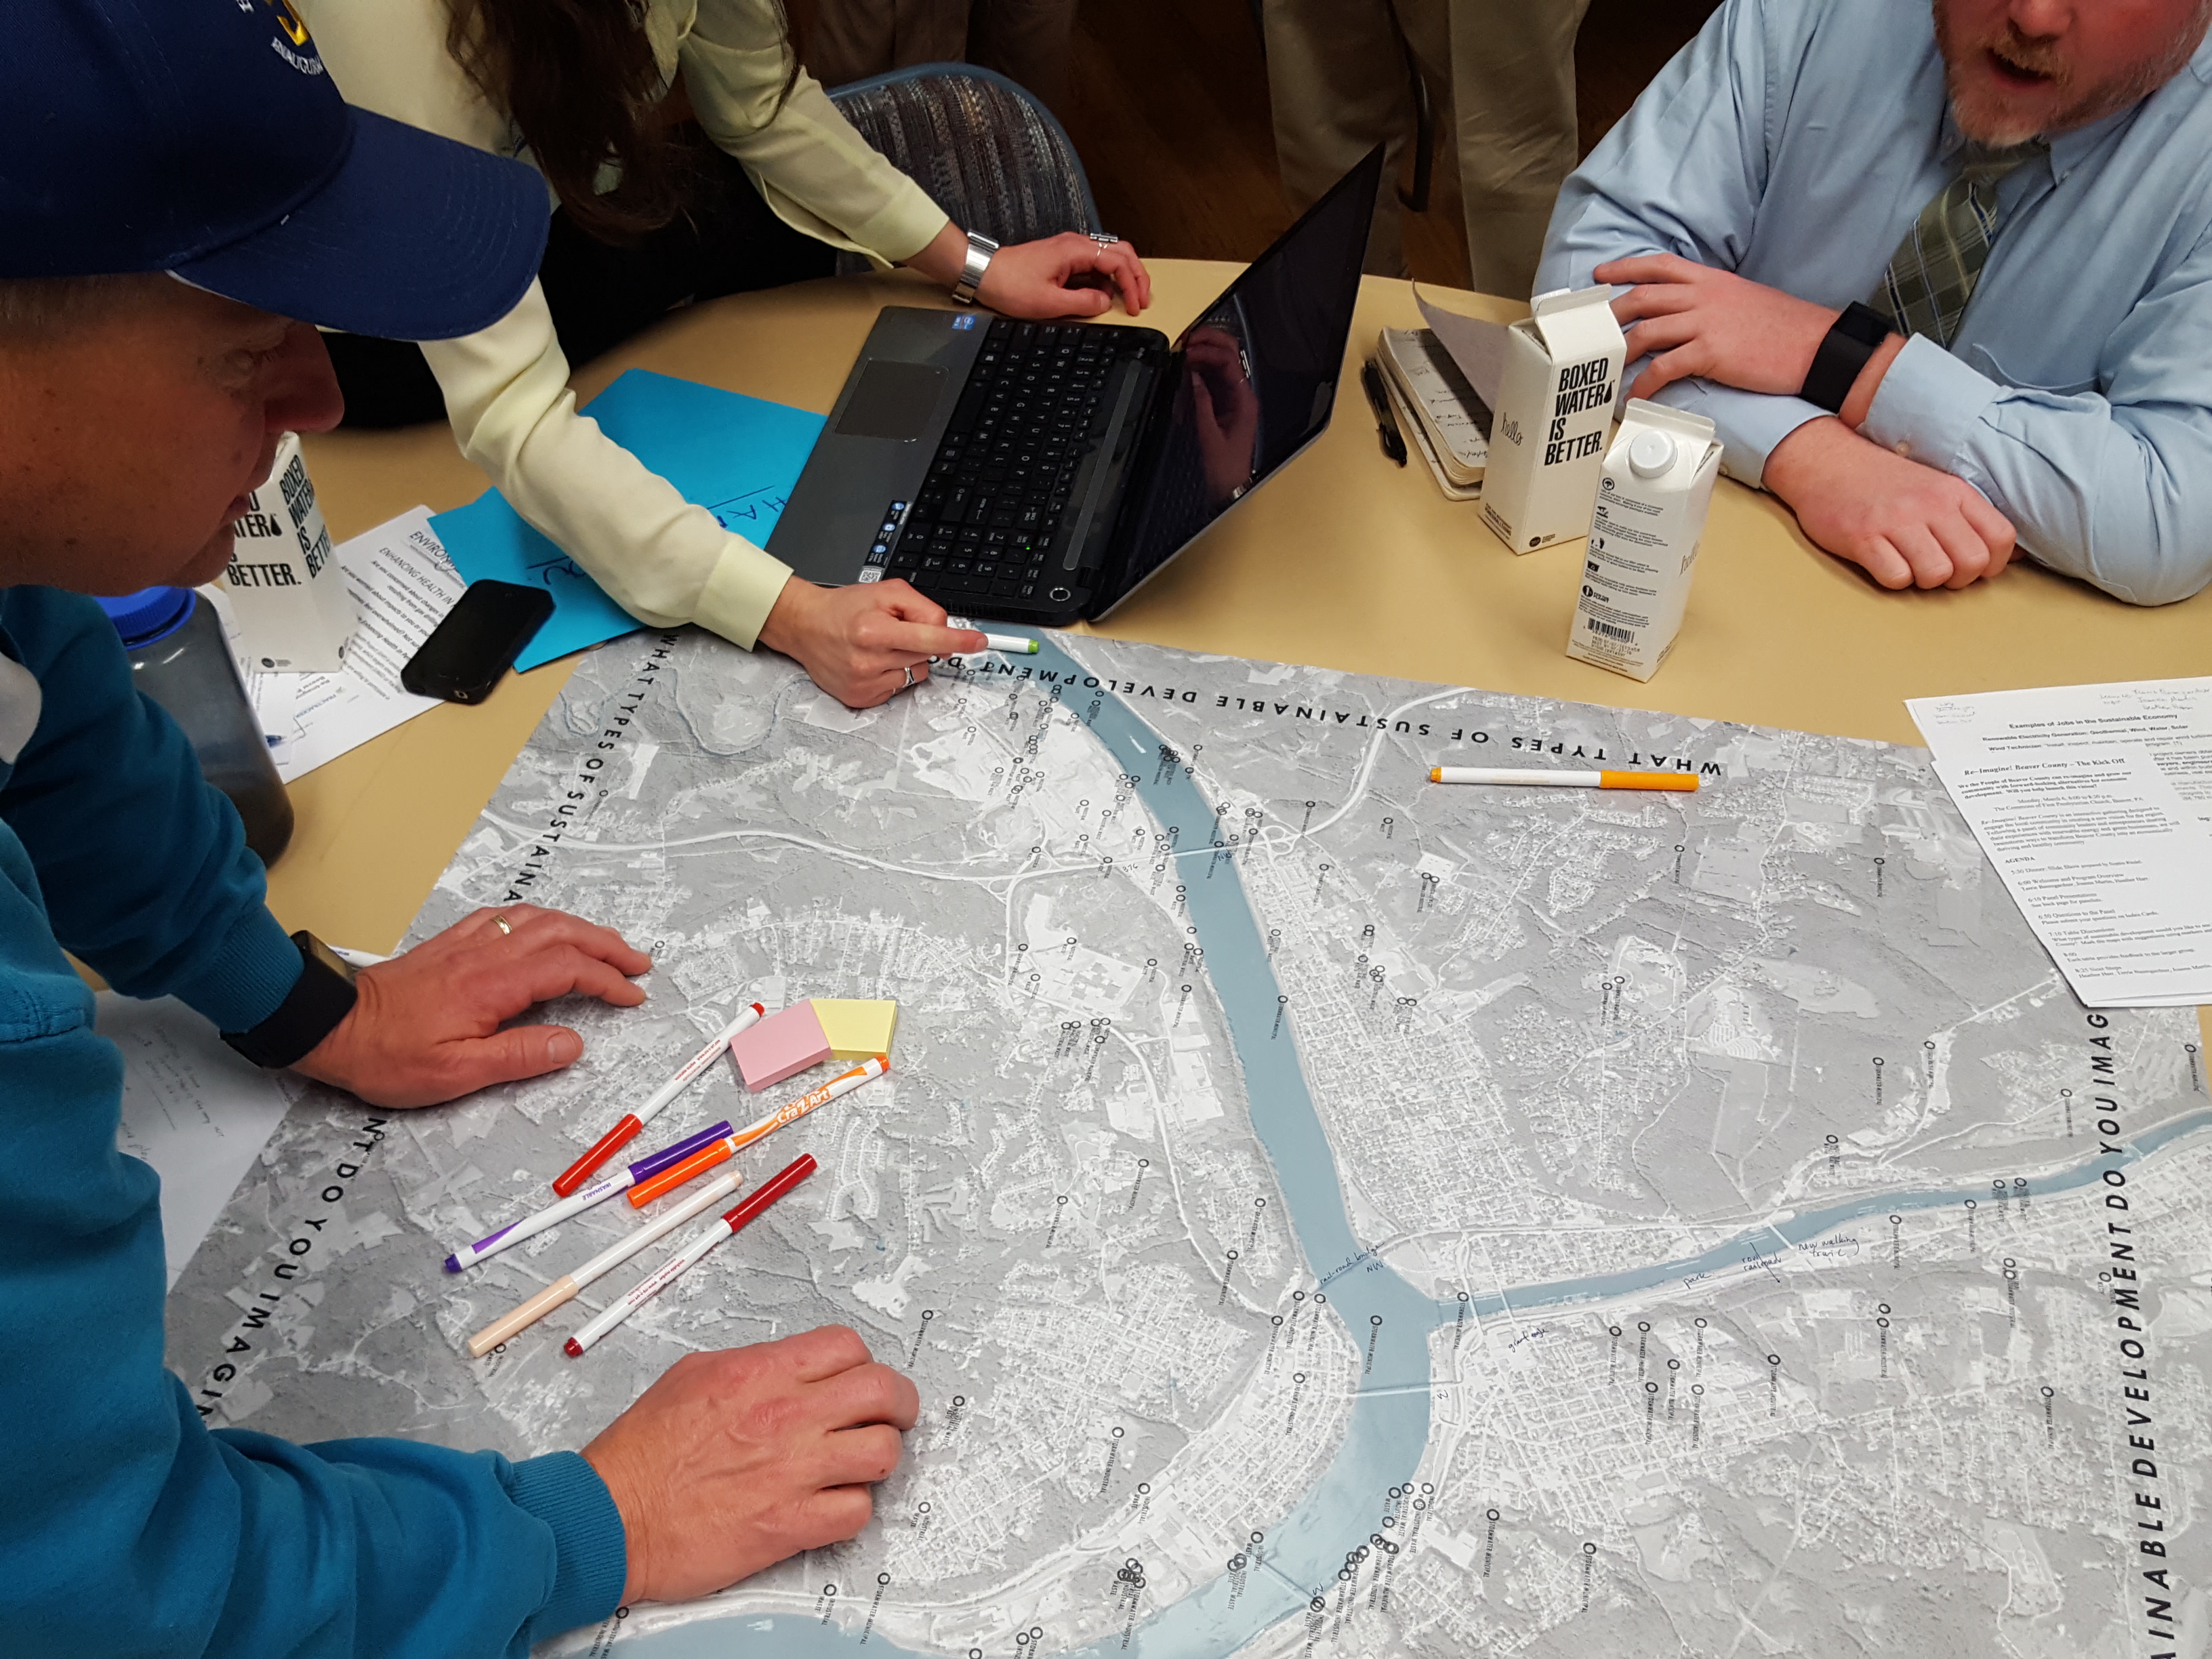
Panelists from municipal government, organic agriculture, and leaders and entrepreneurs of sustainable initiatives started off the event, sponsored by the League of Women Voters of Pennsylvania and endorsed by the Beaver County Marcellus Awareness Committee. After an hour, the room of 60 or so participants dove into the lively de- and re-construction of large format maps of the area. They were invited to markup the maps, created by Carnegie Mellon University graduate student of the School of Architecture, Sophie Riedel. Each table worked from a different base map of the same area – centering on the confluence of the Ohio and Beaver rivers, including the already heavily-industrialized riverside and the site of Shell’s proposed petrochemical facility.
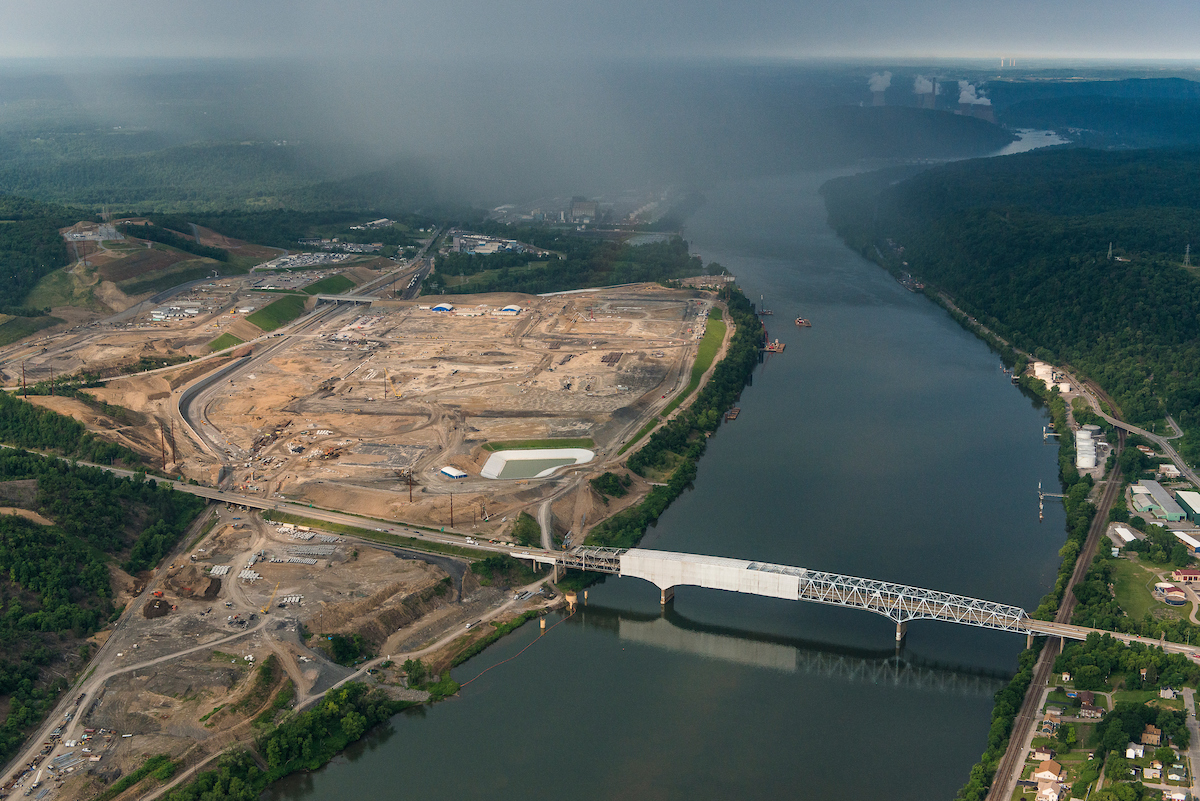
Figure 2: The site of the proposed petrochemical facility in Beaver County (on left) and the Ohio River that participants hope to see reinvented as a recreational waterway buttressed by public parks. Photo credit: Garth Lenz, iLCP.
Much more than a thought exercise, the gathering represented a timely response to a growing grassroots effort around the proposed petrochemical inundation. Changes are already underway at the site, and those who live in this region have the right to give input. This right is especially salient when considering the risks associated with the petrochemical industry – including detrimental health impacts on babies before they are even born, asthma exacerbation, and increased cancer rates.
Charting a new vision
The re-invented Beaver County would be one of increased connectivity and mobility, well-equipped to provide for local needs with local means.
Many ideas included on the maps reflected a longing for transportation options independent of personal vehicles – including better, safer, more connected bike trails and walking paths, use of existing rail lines for local travel, and even the inventive suggestion of a water taxi. These inherently lower-impact means of transport coincide with preferences of millennials, according to several of the panelists, who want more walkable, bikeable communities. Ushering in such sustainable suggestions would welcome more young families to an area with an aging population. More than just about moving people, transportation ideas also included ways to get locally grown foods to those who need it, such as the elderly.
Figure 3: Participants modify maps to reflect a new vision. Photo credit: Sophie Riedel.
The value of beauty was a subtheme in many of the ideas to connect and mobilize the population and goods, ideas which often held a dual aim of protecting open space, creating new parks, and offering recreation possibilities. Participants ambitiously reimagined their river, the Ohio, from its current status as a closed-off corridor for industrial usage and waste, to a recreational resource for kayaking and fishing walleye.
Participants marked up the maps to show the resources that help sustain this community, and voiced a strong desire for development that would enable additional self-reliance. These forward-thinking changes included increased agriculture and use of permaculture techniques, and community gardens for growing food near the people who currently lack access. Ideas for powering the region abounded, like harnessing wind power and putting solar panels on every new building.
Participants were firm on local sourcing for another key resource: the labor required for these efforts, they insisted, must come from the local populace. Educational programs designed to channel learners into workers for sustainability might include training to rebuild homes to “greener” standards, and programs aimed at bringing a new generation of farmers to the fields. Perhaps a nod to the world-wide plastic glut that a petrochemical facility would add to, suggestions even included local ways of dealing with waste, like starting a composting program and establishing more recycling centers.
Whose vision?
Who is a part of this vision, both in creating it and living it out? Inevitably, the selection of panelists and the interests of the audience members themselves influenced the vision this group crafted. The question of inclusion and representation found articulation among many participants, and the hosts of the event welcomed suggestions on reaching a broader audience moving forward. Looking around the room, one man asked, “Where are all the young people, and families with kids?” Indeed, only several members of this demographic were present. Though indicative of the racial makeup of Beaver County, the audience appeared to be primarily white, meaning that the racially diverse communities in the region where not represented. Others pointed out that going forward, the audience should also include those residents struggling with un- and underemployment, who have a major stake in whatever vision of Beaver County comes to fruition. Another said he would like to see more elected officials and leaders present. Notably, Potter Township Board of Supervisors Chairperson, Rebecca Matsco, who is a strong advocate for the proposed petrochemical project in her township, was present for the first half of the event.
Local means for meeting local needs
People who welcome petrochemical development in Beaver County might believe that those who voice concerns about the proposed Shell plant aren’t forward-thinking, or simply oppose change. Quite in contrast, participants at Re-Imagine Beaver County went to work reinventing their community with optimism and enthusiasm. They didn’t seem to be resisting change, but instead, wanting to participate in the process of change and to ultimately see benefits to their community. For example, discussion of solar power generated substantial excitement. According to panel speaker Hal Saville, however, the biggest challenge is making it affordable for everyone, which suggests that the estimated $1.6 billion in tax breaks going to Shell for the petrochemical plant could be better allocated.
A key narrative from supporters of the ethane cracker centers on the pressing need for jobs in this area, though some locals have expressed concern about how many of Shell’s promised jobs would go to residents. Whoever gets hired, these jobs come with serious dangers to workers. Participants at this event proposed alternative initiatives – both ambitious and small – for creating jobs within the community, like providing “sprout funds” to encourage new business start-ups, and launching a coordinated effort to rehab aging housing stock. These ideas suggest that the people of this region feel their energy and ingenuity would be best spent making Beaver County a better place to live and work, in contrast to producing disposable petrochemical products for export around the world. The fact that so many participants emphasized local means for meeting their needs in no way downplays the need for good jobs. Rather, it points to the fact that people want jobs that are good for them and for the future of their community.
Moving the vision forward
Where do we go from here? Can the momentum of this event draw in greater representation from the region to have a voice in this process? Will these visions become animated and guide the creation of a new reality? Broader and deeper planning is in order; participants and panelists alike pointed to tools like comprehensive community plans and cleaner, “greener” industrial policies. More than anything, the group articulated a need for more deliberation and participation. As panelist and farm co-owner Don Kretschmann put it, when it comes to change, we need to “think it through before we go ahead and do it.”
The maps themselves, bearing the inspirations scrawled out during the event, have not reached the end of the road. From here, these maps will accompany an upcoming exhibition of the artworks in Petrochemical America, which locals hope to bring to the greater Pittsburgh area in the coming months. League of Women Voters, for their part, continue to move the vision forward, inviting input from all on next steps, with an emphasis on pulling in a broader cross-section of the community.
To voice your vision, and to stay in the loop on future Re-Imagine Beaver County events, contact reimaginelwvpa@gmail.com.
https://fractracker.org/wp-content/uploads/2017/03/Re-Imagine-Beaver-Feature-Riedel.jpg400900FracTracker Alliancehttps://fractracker.org/wp-content/uploads/2025/09/2025-Wordmark-Logo.pngFracTracker Alliance2017-03-24 09:11:252021-04-15 15:03:37Mapping a new vision in PA: Alternatives to petrochemical development
An Ottawa, IL resident’s letter to U.S. Silica regarding how the firm’s “frac” sand mines adjacent to Starved Rock State Park will alter the local economy.
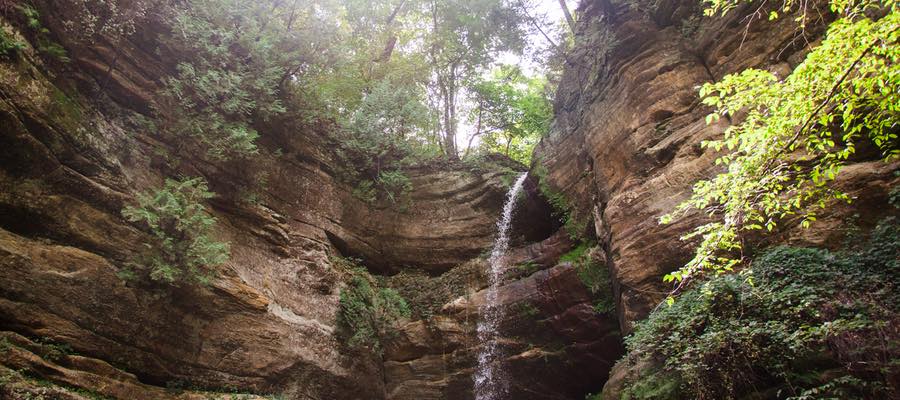
Starved Rock State Park
As is so often the case, we find that those things we have taken most for granted are usually the things we miss most when they are gone. The list of what our nation has lost to industrial and commercial concerns couldn’t possibly be compiled in a single article. The short-sighted habits of economic progress have often led to long-term loss and ecologic disaster. That is why it took a man like Abraham Lincoln, a man of long-term vision and wisdom, to sign into existence our first national park, preserving for antiquity what surely would have been lost to our American penchant for development and overuse.
With that in mind, I have always found it amazing how the gears of our own local and state governments have continually chosen the economic path of least resistance and allowed the areas surrounding Starved Rock State Park to be ravaged and destroyed for what is, ultimately, minimal gain. I am no expert but I suspect it could be argued that a full 1/3 of LaSalle County’s economic engine is funded by the simple existence of Starved Rock State Park. Beyond the 2 million plus visitors to the park each year, it cannot be forgotten that nearly every municipality in LaSalle County has directly or indirectly benefited from the countless number of businesses that prosper from the magnetism of the park’s tranquil canyons.
As the 4-year battle with Mississippi Sand over development of the Ernat property has proved, there are many rational souls who truly acknowledge the importance of maintaining a healthy and productive park environment. With the recent sale of the Ernat property to U.S. Silica, we are again confronted with the prospect of irrational development of the eastern boundaries of Starved Rock State Park.
Given the gravity of these decisions, I would like to share a letter recently sent on behalf of many of those who have fought so hard and so long for preservation of that same eastern boundary. This letter was sent to Brian Shinn, CEO of U.S. Silica Holdings, INC. (SLCA) in Frederick, Maryland nearly a month ago, and we have yet to receive a response. In sharing this information on FracTracker’s website, I hope this letter will contribute to further discussion among our local representatives over a far more long-term vision of what LaSalle County wishes to be and what qualities, both environmental and economic, that it wishes to maintain and protect:
Letter to US Silica
Dear Mr. Shinn,
I am writing this letter on behalf of dozens of LaSalle County, Illinois residents who have, for the past several years, been intimately involved in the active pursuit of rational use and conservation of our local natural environment. As I am sure you are aware, the debate over use of the Ernat property as a functional sand mining operation has been a long and hard-fought battle. Years of litigation by the Sierra Club and other local environmental groups helped stall it’s development by Mississippi Sand, and have now led to the sale of the Ernat acreage to U.S. Silica. As irrational as the previous proposals were, the sale putting that acreage under your control has not lessened our concerns over the damaging use of that property as it relates to historic Highway 71 and the entire Starved Rock State Park area.
Obviously, sand mining operations have been a long-standing component of LaSalle County economics. Decades of mining under U.S. Silica supervision have not substantially reduced the quality of life for county residents or the natural environment as a whole. However, as can be specified by many local experts, the development and spoilage of the Ernat property will most certainly have longstanding and drastic impacts on both the ecology of Starved Rock State Park and the economic engine that it sustains. Starved Rock State Park attracts over 2 million visitors each year, with an estimated half million visitors using the Hwy. 71 entrance paralleling the Ernat farm as their main gateway into the park. The Ernat property’s river frontage has long been the tranquil eastern entry into the Illinois Canyon area, as well as an active nesting site for countless birds amidst bountiful wetlands and flat, open prairies. The Ernat property’s shared access to Horseshoe Creek has also made it essential to the entire Illinois Canyon ecosystem within the park. In short, any development of this property will most certainly have long-term negative impacts on both the economics and ecology of the Illinois River Basin.
In writing this letter, we are hoping that U.S. Silica, under your guidance, may consider the opportunity to preserve this indispensable parcel of land and examine ways in which U.S. Silica might make this land available as a gift or negotiated property to the state of Illinois. It would certainly be an important addition to the entire Starved Rock State Park area. I have included the signatures of many of our own local coalition. We hope you will consider the long-term impacts that this development would have to one of Illinois premier natural areas. Thank you.
Inspiring Action
I hope those who have signed this letter will be inspired to further action, and those who have not will reconsider their years of inaction. The natural heritage and local economies of our entire Illinois River Basin are depending on it.
Sincerely,
Paul Wheeler
Only when the last tree has died… and the last river been poisoned… and the last fish been caught… will we realize we cannot eat money.
https://fractracker.org/wp-content/uploads/2016/08/StarvedRock-McCray-Feature.jpg400900Guest Authorhttps://fractracker.org/wp-content/uploads/2025/09/2025-Wordmark-Logo.pngGuest Author2016-08-29 16:47:202020-03-11 16:46:26How Frac Sand Mining is Altering an Economy Dependent on Starved Rock State Park, IL
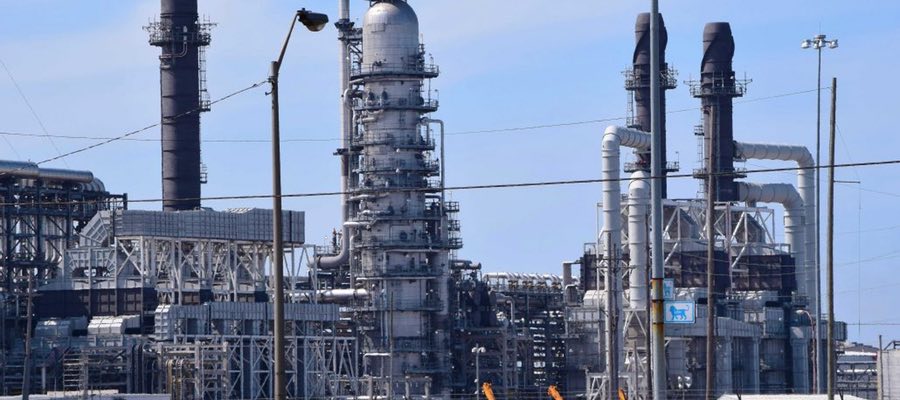
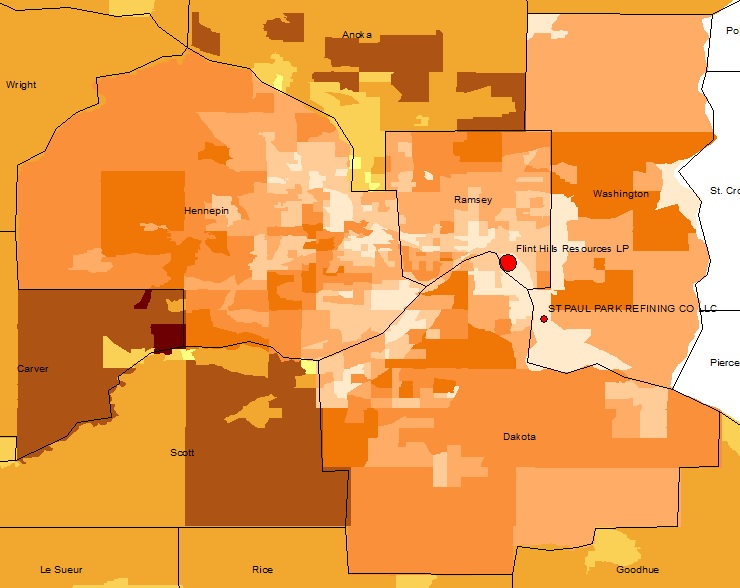
How annual incomes in the shadow of oil refineries compare to state and regional prosperity
Figure 1. North American Oil Refinery Capacity
Typically, we analyze the potential economic impacts of oil refineries by simply quantifying potential and/or actual capacity on an annual or daily basis. Using this method, we find that the 126 refineries operating in the U.S. produce an average of 100,000-133,645 barrels per day (BPD) of oil – or 258 billion gallons per year.
In all of North America, there are 158 refineries. When you include the 21 and 27 billion gallons per year produced by our neighbors to the south and north, respectively, North American refineries account for 23-24% of the global refining capacity. That is, of course, if you believe the $113 dollar International Energy Agency’s 2016 “Medium-Term Oil Market Report” 4.03 billion gallon annual estimates (Table 1 and Figure 1).
Table 1. Oil Refinery Capacity in the United States and Canada (Barrels Per Day (BPD))
Prince George & Moose Jaw Refining in BC and SK, 12-15K BPD
Pemex’s Ciudad Madero Refinery, 152K BPD
—
High
Exxon Mobil in TX & LA, 502-560K BPD
Valero and Irving Oil Refining in QC & NS, 265-300K BPD
Pemex’s Tula Refinery, 340K BPD
—
Median
100,000 BPD
85,000 BPD
226,500
109,000
Total Capacity
16.8 MBPD
1.8 MBPD
1.4 MBPD
22.1 MBPD
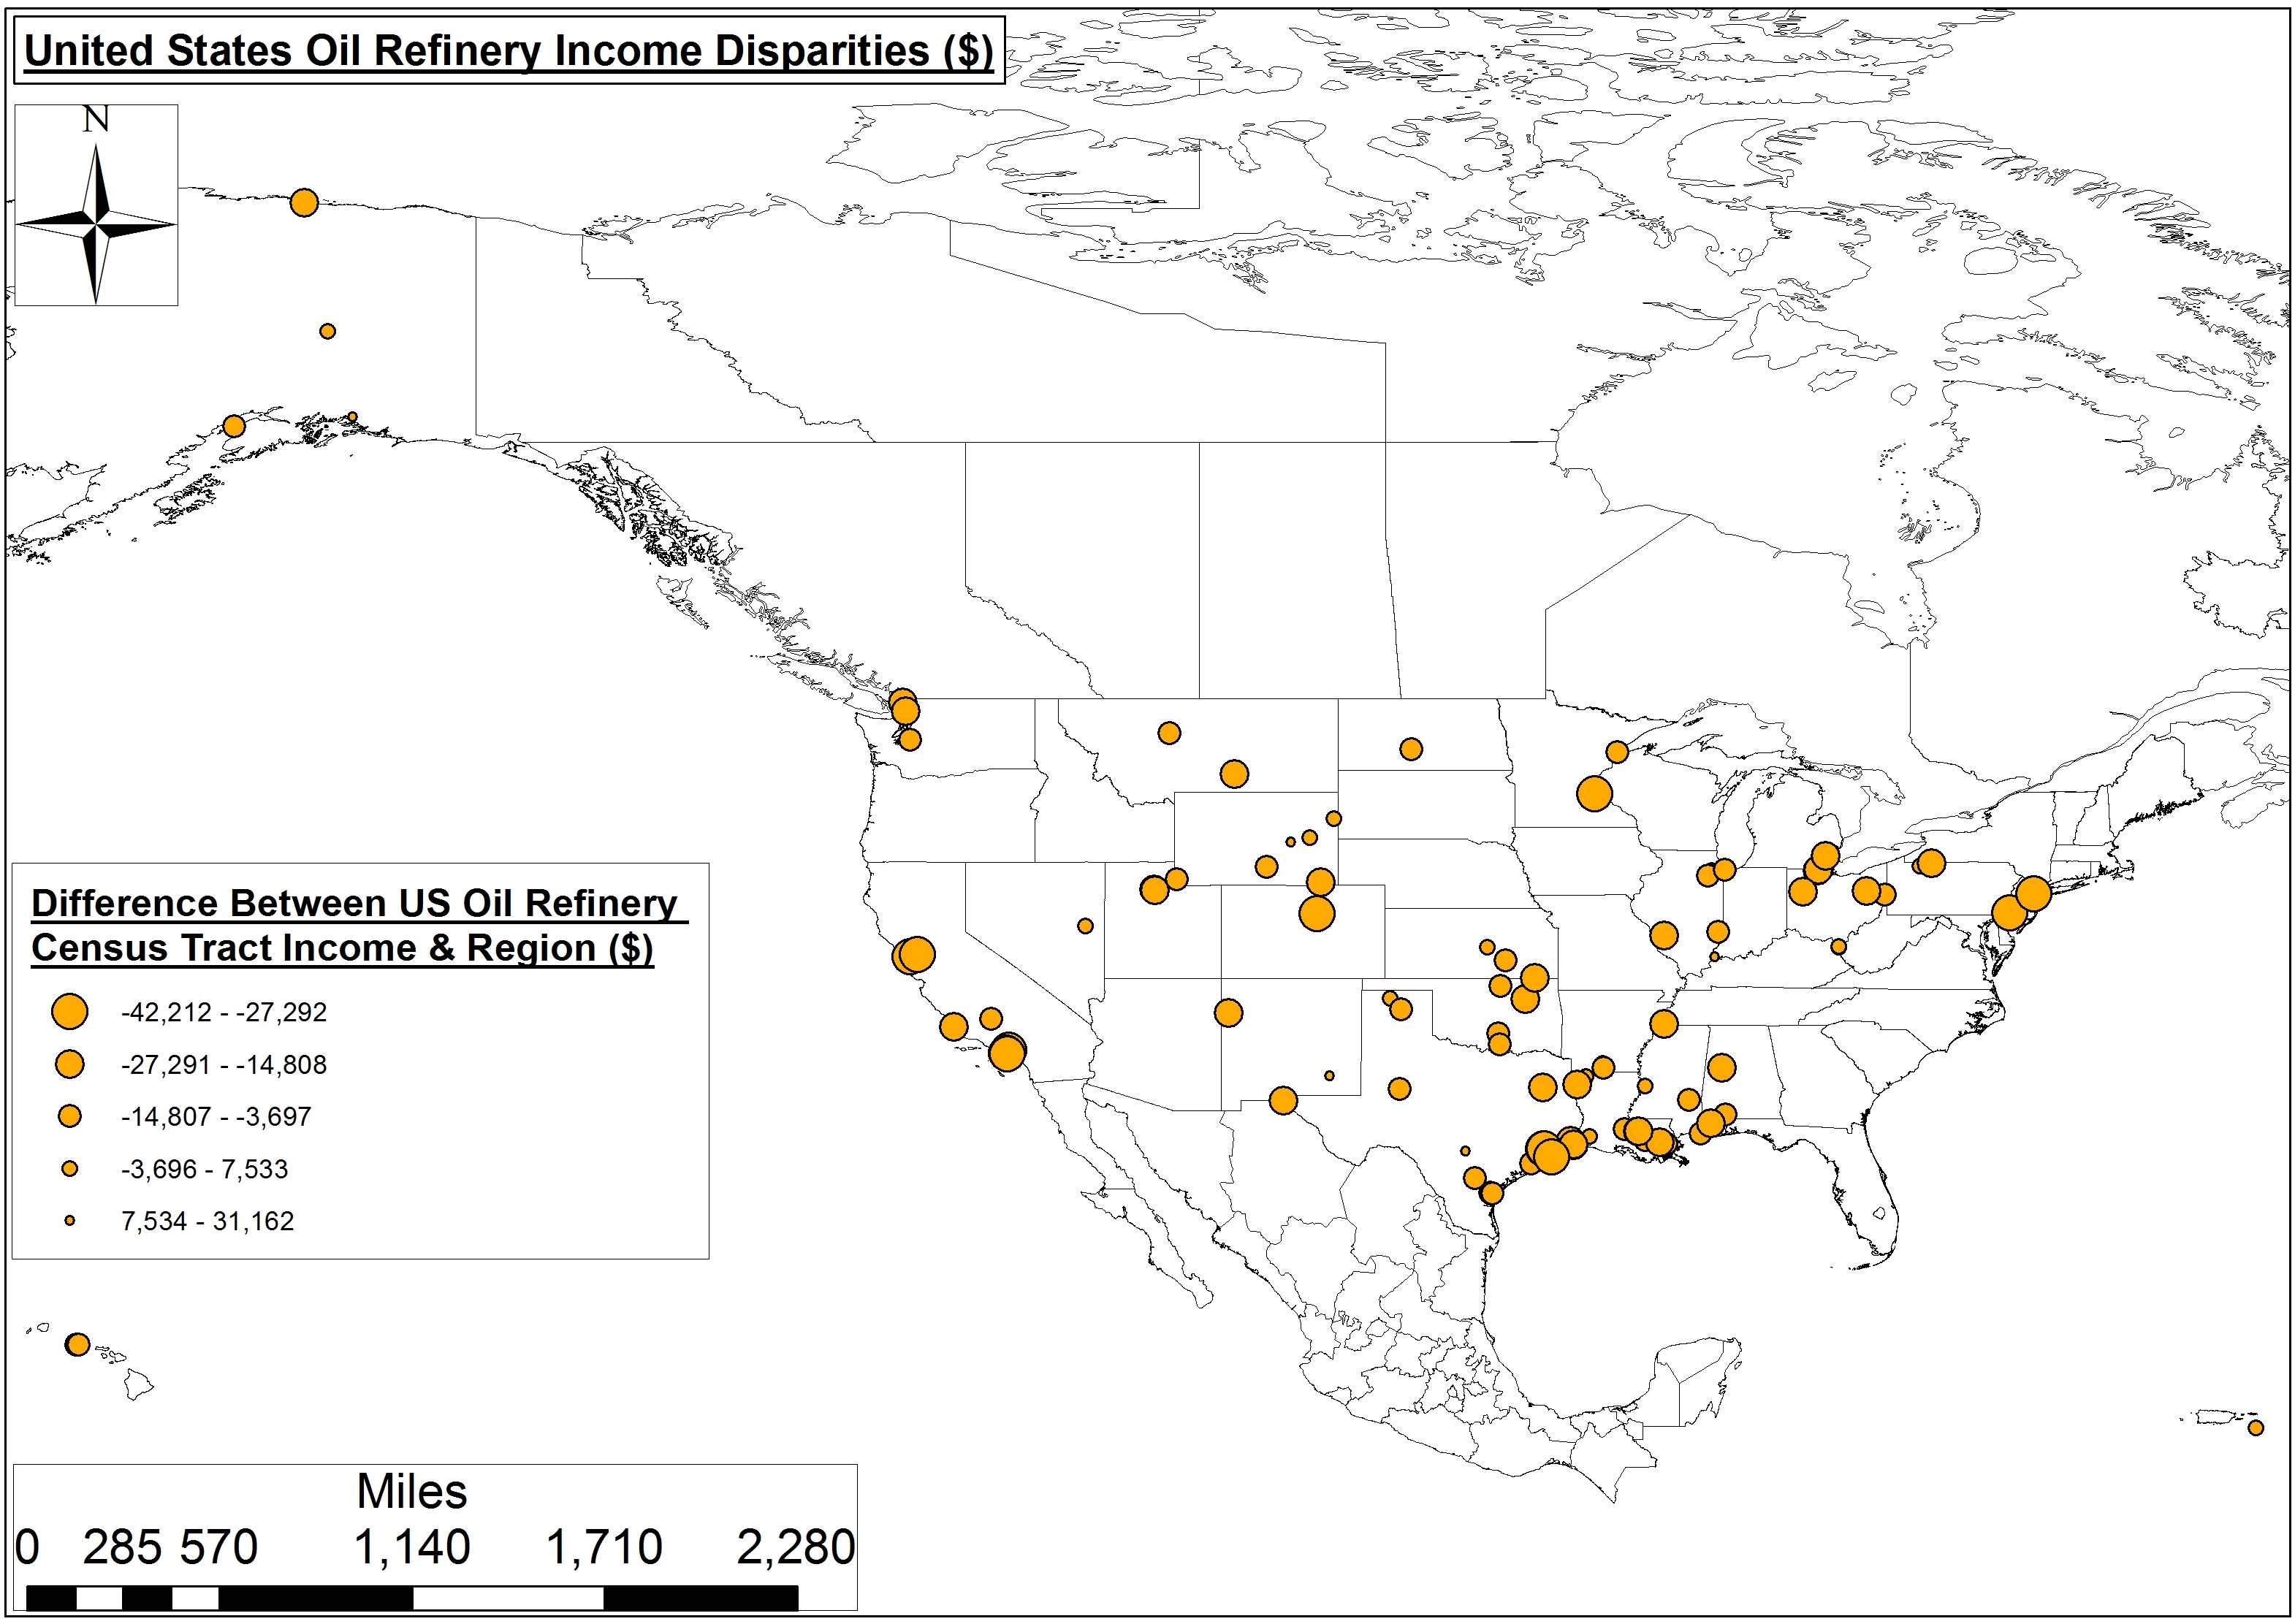
Census Tract Income Disparities
However, we would propose that an alternative measure of a given oil refinery’s impact would be neighborhood prosperity in the census tract(s) where the refinery is located. We believe this figure serves as a proxy for economic justice. As such, we recently used the above refinery location and capacity data in combination with US Census Bureau Cartographic Boundaries (i.e., Census Tracts) and the Census’ American FactFinder clearinghouse to estimate neighborhood prosperity near refineries.
Methods
Our analysis involved merging oil refineries to their respective census tracts in ArcMAP 10.2, along with all census tracts that touch the actual census tract where the refineries are located, and calling that collection the oil refinery’s sphere of influence, for lack of a better term. We then assigned Mean Income in the Past 12 Months (In 2014 Inflation-Adjusted Dollars) values for each census tract to the aforementioned refinery tracts – as well as surrounding regional, city, and state tracts – to allow for a comparison of income disparities. We chose to analyze mean income instead of other variables such as educational attainment, unemployment, or poverty percentages because it largely encapsulates these economic indicators.
In today’s world, the enormous gap in the distribution of wealth, income and public benefits is growing ever wider, reflecting a general trend that is morally unfair, politically unwise and economically unsound… excessive income inequality restricts social mobility and leads to social segmentation and eventually social breakdown…In the modern context, those concerned with social justice see the general increase in income inequality as unjust, deplorable and alarming. It is argued that poverty reduction and overall improvements in the standard of living are attainable goals that would bring the world closer to social justice.
Environmental regulatory agencies like to separate air pollution sources into point and non-point sources. Point sources are “single, identifiable” sources, whereas non-point are more ‘diffuse’ resulting in impacts spread out over a larger geographical area. We would equate oil refineries to point sources of socioeconomic and/or environmental injustice. The non-point analysis would be far more difficult to model given the difficulties associated with converting perceived quality of life disturbance(s) associated with infrastructure like compressor stations from the anecdotal to the empirical.
Results
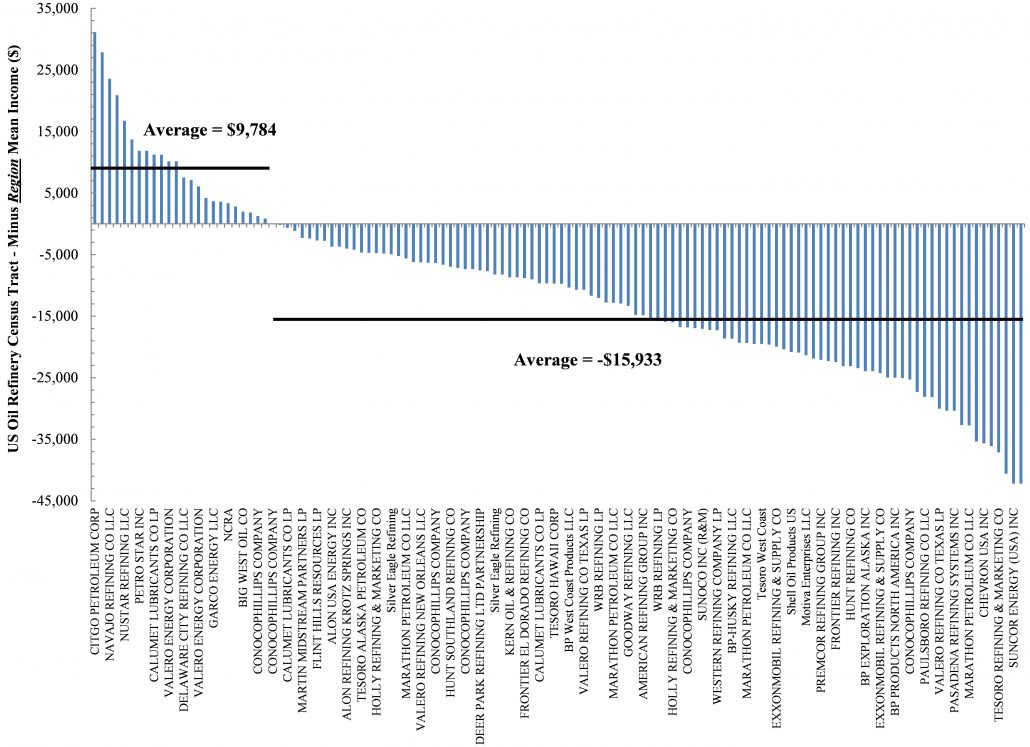
Primarily, residents living in the shadow of 80% of our refineries earn nearly $16,000 less than those in the surrounding region – or, in the case of urban refineries, the surrounding Metropolitan Statistical Areas (MSAs). Only residents living in census tracts within the shadow of 25 of our 126 oil refineries earn around $10,000 more annually than those in the region.
On average, residents of census tracts that contain oil refineries earn 13-16% less than those in the greater region and/or MSAs (Figure 2). Similarly, in comparing oil refinery census tract incomes to state averages we see a slightly larger 17-21% disparity (Figure 3).
Digging Deeper
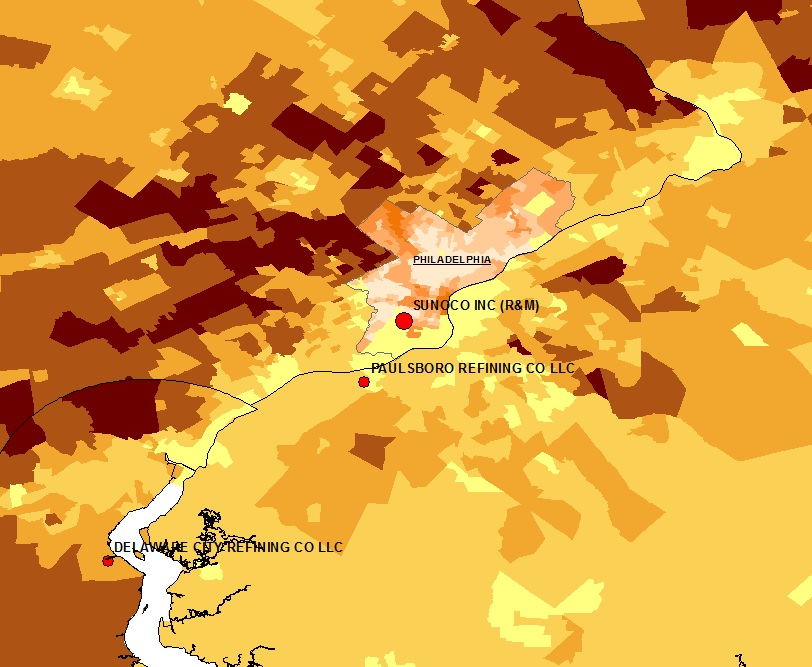
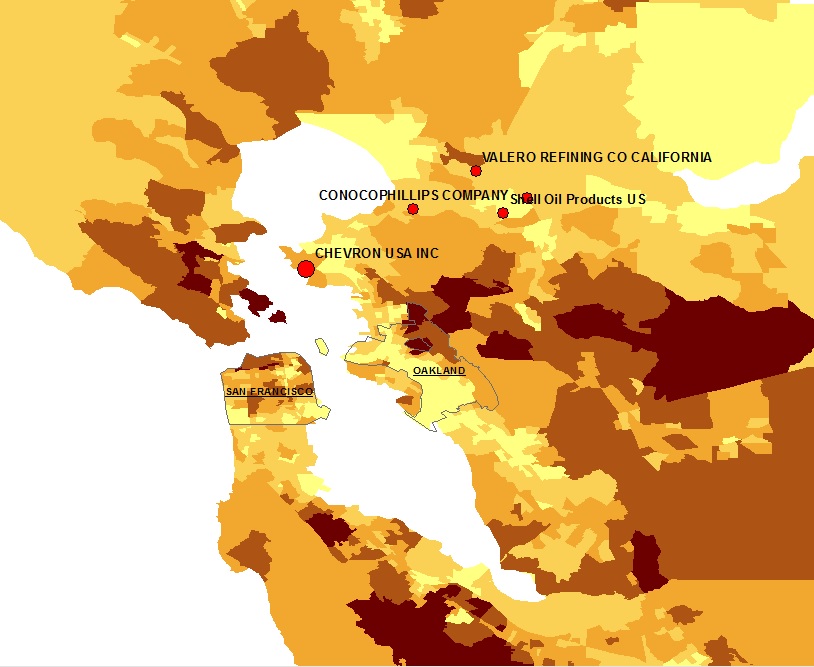
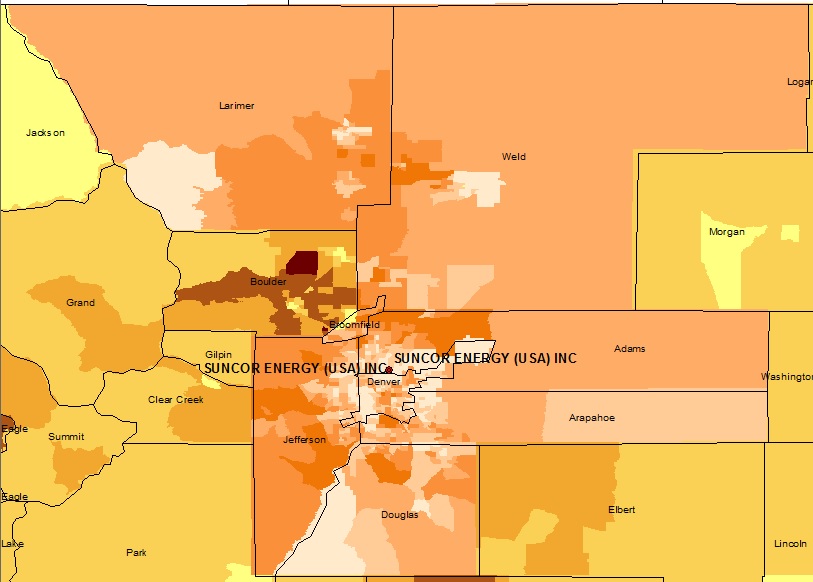
Figure 4. United States Oil Refinery Income Disparities (Note: Larger points indicate oil refinery census tracts that earn less than the surrounding region or city.)
Oil refinery income disparities seem to occur not just in one region, but across the U.S. (Figure 4).
The biggest regional/MSA disparities occur in northeastern Denver neighborhoods around the Suncor Refinery complex (103,000 BPD), where the refinery’s census tracts earn roughly $42,000 less than Greater Denver residents1. California, too, has some issues near its Los Angeles’ Valero and Tesoro Refineries and Chevron’s Bay Area Refinery, with a combined daily capacity of nearly 600 BPD. There, two California census associations in the shadow of those refineries earn roughly $38,000 less than Contra Costa and Los Angeles Counties, respectively. In the Lone Star state Marathon’s Texas City, Galveston County refinery resides among census tracts where annual incomes nearly $33,000 less than the Galveston-Houston metroplex. Linden, NJ and St. Paul, MN, residents near Conoco Phillips and Flint Hills Resources refineries aren’t fairing much better, with annual incomes that are roughly $35,000 and nearly $33,000 less than the surrounding regions, respectively.
Click on the images below to explore each of the top disparate areas near oil refineries in the U.S. in more detail. Lighter shades indicate census tracks with a lower mean annual income ($).
Conclusion
Clearly, certain communities throughout the United States have been essentially sacrificed in the name of Energy Independence and overly-course measures of economic productivity such as Gross Domestic Product (GDP). The presence and/or construction of mid- and downstream oil and gas infrastructure appears to accelerate an already insidious positive feedback loop in low-income neighborhoods throughout the United States. Only a few places like Southeast Chicago and Detroit, however, have even begun to discuss where these disadvantaged communities should live, let alone how to remediate the environmental costs.
Internally Displaced People
There exists a robust history of journalists and academics focusing on Internally Displaced People (IDP) throughout war-torn regions of Africa, the Middle East, and Southeast Asia – to name a few – and most of these 38 million people have “become displaced within their own country as a result of violence.” However, there is a growing body of literature and media coverage associated with current and potential IDP resulting from rising sea levels, drought, chronic wildfire, etc.
The issues associated with oil and gas infrastructure expansion and IDPs are only going to grow in the coming years as the Shale Revolution results in a greater need for pipelines, compressor stations, cracker facilities, etc. We would propose there is the potential for IDP resulting from the rapid, ubiquitous, and intense expansion of the Hydrocarbon Industrial Complex here in the United States.
The below industry quote divides the world into two camps when it comes to horizontal hydraulic fracturing: those who are for it and those who are against it:
Fracking has emerged as a contentious issue in many communities, and it is important to note that there are only two sides in the debate: those who want our oil and natural resources developed in a safe and responsible way; and those who don’t want our oil and natural gas resources developed at all. – Energy from Shale (an industry-supported public relations website)
The writer imagines a world in black and white – with a clear demarcation line. In reality, it is not so simple, at least not when talking to the people who actually live in the Ohio towns where fracking is happening. They want the jobs that industry promises, but they worry about the rising costs of housing, food, and fuel that accompany a boomtown economy. They want energy independence, but worry about water contamination. They welcome the opening of new businesses, but lament the constant rumble of semi-trucks down their country roads. They are eager for economic progress, but do not understand why the industry will not hire more locals to do the work.
In short, the situation is complicated and it calls for a comprehensive response from Ohio’s local and state policy makers.
Through hefty campaign contributions and donations to higher learning institutions, the oil and gas industry exerts undue influence on Ohio’s politics and academic institutions. Many media outlets covering the drilling boom also have ties to the industry. Therefore, industry has been able to control the message and the medium. Those who oppose oil and gas in any way are painted as radicals. Indeed, some of Ohio’s most dedicated anti-fracking activists are unwavering in their approach. But most of the people living atop the Utica Shale simply want to live peacefully. Many would be willing to co-exist with the industry if their needs, concerns, and voices were heard.
This project attempts to give these Ohioans a voice and outsiders a more accurate representation about life in the Utica Shale Basin. The report does not engage in the debate about whether or not fracking should occur – but, rather, examines the situation as we currently find it.
Listening Project Summary
The Ohio Shale Country Listening Project is a collaborative effort to solicit, summarize, and share the perspectives and observations of those directly experiencing the shale gas boom in eastern Ohio. The project is led by the Ohio Organizing Collaborative (OOC)’s Communities United for Responsible Energy (CURE), with support from the Ohio Environmental Council (OEC), FracTracker Alliance, and the Laborers Local 809 of Steubenville. Policy Matters Ohio and Fair Shake Environmental Legal Services offered resources and time in drafting the final policy recommendations.
Over the course of six months, organizers from the Laborers Local 809 and OOC worked with a team of nearly 40 volunteers to survey 773 people living in the heart of Utica Shale country. Respondents are from eastern Ohio, ranging from as far north as Portage County to as far south as Monroe County. A small number of respondents hail from across the border in West Virginia and Pennsylvania, but the overwhelming majority are from Carroll (321), Columbiana (230), Jefferson (70), Harrison (30) and Belmont (28) counties.
Respondents were asked to talk about their family and personal history in the community where they live, their favorite things about their community and what changes they have noticed since the arrival of shale gas drilling using horizontal hydraulic fracturing or fracking. They were also asked to describe their feelings about oil and gas development as either positive or negative and what they believed their community would be like once the boom ends. Finally, respondents were also asked how concerned or excited they are about 11 possible outcomes or consequences of fracking.
Summary of Recommendations
Create incentives for companies to hire local workers; and increase transparency about who drilling and subcontracting companies are employing
Tax the oil and gas industry fairly with a severance tax rate of at least 5%; use this revenue to support affected communities to mitigate the effects of the boom and bust cycle
Increase the citizen participation in county decision-making on how additional sales tax or severance tax revenue is spent and how the county deals with the effects of the drilling boom
Increase transparency around production and royalties for landowners and the public
Set aside funding at the local level for air and water monitoring programs
Mitigate noise and emissions as much as possible with mandatory sound barriers and green completion on all fracking wells
Create mechanisms to protect sensitive areas from industry activity
Levy municipal impact fees to address issues associated with drilling
Better protect landowners during leasing negotiation process and from potential loss of income due to property damage
Conclusion
The more shale gas wells a community has, the less popular the oil and gas industry appears to be. Carroll County is the most heavily drilled county in Ohio, and more than half the respondents said they view the drilling boom negatively. Moreover, many residents say they are not experiencing the economic benefits promised by the oil and gas industry. They see rent, cost of gas, and groceries rising as the drilling and pipeline companies hire workers from out of state and sometimes even out of the country. Residents see more sales tax revenue coming into their counties but also see their roads destroyed by large trucks. They say they are experiencing more traffic delays and accidents than ever before. Ohioans love their community’s pastoral nature but are watching as the landscape and cropland get destroyed. As it is playing out now, the boom in shale gas drilling is not fulfilling the promises made by industry. Locals feel less secure and more financially strapped. Many feel their towns will soon be uninhabitable. It is up to state and local governments to hold industry accountable and make it pay for the impacts it creates.
The Ohio Shale Country Listening Project started in February 2014 with a conversation between Ohio Organizing Collaborative (OOC) staff and a veteran organizer who once worked on mountain top removal in a large region of West Virginia. The OOC organizer lamented the difficulty of organizing across a large geography around a specific issue – in this case, fracking. How do you find out what the people want without dictating to the community? The more experienced organizer immediately responded: What about a listening project? She connected OOC to the Shalefield Organizing Project in Pennsylvania whose organizers helped OOC think through what a listening project might look like in Ohio.
The project took on several iterations. First, OOC planned to focus the listening project solely on Columbiana County, which at the time was the third most fracked county in Ohio. Next, community leaders in Carroll County, the most heavily drilled county in the state, suggested the project also focus there. Eventually, as it became clear that the shale play was moving further south in Ohio, the project expanded into other counties such as Belmont, Harrison, and Jefferson. While attending a public hearing on pipeline construction in Portage County, OOC staff met an organizer from the Laborers Local 809 out of Steubenville. The organizer expressed interest in joining the project. Meanwhile, OOC had been in discussions with the Ohio Environmental Coalition (OEC) about the need to share the stories of people living in the middle of a fracking boom. OEC agreed to join the project. Finally, FracTracker also came into the fold, eager to assist in analyzing and mapping data gathered during the effort.
A listening project volunteer surveys a shopper at Rogers Open Air Market
OOC staff solicited the help from about 40 volunteers to form the “Listening Project Team” who surveyed their friends, family, coworkers, and neighbors. Volunteers met four times over the course of six months to discuss the project and strategize about how to reach more people with the survey. Most of the volunteer team came from Columbiana and Carroll Counties. The Laborers Local 809 also distributed the surveys to their members. Members of the team canvassed neighborhoods, attended local festivals, set up a booth at Rogers Open Air Market (photo left) and distributed an online version of the survey through Facebook and email. OOC staff spoke at college classes at Kent State-Salem and Kent State-East Liverpool, and solicited input from students in attendance.
The project’s initial goal was to hit a target of 1,000 – 1,500 survey responses. In the end the team fell short of this number, but were able to reach 773 people living in the Utica Shale area. This barrier is mostly due to the rural nature of the communities surveyed, which makes it more difficult to reach a large number of people in a short timeframe. The most responses came from Carroll County – 321 surveys. Columbiana County represented the second largest group of respondents with 230 surveys. Seventy people from Jefferson County, 30 people from Harrison County, 28 from Belmont County filled out the survey. The final 80 responses came from Mahoning, Stark, Summit and Tuscarawas Counties. Finally, nearly fifty responses came from Pennsylvania and West Virginia residents who live along the Ohio border (see Figure right). We promised survey respondents that all names and information would be kept confidential with survey responses presented only in aggregate.
https://fractracker.org/wp-content/uploads/2016/01/Listening-Feature-1.jpg400900Ted Auch, PhDhttps://fractracker.org/wp-content/uploads/2025/09/2025-Wordmark-Logo.pngTed Auch, PhD2016-01-08 12:01:222020-03-12 13:38:15Ohio Shale Country Listening Project Part 1
By Ted Auch, Kyle Ferrar, and Samantha Rubright with Max Gruenig
Fourteen days is not nearly enough time to fully understand the complex differences between oil and gas drilling issues and policies in the United States and several European Union countries. The EU’s drilling policies, geography, and the industry’s level of activity are quite distinct from those of the States in some cases. Still, as part of the Our Energy Solutions project, four staff from FracTracker Alliance and Ecologic Institute attempted to understand and share as many lessons-learned in Europe as we could in the first two weeks of September. Our interest covered all aspects of oil and gas development, but focused on those relating to the use of stimulation techniques (hydraulic fracturing – fracking) in unconventional reservoirs. Even with significant differences between the US and EU, there is still much to be gleaned in sharing our regulatory approaches, community concerns, and environmental challenges.
“Chaos is merely order waiting to be deciphered” ― José Saramago, The Double
London, England Meetings
The House of Commons meeting was held in Parliament, just below London’s Big Ben. Photo by Sam Rubright
Our European tour started in London with Ecologic Institute’s Max Gruenig. The first stop was a meeting with University of Salford Professor of Regeneration and Sustainable Development Erik Bichard outside of The Palace of Westminster. Erik has worked extensively to understand and chronicle common threads that weave together community response(s) to hydraulic fracturing (fracking) proposals. Much of Erik’s research in the UK has focused on the efforts of the leading shale gas extraction company in the EU, Cuadrilla Resources, to employ hydraulic fracturing technologies, as well as local oppositions to this development. The major points of contention are in Lancashire County, Northwest England and Balcombe in West Sussex. Erik pointed to the fact that Cuadrilla admitted their claims that the 4% decline in UK energy cost was a result of Lancashire oil and gas exploitation were significantly overstated. Such manipulative statements appear to be cut directly from North American energy’s playbook.
House of Commons meeting, London. Photo by Sam Rubright
We then attended a spirited Fracking with Nature Meeting at The House of Commons hosted by 21st Century Network and convened by MP Cat Smith (photo right). Many, if not all, of the attendees were concerned about the negative impacts of fracking and oil and gas development in general, but perhaps the event’s purpose self-selected for those attendees. We found the conversations to be very advanced considering that the UK has not seen nearly the same level of oil and gas activity as the US. Most questions centered on the potential for fracking to negatively impact ground water, followed by the induction of earthquakes. Air quality was not discussed as often, despite the serious risks that oil and gas air pollutants pose to health, and the frequency and severity of ambient degradation reported in the US. With the UK’s move to cut subsidies for renewables and a push toward fracking, these concerns may soon become a reality.
We later met with one of the speakers at the House of Commons meeting, Damien Short LLB, MA, PhD, Director of the University of London’s Human Rights Consortium[1] and the Extreme Energy Initiative.[2] NGO’s, we learned, are on the forefront of the issue, debating the need to prioritize community health over corporate profits. They have had quite a lot of success on this front, despite Tory projections.[3] The past state of UK politics under the direction of PM David Cameron, was supportive of extractive industries and corporate interests, blocking any attempt to introduce regulations. Even with the defeat of David Cameron’s administration, new “fast-tracking” rules to accelerate permits for fracking passed in August.[4] The overwhelming victory of democratic socialist Jeremy Corbyn as the leader of the opposition Labour Party – means that the tenure of the current fracking moratoria in North Yorkshire, as well as in Scotland, Wales, and Northern Ireland[5] could be brief.
Our time in London was filled with several other meetings, including one with Greenpeace UK’s new fracking coordinator, Hannah Martin. During our meeting she indicated that while Greenpeace was sympathetic to the views and tactics of Mr. Corbyn, they were concerned that his election would further divide Labour. In her opinion this change could allow the oil and gas sympathetic – and united – Tories to expedite their vision for fracking in the UK.
Regardless of the similarities between community concerns and industry tactics, however, one difference between the UK and US was crystal clear; no matter their view on the use of fracking, Brits support a substantial Petroleum Revenue Tax (PRT) rate to the tune of 50-60%. The PRT will fall to 35% in January, 2016, however. This latter figure is a sizeable decrease but would still be 40% higher than the average in the US. California for example, the fourth largest producing state, does not and has never levied a severance tax.[6] Unfortunately, the UK is seeing similar conflict of interest issues and deliberate attempts to de-democratize the rule-making around fracking, as demonstrated in a recent move to prevent a proper parliamentary debate about drilling under protected areas in the UK.
Brussels, Belgium Workshop and Meeting
Geert, Max, Kyle, and Ted after our meeting with the European Commission in Brussels. Photo by Sam Rubright
The next phase of OES Europe took us to Brussels to host a community workshop and meet with members of the European Commission’s Directorate-General for Environment. Both events brought to light many concerns and questions about drilling’s safety.
The European Commission is currently drafting a best available techniques reference document (BREF) regarding hydrocarbon extraction for the European Union to consider in December 2015. The recommendations will build upon the “Minimum Principles,” published in January, 2014.[7] Representatives from the European Commission asked us about a variety of concerns that have arisen from drilling in the US, and how Europe might have similar or different experiences. The Commission was most interested in environmental health risks and research focused on exposure to air pollutants, as well as other degraded environmental media (drinking water, soil, etc.). We also shared figures about water consumption, land use, and waste management. It was immediately apparent that the lack of high quality publicly accessible data in the US is making it very difficult for the Commission to make well-informed decisions or policy recommendations. This meeting was arranged by Geert De Cock, of Food and Water Europe, and – interestingly – was one of the first times that the European Commission met with non-industry representatives. (Several major oil and gas players have offices near the European Commission’s in Brussels.)
Rotenburg (Wümme), Germany Workshop
Max presenting during the Rotenburg Germany workshop, Sept 2015. Photo by Kyle Ferrar
Our next stop in Germany was Rotenburg. Lower Saxony also has a long lineage of drilling, with the first well drilled in 1953 and the majority of natural gas development dating back to the mid 1980’s. Currently, this is an area were unconventional oil and gas drilling (fracking) is being heavily proposed and lobbied.
This workshop was by far the most well attended event. A variety of groups and stakeholders, including the town’s mayor, were in attendance and extremely well informed about environmental and public health risks that drilling could pose. They’ve been dealing with a series of environmental health concerns for some time, including high mercury levels in drilling waste and cancer clusters of questionable origin. A systematic statistical analysis has even suggested that cases of Non-Hodgkin lymphoma are higher in an area heavy with oil and gas wells and development.
See maps below for more information about drilling in Germany and Europe at large.
Unconventional gas production, conventional gas drilling, fracking and test boring in Europe
Map by Gegen Gasbohren (Against Gas Drilling)
A dynamic map similar to the one above was created by us to show simply where unconventional drilling is occurring in the UK and Netherlands: View FracTracker’s map fullscreen
Rotenburg Field Tour
The following morning we set out with a local advocate, Andreas Rathjens, to tour over eight different oil and gas drilling sites and facilities in and around Rotenburg. This area is vey rural and a major agriculture hub, hosting 162k people, 200k cows, and 600k pigs according to our guide.
In recent years Germany has received very positive scores for its environmental policies and shift toward renewables. However, this tour highlighted some of the country’s lingering and poorly-regulated drilling history, which experienced a sharp increase in development here in the 1980’s. The pictures below will give you an idea of the issues that German residents are is still seeing from the country’s older oil and gas drilling operations. Click to enlarge the photos:
This pit is used to capture rainwater and runoff from the well pad. Since runoff from the pad will carry with it any contaminants spilled on the site, runoff must be quarantined for removal and proper disposal. Unfortunately, these tanks are rarely pumped and drained, and the runoff instead spills into local streams in small watersheds. Such is the case with this tank, with the spillway visible in the lower left corner of the photo.
This site was recently renovated to improve the drainage off of the wellpad. The drainage leads to an excavated waste pit used as an overflow catchment.[8] In these types of waste pits pollutants evaporate into the air and percolate into groundwater sources. The waste from drilling in this region is known for its high levels of mercury.
Andreas showing us the site where he says 80,000 metric tonnes of solid drilling waste was mixed with residential waste and then disposed of in a field on a hilltop. Residents have tested the site and found troubling levels of arsenic and radioactive elements, but to Andreas’ knowledge no governmental or company testing has been done to-date.
Andreas and community members all conveyed their support of domestic energy production but said they were disappointed in how the oil and gas industry has conducted itself historically in the region. They are very frustrated with how difficult it is to get their concerns heard, a sentiment echoed in many boomtowns across the US. One local politician even discussed the intentionally misleading statements made by the German state governments around environmental health issues. These residents are dedicated and driven despite the barriers, however. They are investigating and studying the problems directly at times, as well as searching for other technologies that can help improve their methods – such as the use of drones to measure air quality.
Badbergen, Lower Saxony, Germany Workshop
Fracking-freies Artland hosted our next workshop in Badbergen Germany. In addition to our presentation about drilling experiences in the US, these community gatekeepers led a presentation summarizing the work and struggles that have been occurring in their region due to both historic and modern drilling. The level of community engagement and activism here was quite impressive, mirroring that of NY State’s anti-drilling groups. These members help to inform the rest of the community about environmental and drilling issues, as Exxon is now considering fracking here again.[9]
Schoonebeek Tour, Netherlands
Our final border crossing brought us to the Schoonebeek region in the Netherlands. While the Groningen gas field is by far the largest of the fields in this Western European country, Schoonebeek is the only active field being drilled unconventionally in the Netherlands.
Interestingly, the entire field was recently shut down by NAM Shell/Exxon JV to fix this wastewater pipeline. It was discovered that the pipeline was leaking wastewater in nine places due to corrosion caused by the high sulfur content of the wastewater.
Upon starting our tour we were informed of the fact that the Dutch have an even higher extraction tax than the UK! The Netherlands retains a 50% State Profit Share for revenue and taxes the remaining production at a rate of 20% on the first $225,000 in revenue and “25% on the excess.” In comparison, the highest production tax rate on oil and gas drilling in the US is in Alaska at 35%. Most states have significantly lower severance taxes.[10]
Political support for higher taxes on the extractives industry may be explained by the fact that the state owns all subsurface mineral rights in these European countries. Regardless of other influences on perception, such high taxes disproves the notion here in the US that energy companies “won’t do business in a state [or country] with a newly-enacted punitive severance tax.” What do the states do with this extra revenue? The Netherlands and many Northern European countries have invested these monies for the rainy day when the oil and gas supply is depleted or extraction is no longer justifiable. The best examples are Norway’s $850 billion Government Pension Fund and Netherland’s $440 billion pension fund or $169,000 and $26,000 per capita, respectively.
Additional support for severance taxes is likely due to these countries’ history with oil and gas exploration. They are familiar with the boom-bust cycles that come with the initial expectations and long-term reality on the ground. When the music stops, Europeans are determined not to be the ones left standing.
About the Our Energy Solutions Project
This trip to Europe and our previous expeditions to Florida, North Carolina, Argentina, and Uruguay are part of a larger, collaborative project with Ecologic Institute US called Our Energy Solutions. OES is creating an informed global community of engaged citizens, organizations, businesses, governments, and stakeholders to develop ideas and solutions to keep our society moving forward while preserving our planet for the future. Learn more at: ourenergysolutions.org.
On a more personal note, our sincerest thanks goes out to the many groups and individuals that we met on our Europe tour, including those we did not directly mention in this article. We are forever indebted to all of the people with whom we met on these OES trips for sharing their time and knowledge with us.
Endnotes and References
Dr. Short is currently advising local anti-fracking groups in the UK and county councils on the human rights implications of unconventional (extreme) energy extraction processes such as fracking.
Much of the ammunition used by the anti- or undecided fracking community in the UK – and the EU writ large – is coming from proofs of concept in states like Pennsylvania, Ohio, New York, and North Dakota.
A practice that is supposedly now being investigated for soil contamination issues.
Exxon originally wrote in the local/regional paper that there was to be no unconventional shale drilling (fracking), but now the company is reconsidering.
Please note that the cited article was last updated in 2012. Some tax rates have changed since the time that the article was published, but the table still adequately represents an estimation of production taxes by state.
https://fractracker.org/wp-content/uploads/2015/10/OES-Europe-Feature.jpg400900FracTracker Alliancehttps://fractracker.org/wp-content/uploads/2025/09/2025-Wordmark-Logo.pngFracTracker Alliance2015-10-28 15:30:592020-03-12 13:45:14A Fresh Look at Oil and Gas Drilling from Europe