Ohio’s Shale Oil and Gas Firms Disappoint Shareholders

By Ted Auch, Great Lakes Program Coordinator

A financial crisis seems to have been averted as the price of crude oil is beginning to stabilizeat least for now. One must wonder how such a volatile market affects oil and gas’ Wall Street, private equity, and pension fund followers, however. We have found that many oil and gas (O&G) shares have experienced steep valuation declines in the last few years for companies operating in Ohio.

Share[d] Values

To approach such a broad question, we focused our assessment on Ohio and looked at the share performance of the 17 publicly traded firms operating in the Ohio Utica region since the date of their respective first Utica permits. The Date of First Permit (DFP) ranges between 12/23/2010 for Chesapeake Energy to 3/20/2013 for BP.

US Energy Leverage

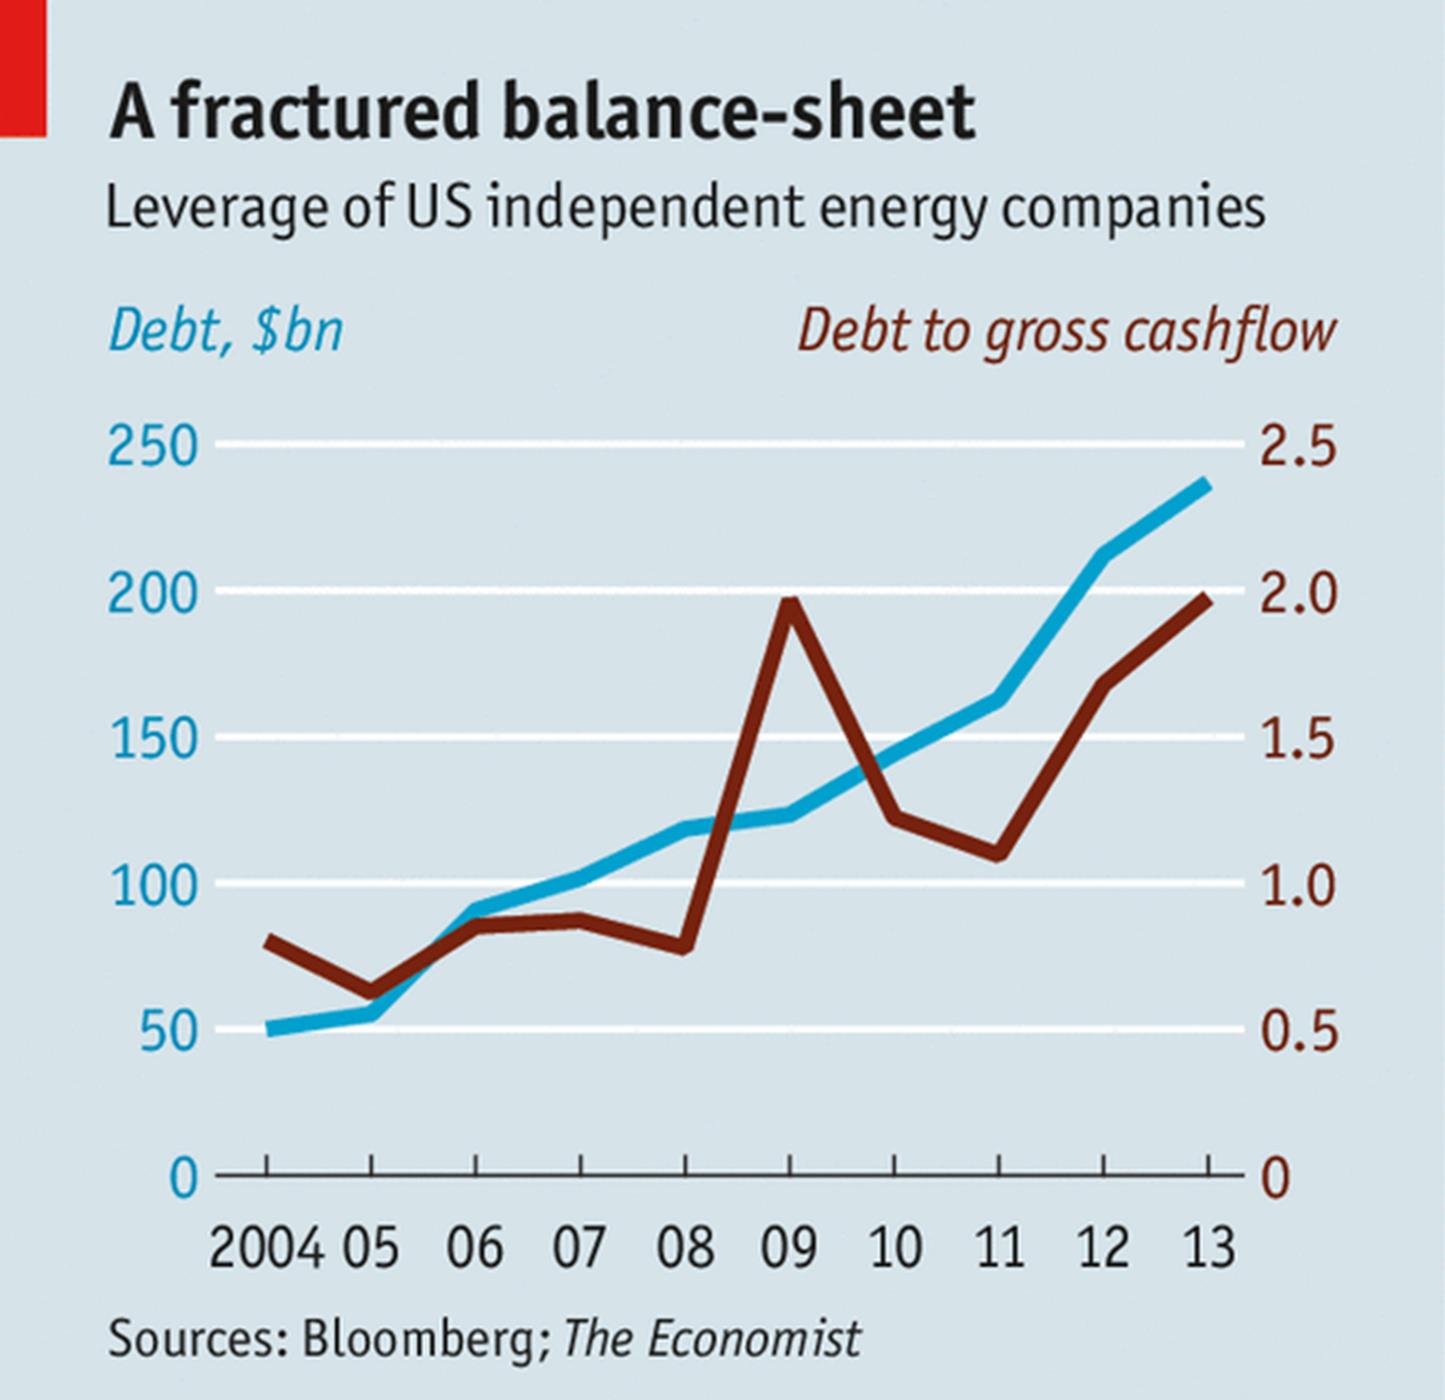
Across these 17 companies there are, quite expectedly, winners and losers. On average their shares have experienced 3.75% declines in their valuation or -00.81% per year in the last several years, however. This might be why many of Wall Street and The City’s major banks have limited – or ended – their lines of credit with energy firms from Ohio to the Great Plains. Others are still picking off the highly leveraged losers one by one for pennies on the dollar (Corkery and Eavis, 2015; Staff, 2014). This cutoff of credit and disturbingly high levels of debt/leverage may explain why we found, in a separate analysis, that while cumulative producing oil and gas wells have increased by 349% and 171%, respectively, the rate of permitting needed to maintain and/or incrementally increase these production rates has been 589%.

Cross-Company Comparisons

Ohio Utica Shale Publicly Traded Companies Return

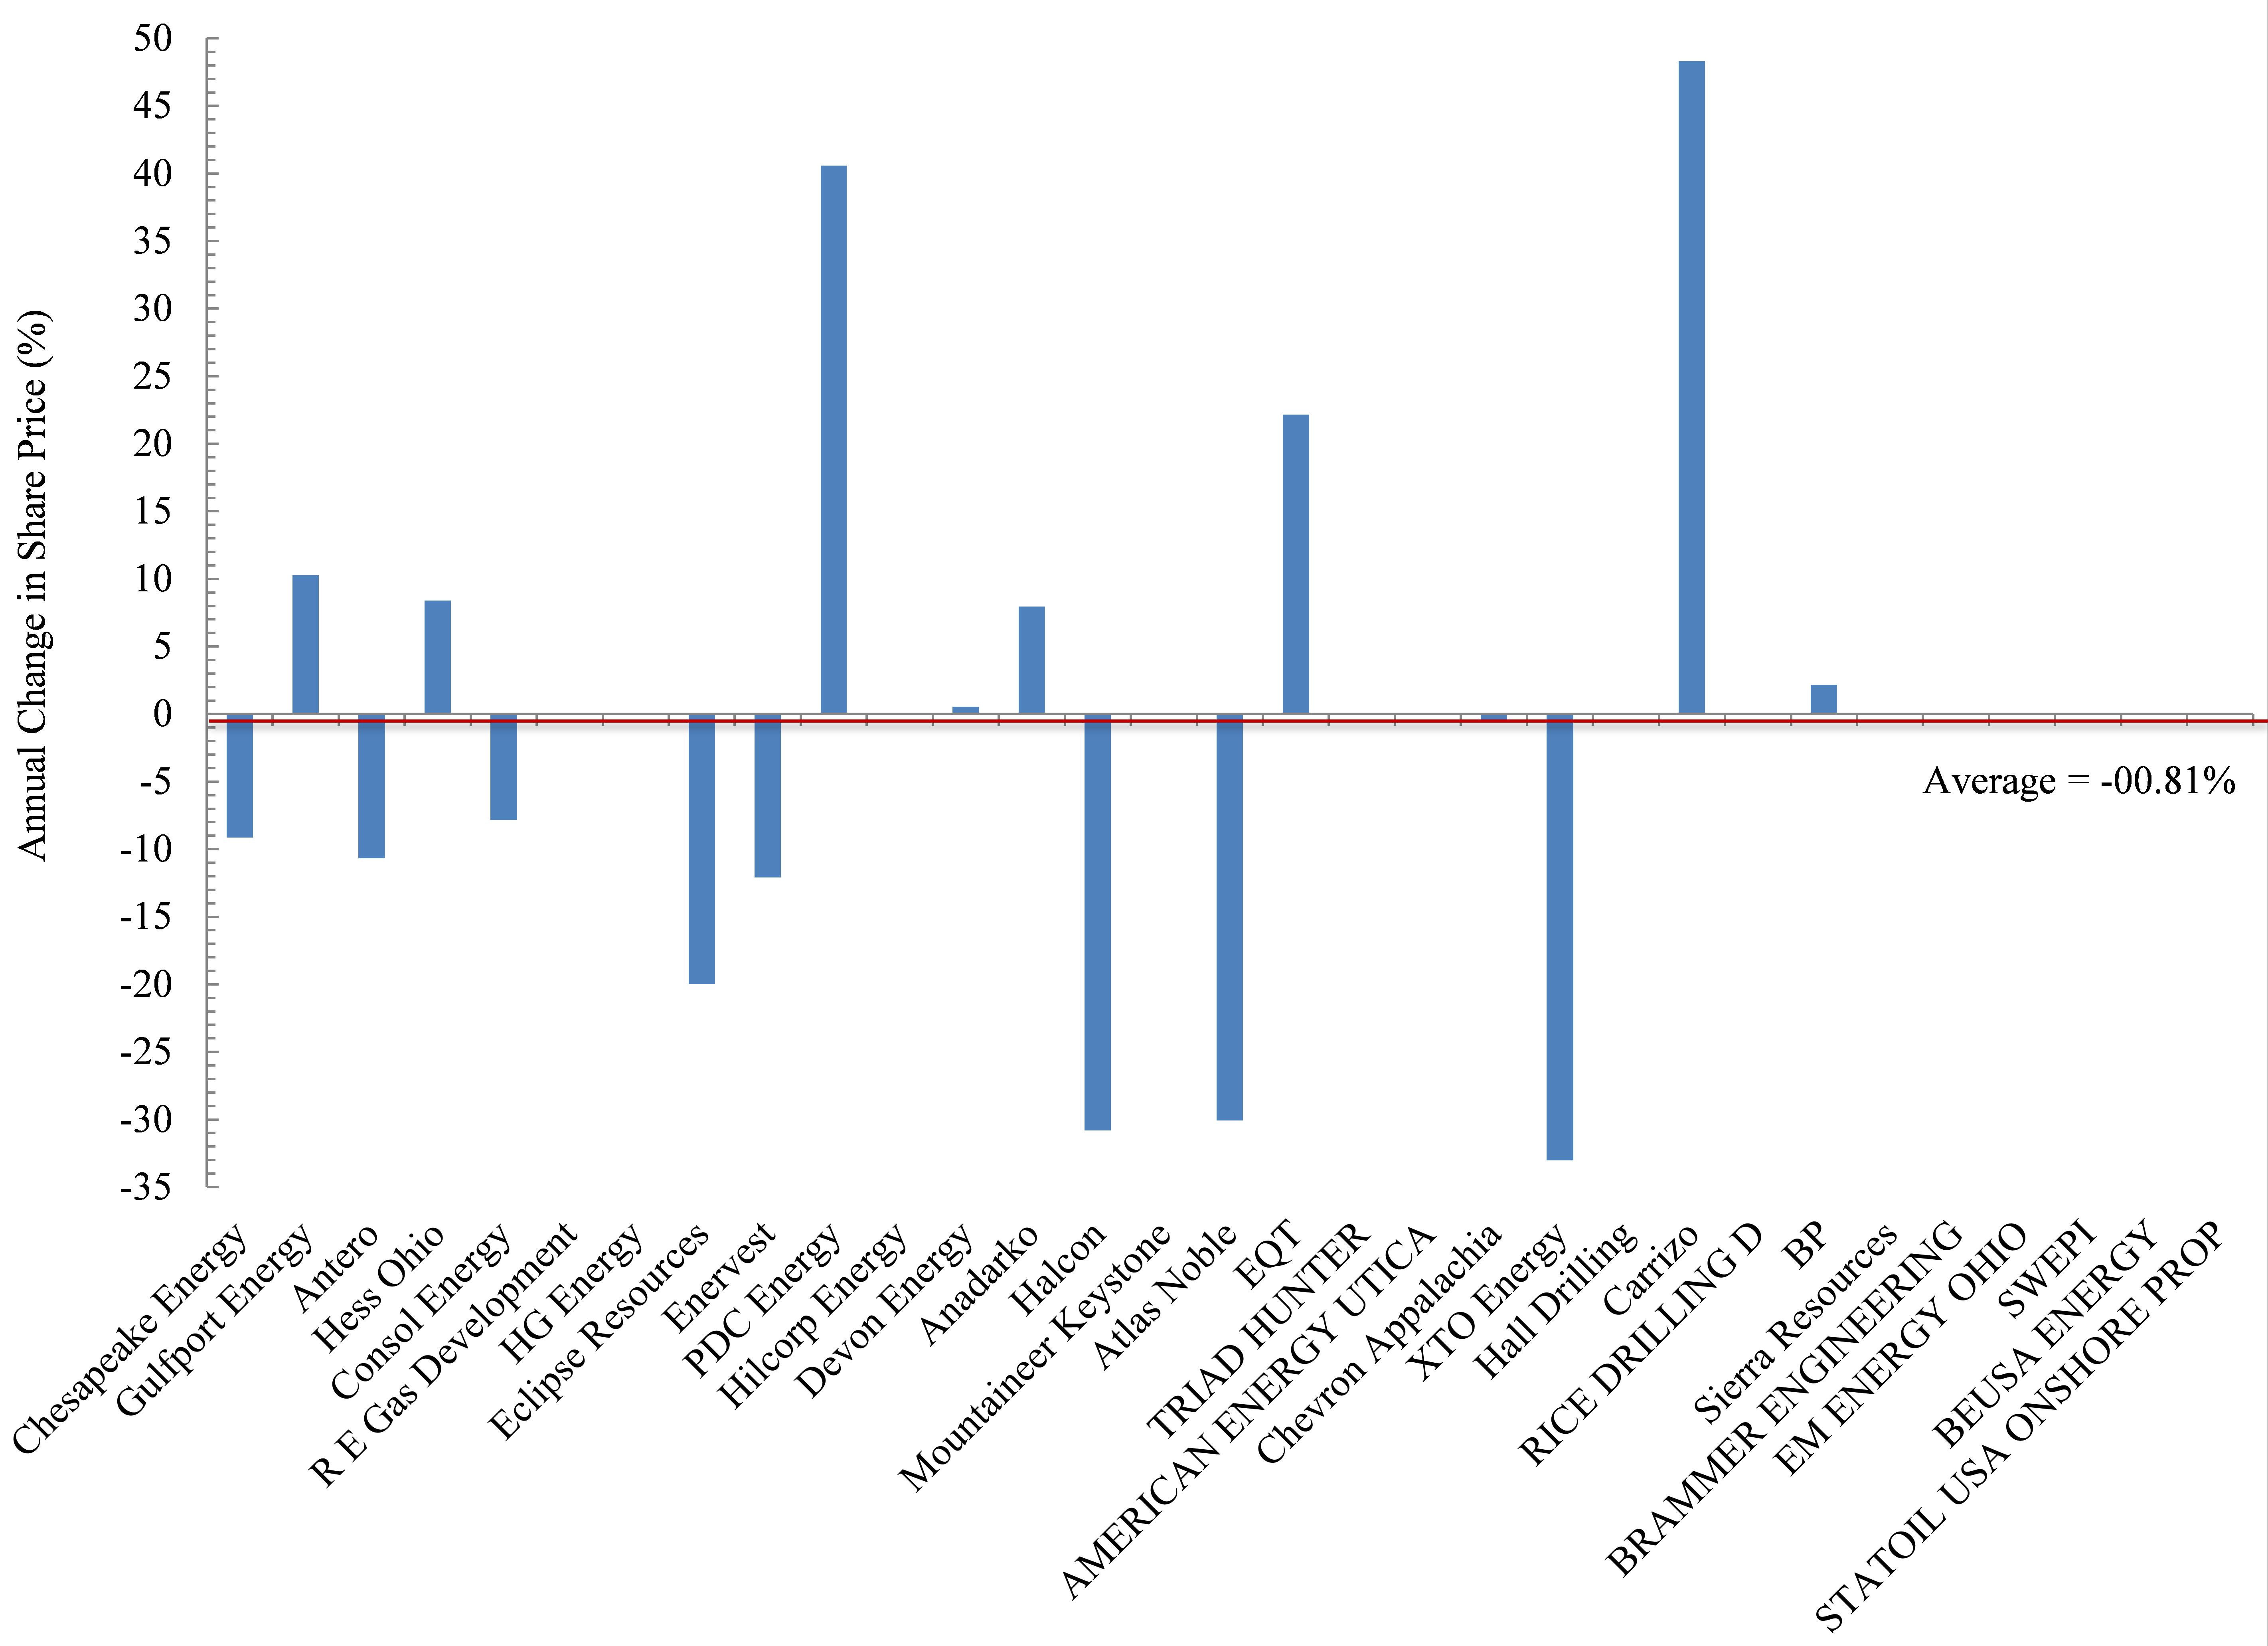
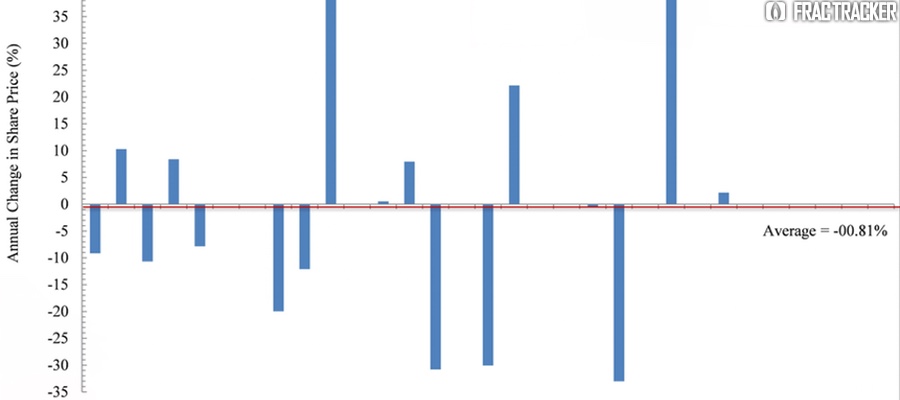
Figure 2. Annual change in share price (%) for 17 publicly traded firms operating in the Ohio Utica shale since their date of first permit

The biggest losers in Ohio’s oil and gas world include Chesapeake Energy. Chesapeake (CHK) is also the largest player in the Buckeye State based on total permits and total producing laterals, accounting for 41% and 55%, respectively. CHK has seen its shares decline on average by 9.1% each year since their DFP (Figure 2). Antero (-10.7% per year), Consol Energy (-7.8%), and Enervest (-12.1%) have experienced similar annual declines, with investors in these firms having seen their position shrink by an average of 37%. Eclipse shares have declined in value by nearly 20% per year, which pales in comparison to the 30-33% annual declines in the share price of Halcon, Atlas Noble, and XTO Energy.

Conversely, the biggest winners are clearly Carrizo (+49% per year), PDC Energy (+41%), and to a lesser degree smaller players like EQT (+22%), Hess Ohio (+8.4%), and Anadarko (+7.9%). Interestingly, the second most active firm operating in Ohio is Gulfport Energy, and their performance has been somewhere in the middle – with annual returns of 10.3%.

Out of State – The Bigger Picture

But before the big winners light up celebratory cigars, it is worth putting their performance into perspective relative to the rest of the field as it were. In an effort to be as fair as possible we chose the Dow Jones Industrial Average and S&P 500 – two indices that everyone has heard of because they are viewed as broad indicators of US economic growth. Incidentally, the DJIA includes the O&G companies Exon and Chevron. Exon is a multinational firm not involved in Ohio’s Utica development, while Chevron is involved. Additionally, the S&P 500 includes those two firms, as well as 39 other energy firms. Nine of those currently operate in Ohio. To assess these companies’ performance with the most energy-centric indices we have compared Ohio Utica players to the S&P 500’s Energy Index, which strips away all other components of its more famous metric, as well as the Vanguard Energy Index Fund. The latter is described by Vanguard as the following on the Mutual Funds portion of its website:

This low-cost index fund offers exposure to the energy sector of the U.S. equity market, which includes stocks of companies involved in the exploration and production of energy products such as oil, and natural gas. The fund’s main risk is its narrow scope—it invests solely in energy stocks. An investor should expect high volatility from the fund, which should be considered only as a small portion of an already well-diversified portfolio.

In reviewing these four indices we found that they have outperformed the 17 oil and gas firms here in Ohio or the Ohio Energy Complex (OEC), with annual rates of return (ROR) exceeding 35% (Figure 3). This ROR value was not approached or exceeded by any of the 17 OEC firms except for PDC Energy and Carrizo. However, these two companies only account for 2.8% of all Utica permits and 4.4% of all producing Utica laterals to date. Even if we remove the broader indicators of economic growth and just focus on the two energy indices we see the US energy space ROR has experienced annual growth rates of 33% or 7% below the broader US economy but impressive nonetheless. With such growth in the number of companies drilling for oil and gas, it is likely that we will see significant consolidation soon; some of the world’s largest multinationals like Exxon and Total may step in when all of the above are priced to perfection, which is something Exxon’s Chariman and CEO, Rex Tillerson, eluded to in a speech in Cleveland last June.

US Economic Performance and Energ Industry Metrics

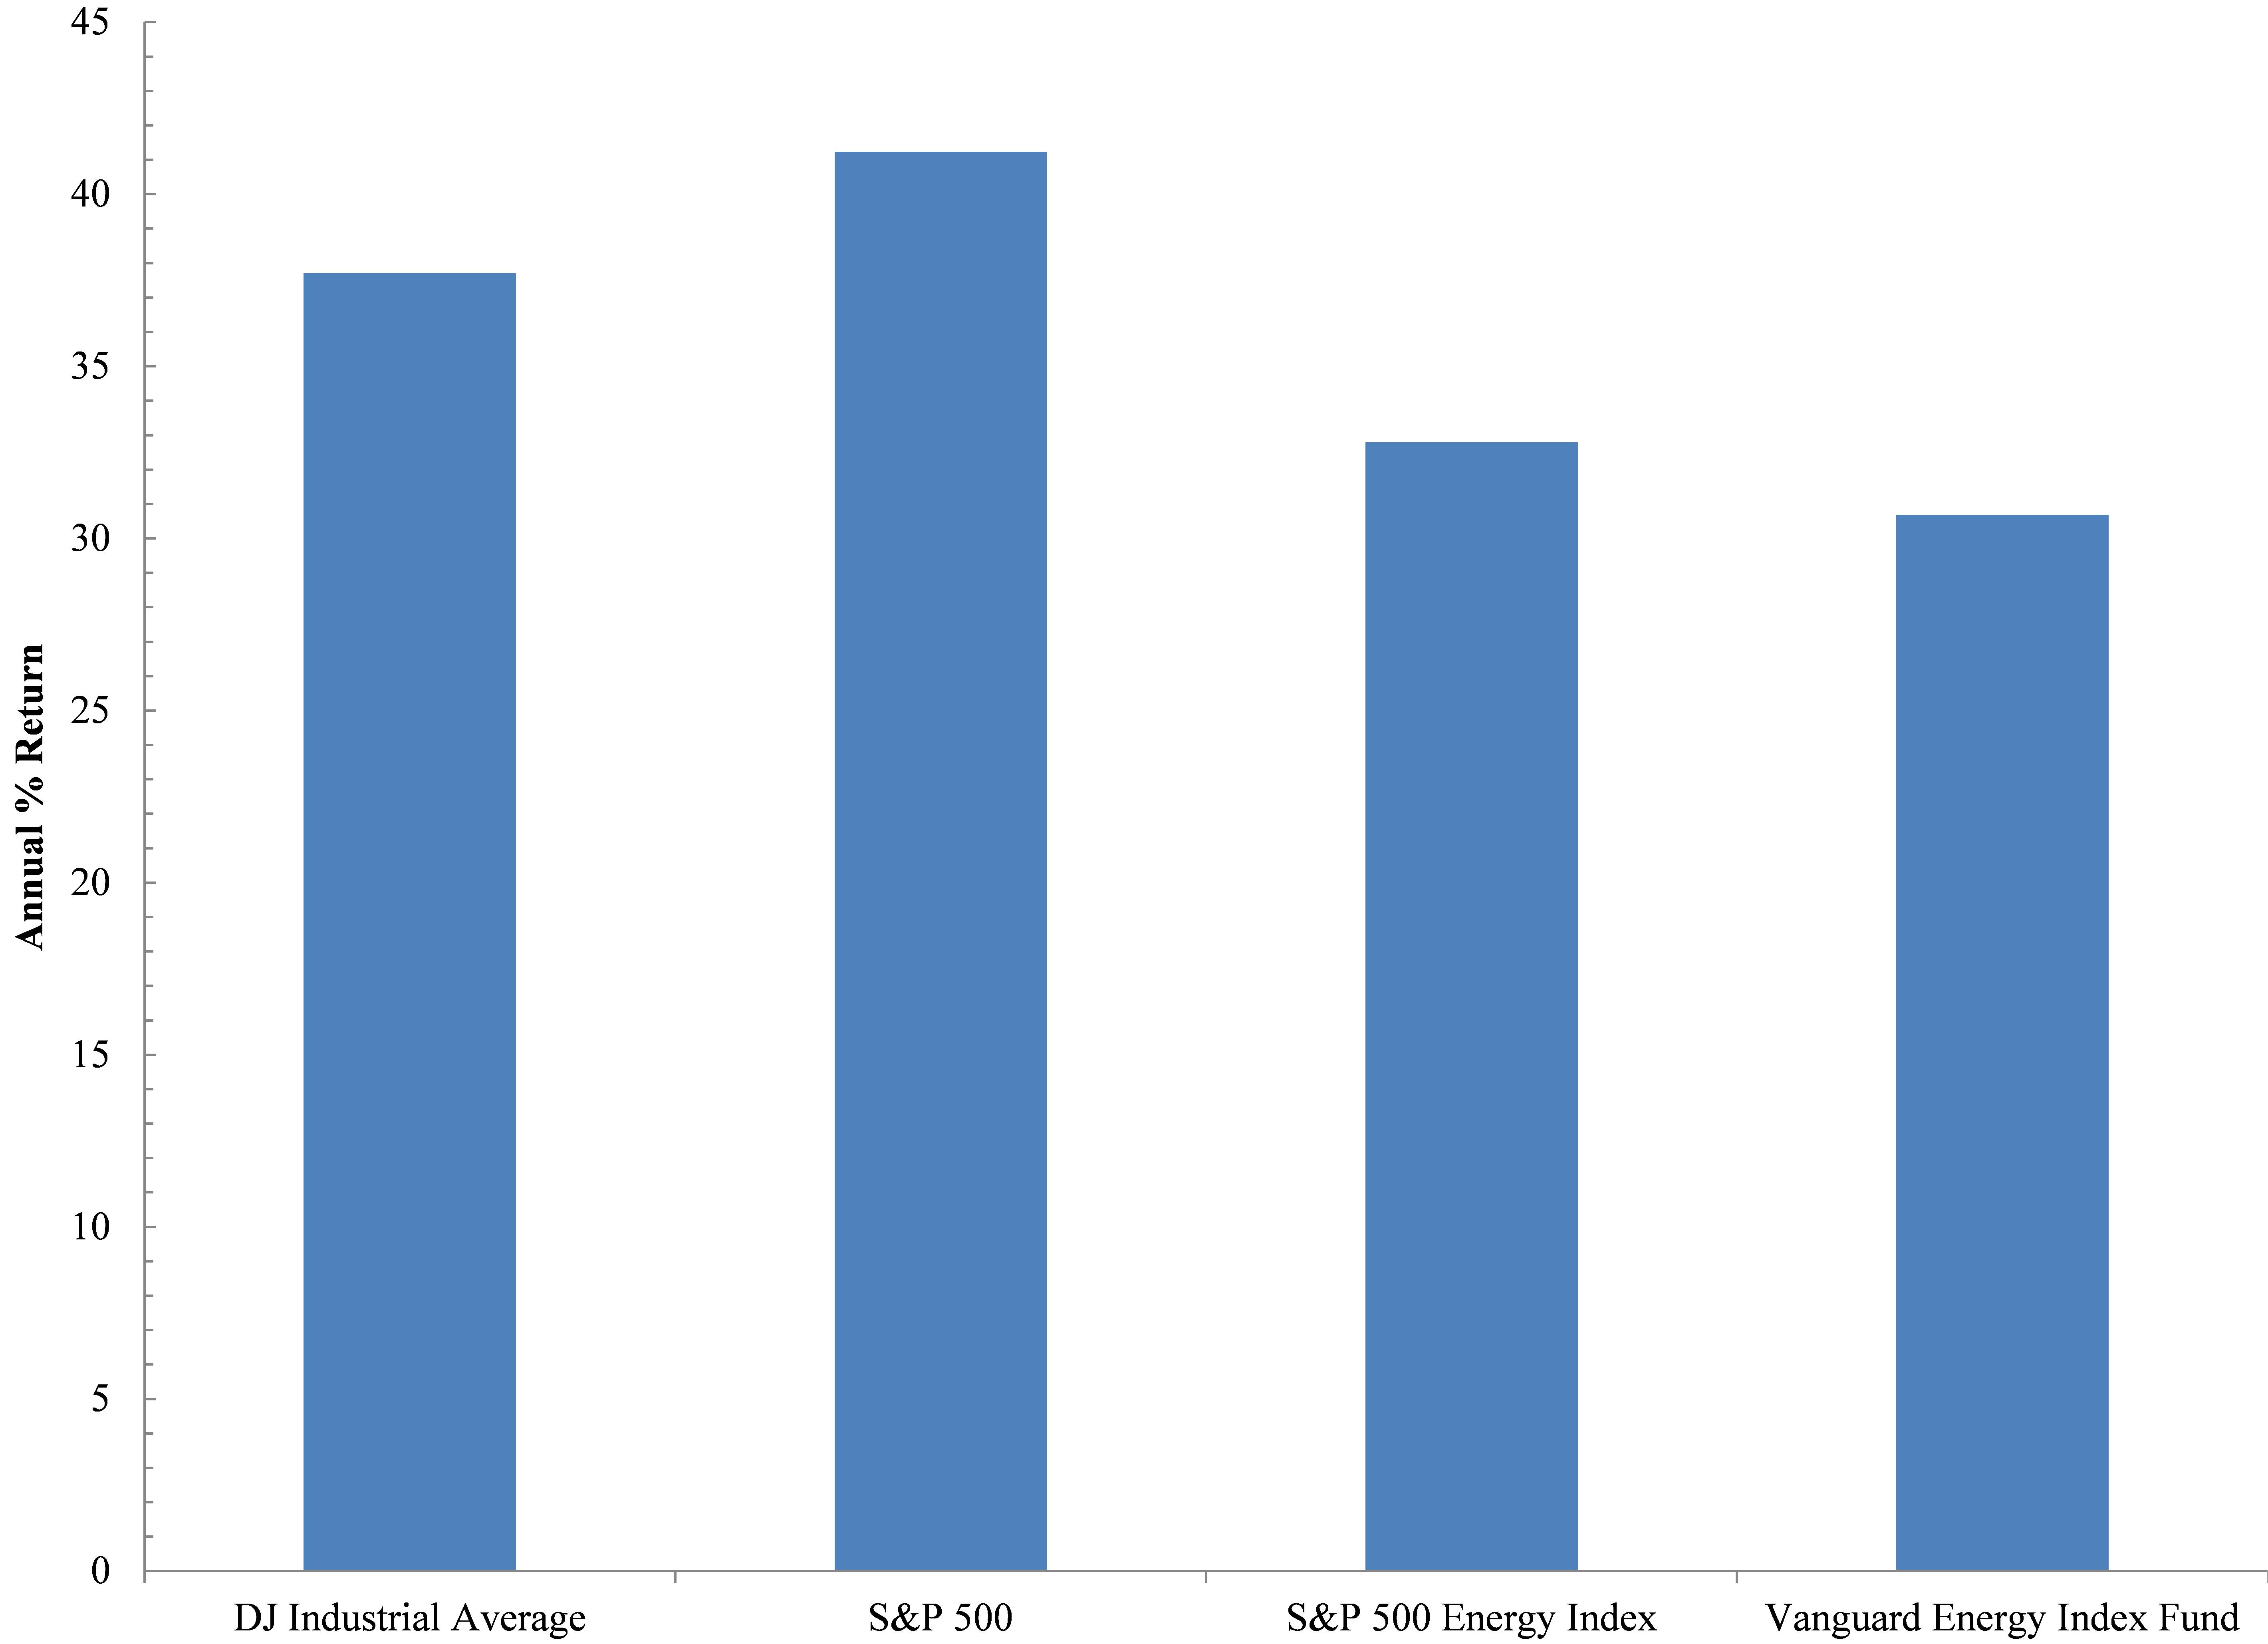
Figure 3. Annual % Return of Two Broad Economic and Two Energy Specific Indices.

The performance of the OEC indicates investors and/or lenders will not tolerate such a performance for much longer. Just like our country’s Too-Big-To-Fail banks, boards, CEOs, and shareholders were bailed out, it seems as though a similar bubble is percolating in the O&G world; the same untouchables will be protected by way of explicit or implicit taxpayer bailouts. Will Ohioans be made whole, too, or will they be left to pick up the pieces after yet another natural resource bubble bursts?

References

Corkery, M., Eavis, P., 2015. Slump in Oil Prices Brings Pressure, and Investment Opportunity, The New York Times, New York, NY.

Staff, 2014. Shale oil in a Bind: Will falling oil prices curb America’s shale boom?, The Economist, London, UK.

Comparison of Oil and Gas Violations and the Sale of Wells

Well pad spill, wetland. Photo courtesy of WV Host Farms Program (http://www.wvhostfarms.org)

Well pad spill, wetland. Photo courtesy of WV Host Farms Program

By Matt Unger, FracTracker GIS Intern

When the unconventional oil and gas extraction boom hit Pennsylvania in the mid-2000s small, local operators were among the first on the scene. As shale plays continued to develop, many of these smaller companies were bought out by larger, national corporations. Larger oil and gas development companies often maintain that they are better able to handle the expected regulatory requirements, and so FracTracker wanted to determine if there was a change in the compliance record for wells that changed hands. Does having more resources available to them translate into stronger compliance standards for oil and gas drillers, better training for their employees, and a greater burden to get things right? Investigating these questions by looking into compliance data and the sale of wells, however, was no easy task.

Analysis Methods

There are no indications in either the drilled wells or permits datasets available from the DEP that a well has changed hands; in both of these sources, one operator’s name is simply substituted for the other. It is possible to comb through old news stories, and find that East Resources sold its assets to Shell in 2010, for example. However, this approach is piecemeal, and would not lead to satisfactory results on an industry-wide analysis.

Major obstacles to our analysis included:

  • Lack of information on the transfer of oil and gas wells from one operator to another
  • There is often a lag time between the time violations occur and when they are reported
  • Errors in compliance reporting. For example, one API Number was found to have the operator listed as “Not Assigned” (It was later discovered that this well was never sold).

Results

Unlike wells and permits, any items on the compliance dataset are attributed to whichever company was operating the well at the time the violation was issued. So while FracTracker could not do the analysis that we wanted to because of the limitations of available data, we were able to isolate 30 wells that have changed hands between January 1, 2000 and November 4, 2014 (Table 1). One well has been bought and sold twice, with each of the three operators being issued violations.

In some instances the original well owner was reported to be out of compliance more times than the second owner. For example, API Number 013-20012 had 11 violations reported under its first owner and only 1 since it has been sold. The contrary also occurred, however, such as in the case of API Number 065-26481, which had 4 violations reported under its first owner and 14 under its second owner. There are not enough data points to determine which scenario is the trend in the data – if in fact there is one.

Due to limitations in the data, we cannot currently evaluate whether the notion that larger companies can improve the track record of problematic wells. In fact, many of the wells that were issued violations for multiple operators really just changed hands from one big operator who wanted to get out of the Marcellus to another big operator who wanted to get in. Our small sample doesn’t include any of the wells that were issued violations to only one company, of all the wells that changed hands over the years. To accurately assess the scenario, more data would have to be released, specifically the date when wells changed hands from one company to another.

Table 1. Wells with violations by API number that have changed ownership

API Number First Owner Last Known Date Of Ownership Second Owner First Known Date Of Ownership Third Owner First Known Date Of Ownership
013-20012 Chief Oil & Gas LLC 5/24/10 Chevron Appalachia LLC 2/5/13
015-20033 Belden & Blake Corp 4/10/09 Chesapeake Appalachia LLC 12/7/11
015-20051 Consol Gas Co 6/16/04 Range Resources Appalachia LLC 8/9/05 Talisman Energy USA Inc 11/16/11
019-21494 Phillips Exploration Inc 6/10/08 XTO Energy Inc 7/24/13
019-21680 Phillips Exploration Inc 4/6/10 XTO Energy Inc 3/13/13
065-26481 Dannic Energy Corp 5/11/11 Mieka LLC 11/10/11
065-26832 Dannic Energy Corp 3/2/11 Mieka LLC 4/11/12
081-20062 Chief Oil & Gas LLC 1/6/09 Exco Resources Pa LLC 8/16/11
081-20069 Chief Oil & Gas LLC 5/21/08 Exco Resources Pa LLC 3/28/11
081-20128 Chief Oil & Gas LLC 11/15/10 Exco Resources Pa LLC 6/27/11
081-20144 Chief Oil & Gas LLC 7/21/10 Exco Resources Pa LLC 3/15/12
081-20149 Chief Oil & Gas LLC 1/10/11 Exco Resources Pa LLC 2/21/12
081-20244 Chief Oil & Gas LLC 5/20/10 Exco Resources Pa LLC 11/15/12
081-20255 Chief Oil & Gas LLC 11/15/10 Exco Resources Pa LLC 11/29/11
081-20279 Chief Oil & Gas LLC 12/3/10 Exco Resources Pa LLC 4/20/12
081-20298 Chief Oil & Gas LLC 5/26/10 Exco Resources Pa LLC 6/27/11
083-53843 Anschutz Exploration Corp 4/7/09 Chesapeake Appalachia LLC 3/20/13
113-20025 Chief Oil & Gas LLC 2/15/11 Exco Resources Pa LLC 3/16/11
113-20049 Chief Oil & Gas LLC 11/30/10 Exco Resources Pa LLC 4/13/11
115-20052 Turm Oil Inc 9/24/08 Chesapeake Appalachia LLC 8/21/14
115-20169 Alta Opr Co LLC 11/24/09 WPX Energy Appalachia LLC 4/13/11
115-20174 Alta Opr Co LLC 4/16/10 Wpx Energy Appalachia LLC 4/29/11
115-20191 Alta Opr Co LLC 12/1/09 Wpx Energy Appalachia LLC 6/1/11
115-20214 Alta Opr Co LLC 7/19/10 Wpx Energy Appalachia LLC 8/16/10
115-20231 Alta Opr Co LLC 4/8/10 Wpx Energy Appalachia LLC 6/1/11
117-20197 East Resources Inc 4/8/08 Talisman Energy USA Inc 1/26/11
117-20280 East Resources Inc 5/19/10 Swepi LP 8/28/14
117-20330 East Resources Inc 12/18/09 Talisman Energy USA Inc 2/20/13
117-20394 East Resources Inc 12/14/09 Swepi LP 10/25/11
117-20538 East Resources Inc 12/18/10 Swepi LP 5/27/10


Politics and Campaign Financing

O&G Politics & Campaign Financing

By Ted Auch, OH Program Coordinator, FracTracker Alliance

Anyone who has been paying attention to the domestic shale gas conversation knows the issue is fraught with controversy and political leanings. The debate is made only more complicated by the extensive lobbying to promote drilling and related activities. It would be nice to look at shale gas through a purely analytical lens, but it is impossible to decouple the role of politicians and those that fund their campaigns from the myriad socioeconomic, health, and environmental costs/benefits.

As such, this article covers two issues:

  1. Who Gets Funded: the distribution of oil and gas (O&G) funds across the two primary parties in the US, as well as the limited funds awarded to third parties, and
  2. Funding Allocation to a Specialized Committee: industry financing to the Committee on Science, Space and Technology1 the primary house committee responsible for:

…all matters relating to energy research, development, and demonstration projects therefor; commercial application of energy technology; Department of Energy research, development, and demonstration programs; Department of Energy laboratories; Department of Energy science activities; energy supply activities; nuclear, solar, and renewable energy, and other advanced energy technologies; uranium supply and enrichment, and Department of Energy waste management; fossil energy research and development; clean coal technology; energy conservation research and development, including building performance, alternate fuels, distributed power systems, and industrial process improvements; pipeline research, development, and demonstration projects; energy standards; other appropriate matters as referred by the Chairman; and relevant oversight.

Politics and Campaign Financing

Fig. 1. Relevant Oil & Gas PACs, Institutes, and Think Tanks – as well as Koch Industries and subsidiaries offices (Orange). Click to explore

1. Letting the Numbers Speak

“When somebody says it’s not about the money, it’s about the money.”

The above quote has been attributed to a variety of sources from sports figures to economists, but nowhere is it more relevant than the politics of shale gas. The figures below present campaign financing from O&G industry to the men and women that represent us in Washington, DC.

Data Analysis Process

To follow the shale money path, FracTracker has analyzed data from the: a) total contributions and b) average per representative across Democrats and Republicans. Our Third Party analysis included five Independents in the Senate as well as one Green, one Unaffiliated, one Libertarian, and two Independents in the House.

Results

Annual Senate compensation relative to average US Income Per Capita

Fig. 3. US Senate Salary (Late 18th Century to 2014) & Average American Salary (1967-2013).

There are sizable inter-party differences across both branches of congress (See Figures 2a-b). In total, Democratic and Republican senators have received $18.1 and $48.6 million from the O&G industry since data collection began in 1990. Meanwhile, Third Party senators have received a total of $385,632 in O&G campaign finance. It stands to reason that the US House would receive more money in total than the senate, given that it contains 435 representatives to the Senate’s 100, and this is indeed the case; Democratic members of the House received $28.9 million to date vs. $104.9 million allocated to the House’ GOP members – or a 3.6 fold difference. Third Party members of the House have received the smallest allotment of O&G political largesse, coming in at $197,145 in total.

To put this into perspective, your average Democratic and Republican senator has seen the gap increase between his/her salary and the average American from $27,536 in 1967 to $145,171 in 2013 (Figure 3).

These same individuals have also seen their political war chests expand on average by $151,043 and $412,007, respectively. Third Party senators have seen their campaign funds swell by an average of $64,272 since 1990. Meanwhile, the U.S. Capitol’s Democratic and GOP south wing residents have seen their O&G campaign contributions increase by an average of $50,836 and $188,529, respectively, with even Third Partiers seeing a $38,429 spike in O&G generosity.

Figure 2a

Figure 2a. Total funding received by both branches of the US legislative branch

Average funding received by oil and gas industry

Figure 2b. Average funding received by oil and gas industry

Location is a better predictor of whether a politician supports the O&G industry than his/her political affiliation. At the top of the O&G campaign financing league tables are extraction-intensive states such as Texas, Oklahoma, North Dakota, Alaska, California, and Louisiana. (See Figures 4a-h at the bottom of this article for Average Oil & Gas Contributions to US House Representatives and Senators across the US.)

2. Committee on Science, Space and Technology

The second portion of this post covers influences related to the Committee on Science, Space and Technology (CSST). There is no more powerful group in this country when it comes O&G policy construction and stewardship than CSST. The committee is currently made up of 22 Republicans and 18 Democrats from 21 states. Thirty-five percent of the committee hails from either California (6) or Texas (8), with Florida and Illinois each contributing three representatives to the committee. Almost all (94%) of the O&G campaign finance allocated to CSST has gone to its sitting GOP membership.

The top three recipients of O&G generosity are all from Texas, receiving 3.2-3.5 times more money than their party averages – totaling $1.93 million or 37% of the total committee O&G financial support. The next four most beholden members of the committee are Frank Lucas and Michael McCaul (TX, $904,709 combined), Cynthia Marie Lummis (WY, $400,400), and Kevin Cramer (ND, $343,000). The average Democratic member of the CSST committee has received 12.8 times less in O&G funding relative to their GOP counterparts; Dallas-Fort Worth Metroplex representatives Marc Veasey and Eddie Bernice Johnson collected a combined $130,350 from industry. Interestingly a member of political royalty, Joe Kennedy III, has collected nearly $50K from the O&G industry, which corresponds to the average for his House Democrat colleagues.

See Figures 5-6 for totals and percentage of party averages of O&G campaign funds contributed to current member of the US House CSST.

Total Oil & Gas campaign funds contributed to current member of the US House Committee on Science, Space and Technology.

Figure 5. Totals

Total Oil & Gas campaign funds contributed to current member of the US House Committee on Science, Space and Technology as percentage of party averages.

Figure 6. Percentage of party averages

 “Don’t Confuse Me With The Facts”

In addition to current do-nothing politicians beholden to the O&G industry, we have prospects such as Republican U.S. Senate candidate Joni Ernst going so far as to declare that the Koch Brothers various Political Action Committees (PACs) started her trajectory in politics. Promising “ ‘to abolish’ the Environmental Protection Agency, she opposes the Clean Water Act, and in May she downplayed the role that human activities have played in climate change and/or rises in atmospheric CO2.

In Ohio it seems realistic to conjecture that OH Governor John Kasich, bracing for a tough reelection campaign, is wary of biting the PAC hands that feed him. He has also likely seen what happened to his “moderate” colleagues in states like Mississippi and Virginia, and in the age of Citizens United and McCutcheon he knows that the Hydrocarbon Industrial Complex will make him pay for anything that they construe as hostile to fossil fuel business as usual.

Close to the Action

Groups like the Koch-funded Americans for Prosperity, Randolph Foundation, and American Legislative Exchange Council (ALEC)2 are unapologetically wedded to continued production of fossil fuels. Nationally and in OH, politicians appear to be listening more to the talking points and white papers of such groups than they do their own constituents.. Therefore, it is no coincidence that DC and its surrounding Virginia suburbs has been colonized by industry mouthpieces, energy policy and economic academic tanks, philanthropies, and Political Action Committees (PACs). See Figure 1 for more information.

Know Your Vote

So when you go to the polls on November 4th, remember that politicians are increasingly beholden not to their constituents but to the larger donors to their campaigns. Nowhere is this more of a concern than US energy policy and our geopolitical linkages to producers and emerging markets. More to the point, when offered an opportunity to engage said officials make sure to bring up their financial links as it relates to how they vote and the types of legislation they write, massage, customize, or outright eliminate. As Plato once said, “The price of apathy towards public affairs is to be ruled by evil men.” Our current selection of politicians at the state and federal level are not evil, but data on O&G politics and campaign financing presented herein do indicate that objectivity with respect to oil and gas legislation has been at the very least compromised.


Figures 4a-h. Average & Total O&G Industry Contributions to US House Representatives and Senators across the US mainland and Alaska

Average Total
Democratic Representatives

Average Oil & Gas Industry Contributions to Democratic Representatives

Fig. 4a

Total Oil & Gas Industry Contributions to Democratic Representatives

Fig. 4b

Democratic Senators

Average Oil & Gas Industry Contributions to Democratic Senators

Fig. 4c

Total Oil & Gas Industry Contributions to Democratic Senators

Fig. 4d

Republican Representatives

Average Oil & Gas Industry Contributions to Republican Representatives

Fig. 4e

Total Oil & Gas Industry Contributions to Republican Representatives

Fig. 4f

Republican Senators

Average Oil & Gas Industry Contributions to Republican Senators

Fig. 4g

Total Oil & Gas Industry Contributions to Republican Senators

Fig. 4h


References

  1. This committee’s minority leader Ms. Eddie Bernice Johnson (D-TX) recently proposed the H.R.5189 – Energy and Water Research Integration Act of 2014 with an as yet to be published summary.
  2. …along with like-minded entities like the Ewing Marion Kauffman Foundation and the Chamber of Commerce’s PAC. These PACs and foundations tend to fund and greatly benefit from frackademic shops like Northwestern University’s Northwestern Law Judicial Education Program and George Mason University’s Law and Economics Center.