New power plant proposal called senseless and wasteful by climate groups
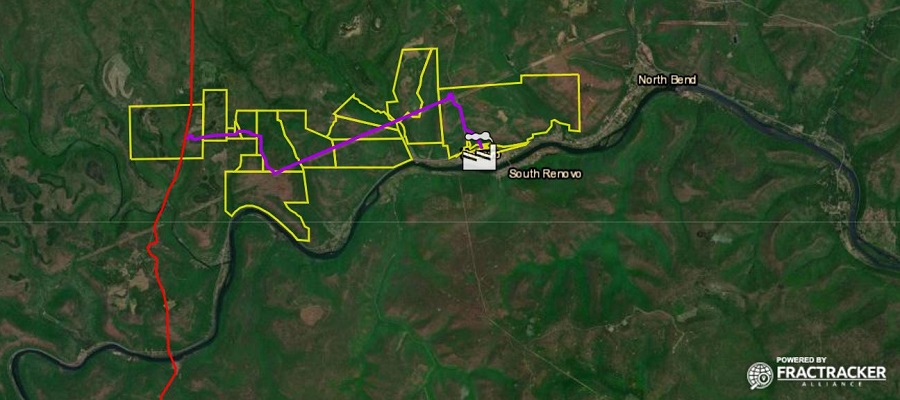
Residents and local advocacy groups are fighting a new power plant in Renovo, PA, planned to be constructed on an abandoned rail yard.
Residents and local advocacy groups are fighting a new power plant in Renovo, PA, planned to be constructed on an abandoned rail yard.
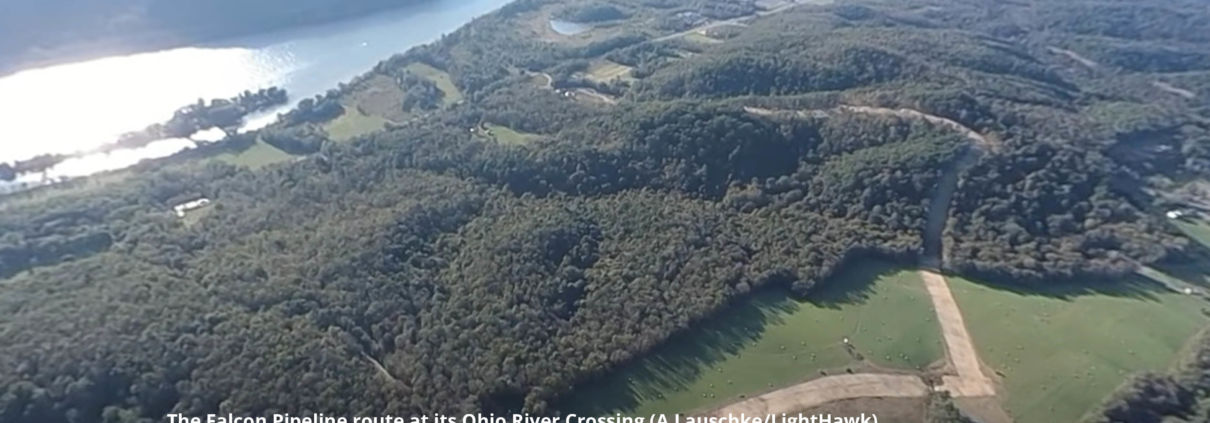
Ohio River Valley Groups react to a new safety warning issued by federal regulators to Shell regarding the troubled Falcon Pipeline
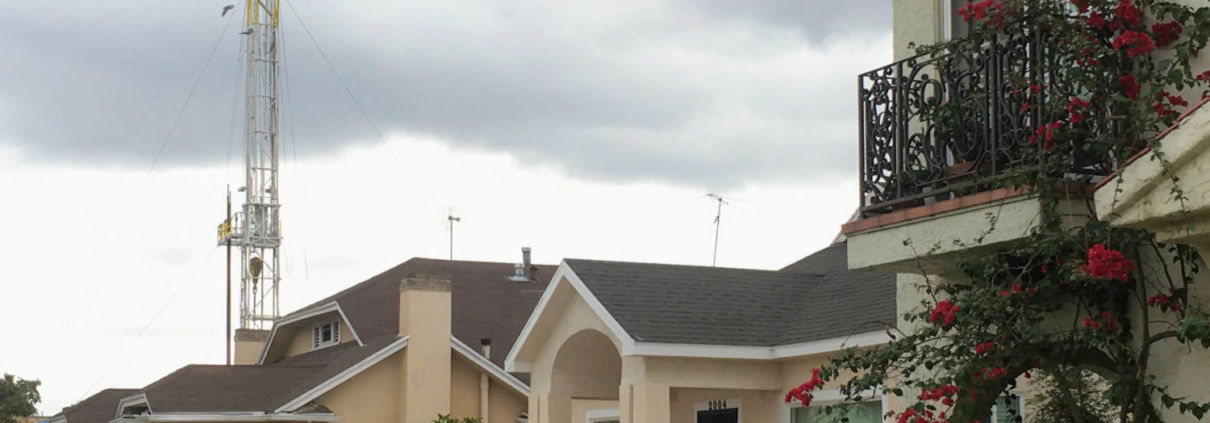
California drilling permits continue while Frontline communities and grassroots groups call for an immediate moratorium and 2,500′ setback.
California regulators recently denied 21 well stimulation permit applications—a welcomed move in the right direction—but not enough.
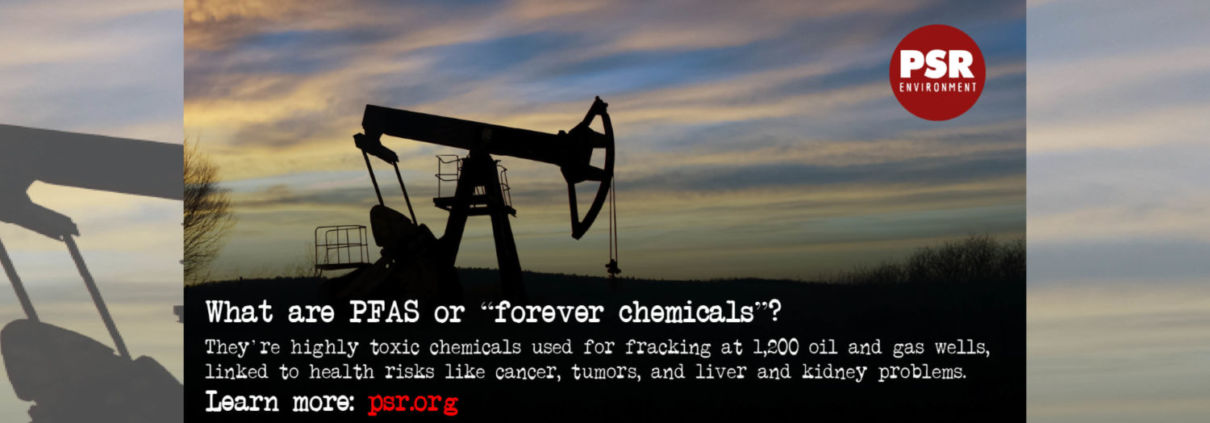
FracTracker Alliance released a new map identifying the locations of over 1,200 oil and gas wells using toxic “forever chemicals” in Arkansas, Louisiana, Oklahoma, New Mexico, Texas, and Wyoming.
In August 2020, the Colonial Pipeline ruptured, spilling an estimated 1.2 million gallons of gasoline—18 times more than originally reported.
The map below shows 6,950 total incidents since 2010, translating to 1.7 incidents per day. Pipelines are dangerous, in part because regulation around them is ineffective.
The Falcon Ethane Pipeline System is at the center of major investigations into possible noncompliance with construction and public safety requirements and failing to report drilling mud spills, according to documents obtained from the Pennsylvania Department of Environmental Protection (PA DEP) by FracTracker Alliance. These investigations, which are yet to be released, also uncovered instances of alleged data falsification in construction reports and Shell Pipeline Company firing employees in retaliation for speaking up about these issues.
3/17/21 Press release: https://www.fractracker.org/falcon-investigation-press-release-fractraccker-alliance/
Shell’s attempts to cut corners while constructing this 98-mile pipeline, likely motivated by the increasingly bleak economic prospects of this project, present serious public safety concerns for the thousands of residents along its route in Pennsylvania, West Virginia, and Ohio.
These allegations are serious enough to warrant immediate action. We’re calling on the Pipeline and Hazardous Materials Safety Administration (PHMSA) to thoroughly examine these allegations and suspend construction if not yet completed, or, in the case that construction is complete, operation of the Falcon Pipeline. Furthermore, we call on state environmental regulators to fully investigate construction incidents throughout the entire pipeline route, require Shell Pipeline to complete any necessary remediation, including funding independent drinking water testing, and take enforcement action to hold Shell accountable. Read our letters to these agencies here.
These investigations were featured in a March 17th article by Anya Litvak in the Pittsburgh Post-Gazette.
3/18/21 update:
Additional coverage of this story was published in a Times Online article by Daveen Ray Kurutz, a StateImpact Pennsylvania article by Reid Frazier, and an Observer-Reporter article by Rick Shrum.
According to documents obtained through a public records request, a whistleblower contacted PHMSA in 2019 with serious concerns about the Falcon, including that the pipeline may have been constructed with defective corrosion coating. PHMSA is a federal agency that regulates pipeline operation. The whistleblower also shared environmental threats occurring within the DEP’s jurisdiction, prompting the PA DEP and Pennsylvania Attorney General’s Office to get involved.
Many of the issues with the Falcon relate to a construction method used to install pipelines beneath sensitive areas like roads and rivers called horizontal directional drilling (HDD). Shell Pipeline contracted Ellingson Trenchless LLC to complete over 20 HDDs along the Falcon, including crossings beneath drinking water sources such as the Ohio River and its tributaries. FracTracker and DeSmog Blog previously reported on major drilling mud spills Shell caused while constructing HDDs and how public agencies have failed to regulate these incidents.
This map shows the Falcon Pipeline’s HDD crossings and spills of drilling fluid spills that occurred through 3/5/2020. To see the data sources, click on the information icon found in the upper right corner of the map header as well as under the map address bar.
View Map Full Sized | Updated 6/16/20
Correspondence between the PA DEP and PHMSA from February 26, 2020 reveal the gravity of the situation. While PHMSA conducted an inquiry into the whistleblower’s complaints in 2019 and concluded there were no deficiencies, PA DEP Secretary Patrick McDonnell wrote that his agency felt it was incomplete and urged PHMSA to conduct a more thorough investigation. Secretary McDonnell noted the PA DEP “has received what appears to be credible information that sections of Shell’s Falcon Pipeline project in western PA, developed for the transportation of ethane liquid, may have been constructed with defective corrosion coating protection,” and that “corroded pipes pose a possible threat of product release, landslide, or even explosions.”
FracTracker submitted a Freedom of Information Act request with PHMSA asking for documents pertaining to this inquiry, and was directed to the agency’s publicly available enforcement action webpage. The page shows that PHMSA opened a case into the Falcon on July 16, 2020, five months after Secretary McDonnell sent the letter. PHMSA sent Shell Pipeline Company a Notice of Amendment citing several inadequacies with the Falcon’s construction, including:
Shell responded with its amended procedures on July 27, 2020, and PHMSA closed the case on August 13, 2020.
Of note, PHMSA states it is basing this Notice on an inspection conducted between April 9th and 11th, 2019, when construction on the Falcon had only recently started. PHMSA has confirmed its investigation on the Falcon is ongoing, however we question the accuracy of self reported data given to PHMSA inspectors should be questioned
The PA DEP also brought the matter to the attention of the US Environmental Protection Agency.
The Falcon pipeline also crosses through Ohio and briefly, West Virginia. While we do not know how these states are involved in these investigations, our past analyses raise concerns about the Ohio Environmental Protection Agency’s (OEPA) ability to regulate the pipeline’s HDD crossings.
One of the focuses of the Pennsylvania DEP’s investigation is the failure to report drilling fluid spills that occur while constructing a HDD crossing. The PA DEP shut down all HDD operations in November, 2019 and forced Shell to use monitors to calculate spills, as was stated in permit applications.
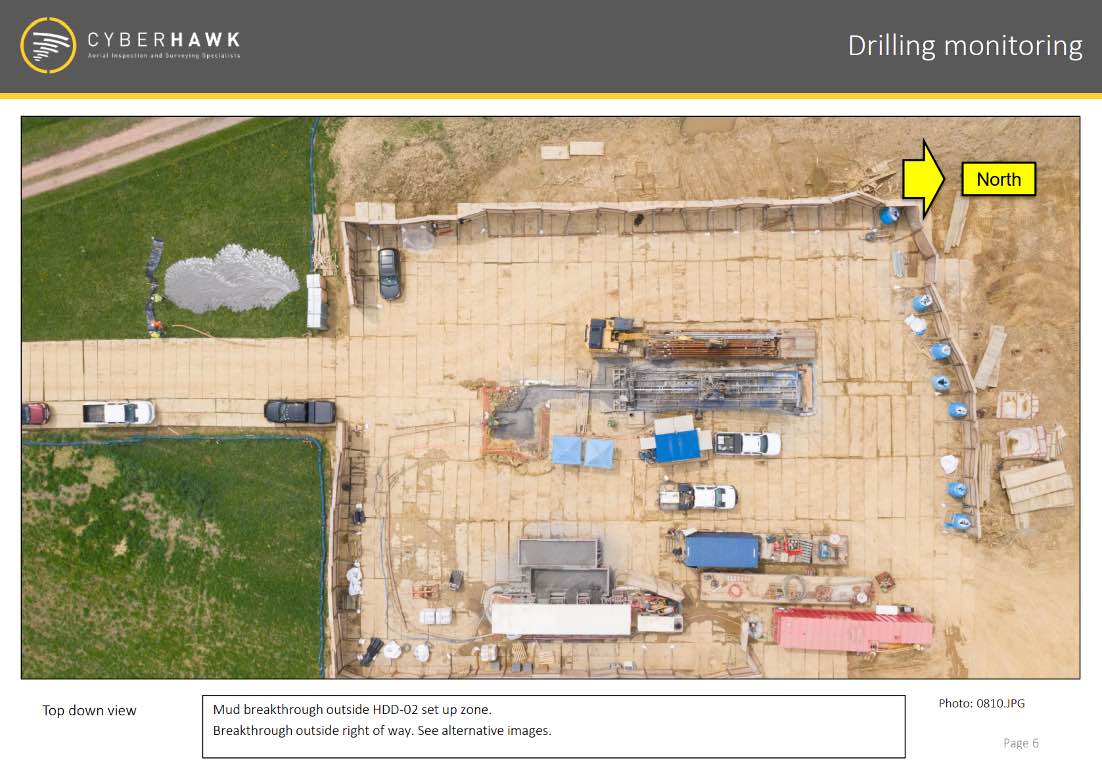
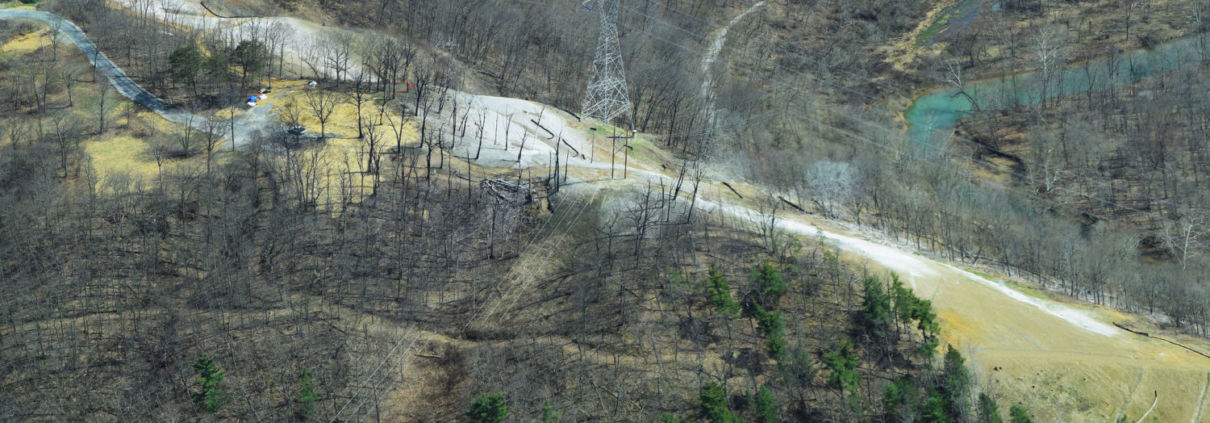
A horizontal directional drilling (HDD) construction site for the Falcon Pipeline in Southview, Washington County, Pennsylvania. You can see where the drilling mud has returned to the surface in the top left of the photo. Photo by Cyberhawk obtained by FracTracker Alliance through a right-to-know request with the Pennsylvania Department of Environmental Protection.
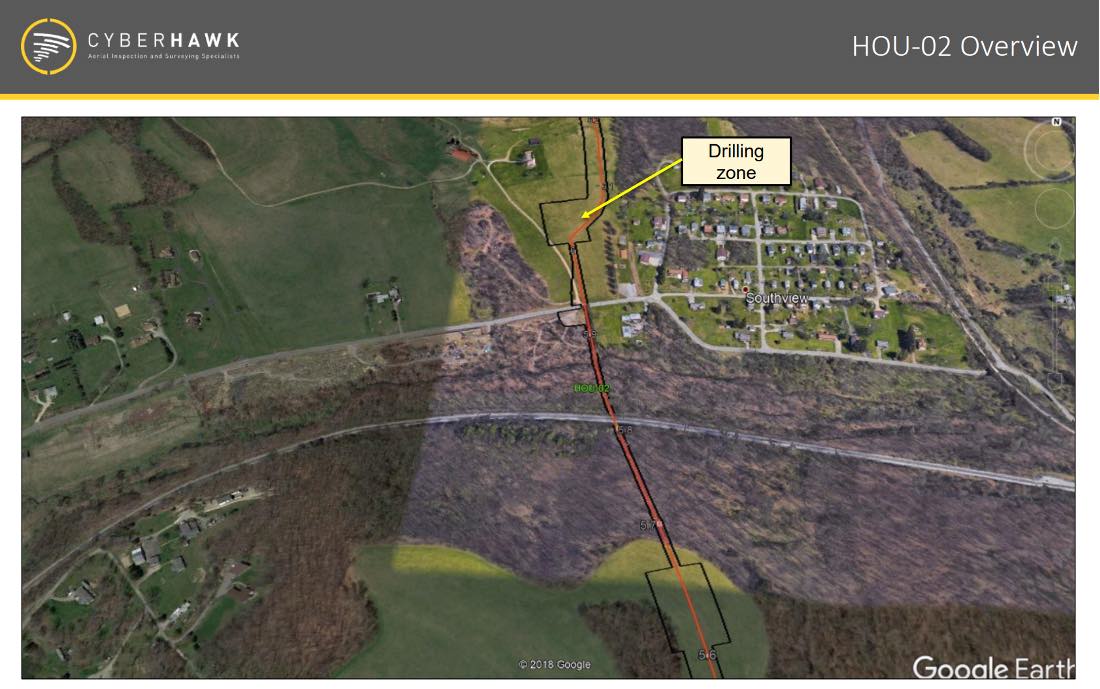
The Falcon Pipeline’s HDD locations are often close to neighborhoods, like the HOU-02 crossing in Southview, Washington County, Pennsylvania. Photo by Cyberhawk obtained by FracTracker Alliance through a right-to-know request with the Pennsylvania Department of Environmental Protection.
To our knowledge, the OEPA did not enforce this procedure, instead relying on workers to manually calculate and report spills. Shell’s failure to accurately self-report raises concerns about the safety of the Falcon’s HDD crossings in Ohio, including the crossing beneath the Ohio River, just upstream of drinking water intakes for Toronto and Steubenville, Ohio.
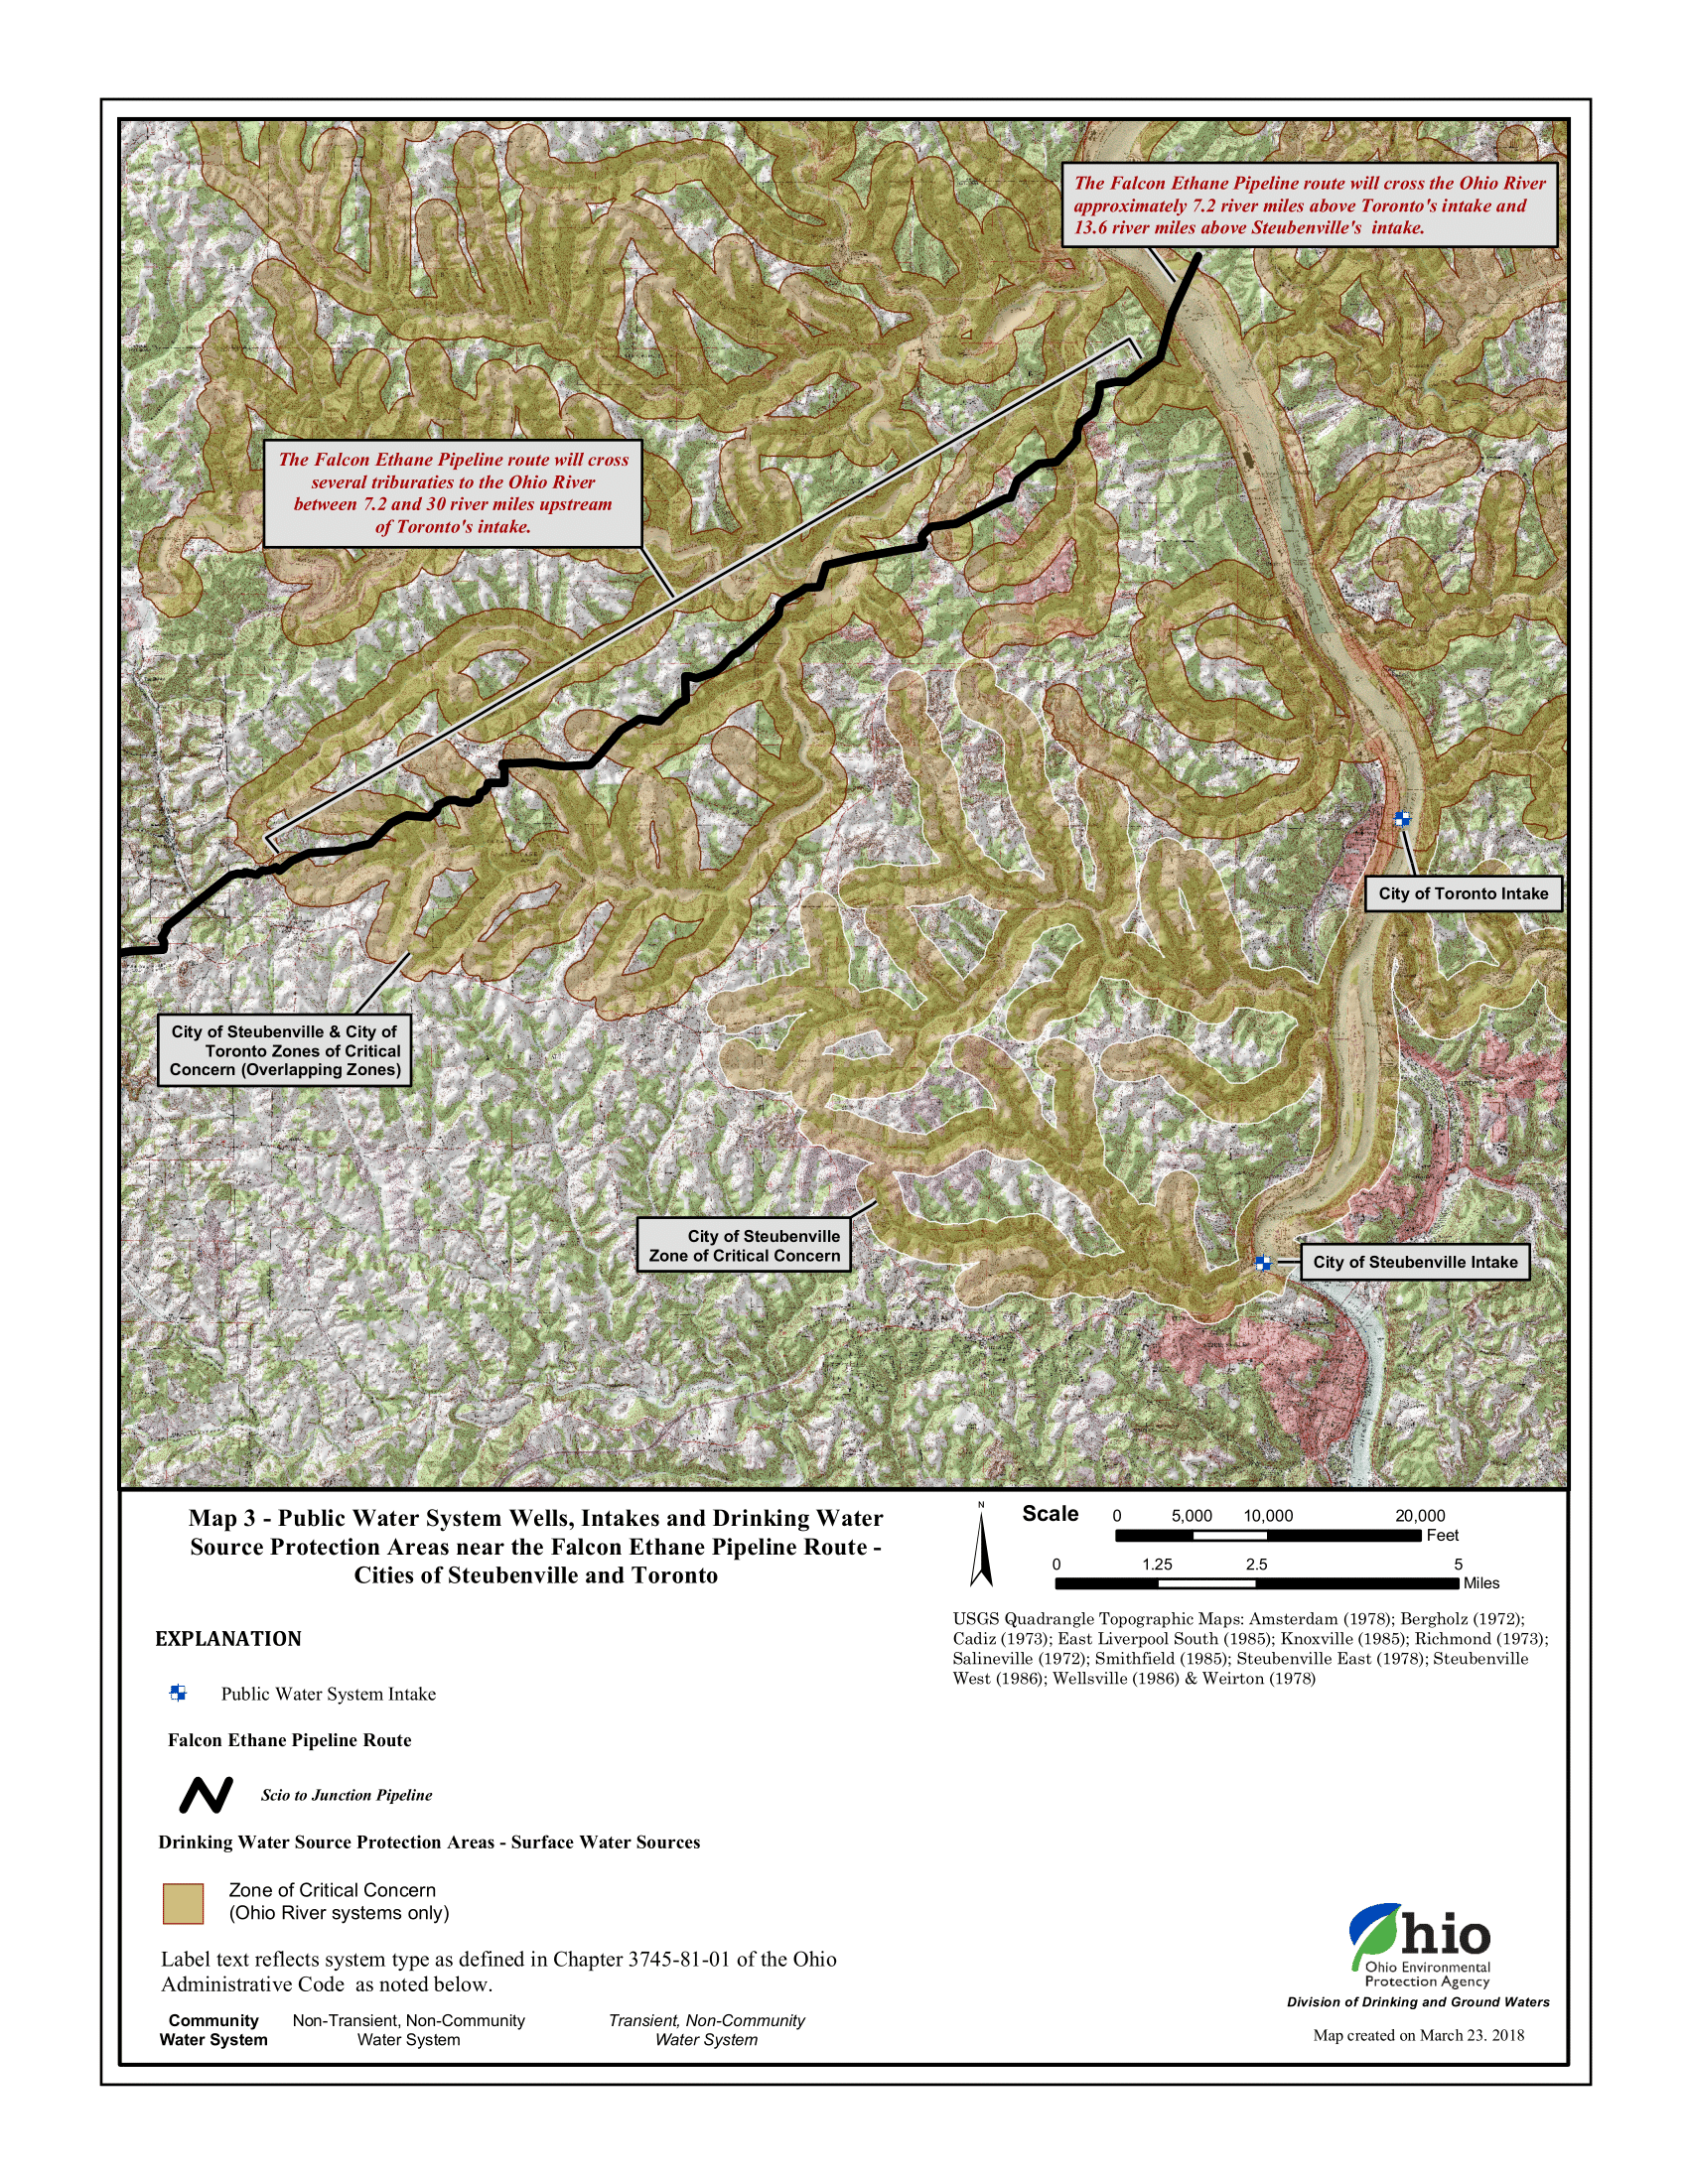
Public water system wells, intakes, and Drinking Water Source Protection Areas nears the Falcon Pipeline Route. Note, the pipeline route may have slightly changed since this map was produced. Source: Ohio EPA
The Falcon is connected to one of Shell’s most high-profile projects: a $6 billion to $10 billion plastic manufacturing plant, commonly referred to as the Shell ethane cracker, in Beaver County, Pennsylvania. These massive projects represent the oil and gas industry’s far-fetched dream of a new age of manufacturing in the region that would revolve around converting fracked gas into plastic, much of which would be exported overseas.
Many in the Ohio River Valley have raised serious concerns over the public health implications of a petrochemical buildout. The United States’ current petrochemical hub is in the Gulf Coast, including a stretch of Louisiana known colloquially as “Cancer Alley” because of the high risk of cancer from industrial pollution.
Construction of the ethane cracker and the Falcon pipeline have forged forward during the COVID-19 pandemic. In another example of the culture of fear at the worksite, several workers expressed concern that speaking publicly about unsafe working conditions that made social distancing impossible would cost them their jobs. Yet the state has allowed work to continue on at the plant, going so far as to grant Shell the approval to continue work without the waiver most businesses had to obtain. As of December 2020, over 274 Shell workers had contracted the coronavirus.
While the oil and gas industry had initially planned several ethane crackers for the region, all companies except for Shell have pulled out or put their plans on hold, likely due to the industry’s weak financial outlook.
A June 2020 report by the Institute for Energy Economics and Financial Analysis (IEEFA), stated that:
Royal Dutch Shell owes a more complete explanation to shareholders and the people of Pennsylvania of how it is managing risk. Shell remains optimistic regarding the prospects for its Pennsylvania Petrochemical Complex in Beaver County, Penn. The complex, which is expected to open in 2021 or 2022, is part of a larger planned buildout of plastics capacity in the Ohio River Valley and the U.S. IEEFA concludes that the current risk profile indicates the complex will open to market conditions that are more challenging than when the project was planned. The complex is likely to be less profitable than expected and face an extended period of financial distress.
Many of Pennsylvania’s elected officials have gone to great lengths to support this project. The Corbett administration enticed Shell to build this plastic factory in Pennsylvania by offering Shell a tax break for each barrel of fracked gas it buys from companies in the state and converts to plastic (valued at $66 million each year). The state declared the construction site a Keystone Opportunity Zone, giving Shell a 15-year exemption from state and local taxes. In exchange, Shell had to provide at least 2,500 temporary construction jobs and invest $1 billion in the state, giving the company an incredible amount of power to decide where resources are allocated in Pennsylvania.
Would the state have asked Shell for more than 2,500 construction jobs if it knew these jobs could be taken away when workers spoke out against life-threatening conditions? Will the politicians who have hailed oil and gas as the only job creator in the region care when workers are forced to hide their identity when communicating with public agencies?
The PA DEP appears to have played a key role in calling for this investigation, yet the agency itself was recently at the center of a different investigation led by Pennsylvania Attorney General Josh Shapiro. The resulting Investigating Grand Jury Report revealed systematic failure by the PA DEP and the state’s Department of Health to regulate the unconventional oil and gas industry. One of the failures was that the Department seldom referred environmental crimes to the Attorney General’s Office, which must occur before the Office has the authority to prosecute.
The Office of Attorney General is involved in this investigation, which the PA DEP is referring to as noncriminal.
The Grand Jury Report also cited concerns about “the revolving door” that shuffled PA DEP employees into higher-paying jobs in the oil and gas industry. The report cited examples of PA DEP employees skirting regulations to perform special favors for companies they wished to be hired by. The watchdog research organization Little Sis listed 47 fracking regulators in Pennsylvania that have moved back and forth between the energy industry, including Shell’s Government Relations Advisor, John Hines.
The Falcon Pipeline sits empty as people across the nation are amping up pressure on President Biden to pursue bold action in pursuit of environmental justice and a just transition to clean energy. Following Biden’s cancellation of the Keystone XL pipeline, Indigenous leaders are calling for him to shut down other projects including Enbridge Line 3 and the Dakota Access Pipeline.
Over a hundred groups representing millions of people have signed on to the Build Back Fossil Free campaign, imploring Biden to create new jobs through climate mobilization. Americans are also pushing Biden to be a Plastic Free President and take immediate action to address plastic pollution by suspending and denying permits for new projects like the Shell ethane cracker that convert fracked gas into plastic.
If brought online, the Falcon pipeline and Shell ethane cracker will lock in decades of more fracking, greenhouse gasses, dangerous pollution, and single-use plastic production.
Just as concerning, Shell will need to tighten its parasitic grip on the state’s economic and legislative landscape to keep this plant running. Current economic and political conditions are not favorable for the Shell ethane cracker: financial analysts report that its profits will be significantly less than originally presented. If the plant is brought online, Shell’s lobbyists and public relations firms will be using every tactic to create conditions that support Shell’s bottom line, not the well-being of residents in the Ohio River Valley. Politicians will be encouraged to pass more preemptive laws to block bans on plastic bags and straws to keep up demand for the ethane cracker’s product. Lobbyists will continue pushing for legislation that imposes harsh fines and felony charges on people who protest oil and gas infrastructure, while oil and gas companies continue to fund police foundations. Shell will ensure that Pennsylvania keeps extracting fossil fuels to feed its ethane cracker.
The Falcon pipeline is at odds with global demands to address plastic and climate crises. As these new documents reveal, it also poses immediate threats to residents along its route. While we’re eager for more information from state and federal agencies to understand the details of this investigation, it’s clear that there is no safe way forward with the Falcon Pipeline.
Royal Dutch Shell has been exerting control over people through the extraction of their natural resources ever since it began drilling for oil in Dutch and British colonies in the 19th Century. What will it take to end its reign?
Health & Safety | Legislation & Politics | Petrochemicals & Plastics | Pipelines
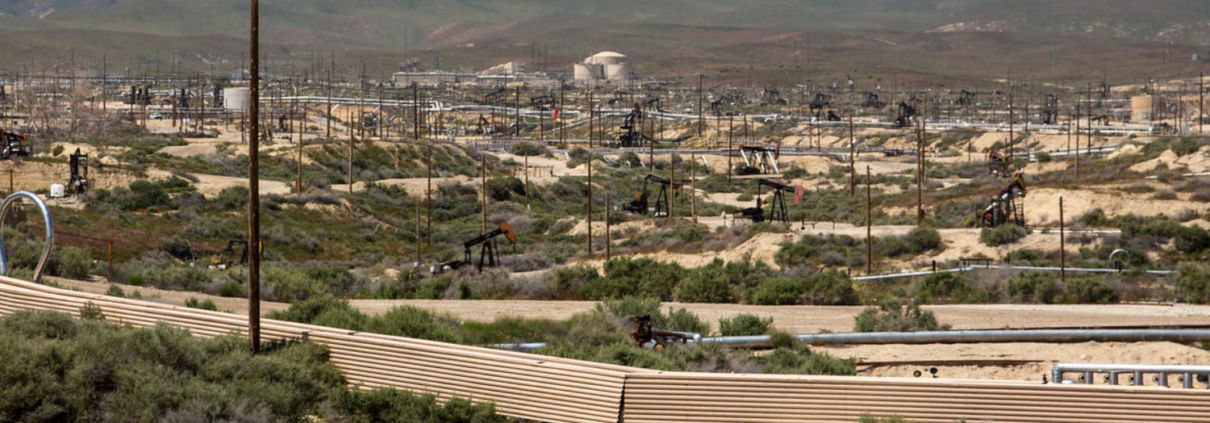
This article focuses on the city of Arvin as an example to show how some Frontline Communities in California are completely surrounded by an unrelenting barrage of carcinogenic and toxic air pollutants from oil and gas wells. Kern County’s proposed environmental impact report (EIR) would streamline the approval of an additional 67,000 new oil and gas wells in the County and thus further degrade air quality. We provide several recommendations for how local and state decision-makers can better protect public health from these serious threats.
Upstream greenhouse-gas and volatile organic compound (VOC) emissions from oil and gas extraction have been drastically under-reported throughout the United States, and California’s emissions regulations for oil and gas production wells are not comprehensive enough to protect Frontline Communities. The contribution of VOCs from the oil and gas extraction sector is responsible for California’s central valley and Kern County communities being exposed to the worst air quality in the country. As carcinogens, air toxics, and precursors to ozone, VOC’s present a myriad of health threats.
The contribution of VOCs from the well-sites in Kern, in addition to the cumulative burden of the Central Valley’s degraded air quality, puts Kern residents at considerable risk. Obvious loopholes in the California Air Resources Board’s oil and gas rule must be addressed immediately, and revised to prevent the cumulative impact of multiple exposure sources from causing additional documented negative health impacts. Additionally Kern County’s proposed environmental impact report (EIR) would streamline the approval of an additional 67,000 new oil and gas wells in the County and thus further degrade air quality. It is crucial that the EIR is instead revised to eliminate extraction near sensitive populations. (For more details on this proposal, see our more in depth environmental justice analysis of Kern County and our article on the proposed EIR.)
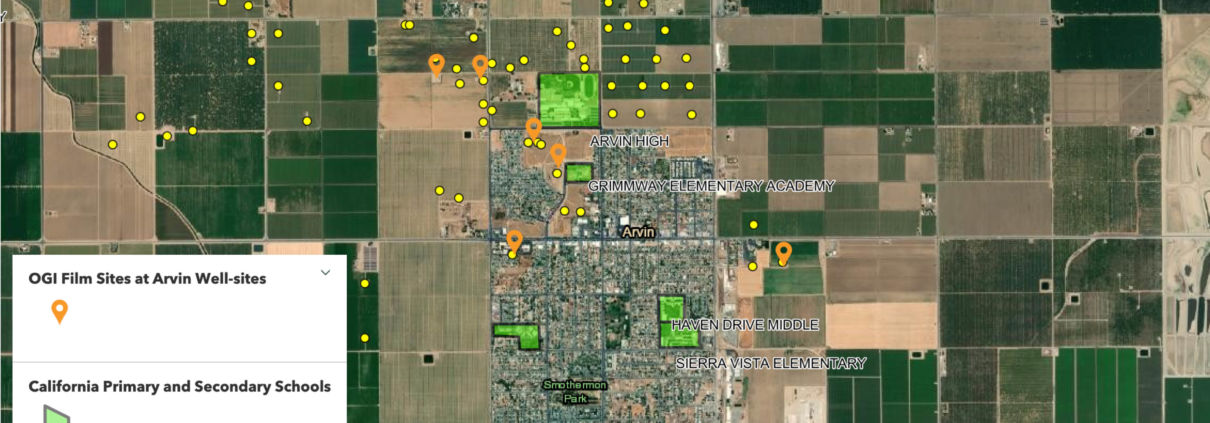
In support of establishing new public health rules that protect Frontline Communities, Earthwork’s Community Empowerment Project, in collaboration with the Central California Environmental Justice Network and FracTracker Alliance, has focused on documenting the uncontrolled emissions from extraction sites within and surrounding the small city of Arvin, California. Using infrared cameras with state of the art optical gas imaging (OGI) technology, the team documented major leaks at multiple well-sites. Footage from Arvin spans the years from 2016-2020. A collection of this footage has been compiled into the interactive story map that follows.
This StoryMap explores how current California regulations fail to stop emissions from tanks on oil and gas well-sites by looking at examples of emissions from well-sites in Arvin, California. Place your cursor over the image and scroll down to advance the StoryMap and explore a series of maps charting the fracking-for-plastic system. Click on the icon in the bottom left to view the legend.
View Full Sized Map | Updated 3/4/21
The cases of uncontrolled emissions in the story map provides just an example of the inventory of uncontrolled emissions sources in Kern County, and California at large. Finding and filming emissions sources while using OGI cameras in California is not at all uncommon, otherwise there would not be seven prime examples just in the City of Arvin. Prior to 2018, emissions from these well-sites went completely unregulated. While the California oil and gas rule (COGR) was developed to address greenhouse gas emissions from small sources, certain aspects of the rule are not being enforced by the local air districts. Rather than requiring tanks to have closed evaporation systems the air districts allow operators to set pressure/vacuum hatches to open and emit toxic and carcinogenic vapors when pressure builds inside tanks. While this is a safety mechanism on tanks, in practice it allows tanks to be consistent sources of exposure that put neighboring communities at risk. Specifically, California Code of Regulations, Title 17, Division 3, Chapter 1, Subchapter 10 Climate Change, Article 4, § 95669, Leak Detection and Repair, Paragraph I states that “Hatches shall remain closed at all times except during sampling, adding process material, or attended maintenance operations.”
New research from Harvard, Berkeley and Stanford has shown that living near oil and gas drilling and extraction exposes Frontline Communities to emissions of VOC’s and ozone that put them at risk for a variety of health impacts. Researchers at Stanford have linked proximity and density of oil and gas wells to preterm birth for pregnant mothers (Gonzalez et al. 2020), even at large distances. Similar research from UC Berkeley showed mothers living near oil and gas drilling and extraction are also at risk of birthing infants with low birth weight (Tran et al. 2020). The study found pregnant people who lived within 0.62 miles (1 kilometer) of the highest producing wells were 40% more likely to have low birth weight babies and 20% more likely to have babies who were small for their gestational age compared to people living farther away from wells or near inactive wells only. Most recently, new research from Harvard University shows that even very low ambient levels of ozone, particulate matter (PM2.5), and nitrogen dioxide increased hospitalizations for cardiac and respiratory conditions (Wang et al. 2021). These are the primary and secondary pollutants emitted from oil and gas extraction sites and also result from burning fossil fuels. The magnitude of the impact on public health is also much larger than previously considered. Another article recently published by researchers at Harvard shows that fossil fuel air pollution is responsible for 18% of total deaths, worldwide (Vohra, et al. 2021).
While the COGR rule is a step in the right direction to reduce emissions, oil and gas’s legacy of degradation to ambient air quality has placed the Central Valley in the worst categories for these pollutants in the country. This puts Kern residents at considerable risk. The local health department continues to report improved conditions and increased numbers of healthy air days, but the truth is the mean, median and maximum values of ozone concentrations at US EPA monitoring locations in Kern County have remained relatively constant at harmful levels from 2015-2019. Expanding the data to 2020 shows a two sharp decreases in ambient levels of pollutants that correspond to decreases in reported production volumes for the county. The first decrease in 2016 corresponds to a drop in production following the institution of State Bill requirements for fracking permits. The decrease in 2020 is a result of the slowed production and burning of fossil fuels related to the Covid-19 Pandemic, as shown below in Figure 1.
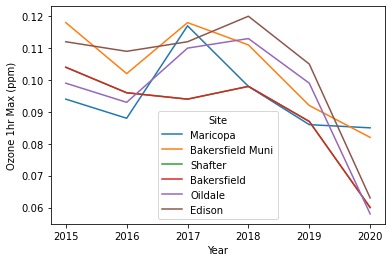
Figure 1. Plot of annual Maximum 1 hour Ozone concentrations at all monitoring locations in western Kern County. Ozone concentrations are presented in parts per million. Annual trends in ambient concentrations of ozone. Note the decrease in concentrations in 2016 and in 2020. Both events correlate to decreases in production.
Using the U.S. EPA’s AirData mapping portal, air quality data for Kern County was exported, compiled and plotted to show trends over time. Above in Figure 1, annual ambient concentrations of ozone are shown. The trends of ambient concentrations follow similar trends in the spatial and temporal distribution of CalGEM reported production volumes. FracTracker Alliance is conducting more thorough analyses of these correlations, so stay tuned for future reports.
The locations of these monitoring locations are shown below in the map in Figure 2. Note that there are not any monitors in northwestern Kern, near large oil fields including North Belridge and Lost Hills. The communities near these fields, such as the City of Lost Hills are predominantly Latinx with elevated levels of linguistic isolation and poverty.
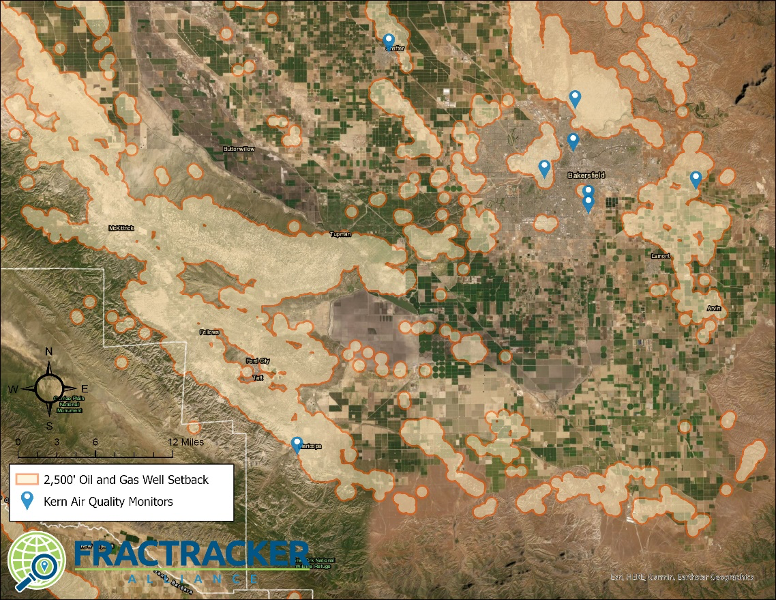
Figure 2. Map of Air Quality Monitors in Kern County.
Permitting new oil and gas wells in Kern County is certain to degrade the already harmful local and regional ambient air quality of the Central Valley. Kern County’s proposed EIR, as it stands will streamline an additional 67,000 sources of VOCs to the inventory of emissions already impacting communities. The health impacts from concentrations of ozone are well established, and the release of VOCs are major risk driver for communities living closest to oil and gas extraction operations as well as for regional public health. Together, these primary and secondary pollutants create a major risk driver for Kern County communities. Globally, these emissions are responsible for upwards of 8 million premature deaths annually. The burden on Frontline Communities in Kern County is likely much higher, and will only grow if the currently drafted EIR is passed. Additional air quality monitoring stations in northwestern Kern County should be installed immediately to help track air quality impacts.
To reduce this harm to Frontline Communities, California Senator Scott Weiner has submitted a new senate bill. Senate Bill 467 would stop the issuance of hydraulic fracturing permits and create a public health setback distance of 2,500 feet from homes, schools and other health care facilities for all new drilling permits. The bill would also create a program to provide new training and job opportunities for workers who would be negatively impacted by the bill. Senate Bill 467 provides the first step for a green transition away from the health impacts resulting from fossil fuel industries.
Built on sound data and ample research, FracTracker recommends the following measures be taken to protect the health of California’s overburdened Frontline Communities: Kern County should revise its environmental impact report to address the onslaught of harmful oil and gas emissions (EIR), California Air Resources Board’s oil and gas rule should close its loophole allowing emissions from the pressure/vacuum hatch on the tank to be exempt from regulation, and legislators should educate themselves on the importance of 2,500 foot setbacks requirements for oil and gas wells.
FracTracker’s public comments regarding recommendations to modify the Kern County Draft Environmental Impact Report (EIR): https://www.fractracker.org/a5ej20sjfwe/wp-content/uploads/2021/03/Kern.EIR_.comments_FracTrackerAlliance_3.8.21_compressed.pdf
FracTracker California articles, maps, and imagery: https://www.fractracker.org/map/us/california/
Earthwork’s Community Empowerment Project: https://www.youtube.com/playlist?list=PL9BS7nDf-8tqlaUT8pc0Yr0Tpfl0UFDMK
Newsom Well Watch, a collaboration between FracTracker and Consumer Watchdog: https://newsomwellwatch.com/
Infrastructure | Health & Safety | Legislation & Politics | Social

Kyle Ferrar, Western Program Coordinator for FracTracker Alliance, contributed to the December 2020 memo, “Recommendations to CalGEM for Assessing the Economic Value of Social Benefits from a 2,500’ Buffer Zone Between Oil & Gas Extraction Activities and Nearby Communities.”
Below is the introduction, and you can find the full memo here.
The purpose of this memo is to recommend guidelines to CalGEM for evaluating the economic value of the social benefits and costs to people and the environment in requiring a 2,500 foot setback for oil and gas drilling (OGD) activities. The 2,500’ setback distance should be considered a minimum required setback. The extensive technical literature, which we reference below, analyzes health benefits to populations when they live much farther away than 2,500’, such as 1km to 5km, but 2,500’ is a minimal setback in much of the literature. Economic analyses of the benefits and costs of setbacks should follow the technical literature and consider setbacks beyond 2,500’ also.
The social benefits and costs derive primarily from reducing the negative impacts of OGD pollution of soil, water, and air on the well-being of nearby communities. The impacts include a long list of health conditions that are known to result from hazardous exposures in the vulnerable populations living nearby. The benefits and costs to the OGD industry of implementing a setback are more limited under the assumption that the proposed setback will not impact total production of oil and gas.
The comment letter submitted by Voices in Solidarity against Oil in Neighborhoods (VISIÓN) on November 30, 2020 lays out an inclusive approach to assessing the health and safety consequences to the communities living near oil and gas extraction activities. This memo addresses how CalGEM might analyze the economic value of the net social benefits from reducing the pollution suffered by nearby communities. In doing so, this memo provides detailed recommendations on one part of the broader holistic evaluation that CalGEM must use in deciding the setback rule.
This memo consists of two parts. The first part documents factors that CalGEM should take into account when evaluating the economic benefits and costs of the forthcoming proposed rule. These include factors like the adverse health impacts of pollution from OGD, the hazards causing them and their sources, and the way they manifest into social and economic costs. It also describes populations that are particularly vulnerable to pollution and its effects as well as geographic factors that impact outcomes.
The second part of this memo documents the direct and indirect economic benefits of the proposed rule. Here, the memo discusses the methods and data that should be leveraged to analyze economic benefits of reducing exposure to OGD pollution through setbacks. This includes the health benefits, impacts on worker productivity, opportunity costs of OGD activity within the proposed setback, and the fact that impacted communities are paying the external costs of OGD.
Please find the full memo here.
![]()
216 Franklin St, Suite 400, Johnstown, PA 15901
Phone: +1 (717) 303-0403 | info@fractracker.org
FracTracker Alliance is a 501(c)3 non-profit: Tax identification number: 80-0844297
 EPA
EPA